The Changing-Look Quasar Mrk 590 is Awakening
Abstract
Mrk 590 was originally classified as a Seyfert 1 galaxy, but then it underwent dramatic changes: the nuclear luminosity dropped by over two orders of magnitude and the broad emission lines all but disappeared from the optical spectrum. Here we present followup observations to the original discovery and characterization of this “changing look” active galactic nucleus (AGN). The new Chandra and HST observations from 2014 show that Mrk 590 is awakening, changing its appearance again. While the source continues to be in a low state, its soft excess has re-emerged, though not to the previous level. The UV continuum is brighter by more than a factor of two and the broad Mg ii emission line is present, indicating that the ionizing continuum is also brightening. These observations suggest that the soft excess is not due to reprocessed hard X-ray emission. Instead, it is connected to the UV continuum through warm Comptonization. Variability of the Fe K- emission lines suggests that the reprocessing region is within light years or pc of the central source. The AGN type change is neither due to obscuration, nor due to one-way evolution from type-1 to type-2, as suggested in literature, but may be related to episodic accretion events.
1 INTRODUCTION
Active galactic nuclei (AGNs) are characterized by continuum emission across the electromagnetic spectrum and strong emission lines in the UV, optical and NIR. AGNs with both broad and narrow emission lines are classified as “Type 1” and those with only narrow emission lines are “Type 2”, and this difference is usually attributed to our viewing angle relative to an obscuring midplane. AGNs are also known to be variable sources, showing continuum as well as emission line variability. The continuum variability is observed on both short and long time scales, but the variability amplitude is usually small, of the order of % over a year for low luminosity AGNs (i.e. with Seyfert-like luminosity of about to erg s-1). The emission line variations usually track the continuum variations, but see Goad et al. (2016).
A special class of AGN that has recently been gaining recognition has been termed “changing-look quasars”111We make no distinction among the terms quasar, AGN, and Seyfert galaxy — all are objects that contain a central BH that is actively accreting sufficient matter to shine as a point source and that, to first order, produce the same emission characteristics.. Their broad emission lines are observed to appear or disappear together with large changes in continuum luminosity. The changes in the emission line spectra are such that they change type, e.g. from “type 1” to “type 2”, and this is clearly an intrinsic change, implying “type” is not always associated with viewing angle. This phenomenon has become of recent interest due to a combination of several serendipitous discoveries of changing-look AGNs (e.g. Shappee et al. 2014, Denney et al. 2014, Lamassa et al. 2015) and the growing availability of large spectroscopic quasar databases with long time-baselines of multi-epoch photometry and spectroscopy. These rare occurrences have the potential to contribute to our limited understanding of the central engines of active galaxies. Systematic searches of databases such as the SDSS/BOSS/TDSS have begun to uncover more changing look quasars at larger redshifts and led to predictions of the possible occurrence rates for quasars to change type (Runnoe et al. 2016, MacLeod et al. 2016).
Changing-look quasars are of particular interest for their potential to shed light on the physical origin of quasar variability and the details of accretion, since they have undergone such an extreme apparent change. Additionally, what is the role these objects play in the black hole (BH) accretion history — are we observing the beginning/end of a quasar phase? What role do these objects play in the larger context of galaxy and BH co-evolution? Recent investigations of changing-look quasars have tried to use the observations before and after the change and any additional data available on the few known sources to test whether or not the changes are due to changes in accretion rate or obscuration, and to determine if the quasar is turning on for the first time, reviving after a period of quiescence, or something else. In all cases so far, obscuration has not been identified as the major cause of changing look. Instead, a significant increase (decrease) in the mass accretion rate is the most favored explanation for the appearance (disappearance) of the broad emission lines.
The nearby, low-luminosity AGN Markarian 590 (Mrk 590 here onwards) remains an interesting case of a changing-look quasar in the local universe. Denney et al. (2014; D14 hereafter) have described the initial set of observations that catalog this object’s observed history and “change”, where it went from being a strong broad-line emitter three decades ago, allowing a reverberation mapping-based direct BH mass measurements to be made (, Peterson et al. 2004) to being broad-line weak — the optical broad lines all but disappeared — in the past decade. Mrk 590 also shows the presence of ultra-fast outflows in the X-ray band (Gupta, Mathur & Krongold 2015). We have obtained additional UV and X-ray spectra since those presented by D14 that we describe in sections 2 and 3. Implications of our results are discussed in section 4 and we show that the “soft X-ray excess”, observed in a large fraction of AGNs, is not due to the reprocessing of hard X-ray continuum, but is instead a result of thermal Comptonization of UV photons. We also argue that the changing look phenomenon is a normal event in the duty cycle of “normal” quasars.
2 Chandra Spectroscopy
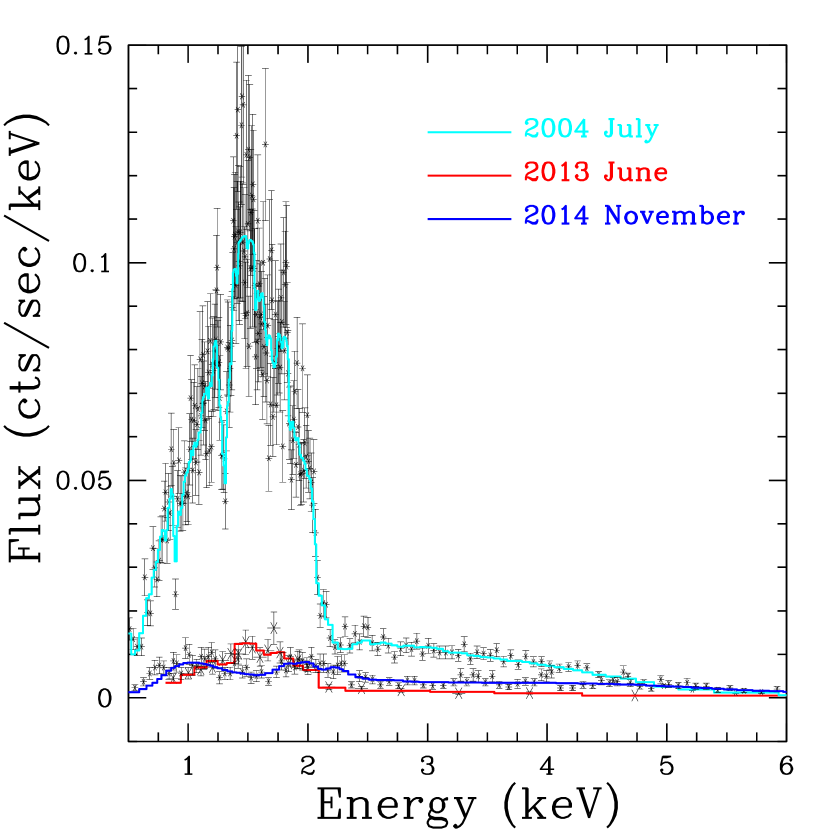
Mrk 590 was observed by Chandra for ks on 2014 November 15 (ObsID 16109). This is longer than the ks initial DDT observation presented by D14, but the observing parameters were otherwise kept the same. We observed with ACIS-S/HETG; the grating was inserted in front of the detector in order to mitigate pile-up, if any. The data were reduced with CIAO following the normal procedure and analyzed using XSPEC. A Galactic column density of N cm-2 was included in all fits and was held fixed. All the quoted errors are for % confidence, unless noted otherwise. Figure 1 shows the new, 2014 spectrum, together with the 2013 spectrum presented by D14, and the previous “high state” spectrum observed in 2004. The source continues to be in a low state in 2014, so the quality of the high resolution grating spectrum is too poor to perform useful science. Hence we present the zeroth order spectrum here, as was done by D14.
A simple absorbed power-law model did not provide a good fit to the 2014 Chandra spectrum. The residuals to this fit are shown in Fig. 2, which clearly show a soft-excess, so we added a black-body component to the model. Clear residuals were also observed around 6 keV, so following Longinotti et al. (2007) we added two Gaussian emission lines at rest-frame 6.4 keV and 6.7 keV representing neutral and ionized Fe K emission lines, respectively. The resulting fit was good ( for 104 degrees of freedom) and the parameters of the fit are presented in Table 1 and the spectra are shown in figures 3 and 4. Longinotti et al. (2007) required a third emission line at 7 keV; our data are not good enough at this energy range to require this line. They also detected a line in the soft X-ray band, at Å (0.65 keV), but we see no evidence of that line.
The – keV flux of the source is erg s-1 cm-2 ( erg s-1 cm-2 in – keV and erg s-1 cm-2 in – keV). This is significantly smaller than the 2002 flux ( erg s-1 cm-2) reported by Gallo et al. (2006), the 2004 flux ( erg s-1 cm-2) reported by Longinotti et al. (2007), and the Suzaku flux of erg s-1 cm-2 in – keV reported by Rivers et al. (2012). D14 reported the low state of Mrk 590 with – flux of erg s-1 cm-2, so compared to our DDT Chandra observation in 2013, the source flux appears to have increased slightly, but as shown in Fig. 1, the source continues to be in a low state. The flux in the soft excess component is erg s-1 cm-2 in the – keV band (though it is concentrated below 2 keV), which is of the total. If we restrict to the – keV soft band, then the total flux is erg s-1 cm-2 while the soft excess flux remains the same as above, making it of the total soft-band flux.
3 HST/COS NUV Spectroscopy
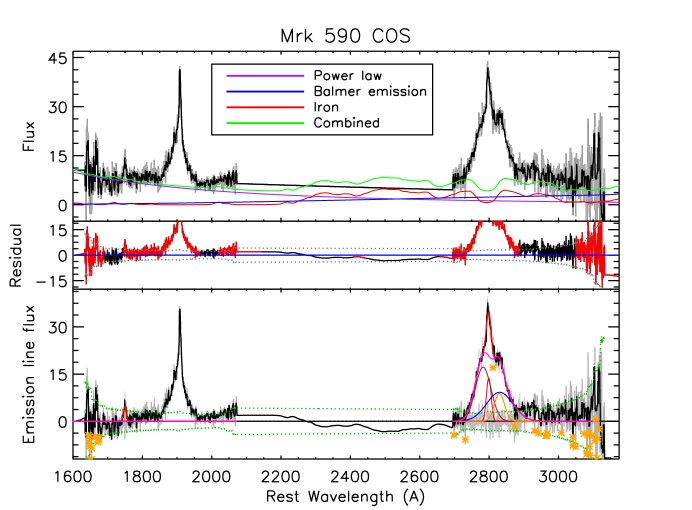
We obtained observations with the Cosmic Origins Spectrograph on-board HST that were coordinated with our approved Chandra program. The goal of the COS observations was to observe the portion of the UV spectrum not covered by the initial COS G140L DDT observations presented by D14. The new observations were obtained on 2014 November 15 with the G230L grating and covered the observed frame wavelength ranges 16702175 Å and 27653215 Å. Importantly, this coverage was selected to allow a continuum overlap region with the 2013 G140L spectrum and also to cover the Mg ii doublet in this redshift object. The G230L spectrum was processed with the standard COS pipelines. Figure 5 shows the G230L COS spectrum, that was modeled with a power-law continuum, a Balmer continuum, and an Fe ii template (Vestergaard & Wilkes 2001) as a means to isolate the Mg ii emission, with both a narrow-line component and a broad-line component. The width and velocity shift of the narrow-line components of Mg ii and Å were tied, allowing only the strength to differ. We also corrected the spectrum for foreground reddening, assuming mag determined from the dust maps of Schlegel, Finkbeiner & Davis (1998), and the extinction curve of O’Donnell et al. (1994). As can be seen in the figure, the Mg ii emission line clearly shows a broad component. We measured the FWHM km s-1and the line dispersion km s-1 for the broad component from the emission line models.
4 Discussion
4.1 Soft excess and the Fe lines
Over the years, X-ray observations of Mrk 590 have shown that its spectrum is well fit by a power-law continuum, a soft-excess, a hard reflection component and Fe emission lines (§1). Rivers et al (2012), using Suzaku data, first noticed that while the hard X-ray continuum of the source remained practically the same as in the historic data, its soft-excess had disappeared in 2011. In the 2013 Chandra spectrum of D14, there was no evidence of a soft excess either, and the source was in a historically low state. Our new Chandra observations show that Mrk 590 continues to be in a low state, but a soft excess has re-emerged. The soft-excess temperature ( keV) is lower than keV seen in the 2007 XMM-Newton spectrum reported by Longinotti et al. (2007) and Rivers et al. (2012). The soft-excess luminosity of erg s-1 cm-2 is also an order of magnitude lower than the 2007 value of erg s-1 cm-2, but higher than the upper limit derived from the 2011 Suzaku spectra of erg s-1 cm-2 (Rivers et al. 2012). Thus the soft-excess seems to have returned, but not to the “normal” level seen in the historical high state.
In Mathur et al. 2017 (and references therein) we discussed various models of the soft excess, which we briefly discuss here. The main contenders are (1) reflection of the hard X-ray source by the accretion disk (e.g., Crummy et al. 2006); (2) a warm Comptonizing medium around the accretion disk (e.g., Ross, Fabian, & Mineshige 1992; Titarchuk 1994); or (3) thermal emission from an accretion disk. Thermal emission from an accretion disk may appear in the soft X-ray band only for relatively low-mass black holes. The re-emergence of the soft excess in the low state, when the the hard X-ray emission was weak, suggests that the soft excess is not due to reprocessed hard X-ray emission. An alternative model, in which the soft excess is generated by thermal Comptonization in the optically thick accretion disk corona, is a more likely explanation.
Using a series of observations of Mrk 509, Mehdipour et al (2011) found that the soft excess is correlated with the UV flux as , where is the the 0.3–2 keV soft-excess luminosity in units of erg s-1 and is the flux in the UVW2 filter in UVOT on Swift and OM on XMM-Newton, centered at 2030Å, in units of erg s-1 cm-2. In our new observations, the soft excess luminosity of Mrk 590 in the 0.3–2 keV band is erg s-1 and the continuum flux at 2030Å is erg s-1 cm-2. The observed soft excess luminosity is two orders of magnitude larger that that predicted by the Mehdipour relation (correcting the UV flux for the distance of NGC 5548) and shows that the Mehdipour relation between the soft excess and the UV flux is not universal.
Compared to the values in 2004 reported by Longinotti et al (2007), the Fe emission lines have smaller equivalent widths and smaller fluxes. This shows that both the neutral and the ionized lines have responded to the continuum changes between 2004 and 2014. This places the reprocessing material within 10 light-years or 3 pc of the continuum source, and not from the kiloparsec-scale extended emission region as suggested by Longinotti et al (2007) for the ionized line.
4.2 The Mg ii emission line
Our HST spectrum clearly shows a broad Mg ii emission line. Since we do not have a UV spectrum covering the Mg ii line in the low state when the H line had vanished, the presence of the Mg ii line in the current spectrum can be interpreted in a couple of different ways.
Photoionization models and evidence from reverberation mapping of the ionization stratification of the BLR support the co-spatial existence of H and Mg ii emitting gas. Thus it is possible that when the broad H emission line disappeared, the broad Mg ii line had also disappeared, and now that a broad Mg ii line has emerged, possibly a broad H has also emerged. We should note, however, that the response of a line to continuum variations depends not only on the geometry and location of line emitting region, but also on line responsivity. Cackett et al. (2015) have shown that the Mg ii emission line has very low responsivity compared to other high-ionization emission lines (see also Korista & Goad 2000). It is thus possible that the broad Mg ii line had never disappeared. If this is the case, then we cannot comment on the presence of a broad H line in 2014. Roig et al. (2014) found a class of AGNs in the Baryon Oscillation Spectroscopic Survey showing a broad Mg ii without a broad H. Wavelength-dependent scattering of the broad-line region is offered as an explanation by these authors as to why the broad Balmer lines could be missing but the broad Mg ii lines are strong. Our results on Mrk 590 suggest that such AGNs may be in a transition state when H disappeared, but Mg ii did not, owing to its low responsivity.
The connection between the soft excess and the emission lines is of interest. In the warm Comptonization model, the seed UV/EUV photons are Compton up-scattered into soft X-rays in the optically thick accretion disk corona. Observationally, the soft-excess has been found to correlate with UV emission (e.g., Atlee & Mathur 2009). Thus the emergence of soft excess in Mrk 590 implies a corresponding emergence of the EUV ionizing continuum. This in turn may be responsible for the re-appearance of the broad-line region, which we see with Mg ii. This is our preferred model. D14 found the continuum flux at 1450Å to be erg s-1 cm-2Å-1 which was two orders of magnitude lower than the IUE value (D14). The 1634Å flux in our new HST data is erg s-1 cm-2Å-1, which extrapolated to 1460Å is erg s-1 cm-2Å-1. Thus, while the source continues to be in a low state, the UV continuum is re-emerging along with the soft-excess. While the presence of the broad Mg ii line can be interpreted in different ways, as noted above, it is consistent with the increasing luminosity of the ionizing continuum.
5 Conclusion
D14 presented optical, UV, and X-ray observations of the classical Seyfert 1 Mrk 590 that span the past 40+ years. This interesting object brightened by a factor of a few tens between the 1970s and 1990s and then faded by a factor of a 100 or more at all continuum wavelengths between the mid-1990s and 2013. Notably, there is no evidence in the current data set that this recent, significant decline in flux is due to obscuration; in particular, the most recent X-ray observations are consistent with zero intrinsic absorption. There were similarly dramatic changes in the emission-line fluxes, the most striking of which is the complete disappearance of the broad component of the H emission line, which had previously been strong (equivalent widths 2060 Å).
In this paper we have presented new Chandra and HST observations from 2014 and we find that Mrk 590 is awakening. While the source continues to be in a low state, its soft excess has re-emerged, though not to the historical level. The broad Mg ii emission line is also present. These observations suggest that the soft excess is connected to the UV continuum through warm Comptonization and that the ionizing continuum is also on the rise, but it does not follow the relation between soft excess and UV continuum reported in Mehdipour et al. (2011).
The implications from this long time series of Mrk 590 observations are that (1) Mrk 590 is a direct challenge to the historical paradigm that AGN type is exclusively a geometrical effect, and (2) there may not be a strict, one-way evolution from Type 1 to Type 1.51.9 to Type 2 as recently suggested by Elitzur, Ho, & Trump (2014). Instead, for at least some objects, the presence of BLR emission may coincide with episodic accretion events throughout a single active phase of an AGN. If true, such behavior may be more prominent in Seyfert galaxies, where accretion is likely to be a consequence of secular processes (e.g., Mathur et al. 2012; Martin et al. 2018) and therefore likely more episodic than quasar activity, which may be governed more predominantly by major mergers.
References
- (1) Aranzana, E., Kording, E., Uttley, P., Scaringi, S. & Bloemen, S. 2018, MNRAS, 476, 2501
- Arnaud et al. (1985) Arnaud, K. et al. 1985, MNRAS, 217, 105
- Atlee & Mathur (2009) Atlee, D. & Mathur, S. 2009, ApJ, 703, 1597
- Bianchi et al. (2009) Bianchi et al. 2009, A&A, 495, 421
- (5) Cackett, E.M., Gultekin, M., Bentz, M. et al. 2015, ApJ, 810, 86
- Crummy et al. (2006) Crummy, J., Fabian, A. C., Gallo, L., & Ross, R. R. 2006, MNRAS, 365, 1067
- Denney et al. (2014) Denney, K., De Rosa, G., Croxall, K. et al. 2014, ApJ, 796, 134
- Edelson et al. (2015) Edelson, R. et al. 2015, ApJ, 806, 129. (Paper II)
- (9) Elitzur, M., Ho, L., & Trump. J., 2014, MNRAS, 438, 3340
- Gallo et al. (2006) Gallo, L., Lehmann, I., Pietsch, W. et al. 2006, MNRAS, 365, 688
- (11) Gupta. A., Mathur, S. & Krongold, Y. 2015, ApJ, 798, 4
- (12) Korista, K. & Goad, M., 2000, ApJ, 536, 284
- Longinotti et al. (2007) Longinotti, A., Bianchi, S., Santos-Lieo, M. et al. 2007, A&A, 470, 73
- (14) LaMassa, S., Cales, S., Moran, E. et al. 2015, ApJ, 800, 144
- (15) MacLeod, C., Ross, N., Lawrence, A. et al. 2016, 457, 389
- (16) Martin, G., Kaviraj, S., Volonteri, M. et al. 2018, MNRAS, 476, 2801
- (17) Mathur, S.; Fields, D.; Peterson, B. M.; & Grupe, D., 2012, ApJ, 754, 146
- Mathur et al. (2017) Mathur, S., Gupta, A., Page, K. et al. 2017, ApJ, 846, 55
- Mehdipour et al. (2011) Mehdipour, M. et al. 2011, A&A, 534,39
- (20) O’Donnell, J. E. 1994, ApJ, 422, 158O
- Page et al. (2004) Page, K. et al. 2004, ApJ, MNRAS, 349, 57
- (22) Peterson, B.M., Ferrarese, L., Gilbert, K. et al. 2004, ApJ, 613, 682
- Rivers (2012) Rivers, E., Markowitz, A., Duro, R., & Rothschild, R., 2012, ApJ, 759, 63
- Roig (2014) Roig, B., Blanton, M., & Ross, N., 2014, ApJ, 781, 72
- Ross et al. (1992) Ross, R. R., Fabian, A. C., & Mineshige, S. 1992, MNRAS, 258, 189
- (26) Runnoe, J., Cales, S., Ruan, J., et al. 2016, MNRAS, 455, 1691
- (27) Schlegel, D., Finkbeiner, D., & Davis, M., 1998, ApJ, 500, 525
- (28) Shapee, B., Prieto, J., Grupe, D. et al. 2014, ApJ, 788, 48
- (29) Titarchuk, L., 1994, ApJ, 434, 313
- Vestergaard & Wilkes (2001) Vestergaard, M. & Wilkes, B. 2001, ApJS, 134, 1
- (31)
| Model | Parameter 1 | Normalization2 | Parameter 3 |
|---|---|---|---|
| Power-law | |||
| Black Body | kT keV | ||
| Line 1 | E keV† | EW eV | |
| Line 2 | E keV† | EW eV |
1. for the joint fit is 1.0 for dof.
2. in units of photons s-1 cm-2 keV-1
: Rest-frame; parameter frozen.