Self-assembly of correlated Kondo lattices: The Mott to Kondo transition in diluted superlattices
In the field of condensed matter, the quest to obtain an experimental realization of a Kondo lattice has generated a tremendous effort of the community, from both standpoints of experiments and theory. The pursuit of obtaining independent magnetic moments, via charge localization through Coulomb interactions, is paramount for applications in nanotechnology. In particular, systems with simultaneous charge and spin degrees of freedom can manifest both Kondo spin quenching and Mott-Hubbard charge localization. A unified experimental framework illuminating the pathway between the two phenomena is of physical and technological interest, and is (as of yet) hardly observed in real condensed matter systems. Recent developments in the ability to control densities and temperatures of strongly correlated Fermionic impurities on surfaces and substrates has opened up a new paradigm of possibilities for this pathway. In particular, a milestone was recently surpassed through the observation of self-assembled superlattices of f band adatoms on metallic surfaces, such as the deposition of Ce on Ag(111). Such lattices have introduced a mechanism of diluted correlated lattices where the interaction between Kondo and Mott physics can be methodically studied. However, it remains difficult to control the adatom distances and substrate densities in these systems, and the interplay between Kondo physics and charge localization remains elusive. In this work, we systematically investigate the phase diagram of superlattice structures of heavy f elements deposited on metallic substrates, and assess the required conditions to obtain Kondo lattices in superlattices. We unveil a unique pathway between Kondo quenching and Mott localization, and identify a non-trivial charge density wave phase emerging from the competition of charge localization and Kondo physics.
Deposition of f elements upon metallic substrates have generated a tremendous interest in the scientific community due to the formation of self-assembled f-element superlattices. In particular, this has opened avenues towards experimental realization of Kondo lattices. A number of self-assembled structures have been discovered, however no clear theoretical description has provided a classification of the Mott and Kondo physics interplay of these experiments as of yet. In this work we provide a general phase diagram of correlated super-structures as a function of correlation strength, substrate electronic density, and adatom inter-distances. Through the use of state-of-the-art dynamical mean-field theory calculations at finite temperature, we have identified a clear regime of parameters where Kondo lattices can be realized. We also report a sharp transition between Mott type physics (for short adatom inter-distances) and Kondo physics. We also report the stabilization of a charge density wave competing with Kondo physics at large inter-adatom distances. Finally, for half-filled f-occupation the ionic potential of the adatom induces a non trivial bound state between the f band electrons and substrate electrons.
Correlated adatoms expand upon the plethora of remarkable properties already existent in two-dimensional (2D) metallic surfaces. Stemming from the competition of localization and itinerant characters, such properties include: hybridization, superlattice self formationBlackbourn (2016); Smilgies and Hanrath (2017); Waltmann et al. (2018) and long range interactionsNanayakkara et al. (2007); Shytov et al. (2008); Morgenstern and Rieder (2005); Wahlström et al. (1998). Moreover, due to the comparatively low coordination between adatoms and substrate, single atom magnetsDonati et al. (2016); Baltic et al. (2016); Natterer et al. (2017) and transistorsFuechsle et al. (2012) were discovered. These phenomena have attracted a wide academic interest, but also offer pathways towards industrial applications, for example as candidates for future atomic scale memory storage, as employed by IBMLoth et al. (2012).
While the limits of MottMing et al. (2017); Yi et al. (2016); Dou et al. (2016) and KondoFiete et al. (2001); Knorr et al. (2002a); Uchoa et al. (2011) superlattice behaviour are well documented, little is known about the transition between the densely packed (Mott) and the diluted (Kondo) limits of superlattice systems. Furthermore, although physical cases of transition adatom(Repp et al., 2000; Knorr et al., 2002b; Negulyaev et al., 2009a; Zhang et al., 2010) and rare-earth adatomSilly et al. (2004); Negulyaev et al. (2009b); Singha et al. (2016) self organization have been reported and justified with tight-binding models and kinetic Monte Carlo simulationsTernes et al. (2004); Negulyaev et al. (2006); Cao et al. (2013); Schiffrin et al. (2008); Hu et al. (2008), the quantum mechanism responsible for the formation of the superlattice, and the adatom-substrate requirements for self formation are so far elusive.
To paint a picture of the phenomena observed in this work, an overview of impurity lattice physics is due: a single Kondo adatom within a material does not conserve momentum when scattering electrons. However, in this work we discuss lattices whose unit cell contains Kondo impurities: Kondo lattices. Due to translational symmetries, Kondo scattering within such lattices conserve momentum, leading to coherent scattering and a decrease in resistivity below the Kondo temperatureGeneralov et al. (2017); Minami and Kawamura (2015). Interpreting requirements for constructing Kondo lattices will be essential in further understanding of correlated low temperature research. Friedel oscillationsFriedel (1952) are another form of impurity-impurity communication. They describe electronic screening of an impurity and charge distribution on lattice sites. More specific to this system is a theory presented by Hyldgaard and PerssonHyldgaard and Persson (2000) on how Friedel oscillations from multiple impurities interact. Lastly, RKKY interactionsRuderman and Kittel (1954); Kasuya (1956); Yosida (1957) provide a mechanism for spin-spin coupling between f and/or d band electrons.
2D systems promote surface electron states. These states are formed with lower electron densities in comparison to the bulk electron states observed in three-dimensional systems. Therefore, electrons become localized under the effects of impurities, and the system becomes devoid of conduction band electrons. Since there is no scattering of conduction band electrons, this leads to an atomic limit behaviour at the lattice impurities. Moreover, substrate electrons are further localized by the impurity induced potential. Under these circumstances, a spin-spin interaction can occur between the impurities electrons and electrons localized near the impurities, forming singlet/triplet bound states. Lastly, due to the periodic structure of both the lattice and the impurity ionic potential, localization can occur around both the adatoms and on the substrate. Localization on substrate sites might be expected when inter-adatom distances become sufficiently large, and the conduction band of the substrate sufficiently high, permitting localization effects and realizing a charge density wave concomitant with a pseudo-gap formation. These effects have so far not been investigated, due to the complexity of the problem, which involves dealing with large unit-cells and the presence of strong correlations in the f-shell of the adatoms. Typically, such systems are beyond the reach of density functional theory, and even more so, from GW and its extensions.
In this work, we use a combination of Dynamical Mean Field Theory (DMFT) and tight binding calculations for a triangular lattice substrate. We present our investigations into the generic properties of single orbital correlated adatom structure upon a triangular metallic substrate. This model is a canonical model for the description of a 4f1 orbital hybridized to a Ag(111) substrate. We systematically investigate the phase diagram upon different density and adatom distances, and outline the different phases obtained. We study the strength of correlations, quantified by the quasi-particle weight factor (), and examine the electron localization at the adatom and its impact on the correlated energy bands and Fermi surfaces.
We report a Mott to Kondo transition as adatom spacing varies from a tightly packed solid to a diluted solid. For any given superlattices, large mass renormalization are obtained at low and high density regimes, corresponding to the limit of a weakly hybridized impurity, and the limit of a screened impurity respectively. These two phases are separated by the formation of a tightly bound triplet between the adatom and the substrate that exhibits a weak mass renormalization. In our view, the experimental realization of the Ce/Ag(111) superlattice falls in the latter regime, and our result shed light on the lack of evidence for Kondo physics as previously observed by spin-polarized STM. Our work predicts that Kondo Lattices are obtained at intermediate adatom distances (5 to 9 substrate lattice sizes, ).
I Results & Discussion
I.1 Strength of correlations and emergent quasi-particles in the superlattice
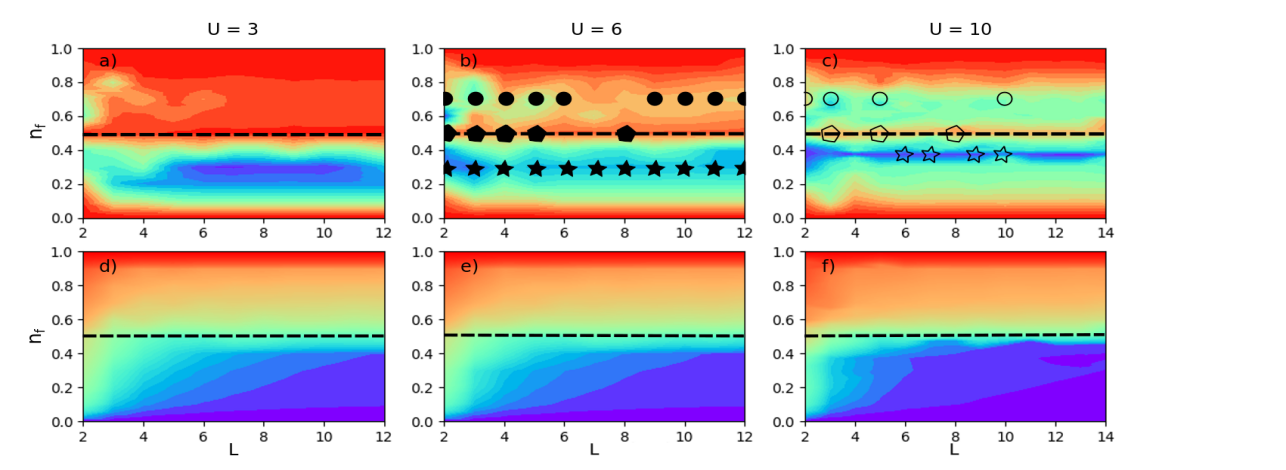
First, we report the systematic study of the superlattice correlation strength, as function of the substrate electronic density and adatom distances, obtained by paramagnetic DMFT calculations (permitting fluctuating moments and correlations across adatoms, but not for long-range magnetic order). Correlation strength is measured by the adatom quasi-particle weight factor , obtained with the low energy imaginary component of Matsubara self energy , reported in fig.2. The results outlined below correspond to Hubbard repulsion , where is the tunnelling amplitudes across the substrate, typically eV for the case of the Ag/Ce superlattice (we discuss results for this Coulomb repulsion thereafter, extended the calculations to other values of the Coulomb repulsion, see fig.S1 in Supplementary Information).
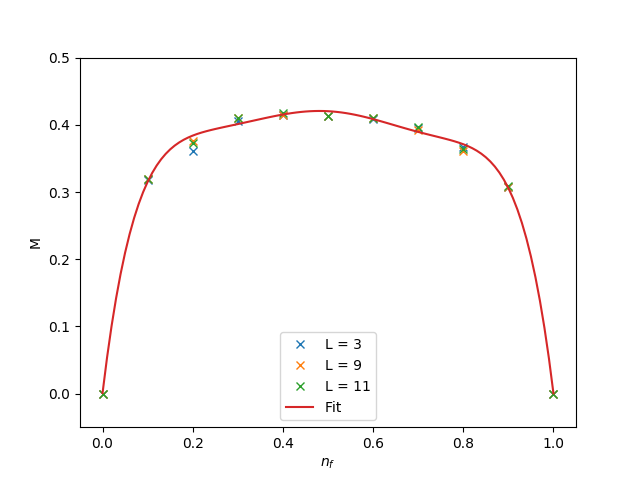
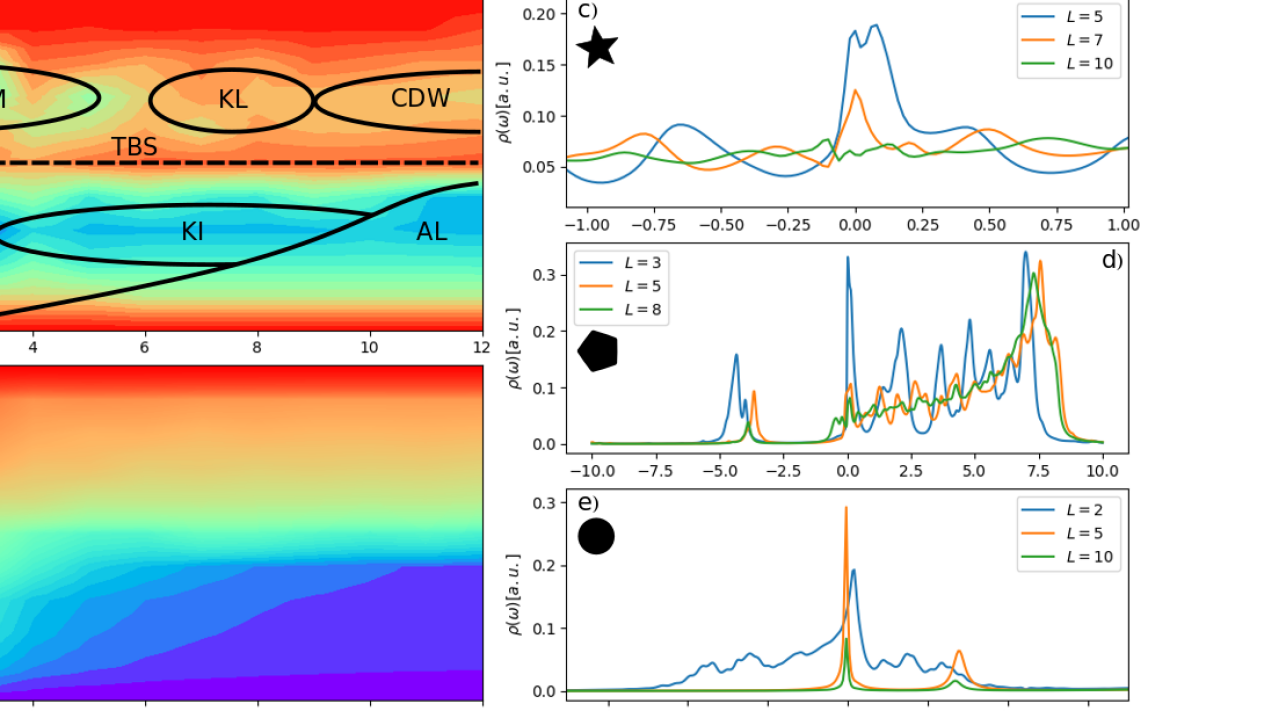
We report a phase diagram in terms of the adatom electronic occupation (all occupation refer to the single spin component only, as the calculations are paramagnetic). Although in our calculations we systematically change the chemical potential, we report the phase diagram in terms of the adatom occupancy. The total occupation is indeed a monotonic function of the adatom density at any finite temperature. We find two dominant regimes where correlation effects are large, at two nearly horizontal minima near the single spin adatom (f band) electron density and , separated by a weakly correlated regime at half-filled adatom across all values of (see also fig.S1 and fig.S2).
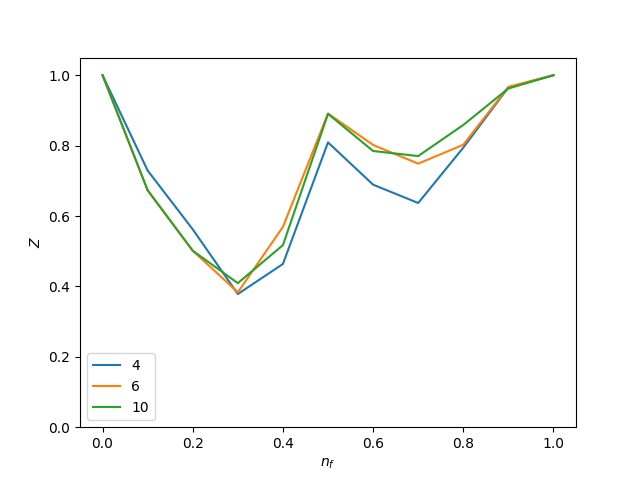
The low , we obtain hence that the quasi-particle state is localized at the adatom. As increases however, also increases, reaching a maximum when the adatom is exactly half-filled (see fig.6). Although we might naively expect that the reduction of the mass renormalization is associated with a delocalization of the charge, we observe that the electron remain tightly bound to the adatom location. In our view, this is associated with the creation of a two-electron tightly bound triplet state between the adatom and the substrate. Finally, at densities larger than two-electron per unit-cell, we obtain another localization process near with a concomitant increase of the mass renormalization.
We report the electronic density of the substrate in fig.2.b (blue denotes an empty substrate, and red the band insulating limit). As expected, at low occupation of the adatom, the substrate is empty, and we obtain the limit of an impurity in vacuum (atomic limit, AL). This limit is not physical and provides a lower bound on the adatom occupation for a given superlattice structure. Additionally, at small adatom distances , we observe a rapid filling of the substrate upon increasing the adatom occupation, an effect related to the Coulomb repulsion at the adatom site, that prevents an occupation of more than one electron and induces a charge transfer to the substrate.
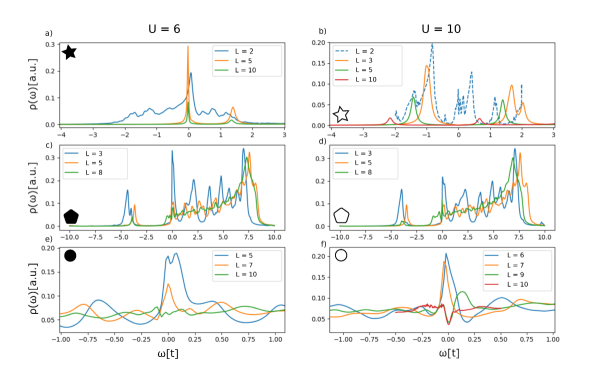
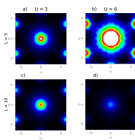
The energy resolved spectral weight , obtained respectively at adatom density (see fig.2.c), at half-filled adatom density (see fig.2.d, which also is concomitant with a filling of two electron in total per unit-cell, meaning there is one electron in the substrate), and at large density (see fig.2.e).
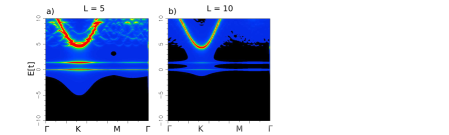
The low density regime exhibits (see fig.2.c) sharp features that corresponds to the localized states at the adatom. We obtain a transition from a broad feature, reminiscent the correlated metal, to a narrow spectral feature at the Fermi level obtained at adatom distances . This is fingerprint of a localized electron at the adatom location, which we denote at a Kondo Impurity (KI). Ultimately, the KI localized quasi-particle states converges to the atomic limit (AL) at large adatom separation. In fig.3, we report the spectral function resolved in real frequencies and momentum obtained for the same density. Note that, as the band structure is trivially folded due to the unit-cell construction of the periodic superlattice, we reconstruct the unfolded band structure of the original unit-cell of the substrate, which allows for comparison across different superlattices. For , we observe that the adatom are strongly hybridized to the substrate for (fig.3.a), as shown by the fluctuations induced in the substrate bands by the adatom, but dehybridize at larger adatom distance (fig.3.b), a fingerprint that the atomic limit has been reached (AL).
The spectral feature of the weakly correlated region at (see fig.2.d) exhibits a large degree of hybridization between the adatom and substrate. We associate this state to a Triplet Bound State (TBS) formation. Finally at larger density (see fig.2.e), we observe the emergence of a resonance, that starts to develop at , and becomes resonant at , and ultimately vanishes at . We associate this feature to the presence of a screened Kondo singlet (see discussion thereafter). We note that at the same density, we observe at large adatom distances the formation of a charge density wave, where electron on the substrate localize half-way in-between adatoms, with the opening of a pseudo-gap in the spectral density (see fig.S1 and S2). This phase is denoted as CDW in the phase diagram.
I.2 The Mott-to-Kondo Crossover in the diluted solid
To investigate the correlated regions of the phase diagram (fig.2.a), a polynomial regression was preformed on the adatom self-energy to obtain the electron scattering rate and the Kondo temperature () in the two correlated phases obtained at respectively and . In both phases, we obtain a significant mass renormalization, concomitant with a large magnetic moment (see fig.S5), a required but not sufficient condition to obtain Kondo physics.
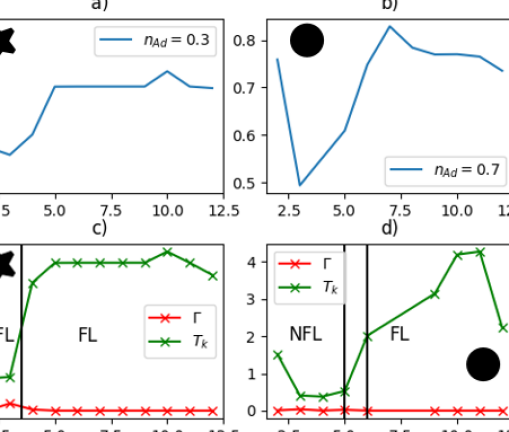
The Kondo temperature , extracted from the low frequency hybridization (see method section) was used here as a marker of the formation of a Kondo singlet. Note that as extracted in this approximation provides the right trend, but is known to overestimate . We obtain (see fig.4.c and d) that a cross-over occurs for both regions as the adatom distances reaches for and for respectively. For the limit of the Kondo impurity (), the system enters into the Kondo regime abruptly via an abrupt transition (see SI fig.S2) between a non Fermi liquid at short adatom distances to a Fermi liquid at intermediate adatom distances (a linear behavior of the self energy as a function of the Matsubara frequency is obtained in the self energy, a signature of a Fermi liquid, see fig.S2).
For , the crossover is continuous (see fig.4) and, unlike the abrupt change obtained between the NFL to FL regime obtained at , an increase in the mass renormalization occurs simultaneously with the large increase of at .
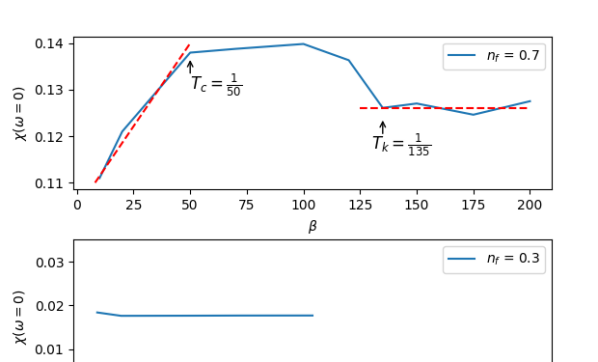
The calculation of the Kondo temperature has been validated by the measurement of the static local magnetic susceptibility of the adatom, obtained from calculations carried out at different temperatures. In fig.5, we observe that the system manifests true Kondo behaviour in the large density regime , for temperatures lower than , which corresponds to K 111The tunneling amplitude for the silver substrate is eV. We therefore identify the region of the phase diagram and as a Kondo lattice (KL): a lattice of independent screened magnetic moments. At large temperature , we recover the usual Curie Weiss law, which describes a fluctuation moment.
In the low density limit (), we find that the local susceptibility remains small at all temperatures with weak temperature dependence (), as expected for a system which exhibits a large degree of localization due to correlation effects. We also note that a larger Coulomb repulsion opens a gap and suppresses the resonance obtained in this regime (see fig.S3.b), gaping in turn the fluctuations associated with the magnetic moment by Mott physics. Due to the low occupation of the conduction band, we consider the region and as a system of Kondo impurities (KI).
I.3 Weakly Correlated Triplet Bound State
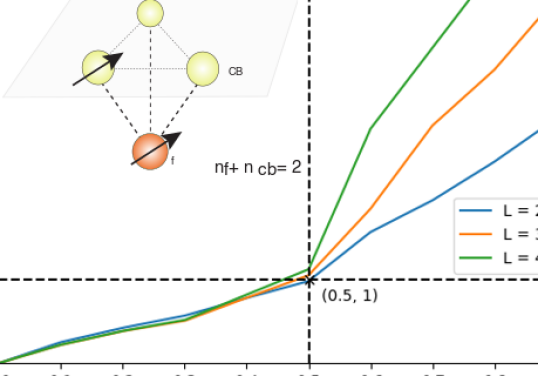
Finally, we investigated the region of the phase diagram that divides the two correlated regions obtained in the phase diagram (obtained at and respectively). At , which corresponds to the case of a half-filled f level, we obtain the weakest mass renormalization and a regime of nearly free electrons (NFE) (see fig.2.a). In fig.6, we report the integrated occupation over the supercell (both adatom and substrate). In particular, we find that the half-filled adatom f shell is obtained with a concomitant total charge of 2 electrons, and hence an occupation of a single electron per unit-cell on the substrate. The real space average charge (not shown) also reveals that the electron pair is localized in the unit cell around the adatom. This can be rationalized in a simple toy model, where 2 electrons are forming a bound state between the adatom and the three substrate neighbours (see fig.6). This toy model can be used as an approximation to capture the physics of the superlattice locally. The solution of the simple model gives a bound triplet ground state for any realistic values of the screened Coulomb interaction (). For , we obtain a singlet ground state. It is worth noting that this limit was obtained by renormalizing the hopping parameters between the substrate atoms to recover the bandwidth of the conduction band, as those have been integrated out in this simple picture (without this renormalization, the separating the singlet from the triplet is larger). We hence conclude that for this region of the phase diagram, we obtain triplet bound electron pairs localized around the adatoms. Note that the triplet can be seen as an uncorrelated state, as the Pauli principle excludes the double occupations. In our view, this phenomena explains the nearly free electron regime, separating the correlated phases at low and high .
I.4 Mott localization driven by adatom interactions mediated by the substrate
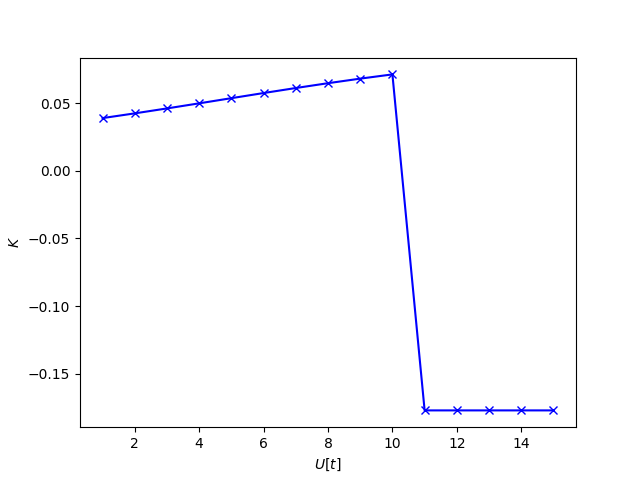
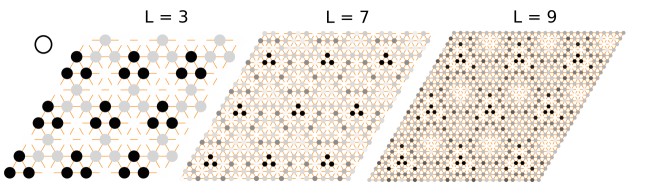
We also extended our calculations to larger and smaller values of the correlation . Whilst most results remain identical, we note that for the strong coupling regime (), the systems undergoes a charge localization for for , followed by the formation of a pseudo-gap and the suppression of the Kondo resonance (see fig.S3.e). The localization is directly observed in the real space electronic density (see fig.7.c). Albeit it is observed in all calculations that electrons localized naturally around the adatoms, due to the attractive ionic potential, the localization induced by the Coulomb repulsion in this particular regime of parameters happens in-between the adatoms. In our view, this effect is driven by the two-body potential induced by the interference energies between Friedel oscillations (Hyldgaard-Persson). This two-body adatom interaction, mediated by surface state electrons, is an oscillating function of the adatom distance (similarly to the RKKY interaction), and is parametrized by the electronic mass. In the free electron model, its oscillations are involving distances larger than 11 lattice spacings, and is hence does not play a role in our calculations for . Furthermore, this interaction is also suppressed when the states at the Fermi level are absent (as it is the case in the low density regime at large that opens a gap).
However, at large density , the adatom mediated interaction is modified by the large mass renormalisation induced by the local Hubbard U term, and produces an attractive potential in-between the adatoms.
We emphasize that this CDW is fundamentally different from Friedel oscillations (FO), where the amplitude decreases as distance from impurity increases. Secondly, as discovered by Chatterjee et. al.Chatterjee et al. (2018) the amplitude of FO decreases as increases, in contradiction to our observation in the Kondo superlattice. Furthermore, the charge localization, in our measurements, is obtained in the large U limit (U/t=10), and is concomitant with a renormalization of the electronic mass (see fig.S1.c). We associate hence the CDW to a charge ordering induced by the narrowing of the conduction band induced by correlation. The electronic localization is associated with the opening of a pseudo-gap.
II Acknowledgements
This research was supported by EPSRC (EP/M011038/1 and also EP/R02992X/1) and the Simons Many-Electron Collaboration. C.W. gratefully acknowledges the support of NVIDIA Corporation, ARCHER UK National Supercomputing Service. We are grateful to the UK Materials and Molecular Modelling Hub for computational resources, which is partially funded by EPSRC (EP/P020194/1).
III Method
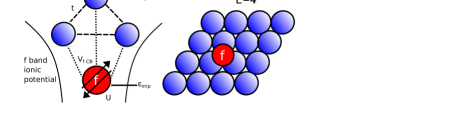
In this paper we have used the following computational setup in order to model the deposition of Ce adatoms on Ag substrate: the Ag substrate was modelled by a 2D triangular lattice of Ag 5 orbitals, while the Ce adatom 4f orbital was represented by an additional site connected with its three nearest neighbor Ag atoms. The heavy deposited Ce adatom hybridize with the substrate, and also induce an attractive ionic potential on the three neighbors of the substrate.
In this work, we use the dynamical mean-field theory (DMFT) approximation. Heavy f-materials have been extensively studied by DMFT, which captures well both the itinerant and localized behavior of the electrons in f-materials Pourovskii et al. (2007); Amadon et al. (2008); Lichtenstein (2013); Lechermann et al. (2006); Plekhanov et al. (2018). In the DMFT formalism, the adatom (Ce) sites with the on-site are treated as strongly correlated orbitals, while the conduction band of the substrate (Ag sites) are considered as uncorrelated. More formally, the Hamiltonian of the system considered here reads in real-space as:
| (1) |
where is the inter-substrate hopping (in our calculation is the energy scale, for the case of a Ag(111) substrate, eV), is the adatom energy level, the adatom Hubbard repulsion and the chemical potential. and are the Fermionic annihilation (creation) operators of the site , spin , surface state and the adatom respectively. describes the on-site potential asserted upon the substrate by the adatom (as described in (Ternes et al., 2004)). And lastly, the adatom/substrate hopping parameter is assumed finite for three of the substrate sites, otherwise it is zero. This assumption can be justified through consideration of the triangular substrateBlackbourn (2016); Ternes et al. (2004). The schematic view of our computational setup is shown in fig.1.
In analogy with DFT+DMFT, the calculation requires convergence with respect to the number of -points in the Brillouin zone of substrate lattice. Calculations carried out in this work were computationally intensive, convergence in some cases required sixfold reduced -points (triangular substrate symmetry). Without any simplifications, calculations of each -point scales as , for number of sites and number of Green’s function frequency points . For the largest lattice size considered, , of the order of calculations was needed to invert the Hamiltonian to calculate the Green’s function for a single DMFT iteration.
In DMFT, we have employed an exact diagonalization (ED) solver improved by using the cluster perturbation theory (CPT). The ED solverCaffarel and Krauth (1994); Capone et al. (2007); Liebsch and Ishida (2012) uses a finite discretization approximation of hybridization function, which induces finite discretization errors Lanczos (1950). As the size of the basis used to represent the Hamiltonian scales exponentially with the number of bath energies in the system, solving the eigenvalue problem is not computationally achievable if the number of bath orbitals is typically larger than 15. ED-CPTWeber et al. (2012) bypasses this problem by utilizing a small number of bath systems and incorporating additional bath sites in order to mimic the effect of coupling to an infinite bath, which was used in our work to check that no remaining systematic error due to the bath discretization was obtained in our calculations. Finally, we have used Lichtenstein’s double counting scheme Lichtenstein (2014).
III.1 Sherman-Morrison
Calculation of the full lattice Green’s function involves a matrix inversion at each -point and . In the case of large supercell sizes this becomes a bottleneck of the formalism. An optimization is possible here due to the fact that the matrix to be inverted contains a large number of empty entries. This is due to the properties of the supercell: the self energy is non-zero only at the adatom, and the hybridization between the adatom and the substrate occurs only on three sites of the substrate. Therefore, to reduce the computational load, the Sherman-Morrison algorithm Sherman and Morrison (1950) was implemented to update the full Green’s function from the substrate Green’s function :
| (2) |
| (3) |
Here , , , and are defined in (1), is the ’s Matsubara frequency, while the substrate sites are ordered in such a way that the three sites connected to the adatom are listed first.
is obtained via matrix products for all ( operations), is then updated from . Since only three substrate sites hybridizes with the adatom, the updating process scales linearly with .
III.2 Kondo physics
In order to extract the Kondo physics fingerprints from our DMFT results we have calculated the scattering rate and Kondo temperature .
In order to estimate , we performed the polynomial regression with the following low frequency, low temperature expansion of in the Kondo regimeCosti et al. (1994):
| (4) |
is obtained from the above parameters and as follows:
| (5) |
III.3 Triplet bound state toy model
Here we briefly outline the simple toy model used to analyze the regime of the phase diagram, where we have two electrons per unit-cell. As we observed in the superlattice calculations that the electronic states are localized around the adatoms, we solve the isolated plaquette of three substrate atoms connected to the adatom site. This Hamiltonian includes a local Coulomb repulsion on the adatom site, an hybridization between the adatom and the three substrate atoms, and hopping across the substrate atoms. The impurity energy and hybridization are the same as the one treated in the full DMFT calculations, whereas the hopping across the substrate elements is renormalized to account for the bandwidth of the full calculation. Upon diagonalizing this Hamiltonian and finding the ground state, we then evaluate the expectation value of the spin correlator operator between the adatom and one of the substrate atom, which identifies a singlet (triplet) ground state if (). We identify the first order transition between the triplet state at small and the singlet state at large (see fig.S6). Interestingly, we find that the critical to obtain a singlet state is larger than all realistic considered in our calculation. This suggests that in the limit of low occupation, pairs of electrons will form a triplet state for realistic values of the Coulomb repulsion.
This triplet state is indeed a multiplet that also includes the polarized contribution with two electrons of same spin, and exhibit a lower degree of correlation. Indeed, in the sectors, there are no contributions from the Coulomb energy, as observed in the phase diagram near the region, where the mass renormalization is weak. We attribute hence this region of the phase diagram to a triplet bound state.
References
- Blackbourn (2016) D. Blackbourn, An investigation into self assembled super-lattices of strongly correlated adatoms on metallic surfaces through the use of Dynamical Mean Field Theory, Ph.D. thesis, King’s College London (2016).
- Smilgies and Hanrath (2017) D.-M. Smilgies and T. Hanrath, EPL (Europhysics Letters) 119, 28003 (2017).
- Waltmann et al. (2018) T. Waltmann, C. Waltmann, N. Horst, and A. Travesset, Journal of the American Chemical Society, Journal of the American Chemical Society 140, 8236 (2018).
- Nanayakkara et al. (2007) S. U. Nanayakkara, E. C. H. Sykes, L. C. Fernández-Torres, M. M. Blake, and P. S. Weiss, Phys. Rev. Lett. 98, 206108 (2007).
- Shytov et al. (2008) A. Shytov, D. Abanin, and L. Levitov, ArXiv e-prints (2008), arXiv:0812.4970 [cond-mat.mes-hall] .
- Morgenstern and Rieder (2005) K. Morgenstern and K.-H. Rieder, New Journal of Physics 7, 139 (2005).
- Wahlström et al. (1998) E. Wahlström, I. Ekvall, H. Olin, and L. Walldén, Applied Physics A 66, 1107 (1998).
- Donati et al. (2016) F. Donati, S. Rusponi, S. Stepanow, C. Wäckerlin, A. Singha, L. Persichetti, R. Baltic, K. Diller, F. Patthey, E. Fernandes, J. Dreiser, Ž. Šljivančanin, K. Kummer, C. Nistor, P. Gambardella, and H. Brune, Science 352, 318 (2016), http://science.sciencemag.org/content/352/6283/318.full.pdf .
- Baltic et al. (2016) R. Baltic, M. Pivetta, F. Donati, C. Wäckerlin, A. Singha, J. Dreiser, S. Rusponi, and H. Brune, Nano Letters 16, 7610 (2016), pMID: 27779891, https://doi.org/10.1021/acs.nanolett.6b03543 .
- Natterer et al. (2017) F. D. Natterer, K. Yang, W. Paul, P. Willke, T. Choi, T. Greber, A. J. Heinrich, and C. P. Lutz, Nature 543, 226 EP (2017).
- Fuechsle et al. (2012) M. Fuechsle, J. A. Miwa, S. Mahapatra, H. Ryu, S. Lee, O. Warschkow, L. C. L. Hollenberg, G. Klimeck, and M. Y. Simmons, Nature Nanotechnology 7, 242 EP (2012).
- Loth et al. (2012) S. Loth, S. Baumann, C. P. Lutz, D. M. Eigler, and A. J. Heinrich, Science 335, 196 (2012), http://science.sciencemag.org/content/335/6065/196.full.pdf .
- Ming et al. (2017) F. Ming, S. Johnston, D. Mulugeta, T. S. Smith, P. Vilmercati, G. Lee, T. A. Maier, P. C. Snijders, and H. H. Weitering, Phys. Rev. Lett. 119, 266802 (2017).
- Yi et al. (2016) S. Yi, H. Lee, J.-H. Choi, and J.-H. Cho, Scientific Reports 6, 30598 EP (2016).
- Dou et al. (2016) X. Dou, V. N. Kotov, and B. Uchoa, Scientific Reports 6, 31737 EP (2016).
- Fiete et al. (2001) G. A. Fiete, J. S. Hersch, E. J. Heller, H. C. Manoharan, C. P. Lutz, and D. M. Eigler, Phys. Rev. Lett. 86, 2392 (2001).
- Knorr et al. (2002a) N. Knorr, M. A. Schneider, L. Diekhöner, P. Wahl, and K. Kern, Phys. Rev. Lett. 88, 096804 (2002a).
- Uchoa et al. (2011) B. Uchoa, T. G. Rappoport, and A. H. Castro Neto, Phys. Rev. Lett. 106, 016801 (2011).
- Repp et al. (2000) J. Repp, F. Moresco, G. Meyer, K.-H. Rieder, P. Hyldgaard, and M. Persson, Phys. Rev. Lett. 85, 2981 (2000).
- Knorr et al. (2002b) N. Knorr, H. Brune, M. Epple, A. Hirstein, M. A. Schneider, and K. Kern, Phys. Rev. B 65, 115420 (2002b).
- Negulyaev et al. (2009a) N. N. Negulyaev, V. S. Stepanyuk, L. Niebergall, P. Bruno, W. Auwärter, Y. Pennec, G. Jahnz, and J. V. Barth, Phys. Rev. B 79, 195411 (2009a).
- Zhang et al. (2010) X. P. Zhang, B. F. Miao, L. Sun, C. L. Gao, A. Hu, H. F. Ding, and J. Kirschner, Phys. Rev. B 81, 125438 (2010).
- Silly et al. (2004) F. Silly, M. Pivetta, M. Ternes, F. m. c. Patthey, J. P. Pelz, and W.-D. Schneider, Phys. Rev. Lett. 92, 016101 (2004).
- Negulyaev et al. (2009b) N. N. Negulyaev, V. S. Stepanyuk, L. Niebergall, P. Bruno, M. Pivetta, M. Ternes, F. Patthey, and W.-D. Schneider, Phys. Rev. Lett. 102, 246102 (2009b).
- Singha et al. (2016) A. Singha, F. Donati, C. Wäckerlin, R. Baltic, J. Dreiser, M. Pivetta, S. Rusponi, and H. Brune, Nano Letters, Nano Letters 16, 3475 (2016).
- Ternes et al. (2004) M. Ternes, C. Weber, M. Pivetta, F. Patthey, J. P. Pelz, T. Giamarchi, F. Mila, and W. Schneider, Physical review letters 93 14, 146805 (2004).
- Negulyaev et al. (2006) N. N. Negulyaev, V. S. Stepanyuk, L. Niebergall, W. Hergert, H. Fangohr, and P. Bruno, Phys. Rev. B 74, 035421 (2006).
- Cao et al. (2013) R. Cao, X. Zhang, B. Miao, Z. Zhong, L. Sun, B. You, A. Hu, and H. Ding, Surface Science 610, 65 (2013).
- Schiffrin et al. (2008) A. Schiffrin, J. Reichert, W. Auwärter, G. Jahnz, Y. Pennec, A. Weber-Bargioni, V. S. Stepanyuk, L. Niebergall, P. Bruno, and J. V. Barth, Phys. Rev. B 78, 035424 (2008).
- Hu et al. (2008) J. Hu, B. Teng, F. Wu, and Y. Fang, New Journal of Physics 10, 023033 (2008).
- Generalov et al. (2017) A. Generalov, D. A. Sokolov, A. Chikina, Y. Kucherenko, V. N. Antonov, L. V. Bekenov, S. Patil, A. D. Huxley, J. W. Allen, K. Matho, K. Kummer, D. V. Vyalikh, and C. Laubschat, Phys. Rev. B 95, 184433 (2017), arXiv:1705.02763 [cond-mat.str-el] .
- Minami and Kawamura (2015) S. Minami and H. Kawamura, Journal of the Physical Society of Japan 84, 044702 (2015), https://doi.org/10.7566/JPSJ.84.044702 .
- Friedel (1952) J. Friedel, The London, Edinburgh, and Dublin Philosophical Magazine and Journal of Science 43, 153 (1952), https://doi.org/10.1080/14786440208561086 .
- Hyldgaard and Persson (2000) P. Hyldgaard and M. Persson, Journal of Physics: Condensed Matter 12, L13 (2000).
- Ruderman and Kittel (1954) M. A. Ruderman and C. Kittel, Phys. Rev. 96, 99 (1954).
- Kasuya (1956) T. Kasuya, Progress of Theoretical Physics 16, 45 (1956).
- Yosida (1957) K. Yosida, Phys. Rev. 106, 893 (1957).
- Note (1) The tunneling amplitude for the silver substrate is eV.
- Chatterjee et al. (2018) B. Chatterjee, J. Skolimowski, K. Makuch, and K. Byczuk, ArXiv e-prints (2018), arXiv:1807.08566 [cond-mat.str-el] .
- Pourovskii et al. (2007) L. V. Pourovskii, B. Amadon, S. Biermann, and A. Georges, Phys. Rev. B 76, 235101 (2007).
- Amadon et al. (2008) B. Amadon, F. Lechermann, A. Georges, F. Jollet, T. O. Wehling, and A. I. Lichtenstein, Phys. Rev. B 77, 205112 (2008).
- Lichtenstein (2013) A. I. Lichtenstein, “Electronic structure of complex oxides,” in Spintronics: From Materials to Devices, edited by C. Felser and G. H. Fecher (Springer Netherlands, 2013) p. 167.
- Lechermann et al. (2006) F. Lechermann, A. Georges, A. Poteryaev, S. Biermann, M. Posternak, A. Yamasaki, and O. K. Andersen, Phys. Rev. B 74, 125120 (2006).
- Plekhanov et al. (2018) E. Plekhanov, P. Hasnip, V. Sacksteder, M. Probert, S. J. Clark, K. Refson, and C. Weber, Phys. Rev. B 98, 075129 (2018).
- Caffarel and Krauth (1994) M. Caffarel and W. Krauth, Phys. Rev. Lett. 72, 1545 (1994).
- Capone et al. (2007) M. Capone, L. de’ Medici, and A. Georges, Phys. Rev. B 76, 245116 (2007).
- Liebsch and Ishida (2012) A. Liebsch and H. Ishida, Journal of Physics: Condensed Matter 24, 053201 (2012).
- Lanczos (1950) C. Lanczos, “An iterative method for the solution of the eigenvalue problem of linear differential and integral,” (1950).
- Weber et al. (2012) C. Weber, A. Amaricci, M. Capone, and P. B. Littlewood, Phys. Rev. B 86, 115136 (2012), arXiv:1207.5610 [cond-mat.str-el] .
- Lichtenstein (2014) A. Lichtenstein, in DMFT at 25: Infinite Dimensions, edited by E. Pavarini, E. Koch, D. Vollhardt, and A. Lichtenstein (Forschungszentrum Jülich Zentralbibliothek, Verlag, Jülich, 2014) Chap. 8.
- Sherman and Morrison (1950) J. Sherman and W. J. Morrison, Ann. Math. Statist. 21, 124 (1950).
- Costi et al. (1994) T. A. Costi, A. C. Hewson, and V. Zlatic, Journal of Physics Condensed Matter 6, 2519 (1994), cond-mat/9310032 .
- Surer et al. (2012) B. Surer, M. Troyer, P. Werner, T. O. Wehling, A. M. Läuchli, A. Wilhelm, and A. I. Lichtenstein, Phys. Rev. B 85, 085114 (2012), arXiv:1107.3772 [cond-mat.str-el] .
- C. Hewson (2005) A. C. Hewson, Journal of the Physical Society of Japan 74, 8 (2005).
IV Supplementary Material