High-Temperature Superconductivity in Alkaline and Rare Earth Polyhydrides at High Pressure: A Theoretical Perspective
Abstract
The theoretical exploration of the phase diagrams of binary hydrides under pressure using ab initio crystal structure prediction techniques coupled with first-principles calculations has led to the in silico discovery of numerous novel superconducting materials. This Perspective article focuses on the alkaline earth and rare earth polyhydrides whose superconducting critical temperature, , was predicted to be above the boiling point of liquid nitrogen. After providing a brief overview of the computational protocol used to predict the structures of stable and metastable hydrides under pressure, we outline the equations that can be employed to estimate . The systems with a high can be classified according to the motifs found in their hydrogenic lattices. The highest s are found for cages that are reminiscent of clathrates, and the lowest for systems that contain atomic and molecular hydrogen. A wide variety of hydrogenic motifs including 1- and 2-dimensional lattices, as well as H molecular units comprised of fused H pentagons are present in phases with intermediate s. Some of these phases are predicted to be superconducting at room temperature. Some may have recently been synthesized in diamond anvil cells.
I Introduction
The pressure induced metallization of hydrogen was first proposed by J. D. Bernal, but only later reported in the literature by Wigner and Huntington, who predicted that at 25 GPa hydrogen would become an alkali metal-like monoatomic solid Wigner and Huntington (1935). It turned out that this was a gross underestimate: the lightest element has stubbornly resisted metallization up to center of the Earth pressures in a diamond anvil cell (DAC) Narayana et al. (1998); Loubeyre, Occelli, and LeToullec (2002); Zha et al. (2013); Eremets and Troyan (2011); Howie et al. (2012a); Dalladay-Simpson, Howie, and Gregoryanz (2016); Zha, Liu, and Hemley (2012); Howie et al. (2012b); Goncharov et al. (2013). A few recent studies have presented evidence indicative of metallization Eremets, Troyan, and Drozdov (2016); Dias and Silvera (2017), but the interpretation of the experimental results has been questioned Loubeyre, Occelli, and Dumas (2017); Eremets and Drozdov (2017); Liu et al. (2017a).
Why has blood, sweat and tears gone into attempts to metallize hydrogen? And what makes metallic hydrogen so special that it has been dubbed the holy grail of high pressure research? The reason can be traced back to Ashcroft, who predicted that the large phonon frequencies (a result of the small mass of H), large electron phonon coupling (arising from the strong covalent bonds between the H atoms, and lack of core electrons), wide bands, and substantial density of states (DOS) at the Fermi level () would render this elusive substance superconducting at high temperatures Ashcroft (1968). Indeed, first principles calculations have estimated high values for the superconducting critical temperature (): 242 K at 450 GPa in the molecular phase Cudazzo et al. (2008), and as high as 764 K for monoatomic hydrogen near 2 TPa McMahon and Ceperley (2011). Thus, one way to make superconducting metallic hydrogen is by achieving the appropriate / conditions.
However, chemistry may be able to hasten the metallization of hydrogen. In a seminal manuscript Ashcroft pointed out that because the hydrogen in solids comprised of the group 14 hydrides is “chemically precompressed”, they may become metallic at lower pressures than elemental hydrogen Ashcroft (2004a, b). In other words, hydrogen’s interaction with the tetragen atoms would modify the H-H distances and densities in such a way that less external physical pressure would be required to achieve a metallic state. Moreover, Ashcroft hypothesized that these compressed hydrides would have the same properties conducive towards high temperature superconductivity as hydrogen itself, thereby suggesting a parallel route to metallizing hydrogen. These predictions led to a plethora of theoretical, and a few experimental studies that searched for superconductivity in hydrides known to exist at 1 atm, including SiH4 Feng et al. (2006); Pickard and Needs (2006); Yao et al. (2007); Degtyareva et al. (2007); Chen et al. (2008); Kim et al. (2008); Martinez-Canales et al. (2009); Yan, Gong, and Zong (2010); Zhang et al. (2015a); Cui et al. (2015); Eremets et al. (2008), GeH4 Martinez-Canales et al. (2006); Li, Yu, and Jin (2007); Gao et al. (2008); Zhang et al. (2010, 2015b), and AlH3 Pickard and Needs (2007); Goncharenko et al. (2008); Kim, Scheicher, and Ahuja (2008); Geshi and Fukazawa (2013). But, because pressure is known to affect the chemical compositions that are stable Zurek and Grochala (2015); Zurek (2017a); Hermann (2017), systems with stoichiometries that are not observed at 1 atm, e.g. SiH4(H2)n, , Strobel, Somayazulu, and Hemley (2009); Wang et al. (2009); Yao and Klug (2010); Yim, Tse, and Iitaka (2010); Michel, Liu, and Ozolins (2010); Shanavas, Poswal, and Sharma (2012); Li et al. (2010), and LiHn, , Zurek et al. (2009); Pépin et al. (2015) were also investigated. The possibility of accessing novel combinations and electronic structures under pressure dramatically widens the phase space wherein a high temperature superconductor can be found.
High pressure experiments can be very costly, and the results can be difficult to analyze. It is therefore no surprise that the dramatic improvement of computer hardware, coupled with the development of robust methods for a priori crystal structure prediction (CSP) using Density Functional Theory (DFT) calculations has led to the rapid in silico exploration of the phase diagrams of materials under pressure. Many investigations have focused on the parallel route of metallizing hydrogen inspired by Ashcroft’s predictions Ashcroft (2004a, b). In just over a decade the phase diagrams of most binary hydrides under pressure have been calculated Zurek (2017b); Shamp and Zurek (2017); Zhang et al. (2017); Duan et al. (2016); Wang et al. (2017); Struzhkin (2015); Needs and Pickard (2016); Yao and Tse (2018); Bi et al. (2018); Semenok et al. (2018a). s that approach, and even surpass, room temperature have been calculated for a number of phases that are predicted to be stable at pressures attainable in DACs.
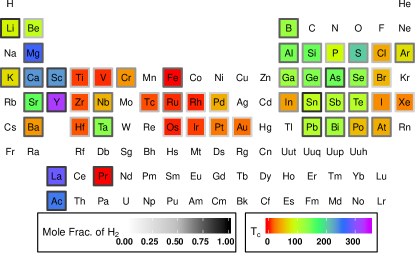
The periodic table illustrated in Fig. 1 graphically shows the highest undisputed not (b) s predicted for each element’s polyhydride not (a). Two regions contain hydrides that are the most promising for high temperature superconductivity: (i) many of the -block elements in groups 13-16, and (ii) a subset of the alkaline earth and rare earth metals. High temperature superconductivity was found within the first region when a of 203 K near 150 GPa was measured in a sample of compressed hydrogen sulfide Drozdov et al. (2015). Not only does this material possess the highest confirmed to date, remarkably it is also a Bardeen-Cooper-Schrieffer (BCS) type superconductor Mazin (2015). As described in more detail elsewhere Yao and Tse (2018), this discovery was not serendipitous; theoretical investigations inspired Li et al. (2014) experiment and helped to interpret the results Duan et al. (2014). Superconductivity in the sulphur/hydrogen system under pressure has been the topic of numerous studies Einaga et al. (2016); Troyan et al. (2016); Capitani et al. (2017); Goncharov et al. (2017); Guigue, Marizy, and Loubeyre (2017); Flores-Livas, Sanna, and Gross (2016); Papaconstantopoulos et al. (2015); Bernstein et al. (2015); Duan et al. (2015); Errea et al. (2015); Akashi et al. (2015); Errea et al. (2016); Quan and Pickett (2016); Sano et al. (2016); Ortenzi, Cappelluti, and Pietronero (2016); Gor’kov and Kresin (2016); Goncharov et al. (2016); Bussmann-Holder et al. (2017); Durajski (2016); Jarlborg and Bianconi (2016); Szczęśniak and Durajski (2017); Azadi and Kühne (2017); Durajski, Szczęśniak, and Li (2015); Arita et al. (2017); Gordon et al. (2016); Majumdar, Tse, and Yao (2017); Akashi et al. (2016); Li et al. (2016); Ishikawa et al. (2016); Heil and Boeri (2015); Ge, Zhang, and Yao (2016); Bianconi and Jarlborg (2015), and it has been reviewed Yao and Tse (2018); Eremets and Drozdov (2016); Einaga et al. (2017).
This Perspective focuses on studies of hydrides in the second region, the alkaline and rare earths, whose predicted s are at least as high as the boiling point of liquid nitrogen. Recent experiments tantalize with the promise of room temperature superconductivity in these systems, with measured s as high as 215 K Drozdov et al. (2018) or 260-280 K Somayazulu et al. (2018) in the lanthanum/hydrogen system under pressure. Sec. II provides a brief overview of the computational approaches used for the ab initio prediction of the structures of novel pressure stabilized hydrides, and Sec. III discusses the equations used to approximate . The predicted structures and their superconducting properties are discussed in Sec. IV, which is organized by the motifs found in these phases’ hydrogenic lattices: clathrate-like arrangements, mixed atomic and molecular hydrogen, and other unique discrete or periodic hydrogenic motifs, such as H “pentagons” or 2-dimensional sheets. A brief outlook is provided in Sec. V.
II Computational and Theoretical Considerations
Pressure can have a profound effect on the compositions, structures, properties and stability of solid phases Hemley (2000); Song (2013); Grochala et al. (2007); Goncharov, Howie, and Gregoryanz (2013); Bhardwaj and Singh (2012); Dubrovinsky and Dubrovinskaia (2013); McMillan (2013); Klug and Yao (2011); Naumov and Hemley (2014); Zurek and Grochala (2015); Zurek (2017a); Hermann (2017). Who would have guessed that the “simple metal” sodium becomes an insulator by 200 GPa Ma et al. (2009), the “noble” gas helium reacts with sodium to form a stable Na2He Dong et al. (2017); Liu et al. (2018a) phase at 113 GPa, and hydrides with unusual stoichiometries such as NaH3 Struzhkin et al. (2016), Xe(H2)8 Somayazulu et al. (2010) and FeH5 Pépin et al. (2017) can be synthesized in a DAC? Such chemistry could not have been predicted using rules and bonding schemes that are based upon our experience at 1 atm. At the same time, experiments that approach the pressures in the Earth’s core (350 GPa) are challenging, and the results can be difficult to analyze. This has led to the development of a symbiotic relationship between theoreticians and experimentalists, where a feedback loop between experiment and theory has often led to important discoveries.
Because of the difficulty inherent in performing high pressure syntheses and fully characterizing the phases made, many theoretical groups have employed a priori methods for crystal structure prediction (CSP) to propose stable candidate structures. Structure prediction is a global optimization problem, where the goal is to determine the unit cell parameters, and atomic coordinates that correspond to the global minimum, as well as low lying local minima, in the potential energy surface (PES). However, as with all optimization problems, it is not possible to guarantee that the global minimum has been found within a CSP search. Thus, many of the algorithms that have been adapted towards CSP employ well known meta-heuristics that can find sufficiently good solutions for the minima. This includes: (quasi) random searches, techniques based on swarm behavior, evolutionary (genetic) algorithms, basin or minima hopping, as well as simulated annealing and metadynamics. A number of excellent reviews describing these methods Woodley and Catlow (2008); Schön, Doll, and Jansen (2010); Rossi and Ferrando (2009); Wang and Ma (2014); Pickard and Needs (2009); Revard, Tipton, and Hennig (2014); Oganov (2011); Wales (2003); Zurek (2016); Oganov, Lyakhov, and Valle (2011); Jansen (2015), and the synergy between CSP and experiment in high pressure research Zurek and Grochala (2015); Zhang et al. (2017); Wang and Ma (2014); Pickard and Needs (2009); Needs and Pickard (2016) are available.
Typically hundreds, if not thousands, of structures are optimized to the nearest local minimum within a single CSP search. Moreover, often multiple searches need to be carried out for different stoichiometries and for a range of pressures. Because computations of the vibrational contributions to the free energy are significantly more time consuming than geometry optimizations, most CSP searches explore the 0 K PES. Reliable force fields are often not available for matter at extreme conditions, so the local optimizations are usually performed using DFT with a functional based on the generalized gradient approximation (GGA); often the Perdew, Burke and Enzerhof (PBE) Perdew, Burke, and Ernzerhof (1996) GGA is employed. Hybrid functionals such as HSE06 Krukau et al. (2006) or PBE0 Adamo and Barone (1999) have so far not been used during CSP because of the immense computational expense involved. However, the inclusion of Hartree-Fock exchange can significantly affect the calculated transition pressures between different phases, Liu, Cui, and Ma (2012); Teweldeberhan, DuBois, and Bonev (2012); Ochoa-Calle, Zicovich-Wilson, and Ramirez-Solis (2015), stabilization pressures Kurzydlowski and Zaleski-Ejgierd (2016a, b); Hermann et al. (2016), computed values Komelj and Krakauer (2015), and it can lead to symmetry breaking structural (Peierls) distortions Boates and Bonev (2011). Even though still rare, it is becoming more common to reoptimize the most stable structures found in a GGA-CSP search using hybrid functionals Kurzydlowski and Zaleski-Ejgierd (2016a, b); Hermann et al. (2016). In situations where metallization occurs because of pressure induced band broadening of the valence and conduction bands, and their eventual overlap, GGA functionals predict a too low metallization pressure. Hybrid functionals provide better estimates of the pressure at which band gap closure occurs. The inclusion of dispersion can also affect transition pressures for molecular solids Santra et al. (2011, 2013), and DFT+U has been employed for strongly correlated systems Kurzydłowski (2018). An adaptive genetic algorithm, which uses DFT calculations performed on a small set of candidate structures to parametrize, on-the-fly, classical potentials that are then employed for the local minimizations has successfully been applied to predict the structures of binary and ternary phases under pressure Wu et al. (2014).
For systems containing light elements the inclusion of the zero point energy (ZPE) can influence the relative enthalpies of different phases, as well as the identity of the thermodynamically stable species and their stability ranges. This is especially true if the hydrogenic sublattices of the structures whose enthalpies are compared have different motifs. Cold melting, which can occur if the difference in enthalpy between different phases is smaller than the ZPE, has been proposed for metal hydrides that contain a heavy element Hooper and Zurek (2012); Zaleski-Ejgierd, Hoffmann, and Ashcroft (2011). It is currently standard practice to consider how the ZPE affects the stability of the phases found in a CSP search carried out at 0 K, but finite temperature contributions to the free energy are rarely considered, even though they may also be important (as it has been shown for elemental hydrogen Pickard, Martinez-Canales, and Needs (2012)). Because the experimental conditions employed can affect which phases (i.e. stable or metastable) are made Mishra et al. (2018); Drozdov, Eremets, and Troyan (2015), it is important for theory to identify not only the global minimum, but also low lying local minima Zarifi et al. (2018).
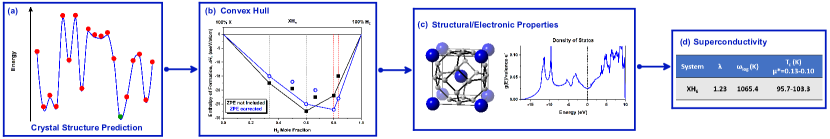
Fig. 2 illustrates the typical workflow employed by theoreticians searching for novel pressure-stabilized superconducting phases, including those discussed in this Perspective. First, CSP searches are carried out on the 0 K GGA PES as a function of composition and pressure. Promising candidate structures are optimized using more accurate settings, and their enthalpies of formation, , are plotted vs. the mole fraction of H2 they contain. The are employed to generate the convex hull, which is the set of line segments below which no other points lie. The phases whose comprise the hull are thermodynamically stable. Phonon calculations are carried out to confirm dynamic stability of phases that are on the hull or close to it, and the results are used to construct a new convex hull that includes the ZPE contributions to the enthalpy at 0 K. The structure, and electronic structure of select systems are computed and analyzed. In the following Section we described the methods employed to estimate the of the most promising structures.
All of the phases discussed in the following sections were predicted using particle swarm optimization Wang et al. (2010, 2012a), evolutionary algorithms Glass, Oganov, and Hansen (2006); Lonie and Zurek (2011) or ab initio random structure searching Pickard and Needs (2011). Because they did not become metallic because of pressure induced band broadening, it was not necessary to recompute their DOS’ with a hybrid functional. Even though it is possible that geometry optimization with a hybrid functional would result in a Peierls distortion that opens up a band gap, this was not considered. Because of the high computational cost associated with performing electron phonon coupling calculations, was estimated using GGA calculations within the harmonic approximation.
III Estimating the Superconducting Critical Temperature
In this section the equations that are typically employed to estimate for compressed hydrides from first principles calculations are introduced. In the past these techniques have been successfully applied to a wide range of metallic systems Bose and Kortus (2009). If the superconducting properties of a material can be described using BCS theory, or its extensions, the material is referred to as a conventional superconductor. The electron phonon coupling mechanism that leads to superconductivity within BCS theory can be pictured as follows. When an electron passes through a crystalline lattice of positively charged ions, the Coulomb attraction between the electron and the ion causes the lattice to distort. The ionic displacement, in turn, attracts another electron with opposite spin and momentum. The two electrons become correlated and form a boson-like quasiparticle called a Cooper pair. All of the Cooper pairs in a superconductor break up at a temperature higher than , thereby destroying the superconducting state.
Within BCS theory, can be estimated via
| (1) |
where is the average phonon energy, is the single spin electronic DOS at , and is the pairing potential between two electrons that occurs via the electron phonon interaction (which is assumed to be constant within of the Fermi surface, and zero otherwise) Bardeen, Cooper, and Schrieffer (1957a, b). The cutoff frequency, , is often taken to be the Debye frequency or the average frequency, and it defines the size of the superconducting band gap.
Despite the tremendous successes of BCS theory in describing the properties of conventional superconductors, substantial differences between theory and experiment became apparent, for example for the metals Pb and Hg. The reason for this turned out to be that the assumption of constant is too simple: the electron phonon interaction is not instantaneous, but rather it is retarded in time, and the quasiparticle states have a finite lifetime. Eliashberg theory is an extension of BCS theory that explicitly includes the retardation effects Eliashberg (1960). It is beyond the scope of this Perspective to discuss the Eliashberg equations, which can be solved numerically. However, we introduce the key quantity of Eliashberg theory, the Eliashberg spectral function, which can be calculated (from first principles) or measured (by inverting tunnelling spectra).
The Eliashberg spectral function, , is defined as:
| (2) |
where the linewidth, , of a phonon mode with a wave-vector , , is given by:
| (3) |
These equations describe the scattering of an electron on the Fermi surface with a resulting transfer of momentum to a phonon, where is the electron phonon matrix element, or the probability, associated with this process. Given the Eliashberg function, the electron phonon coupling, , can be calculated via:
| (4) |
The Eliashberg formalism requires as input a parameter that describes the screened Coulomb repulsion between the electrons within a Cooper pair. This renormalized Coulomb repulsion parameter, , is often called the Coulomb pseudopotential. Analytical expressions that can be used to approximate have been proposed, but typically it is used as a free parameter with reasonable values lying in the range of 0.1-0.2. We note that there is one theoretical approach, density functional theory for superconductors (SCDFT), which takes into account the retardation effects, and does not require any empirical parameters for the calculation of Lüders et al. (2005); Marques et al. (2005). However, only a few studies have used SCDFT for hydrides under high pressure, for example Refs. Flores-Livas, Sanna, and Gross (2016); Flores-Livas et al. (2016).
One of the first simple expressions that could be used to estimate was developed by McMillan. Based on twenty-two numerical solutions of the Eliashberg equations for , , and a single shape for the function modeled after the phonon DOS in Nb, McMillan showed that the following expression, where is the Debye temperature, could be used to provide a reasonable estimate for : McMillan (1968)
| (5) |
Subsequently, Allen and Dynes carried out 200 numerical solutions for various shapes of the Eliashberg function, using a wide range of values Allen and Dynes (1975); Dynes (1972). They proposed the following modification of the McMillan equation:
| (6) |
where is the logarithmic average frequency of the phonon modes obtained via
| (7) |
Usually, once DFT calculations have been carried out to determine the Eliashberg spectral function, and from it , is estimated via Eq. 6 for a range of values. However, whereas the Allen-Dynes modified McMillan equation implies that reaches a maximum limit when , a maximum does not exist for the exact solution of the Eliashberg equations. In cases where the electron phonon coupling is strong, i.e. 1.5, Eq. 6 often yields a lower limit to . To remedy this, Allen and Dynes proposed multiplying Eq. 6 by scaling factors that correct for the strong coupling, and shape dependence of Allen and Dynes (1975). However, for the studies discussed herein, was typically estimated solving the Eliashberg equations when was large.
IV Hydrogenic Motifs
IV.1 Clathrate Based Hydrogenic Lattices
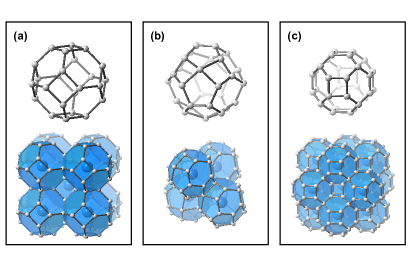
A number of CSP-based studies have computed very high s for binary alkaline earth or rare earth metal hydrides whose hydrogenic lattices are reminiscent of clathrates. The first system of this type to be predicted was a CaH6 phase, which was thermodynamically and dynamically stable above 150 GPa Wang et al. (2012b). The building block of this phase is the H24 sodalite-like cage illustrated in the top panel of Fig. 3(a), which consists of six square and eight hexagonal faces. The metal atom lies in the center of this cage, and because the shortest H-H distance measures 1.24 Å, these hydrogen atoms are only weakly bonded to each other. The crystalline lattice that is formed from joining the [4668] polyhedra at the faces, shown in the bottom panel of Fig. 3(a), has symmetry. The band structure of CaH6 contains degenerate bands at the point that are partially occupied. Therefore, Wang et al. suggested that a Jahn-Teller distortion, which removes this degeneracy, could yield a substantial electron phonon coupling parameter. Indeed, this phase was calculated to have a remarkably large of 2.69, with the most significant contribution arising from modes associated with the vibrations of the atoms comprising the H4 faces. Because of the large , was estimated by solving the Eliashberg equations. It was calculated to be between 220-235 K for typical values of , as shown in Table 1, and it decreased at higher pressures.
| System | (GPa) | (K) | ||
| MgH6 | 300 | 3.29 | 0.12 | 263 a, Feng et al. (2015) |
| CaH6 | 150 | 2.69 | 0.13-0.10 | 220-235 b, Wang et al. (2012b) |
| SrH | 250 | 1.10 | 0.10 | 156 b, Bi et al. (2018) |
| ScH6 | 350 | 1.25 | 0.10 | 135 a, Ye et al. (2018), 169 b, Ye et al. (2018) |
| ScH6 | 285 | 1.33 | 0.13-0.10 | 130-147 a, Abe (2017) |
| ScH | 300 | 1.20 | 0.13-0.10 | 90-100 b,c, Peng et al. (2017) |
| YH6 | 120 | 2.93 | 0.13-0.10 | 251-264 b, Li et al. (2015); Peng et al. (2017) |
| ZrH | 295 | 1.20 | 0.13 | 114 b, Abe (2018) |
| LaH6 | 100 | 2.00 | 0.13-0.10 | 150-160 b,c, Peng et al. (2017) |
| ScH9 | 400 | 1.50 | 0.13-0.10 | 150-190 b,c, Peng et al. (2017) |
| YH | 150 | 4.42 | 0.13-0.10 | 276-253 b, Peng et al. (2017) |
| YH10 | 400 | 2.41 | 0.13-0.10 | 287-303 b, Peng et al. (2017) |
| YH10 | 250 | 2.58 | 0.13-0.10 | 244-265 , 305-326 b, Liu et al. (2017b) |
| LaH | 200 | 2.28 | 0.10 | 288 a, Peng et al. (2017) |
| LaH10 | 210 | 3.41 | 0.13-0.10 | 219-238 , 274-286 b, Liu et al. (2017b) |
| LaH | 200 | 3.57 | 0.13-0.10 | 218-200 a, Liu et al. (2018b), 245-229 b, Liu et al. (2018b) |
| AcH | 200 | 3.46 | 0.15-0.10 | 177-204.1 a, Semenok et al. (2018b), 226-251 b, Semenok et al. (2018b) |
a was calculated using the Allen-Dynes modified McMillan equation, Eq. 6.
b was calculated by solving the Eliashberg equations numerically.
c Values were estimated from plots in the original papers.
∗ This symmetry phase can be derived by distorting the structure.
† At this pressure the enthalpy of a different phase was slightly lower than for the clathrate structure whose is provided.
¶ This symmetry phase can be derived by distorting the structure.
§ This stoichiometry did not lie on the convex hull without ZPE at 0 K.
‡ This symmetry phase can be derived by distorting the structure.
$ This symmetry phase can be derived by distorting the structure.
The prediction of high in CaH6 inspired a computational study of an isotypic MgH6 phase, which was found to become stable with respect to decomposition into MgH2 and H2 above 263 GPa when the ZPE was included Feng et al. (2015). But, because a convex hull plotting the of MgH6 along with the of other stoichiometries that were previously found to be stable at lower pressures Lonie et al. (2013) was not constructed, it is not clear if MgH6 is thermodynamically stable or if it is only metastable. The estimated of MgH6 at 300 K, see Table 1, was somewhat higher than the largest calculated for CaH6. An isotypic strontium hexahydride was not a local minimum on the PES. However, SrH6, which can be derived from the structure by elongating four out of six of the closest metal-metal contacts and distorting the face that bisects them so it is no longer hexagonal, was stable at 250 GPa Hooper et al. (2014); Wang et al. (2015). This symmetry breaking distortion transformed the sodalite hydrogenic lattice into one-dimensional helical chains, and the resulting structure had a smaller , and concomitantly a lower Bi et al. (2018) than its lighter cousins. A structurally analogous BaH6 phase with a high could not be located via CSP Hooper et al. (2013).
Moving to the -block elements, computations have shown that ScH6 Abe (2017); Qian et al. (2017); Peng et al. (2017); Ye et al. (2018) and YH6 Li et al. (2015); Liu et al. (2017b); Peng et al. (2017) phases with symmetry are also stable at pressures attainable in DACs. A related symmetry ZrH6 phase, which can be obtained via a distortion of the lattice, has also recently been found via CSP calculations Abe (2018). In one study Peng et al. (2017) LaH6 was computed to be thermodynamically stable at 100 GPa and 150 GPa, whereas in another investigation Liu et al. (2017b) the LaH6 stoichiometry was predicted to lie slightly above the convex hull, and assume the same symmetry structure previously found for SrH6. As shown in Table 1, the electron phonon coupling of YH6 was computed to be particularly high, , and therefore its was estimated to be at least 100 K higher than any of the other stable superconducting -block hexahydrides.
The [465666] H29 polyhedron shown in the top panel of Fig. 3(b) is comprised of six irregular squares, six pentagons and six hexagons. It is the building block of a hydrogenic clathrate-like lattice with symmetry that has been predicted for a number of MH9 stoichiometry rare-earth hydrides Peng et al. (2017). Phases with the MH10 stoichiometry, on the other hand, were often found to assume an symmetry structure comprised of the H32 [46612] polyhedron, which is shown in Fig. 3(c) Peng et al. (2017); Liu et al. (2017b). In the clathrate and zeolite community the latter is known as ‘AST’ Amri, Clarkson, and Walton (2010). The stability of the clathrate cages under pressure was attributed to their dense packing, which yields a substantially lower term to the enthalpy. For example, at 300 GPa a symmetry YH9 clathratic phase had the smallest volume out of any of the 500 lowest enthalpy structures found via CSP searches Peng et al. (2017). In some cases the enthalpy of a phase that did not possess a clathrate-like structure was slightly lower, but the ZPE-corrected enthalpies of the two dynamically stable phases were within a few meV/atom of each other Peng et al. (2017). However, because the estimated s of the clathrate-like structures were significantly higher, they are provided in Table 1. Below 210 GPa, LaH10 was not a minimum on the PES, but a symmetry lattice that could be derived from the ideal structure via a slight distortion was dynamically stable Liu et al. (2018b).
As shown in Table 1, enticingly high values, some of which even surpass room temperature, have been computed for the YH9, YH10 and LaH10 stoichiometries. Although stable clathritic LaH9, CeH9, CeH10, and PrH9 phases were also found via CSP, their computed values were much lower, 56 K Peng et al. (2017), because the lower frequency vibrations, which are a result of the heavier element, reduce in a BCS superconductor. On the other hand, a metastable symmetry AcH10 phase was computed to have a quite high Semenok et al. (2018b). It’s hydrogenic lattice resembled the clathrate structure illustrated in Fig. 3(c), except the square faces were replaced by trapezoids. Out of any of the binary hydrides studied computationally YH9, YH10 and LaH10 hold the record values to date, as seen in Fig. 1.
The aforementioned theoretical predictions inspired experimental studies. Last year a superhydride of lanthanum consistent with the theoretically predicted structure for LaH10 was synthesized at 170 GPa, and decompression led to a phase transformation Geballe et al. (2018). And, two very recent studies observed dramatic drops in resistivity in the lanthanum/hydrogen system under pressure, tantalizing with the allure of high temperature superconductivity Somayazulu et al. (2018); Drozdov et al. (2018). If confirmed, both of these findings would break the current record for the highest measured values previously observed in the hydrogen/sulfur system Drozdov et al. (2015). Somayzaulu et al. measured a of between 245-280 K at 190-200 GPa in a sample whose diffraction peaks were consistent with the previously synthesized LaH10±x phase Somayazulu et al. (2018). As Table 1 reveals, this value is in good agreement with theoretical estimates for both the and the symmetry LaH10 phases. Drozdov and co-workers, who employed a different experimental technique to synthesize a so-far uncharacterized superhydride of lanthanum, reported a maximum of 215 K at 150 GPa Drozdov et al. (2018). Because the samples were synthesized using different methods, and the measurements were obtained at different pressures it is likely that the phase, or mixture of phases, made in the two studies are not the same.
IV.2 Mixed Molecular and Atomic Hydrogen
Many of the alkali metal, alkaline earth and rare earth polyhydrides that are stable under pressure possess both atomic and molecular hydrogen. To better understand the electronic structure of phases containing these structural motifs, let us assume a full transfer of the metals’ valence electrons to hydrogen, yielding H- atoms, and H molecules. Phases with are expected to metallize as a result of pressure induced broadening of the H- and H2 anti-bonding based bands Zurek et al. (2009). As a result, they generally do not have a high DOS at , and they are therefore not expected to be good superconductors Zurek (2017b); Shamp and Zurek (2017). Phases with , on the other hand, are metallic because of partial filling of the H2 -bands. As a result, they are likely to be good metals with the potential for high temperature superconductivity.
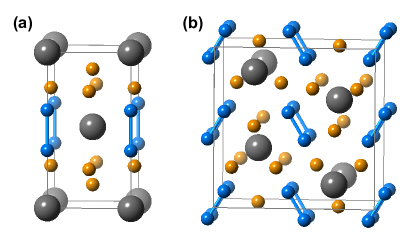
One example of the former is the symmetry CaH4 (or Ca2+(H-)2H2) structure illustrated in Fig. 4(a), which was first predicted via CSP Wang et al. (2012b), and recently synthesized in a laser heated DAC Mishra et al. (2018). At 120 GPa a Bader analysis, which typically underestimates the charge transfer, yielded values of H-0.5 and H. The H-H bond length at 120 GPa, 0.81 Å, was found to be 33% larger than in H2 at the same pressure. Theoretical calculations revealed that the weakening of the H-H bond in CaH4 resembles the mechanism leading to anomalously long H-H bonds in Kubas-like molecular complexes wherein an H2 molecule binds side-on to the metal center Mishra et al. (2018). In both the molecular and the high pressure systems donation of electrons from H2 to a vacant metal d-orbital, and d back-donation weaken the H-H bond. Because both the PBE-GGA and hybrid HSE06 functionals predicted that CaH4 would be a weak metal at this pressure, its was not computed.
CSP calculations have also shown that isotypic SrH4 Hooper et al. (2014); Wang et al. (2015) and MgH4 Abe (2018) phases are stable under pressure. Whereas SrH4 did not metallize within its range of stability, MgH4 did, at least within PBE. Table 2 shows that the of MgH4 at 255 GPa was estimated to be close to the boiling point of liquid nitrogen . However, because this system metallizes as a result of pressure induced band broadening, PBE likely overestimates its DOS at , and therefore its . A BaH4 stoichiometry did not lie on the convex hull Hooper et al. (2013).
DFT-based CSP searches have predicted that this same symmetry structure will be stable for many of the rare earth metal tetrahydrides under pressure: ScH4 Abe (2017); Qian et al. (2017); Ye et al. (2018); Peng et al. (2017), YH4 Peng et al. (2017), LaH4 Liu et al. (2017b), CeH4 Peng et al. (2017) and PrH4 Peng et al. (2017). Moreover, theoretical studies that compared the enthalpies of a set of candidate structures, which were chosen based upon structural analogy, suggest that isotypic NdH4, PmH4, SmH4, EuH4, GdH4, TbH4, DyH4, HoH4, ErH4, TmH4, and LuH4 phases lie on the convex hull at experimentally attainable pressures Peng et al. (2017). CSP searches also predicted that ZrH4 would assume this structure Abe (2018).
Out of all of the stable -block symmetry tetrahydrides, only ScH4 and YH4 were estimated to have s above the boiling point of liquid nitrogen, see Table 2. Assuming a +3 oxidation state for the metal atom yields a formula of M3+(H-)2H for these systems. Electron transfer into the H2 -bands yields a high DOS at , as expected. The nearest neighbor H-H distances measured 1.21 Å at 250 GPa in ScH4 Ye et al. (2018), and 1.39 Å at 120 GPa in YH4 Li et al. (2015). The long intramolecular H-H bond lengths, which are conducive to a large electron phonon coupling, have two origins. First, because these are -elements the Kubas-like mechanism responsible for the elongation of the H2 bond within CaH4 is likely to be important. Secondly, charge is donated from the electropositive element into the H2 -bands, thereby weakening and lengthening the H-H bond.
An isotypic ZrH4 phase was estimated to have a of 47 K at 230 GPa Abe (2018). At this pressure the nearest neighbor H-H distance, 1.21 Å, and electron phonon coupling constant, , was similar to the values computed for ScH4 and YH4. The of an symmetry LaH4 phase was estimated to be 5-10 K at 300 GPa Liu et al. (2017b). Its decreased as compared to ScH4 and YH4 is likely a result of the lower frequency vibrations, which stem from the presence of the heavier metal atom. For similar reasons, the heavier symmetry tetrahydrides are not expected to be superconducting at high temperatures, and their s were therefore not computed Peng et al. (2017).
| System | (GPa) | (K) | ||
|---|---|---|---|---|
| MgH4 | 255 | 0.88 | 0.13 | 81 b, Abe (2018) |
| ScH4 | 120 | 1.68 | 0.10 | 92 a,Ye et al. (2018), 163 b, Ye et al. (2018) |
| 195 | 0.89 | 0.13-0.10 | 67-81 a, Abe (2017) | |
| 200 | 0.99 | 0.10 | 98 a, Qian et al. (2017) | |
| YH4 | 120 | 1.01 | 0.13-0.10 | 84-95 b, Li et al. (2015) |
| ScH7 | 300 | 1.84 | 0.10 | 169 a,Ye et al. (2018), 213 b, Ye et al. (2018) |
a was calculated using the Allen-Dynes modified McMillan equation, Eq. 6.
b was calculated by solving the Eliashberg equations numerically.
Another phase with mixed molecular and atomic hydrogen that was predicted to be superconducting at high temperatures is the ScH7 structure shown in Fig. 4(b) Ye et al. (2018). Because this system contains three atomic and two molecular hydrogen atoms per scandium atom, at first glance one would guess that its chemical formula can be written as Sc3+(H-)3(H2)2. At 300 GPa the H-H bond, which measures 0.956 Å, is significantly elongated relative to that of molecular H2 at this pressure. In contrast to the results for CaH4, the computed average Bader charges on the “atomic” and “molecular” hydrogen atoms were nearly identical, -0.186 and -0.138, respectively, suggesting that the formula given above does not adequately describe the electronic structure of ScH7. Moreover, the substantial charge transfer to molecular hydrogen is consistent with its long H-H bond, the high DOS at , and the large electron phonon coupling, which ultimately both yield a sizeable .
IV.3 Other Unique Hydrogenic Motifs
In addition to the aforementioned systems whose hydrogenic lattices were either clathrate-like or possessed molecular and atomic hydrogen, four more phases, with quite unusual hydrogenic motifs, were computed to be superconducting up to high temperatures. Comparison of Tables 1 and 2 with Table 3 reveals that their values were generally intermediate to the other two classes of systems described above.
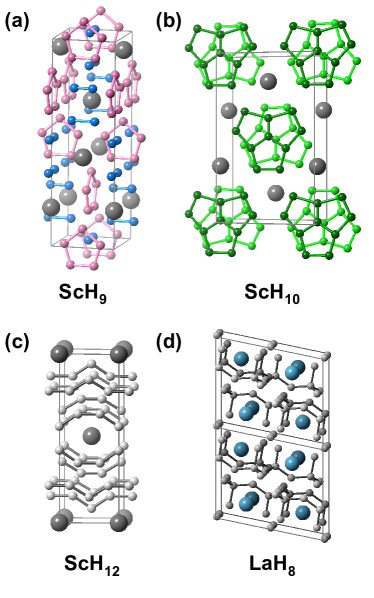
ScH9, shown in Fig. 5(a), was predicted to be stable in a narrow pressure range of 285-325 GPa when the ZPE was included Ye et al. (2018). This phase contained 1-dimensional chains of edge-sharing H pentagons, as well as molecular H units, with the shortest H-H distance being 0.90 Å at 300 GPa. The hydrogenic lattice of a ScH10 phase Peng et al. (2017); Ye et al. (2018) consisted solely of these same “H5” pentagonal motifs, their edges shared so as to form discrete H molecular units, as illustrated in Fig. 5(b). One way to describe the hydrogenic lattice of the ScH12 structure shown in Fig. 5(c) would be of H “octagons” and H “pentagons”, where six edges of each octagon are connected by pentagons and the other edges opposite each other are connected by another octagon, thereby forming a 1-dimensional framework. The ZPE-corrected enthalpies at 0 K predicted that ScH10 and ScH12 would be thermodynamically stable between 220-285 GPa and above 325 GPa, respectively Ye et al. (2018).
Finally, the LaH8 stoichiometry was found to lie on the 150 GPa and 300 GPa convex hulls Liu et al. (2017b). At 300 GPa the 2-dimensional hydrogenic lattice of this symmetry phase, shown in Fig. 5(d), consisted of edge-sharing puckered dodecagons wherein every second hydrogen atom was capped so that it became four-fold coordinate with H-H-H angles that deviated somewhat from those found in a perfect tetrahedron, 104.7∘-116.3∘. In addition, this phase contained hydrogen atoms, which did not appear to be bonded to any other hydrogen atoms, that fell between the puckered layers.
| System | (GPa) | (K) | ||
|---|---|---|---|---|
| ScH9 | 300 | 1.94 | 0.10 | 163 a, Ye et al. (2018), 233 b, Ye et al. (2018) |
| ScH10 | 250 | 1.17 | 0.10 | 120 a, Ye et al. (2018), 143 b, Ye et al. (2018) |
| ScH12 | 350 | 1.23 | 0.10 | 141 a, Ye et al. (2018), 194 b, Ye et al. (2018) |
| LaH8 | 300 | 1.12 | 0.13-0.10 | 114-131 a, Liu et al. (2017b), 138-150 b, Liu et al. (2017b) |
a was calculated using the Allen-Dynes modified McMillan equation, Eq. 6.
b was calculated by solving the Eliashberg equations numerically.
Even though a BeH2 phase was predicted to have a of 97.0 K at 365 GPa, it is not discussed here since the hydrogen atoms within it were not bonded to each other Yu et al. (2014). CSP searches showed that BeHn with are not thermodynamically stable with respect to decomposition into the classic BeH2 hydride and H2 up to 200 GPa Hooper et al. (2013). We also mention that an symmetry ZrH4 phase that was also only compromised of atomistic hydrogen (nearest neighbor H-H distance of 1.38 Å) was predicted to have a of 78.0 K at 140 GPa Abe (2018). And that quite high values, ranging from 100-225 K, have also been predicted for some actinide polyhydrides with interesting structural motifs, for example AcH8 and AcH16, which become stable above 100 GPa, or a metastable AcH12 phase Semenok et al. (2018b).
V Outlook
Crystal structure prediction techniques coupled with first-principles calculations have found a number of superconducting hydride phases that are either stable or metastable at pressures that can be achieved within diamond anvil cells. Binary hydrides with remarkably high estimated superconducting critical temperatures, s, were predicted within two regions of the periodic table: the -block elements and the alkaline earth and rare earths. Superconductivity up to 203 K was experimentally confirmed in the first region within a sample of hydrogen sulfide that was compressed to 150 GPa Drozdov et al. (2015). This is the system with the record highest confirmed to date. Recent experiments measuring s of 215 K Drozdov et al. (2018) or 260-280 K Somayazulu et al. (2018) in the lanthanum/hydrogen system under pressure suggest that the of hydride phases in the second region may even surpass the record attributed to H3S, and tempt with the lure of room temperature superconductivity.
Experimental techniques to synthesize high hydride phases under pressures have made remarkable advances in the last years Bi et al. (2018). We therefore expect the experimental search for superconductivity in these systems will accelerate, with the predictions from theory used as a guide. Given what has come before Zurek and Grochala (2015), it is likely that a feedback loop between theory and experiment will be required to characterize the phases that have been made, and to gain an understanding of their electronic structure and properties.
The reason why hydrides with clathrate-based hydrogenic lattices are estimated to have such high values can be traced back to their large density of states at the Fermi level, which is derived primarily from hydrogen-like states, and the pronounced impact on the electronic structure that results from the motions of the atoms comprising their hydrogenic lattices. It has been suggested that perturbing hydrogen atoms within quasi-molecular units such as H would not have such a large impact on the electronic structure, thereby resulting in a smaller electron-phonon coupling, with concomitantly lower values Shamp and Zurek (2017); Zhang et al. (2017). In accordance with this reasoning, the predicted s for the MH4 phases containing mixed molecular and atomic hydrogen are generally lower than those of the clathrate-like systems as shown in this Perspective.
However, this cannot be the full story because quite high values have been calculated for a few of the scandium polyhydrides discussed herein whose hydrogenic lattices contain quasi-molecular units. Moreover, the factors driving the stability of these phases are not well understood, and it remains a grand challenge to find ways to quench these systems to pressures that can be easily achieved industrially. There is still much to be learned in this exciting field of research.
Acknowledgments
We acknowledge the NSF (DMR-1505817) for financial, and the Center for Computational Research (CCR) at SUNY Buffalo for computational support. T. B. thanks the US Department of Energy, National Nuclear Security Administration, through the Capital-DOE Alliance Center under Cooperative Agreement DE-NA0003858 for financial support. We thank Prof. Yansun Yao from the University of Saskatchewan and Dr. Peng Feng from Luoyang Normal University for useful comments.
References
- Wigner and Huntington (1935) E. Wigner and H. B. Huntington, J. Chem. Phys. 3, 764 (1935).
- Narayana et al. (1998) C. Narayana, H. Luo, J. Orloff, and A. L. Ruoff, Nature 393, 46 (1998).
- Loubeyre, Occelli, and LeToullec (2002) P. Loubeyre, F. Occelli, and R. LeToullec, Nature 416, 613 (2002).
- Zha et al. (2013) C. S. Zha, Z. Liu, M. Ahart, R. Boehler, and R. J. Hemley, Phys. Rev. Lett. 110, 217402 (2013).
- Eremets and Troyan (2011) M. I. Eremets and I. A. Troyan, Nat. Mater. 10, 927 (2011).
- Howie et al. (2012a) R. T. Howie, C. L. Guillaume, T. Scheler, A. F. Goncharov, and E. Gregoryanz, Phys. Rev. Lett. 108, 125501 (2012a).
- Dalladay-Simpson, Howie, and Gregoryanz (2016) P. Dalladay-Simpson, R. T. Howie, and E. Gregoryanz, Nature 529, 63 (2016).
- Zha, Liu, and Hemley (2012) C. S. Zha, Z. Liu, and R. J. Hemley, Phys. Rev. Lett. 108, 146402 (2012).
- Howie et al. (2012b) R. T. Howie, T. Scheler, C. L. Guillaume, and E. Gregoryanz, Phys. Rev. B 86, 214104 (2012b).
- Goncharov et al. (2013) A. F. Goncharov, J. S. Tse, H. Wang, J. Yang, V. V. Struzhkin, R. T. Howie, and E. Gregoryanz, Phys. Rev. B 87, 024101 (2013).
- Eremets, Troyan, and Drozdov (2016) M. I. Eremets, I. A. Troyan, and A. P. Drozdov, arXiv:1601.04479 (2016).
- Dias and Silvera (2017) R. P. Dias and I. F. Silvera, Science 355, 715 (2017).
- Loubeyre, Occelli, and Dumas (2017) P. Loubeyre, F. Occelli, and P. Dumas, arXiv:1702.07192 (2017).
- Eremets and Drozdov (2017) M. I. Eremets and A. P. Drozdov, arXiv:1702.05125 (2017).
- Liu et al. (2017a) X. D. Liu, P. Dalladay-Simpson, R. T. Howie, B. Li, and E. Gregoryanz, Science 357, eaan2286 (2017a).
- Ashcroft (1968) N. W. Ashcroft, Phys. Rev. Lett. 21, 1748 (1968).
- Cudazzo et al. (2008) P. Cudazzo, G. Profeta, A. Sanna, A. Floris, A. Continenza, S. Massidda, and E. K. U. Gross, Phys. Rev. Lett. 100, 257001 (2008).
- McMahon and Ceperley (2011) J. M. McMahon and D. M. Ceperley, Phys. Rev. B 84, 144515 (2011).
- Ashcroft (2004a) N. W. Ashcroft, Phys. Rev. Lett. 92, 187002 (2004a).
- Ashcroft (2004b) N. W. Ashcroft, J. Phys.: Condens. Matter 16, S945 (2004b).
- Feng et al. (2006) J. Feng, W. Grochala, T. Jaroń, R. Hoffmann, A. Bergara, and N. W. Ashcroft, Phys. Rev. Lett. 96, 017006 (2006).
- Pickard and Needs (2006) C. J. Pickard and R. J. Needs, Phys. Rev. Lett. 97, 045504 (2006).
- Yao et al. (2007) Y. Yao, J. S. Tse, Y. Ma, and K. Tanaka, EPL 78, 37003 (2007).
- Degtyareva et al. (2007) O. Degtyareva, M. M. Canales, A. Bergara, X.-J. Chen, Y. Song, V. V. Struzhkin, H.-k. Mao, and R. J. Hemley, Phys. Rev. B 76, 064123 (2007).
- Chen et al. (2008) X.-J. Chen, J.-L. Wang, V. V. Struzhkin, H.-k. Mao, R. J. Hemley, and H.-Q. Lin, Phys. Rev. Lett. 101, 077002 (2008).
- Kim et al. (2008) D. Y. Kim, R. H. Scheicher, S. Lebègue, J. Prasongkit, B. Arnaud, M. Alouani, and R. Ahuja, Proc. Natl. Acad. Sci. U.S.A. 105, 16454 (2008).
- Martinez-Canales et al. (2009) M. Martinez-Canales, A. R. Oganov, Y. Ma, Y. Yan, A. O. Lyakhov, and A. Bergara, Phys. Rev. Lett. 102, 087005 (2009).
- Yan, Gong, and Zong (2010) Y. Yan, J. Gong, and Z.-G. Zong, Chin. Phys. Lett. 27, 017401 (2010).
- Zhang et al. (2015a) H. Zhang, X. Jin, Y. Lv, Q. Zhuang, Y. Liu, Q. Lv, K. Bao, D. Li, B. Liu, and T. Cui, Sci. Rep. 5, 8845 (2015a).
- Cui et al. (2015) W. Cui, J. Shi, H. Liu, Y. Yao, H. Wang, T. Iitaka, and Y. Ma, Sci. Rep. 5, 13039 (2015).
- Eremets et al. (2008) M. I. Eremets, I. A. Trojan, S. A. Medvedev, J. S. Tse, and Y. Yao, Science 319, 1506 (2008).
- Martinez-Canales et al. (2006) M. Martinez-Canales, A. Bergara, J. Feng, and W. Grochala, J. Phys. Chem. Solids 67, 2095 (2006).
- Li, Yu, and Jin (2007) Z. Li, W. Yu, and C. Jin, Solid State Commun. 143, 353 (2007).
- Gao et al. (2008) G. Gao, A. R. Oganov, A. Bergara, M. Martinez-Canales, T. Cui, T. Iitaka, Y. Ma, and G. Zou, Phys. Rev. Lett. 101, 107002 (2008).
- Zhang et al. (2010) C. Zhang, X.-J. Chen, Y.-L. Li, V. V. Struzhkin, H.-K. Mao, R.-Q. Zhang, and H.-Q. Lin, EPL 90, 66006 (2010).
- Zhang et al. (2015b) H. Zhang, X. Jin, Y. Lv, Q. Zhuang, Q. Lv, Y. Liu, K. Bao, D. Li, B. Liu, and T. Cui, Phys. Chem. Chem. Phys. 17, 27630 (2015b).
- Pickard and Needs (2007) C. J. Pickard and R. J. Needs, Phys. Rev. B 76, 144114 (2007).
- Goncharenko et al. (2008) I. Goncharenko, M. I. Eremets, M. Hanfland, J. S. Tse, M. Amboage, Y. Yao, and I. A. Trojan, Phys. Rev. Lett. 100, 045504 (2008).
- Kim, Scheicher, and Ahuja (2008) D. Y. Kim, R. H. Scheicher, and R. Ahuja, Phys. Rev. B 78, 100102(R) (2008).
- Geshi and Fukazawa (2013) M. Geshi and T. Fukazawa, Physica B 411, 154 (2013).
- Zurek and Grochala (2015) E. Zurek and W. Grochala, Phys. Chem. Chem. Phys. 17, 2917 (2015).
- Zurek (2017a) E. Zurek, in Handbook of Solid State Chemistry, Vol. 5, edited by R. Dronskowski (Wiley-VCH Verlag GmbH & Co, 2017) pp. 571–605.
- Hermann (2017) A. Hermann, in Reviews in Computational Chemistry, edited by A. L. Parrill and K. B. Lipkowitz (John Wiley & Sons, Inc., Hoboken, New Jersey, 2017) pp. 1–41.
- Strobel, Somayazulu, and Hemley (2009) T. A. Strobel, M. Somayazulu, and R. J. Hemley, Phys. Rev. Lett. 103, 065701 (2009).
- Wang et al. (2009) S. Wang, H.-k. Mao, X.-J. Chen, and W. L. Mao, Proc. Natl. Acad. Sci. U.S.A. 106, 14763 (2009).
- Yao and Klug (2010) Y. Yao and D. D. Klug, Proc. Natl. Acad. Sci. U.S.A. 107, 20893 (2010).
- Yim, Tse, and Iitaka (2010) W.-L. Yim, J. S. Tse, and T. Iitaka, Phys. Rev. Lett. 105, 215501 (2010).
- Michel, Liu, and Ozolins (2010) K. Michel, Y. Liu, and V. Ozolins, Phys. Rev. B 82, 174103 (2010).
- Shanavas, Poswal, and Sharma (2012) K. V. Shanavas, H. K. Poswal, and S. M. Sharma, Solid State Commun. 152, 873 (2012).
- Li et al. (2010) Y. Li, G. Gao, Y. Xie, Y. Ma, T. Cui, and G. Zou, Proc. Natl. Acad. Sci. U.S.A. 107, 15708 (2010).
- Zurek et al. (2009) E. Zurek, R. Hoffmann, N. W. Ashcroft, A. R. Oganov, and A. O. Lyakhov, Proc. Natl. Acad. Sci. U.S.A. 106, 17640 (2009).
- Pépin et al. (2015) C. Pépin, P. Loubeyre, F. Occelli, and P. Dumas, Proc. Natl. Acad. Sci. U.S.A. 112, 7673 (2015).
- not (a) The manuscripts where most of the s were obtained are either referenced in this manuscript or in Ref. Bi et al. (2018), with the exception of Ref. Shao et al. (2018) (AtHn) and Ref. Ishikawa et al. (2017) (ArHn).
- Zurek (2017b) E. Zurek, Comments Inorg. Chem. 37, 78 (2017b).
- Shamp and Zurek (2017) A. Shamp and E. Zurek, Nov. Supercond. Mater. 3, 14 (2017).
- Zhang et al. (2017) L. Zhang, Y. Wang, J. Lv, and Y. Ma, Nature Rev. Mater. 2, 17005 (2017).
- Duan et al. (2016) D. Duan, Y. Liu, Y. Ma, Z. Shao, B. Liu, and T. Cui, Natl. Sci. Rev. 4, 121 (2016).
- Wang et al. (2017) H. Wang, X. Li, G. Gao, Y. Li, and Y. Ma, Wiley Interdiscip. Rev. Comput. Mol. Sci. 8, 1 (2017).
- Struzhkin (2015) V. V. Struzhkin, Physica C 514, 77 (2015).
- Needs and Pickard (2016) R. J. Needs and C. J. Pickard, APL Mater. 4, 053210 (2016).
- Yao and Tse (2018) Y. Yao and J. S. Tse, Chem. Eur. J 24, 1769 (2018).
- Bi et al. (2018) T. Bi, N. Zarifi, T. Terpstra, and E. Zurek, arXiv:1806.00163 (2018).
- Semenok et al. (2018a) D. V. Semenok, I. A. Kruglov, A. G. Kvashnin, and A. R. Oganov, arXiv:1806.00865 (2018a).
- not (b) The high values predicted for FeH5 Majumdar et al. (2017); Kvashnin et al. (2018) are not included, since subsequent studies Heil, Bachelet, and Boeri (2018); Zarifi et al. (2018) have questioned these results.
- Drozdov et al. (2015) A. P. Drozdov, M. I. Eremets, I. A. Troyan, V. Ksenofontov, and S. I. Shylin, Nature 525, 73 (2015).
- Mazin (2015) I. I. Mazin, Nature 525, 40 (2015).
- Li et al. (2014) Y. Li, J. Hao, H. Liu, Y. Li, and Y. Ma, J. Chem. Phys. 140, 174712 (2014).
- Duan et al. (2014) D. Duan, Y. Liu, F. Tian, D. Li, X. Huang, Z. Zhao, H. Yu, B. Liu, W. Tian, and T. Cui, Sci. Rep. 4, 6968 (2014).
- Einaga et al. (2016) M. Einaga, M. Sakata, T. Ishikawa, K. Shimizu, M. I. Eremets, A. P. Drozdov, I. A. Troyan, N. Hirao, and Y. Ohishi, Nat. Phys. 12, 835 (2016).
- Troyan et al. (2016) I. Troyan, A. Gavriliuk, R. Rüffer, A. Chumakov, A. Mironovich, I. Lyubutin, D. Perekalin, A. P. Drozdov, and M. I. Eremets, Science 351, 1303 (2016).
- Capitani et al. (2017) F. Capitani, B. Langerome, J. B. Brubach, P. Roy, A. Drozdov, M. I. Eremets, E. J. Nicol, J. P. Carbotte, and T. Timusk, Nat. Phys. 13, 859 (2017).
- Goncharov et al. (2017) A. F. Goncharov, S. S. Lobanov, V. B. Prakapenka, and E. Greenberg, Phys. Rev. B 95, 140101(R) (2017).
- Guigue, Marizy, and Loubeyre (2017) B. Guigue, A. Marizy, and P. Loubeyre, Phys. Rev. B 95, 020104(R) (2017).
- Flores-Livas, Sanna, and Gross (2016) J. A. Flores-Livas, A. Sanna, and E. K. U. Gross, Eur. Phys. J. B. 89, 1 (2016).
- Papaconstantopoulos et al. (2015) D. A. Papaconstantopoulos, B. M. Klein, M. J. Mehl, and W. E. Pickett, Phys. Rev. B 91, 184511 (2015).
- Bernstein et al. (2015) N. Bernstein, C. S. Hellberg, M. D. Johannes, I. I. Mazin, and M. J. Mehl, Phys. Rev. B 91, 060511(R) (2015).
- Duan et al. (2015) D. Duan, X. Huang, F. Tian, D. Li, H. Yu, Y. Liu, Y. Ma, B. Liu, and T. Cui, Phys. Rev. B 91, 180502(R) (2015).
- Errea et al. (2015) I. Errea, M. Calandra, C. J. Pickard, J. Nelson, R. J. Needs, Y. Li, H. Liu, Y. Zhang, Y. Ma, and F. Mauri, Phys. Rev. Lett. 114, 157004 (2015).
- Akashi et al. (2015) R. Akashi, M. Kawamura, S. Tsuneyuki, Y. Nomura, and R. Arita, Phys. Rev. B 91, 224513 (2015).
- Errea et al. (2016) I. Errea, M. Calandra, C. J. Pickard, J. R. Nelson, R. J. Needs, Y. Li, H. Liu, Y. Zhang, Y. Ma, and F. Mauri, Nature 532, 81 (2016).
- Quan and Pickett (2016) Y. Quan and W. E. Pickett, Phys. Rev. B 93, 104526 (2016).
- Sano et al. (2016) W. Sano, T. Koretsune, T. Tadano, R. Akashi, and R. Arita, Phys. Rev. B 93, 094525 (2016).
- Ortenzi, Cappelluti, and Pietronero (2016) L. Ortenzi, E. Cappelluti, and L. Pietronero, Phys. Rev. B 94, 064507 (2016).
- Gor’kov and Kresin (2016) L. P. Gor’kov and V. Z. Kresin, Sci. Rep. 6, 25608 (2016).
- Goncharov et al. (2016) A. F. Goncharov, S. S. Lobanov, I. Kruglov, X. M. Zhao, X. J. Chen, A. R. Oganov, Z. Konôpková, and V. B. Prakapenka, Phys. Rev. B 93, 174105 (2016).
- Bussmann-Holder et al. (2017) A. Bussmann-Holder, J. Köhler, A. Simon, M. Whangbo, and A. Bianconi, J. Supercond. Nov. Magn. 30, 151 (2017).
- Durajski (2016) A. P. Durajski, Sci. Rep. 6, 38570 (2016).
- Jarlborg and Bianconi (2016) T. Jarlborg and A. Bianconi, Sci. Rep. 6, 24816 (2016).
- Szczęśniak and Durajski (2017) R. Szczęśniak and A. P. Durajski, Solid State Commun. 249, 30 (2017).
- Azadi and Kühne (2017) S. Azadi and T. D. Kühne, J. Chem. Phys. 146, 084503 (2017).
- Durajski, Szczęśniak, and Li (2015) A. P. Durajski, R. Szczęśniak, and Y. Li, Physica C 515, 1 (2015).
- Arita et al. (2017) R. Arita, T. Koretsune, S. Sakai, R. Akashi, Y. Nomura, and W. Sano, Adv. Mater. 29, 1602421 (2017).
- Gordon et al. (2016) E. E. Gordon, K. Xu, H. Xiang, A. Bussmann-Holder, R. K. Kremer, A. Simon, J. Köhler, and M. H. Whangbo, Angew. Chem. Int. Ed. 55, 3682 (2016).
- Majumdar, Tse, and Yao (2017) A. Majumdar, J. S. Tse, and Y. Yao, Angew. Chem. Int. Ed. 56, 11390 (2017).
- Akashi et al. (2016) R. Akashi, W. Sano, R. Arita, and S. Tsuneyuki, Phys. Rev. Lett. 117, 075503 (2016).
- Li et al. (2016) Y. Li, L. Wang, H. Liu, Y. Zhang, J. Hao, C. J. Pickard, J. R. Nelson, R. J. Needs, W. Li, Y. Huang, I. Errea, M. Calandra, F. Mauri, and Y. Ma, Phys. Rev. B 93, 020103(R) (2016).
- Ishikawa et al. (2016) T. Ishikawa, A. Nakanishi, K. Shimizu, H. Katayama-Yoshida, T. Oda, and N. Suzuki, Sci. Rep. 6, 23160 (2016).
- Heil and Boeri (2015) C. Heil and L. Boeri, Phys. Rev. B 92, 060508(R) (2015).
- Ge, Zhang, and Yao (2016) Y. Ge, F. Zhang, and Y. Yao, Phys. Rev. B 93, 224513 (2016).
- Bianconi and Jarlborg (2015) A. Bianconi and T. Jarlborg, EPL 112, 37001 (2015).
- Eremets and Drozdov (2016) M. I. Eremets and A. P. Drozdov, Phys. -Usp. 59, 1154 (2016).
- Einaga et al. (2017) M. Einaga, M. Sakata, A. Masuda, K. Shimizu, A. Drozdov, M. Eremets, S. Kawaguchi, N. Hirao, and Y. Ohishi, Jpn. J. Appl. Phys. 56, 05FA13 (2017).
- Drozdov et al. (2018) A. P. Drozdov, V. S. Minkov, S. P. Besedin, P. P. Kong, M. A. Kuzovnikov, D. A. Knyazev, and M. I. Eremets, arXiv:1808.07039 (2018).
- Somayazulu et al. (2018) M. Somayazulu, M. Ahart, A. K. Mishra, Z. M. Geballe, M. Baldini, Y. Meng, V. V. Struzhkin, and R. J. Hemley, arXiv:1808.07695 (2018).
- Hemley (2000) R. J. Hemley, Annu. Rev. Phys. Chem. 51, 763 (2000).
- Song (2013) Y. Song, Phys. Chem. Chem. Phys. 15, 14524 (2013).
- Grochala et al. (2007) W. Grochala, R. Hoffmann, J. Feng, and N. W. Ashcroft, Angew. Chem. Int. Ed. 46, 3620 (2007).
- Goncharov, Howie, and Gregoryanz (2013) A. F. Goncharov, R. T. Howie, and E. Gregoryanz, Low Temp. Phys. 39, 402 (2013).
- Bhardwaj and Singh (2012) P. Bhardwaj and S. Singh, Cent. Eur. J. Chem. 10, 1391 (2012).
- Dubrovinsky and Dubrovinskaia (2013) L. Dubrovinsky and N. Dubrovinskaia, in Comprehensive Inorganic Chemistry II (Second Edition): From Elements to Applications, Vol. 2 (Elsevier, 2013) pp. 223–239.
- McMillan (2013) P. F. McMillan, in Comprehensive Inorganic Chemistry II (Second Edition): From Elements to Applications, Vol. 2 (Elsevier, 2013) pp. 17–46.
- Klug and Yao (2011) D. D. Klug and Y. Yao, Phys. Chem. Chem. Phys. 13, 16999 (2011).
- Naumov and Hemley (2014) I. I. Naumov and R. J. Hemley, Acc. Chem. Res. 47, 3551 (2014).
- Ma et al. (2009) Y. Ma, M. Eremets, A. R. Oganov, Y. Xie, I. Trojan, S. Medvedev, A. O. Lyakhov, M. Valle, and V. Prakapenka, Nature 458, 182 (2009).
- Dong et al. (2017) X. Dong, A. R. Oganov, A. F. Goncharov, E. Stavrou, S. Lobanov, G. Saleh, G. R. Qian, Q. Zhu, C. Gatti, V. L. Deringer, R. Dronskowski, X. F. Zhou, V. B. Prakapenka, Z. Konopkova, I. A. Popov, A. I. Boldyrev, and H. T. Wang, Nat. Chem. 9, 440 (2017).
- Liu et al. (2018a) Z. Liu, J. Botana, A. Hermann, E. Zurek, D. Yan, H. Lin, and M. Miao, Nat. Commun. 9, 951 (2018a).
- Struzhkin et al. (2016) V. V. Struzhkin, D. Y. Kim, E. Stavrou, T. Muramatsu, H. k. Mao, C. J. Pickard, R. J. Needs, V. B. Prakapenka, and A. F. Goncharov, Nat. Commun. 7, 12267 (2016).
- Somayazulu et al. (2010) M. Somayazulu, P. Dera, A. F. Goncharov, S. A. Gramsch, P. Liermann, W. Yang, Z. Liu, H. K. Mao, and R. J. Hemley, Nat. Chem. 2, 50 (2010).
- Pépin et al. (2017) C. M. Pépin, G. Geneste, A. Dewaele, M. Mezouar, and P. Loubeyre, Science 357, 382 (2017).
- Woodley and Catlow (2008) S. M. Woodley and R. Catlow, Nat. Mater. 7, 937 (2008).
- Schön, Doll, and Jansen (2010) J. C. Schön, K. Doll, and M. Jansen, Phys. Status Solidi B 247, 23 (2010).
- Rossi and Ferrando (2009) G. Rossi and R. Ferrando, J. Phys.: Condens. Matter 21, 084208 (2009).
- Wang and Ma (2014) Y. Wang and Y. Ma, J. Chem. Phys. 140, 040901 (2014).
- Pickard and Needs (2009) C. J. Pickard and R. J. Needs, Phys. Status Solidi B 246, 536 (2009).
- Revard, Tipton, and Hennig (2014) B. C. Revard, W. W. Tipton, and R. G. Hennig (Springer Berlin Heidelberg, 2014) pp. 181–222.
- Oganov (2011) A. R. Oganov, ed., Modern Methods of Crystal Structure Prediction (Wiley-VCH, 2011).
- Wales (2003) D. J. Wales, Energy Landscapes: Applications to Clusters, Biomolecules and Glasses (Cambridge: Cambridge University Press, 2003).
- Zurek (2016) E. Zurek, in Reviews in Computational Chemistry, Vol. 29, edited by A. L. Parrill and K. B. Lipkowitz (John Wiley & Sons, Inc., Hoboken, New Jersey, 2016) pp. 274–326.
- Oganov, Lyakhov, and Valle (2011) A. R. Oganov, A. O. Lyakhov, and M. Valle, Acc. Chem. Res. 44, 227 (2011).
- Jansen (2015) M. Jansen, Adv. Mater. 27, 3229 (2015).
- Perdew, Burke, and Ernzerhof (1996) J. P. Perdew, K. Burke, and M. Ernzerhof, Phys. Rev. Lett. 77, 3865 (1996).
- Krukau et al. (2006) A. V. Krukau, O. A. Vydrov, A. F. Izmaylov, and G. E. Scuseria, J. Chem. Phys. 125, 224106 (2006).
- Adamo and Barone (1999) C. Adamo and V. Barone, J. Chem. Phys. 110, 6158 (1999).
- Liu, Cui, and Ma (2012) H. Liu, W. Cui, and Y. Ma, J. Chem. Phys. 137, 184502 (2012).
- Teweldeberhan, DuBois, and Bonev (2012) A. M. Teweldeberhan, J. L. DuBois, and S. A. Bonev, Phys. Rev. B 86, 064104 (2012).
- Ochoa-Calle, Zicovich-Wilson, and Ramirez-Solis (2015) A. J. Ochoa-Calle, C. M. Zicovich-Wilson, and A. Ramirez-Solis, Phys. Rev. B 92, 085148 (2015).
- Kurzydlowski and Zaleski-Ejgierd (2016a) D. Kurzydlowski and P. Zaleski-Ejgierd, Phys. Chem. Chem. Phys. 18, 2309 (2016a).
- Kurzydlowski and Zaleski-Ejgierd (2016b) D. Kurzydlowski and P. Zaleski-Ejgierd, Sci. Rep. 6, 36049 (2016b).
- Hermann et al. (2016) A. Hermann, M. Derzsi, W. Grochala, and R. Hoffmann, Inorg. Chem. 55, 1278 (2016).
- Komelj and Krakauer (2015) M. Komelj and H. Krakauer, Phys. Rev. B 92, 205125 (2015).
- Boates and Bonev (2011) B. Boates and S. A. Bonev, Phys. Rev. B 83, 174114 (2011).
- Santra et al. (2011) B. Santra, J. Klimeš, D. Alfè, A. Tkatchenko, B. Slater, A. Michaelides, R. Car, and M. Scheffler, Phys. Rev. Lett. 107, 185701 (2011).
- Santra et al. (2013) B. Santra, J. Klimeš, A. Tkatchenko, D. Alfè, B. Slater, A. Michaelides, R. Car, and M. Scheffler, J. Chem. Phys. 139, 154702 (2013).
- Kurzydłowski (2018) D. Kurzydłowski, Crystals 8, 140 (2018).
- Wu et al. (2014) S. Q. Wu, M. Ji, C. Z. Wang, M. C. Nguyen, X. Zhao, K. Umemoto, R. M. Wentzcovitch, and K. M. Ho, J. Phys.: Condens. Matter 26, 035402 (2014).
- Hooper and Zurek (2012) J. Hooper and E. Zurek, Chem. Eur. J. 18, 5013 (2012).
- Zaleski-Ejgierd, Hoffmann, and Ashcroft (2011) P. Zaleski-Ejgierd, R. Hoffmann, and N. W. Ashcroft, Phys. Rev. Lett. 107, 037002 (2011).
- Pickard, Martinez-Canales, and Needs (2012) C. J. Pickard, M. Martinez-Canales, and R. J. Needs, Phys. Rev. B 85, 214114 (2012).
- Mishra et al. (2018) A. K. Mishra, T. Muramatsu, H. Liu, Z. M. Geballe, M. Somayazulu, M. Ahart, M. Baldini, Y. Meng, E. Zurek, and R. J. Hemley, J. Phys. Chem. C 122, 19370 (2018).
- Drozdov, Eremets, and Troyan (2015) A. P. Drozdov, M. I. Eremets, and I. A. Troyan, arXiv:1508.06224 (2015).
- Zarifi et al. (2018) N. Zarifi, T. Bi, H. Liu, and E. Zurek, J. Phys. Chem. C 122, 24262 (2018).
- Wang et al. (2010) Y. Wang, J. Lv, L. Zhu, and Y. Ma, Phys. Rev. B 82, 094116 (2010).
- Wang et al. (2012a) Y. Wang, J. Lv, L. Zhu, and Y. Ma, Comput. Phys. Commun. 183, 2063 (2012a).
- Glass, Oganov, and Hansen (2006) C. W. Glass, A. R. Oganov, and N. Hansen, Comput. Phys. Commun. 175, 713 (2006).
- Lonie and Zurek (2011) D. C. Lonie and E. Zurek, Comput. Phys. Commun. 182, 372 (2011).
- Pickard and Needs (2011) C. J. Pickard and R. J. Needs, J. Phys.: Condens. Matter 23, 053201 (2011).
- Bose and Kortus (2009) S. K. Bose and J. Kortus, in Vibronic and Electron-Phonon Interactions and Their Role in Modern Chemistry and Physics, edited by T. Kato (Transworld Research Network, Kerala, India, 2009) pp. 1–62.
- Bardeen, Cooper, and Schrieffer (1957a) J. Bardeen, L. N. Cooper, and J. R. Schrieffer, Phys. Rev. 106, 162 (1957a).
- Bardeen, Cooper, and Schrieffer (1957b) J. Bardeen, L. N. Cooper, and J. R. Schrieffer, Phys. Rev. 108, 1175 (1957b).
- Eliashberg (1960) G. M. Eliashberg, Sov. Phys. JETP 11, 696 (1960).
- Lüders et al. (2005) M. Lüders, M. A. L. Marques, N. N. Lathiotakis, A. Floris, G. Profeta, L. Fast, A. Continenza, S. Massidda, and E. K. U. Gross, Phys. Rev. B 72, 024545 (2005).
- Marques et al. (2005) M. A. L. Marques, M. Lüders, N. N. Lathiotakis, G. Profeta, A. Floris, L. Fast, A. Continenza, E. K. U. Gross, and S. Massidda, Phys. Rev. B 72, 024546 (2005).
- Flores-Livas et al. (2016) J. A. Flores-Livas, M. Amsler, C. Heil, A. Sanna, L. Boeri, G. Profeta, C. Wolverton, S. Goedecker, and E. K. U. Gross, Phys. Rev. B 93, 020508(R) (2016).
- McMillan (1968) W. L. McMillan, Phys. Rev. 167, 331 (1968).
- Allen and Dynes (1975) P. B. Allen and R. C. Dynes, Phys. Rev. B 12, 905 (1975).
- Dynes (1972) R. C. Dynes, Solid State Commun. 10, 615 (1972).
- Wang et al. (2012b) H. Wang, J. S. Tse, K. Tanaka, T. Iitaka, and Y. Ma, Proc. Natl. Acad. Sci. U.S.A. 109, 6463 (2012b).
- Feng et al. (2015) X. Feng, J. Zhang, G. Gao, H. Liu, and H. Wang, RSC Adv. 5, 59292 (2015).
- Ye et al. (2018) X. Ye, N. Zarifi, E. Zurek, R. Hoffmann, and N. W. Ashcroft, J. Phys. Chem. C 122, 6298 (2018).
- Abe (2017) K. Abe, Phys. Rev. B 96, 144108 (2017).
- Peng et al. (2017) F. Peng, Y. Sun, C. J. Pickard, R. J. Needs, Q. Wu, and Y. Ma, Phys. Rev. Lett. 119, 107001 (2017).
- Li et al. (2015) Y. Li, J. Hao, H. Liu, J. S. Tse, Y. Wang, and Y. Ma, Sci. Rep. 5, 9948 (2015).
- Abe (2018) K. Abe, Phys. Rev. B 98, 134103 (2018).
- Liu et al. (2017b) H. Liu, I. I. Naumov, R. Hoffmann, N. W. Ashcroft, and R. J. Hemley, Proc. Natl. Acad. Sci. U.S.A. 114, 6990 (2017b).
- Liu et al. (2018b) H. Liu, I. I. Naumov, Z. M. Geballe, M. Somayazulu, J. S. Tse, and R. J. Hemley, Phys. Rev. B 98, 100102(R) (2018b).
- Semenok et al. (2018b) D. V. Semenok, A. G. Kvashnin, I. A. Kruglov, and A. R. Oganov, J. Phys. Chem. Lett. 9, 1920 (2018b).
- Lonie et al. (2013) D. C. Lonie, J. Hooper, B. Altintas, and E. Zurek, Phys. Rev. B 87, 054107 (2013).
- Hooper et al. (2014) J. Hooper, T. Terpstra, A. Shamp, and E. Zurek, J. Phys. Chem. C 118, 6433 (2014).
- Wang et al. (2015) Y. Wang, H. Wang, J. S. Tse, T. Iitaka, and Y. Ma, Phys. Chem. Chem. Phys. 17, 19379 (2015).
- Hooper et al. (2013) J. Hooper, B. Altintas, A. Shamp, and E. Zurek, J. Phys. Chem. C 117, 2982 (2013).
- Qian et al. (2017) S. Qian, X. Sheng, X. Yan, Y. Chen, and B. Song, Phys. Rev. B 96, 094513 (2017).
- Amri, Clarkson, and Walton (2010) M. Amri, G. J. Clarkson, and R. I. Walton, J. Phys. Chem. C 114, 6726 (2010).
- Geballe et al. (2018) Z. M. Geballe, H. Liu, A. K. Mishra, M. Ahart, M. Somayazulu, Y. Meng, M. Baldini, and R. J. Hemley, Angew. Chem. Int. Ed. 57, 688 (2018).
- Yu et al. (2014) S. Yu, Q. Zeng, A. R. Oganov, C. Hu, G. Frapper, and L. Zhang, AIP Adv. 4, 107118 (2014).
- Shao et al. (2018) Z. Shao, Y. Huang, D. Duan, Y. Ma, H. Yu, H. Xie, D. Li, F. Tian, B. Liu, and T. Cui, Phys.Chem.Chem.Phys. 20, 24783 (2018).
- Ishikawa et al. (2017) T. Ishikawa, A. Nakanishi, K. Shimizu, and T. Oda, J. Phys. Soc. Jpn. 86, 124711 (2017).
- Majumdar et al. (2017) A. Majumdar, J. S. Tse, M. Wu, and Y. Yao, Phys. Rev. B 96, 201107(R) (2017).
- Kvashnin et al. (2018) A. G. Kvashnin, I. A. Kruglov, D. V. Semenok, and A. R. Oganov, J. Phys. Chem. C 122, 4731 (2018).
- Heil, Bachelet, and Boeri (2018) C. Heil, G. B. Bachelet, and L. Boeri, Phys. Rev. B 97, 214510 (2018).