On spinodal decomposition in alnico—a transmission electron microscopy and atom probe tomography study
Abstract
Alnico is a prime example of a finely tuned nanostructure whose magnetic properties are intimately connected to magnetic annealing (MA) during spinodal transformation and subsequent lower temperature annealing (draw) cycles. Using a combination of transmission electron microscopy and atom probe tomography, we show how these critical processing steps affect the local composition and nanostructure evolution with impact on magnetic properties. The nearly 2-fold increase of intrinsic coercivity () during the draw cycle is not adequately explained by chemical refinement of the spinodal phases. Instead, increased Fe-Co phase () isolation, development of Cu-rich spheres/rods/blades and additional rod precipitation that occurs during the MA and draw, likely play a key role in enhancement. Chemical ordering of the Al-Ni-phase () and formation of Ni-rich () may also contribute. Unraveling of the subtle effect of these nano-scaled features is crucial to understanding on how to improve shape anisotropy in alnico magnets.
keywords:
Magnetic , Microstructure , Spinodal decomposition , Atom-probe tomography , TEM , STEM HAADF1 Introduction
Using an external magnetic field during heat-treatment, magnetic annealing (MA), to control materials’ microstructure has been widely studied since the 1950s [1]. MA promotes formation of texture, biases spinodally decomposed phase morphologies, promotes martensitic transformation in ferrous alloys, changes phase transformation temperatures, etc [2, 3]. Cahn showed that MA is most effective in alnico magnets at a temperature near the onset of spinodal decomposition (SD) and below the Curie temperature [4]. Alnico has recently re-attracted a large amount of interest as a near-term, non-rare-earth permanent magnetic alloy for wind power generators and electric vehicle motors [5, 6, 7]. Its lower cost and stable performance over a wide temperature range make it still irreplaceable after eighty years of development.
Unlike rare-earth based permanent magnets, coercivity in alnico is provided by shape anisotropy, instead of intrinsic magneto-crystalline anisotropy. As a result, magnetic properties of alnico strongly depend on the details of its unique microstructure: a periodically arrayed elongated Fe-Co rich () hard magnetic phase embedded in a continuous non-magnetic Ni-Al-rich () matrix, formed via SD. Achieving the optimum properties in alnico requires a well controlled and lengthy heat-treatment process, including solutionization of the alloy above , isothermal MA near its Curie temperature and subsequent lower temperature annealing (draw cycles) [1, 8, 9, 10, 11, 12]. The application of MA marks the most important cornerstone in alnico magnets’ development history. MA biases the phase’s morphology during SD and make it grow along the crystallographic direction closest to the external field [13]. The resulting anisotropic spinodal nano-structure has significantly improved coercivity () and remanence () of alnico. The biased growth is optimal only when it is performed within a narrow temperature range for a limited time. For example, the ideal morphology (in transverse cross-section) that brings optimum in higher grade alnico 8 and 9 series is a mosaic structure consisting of periodically arrayed diameter phases embedded in a continuous matrix obtained by MA at [14].
On the other hand, the microstructure and chemistry changes during the lower temperature draw process are much more subtle, although draw cycles play an equally important role in increasing in alnico. For example, our recent study showed that for alnico 8H, its coercivity was nearly doubled after drawing, compared to the MA alone [14]. More interestingly, the absolute increase during the draw-related enhancement was almost independent of the preceding MA temperature. However, the mechanism behind enhancement during draw remains surprisingly elusive and is not well understood despite the fact that drawing has been practiced for decades. Most previous understanding on draw enhancement of was based on a simplistic assumption: lower temperature annealing results in a larger composition separation and a larger magnetization difference between and phases, which increases the [1]. This assumption appears oversimplified, especially considering the recent findings which reveal an insignificant compositional variation before and after the draw [14]. This lack of understanding is mainly due to our inability to access and evaluate the very subtle nature of chemical and microstructural evolution during the draw. Revealing these subtle effects appears crucial to improve shape anisotropy in permanent magnets or reduce coercivity in soft magnetic alloys.
This study was designed to elucidate the structural and chemical evolution in alnico at different stages during heat treatment, especially during the draw process, as well as their relationship with magnetic properties. An isotropic (alnico 8H) 32.4Fe-38.1Co-12.9Ni-7.3Al-6.4Ti-3.0Cu (wt) alloy was chosen for this investigation. A combination of electron backscatter diffraction (EBSD), atom probe tomography (APT), and transmission electron microscopy (TEM) techniques were used to better discover and more precisely characterize the morphology and chemistry in SD phases. Based on our comprehensive characterization results, we discuss enhancement mechanisms beyond the conventional explanation.
2 Experimental details
2.1 Sample preparation and property measurement
Batch of pre-alloyed powder was made by gas-atomization in Ames Laboratory. Details on magnet alloy consolidation to full density by hot isostatic pressing have been reported elsewhere [15]. The resultant alloy was polycrystalline with randomly oriented grains. Center sections of the alloy were cut into diameter by cylinders. The cylindrical samples were solutionized at for in vacuum and quenched in an oil bath (sample 1). Some samples were then annealed at with an external applied field of for , with corresponding samples labeled as 2 thru 5, respectively. This MA temperature was determined from our previous study which gives optimum alloy magnetic properties [15]. Some samples also underwent an additional low temperature drawing process at for (labeled 6 thru 8), respectively. After MA or low temperature draw, the samples were water quenched to room-temperature. Details of heat-treatment conditions of samples 1–8 are listed in Table 1. Their magnetic properties were measured using a Laboratorio Elettrofisico Engineering Walker LDJ Scientific AMH-5 Hysteresis graph in a closed-loop setup.
| Samples | 1 | 2 | 3 | 4 | 5 | 6 | 7 | 8 |
|---|---|---|---|---|---|---|---|---|
| MA/ () | 0 | 0.5 | 1.5 | 5 | 10 | 10 | 10 | 10 |
| Draw/ () | 0 | 0 | 0 | 0 | 0 | 1 | 3 | 5 |
2.2 Characterization
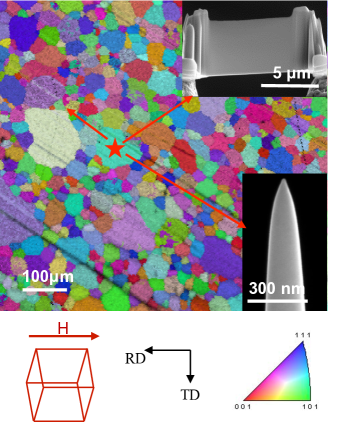
APT and TEM are sensitive methods for investigating details of structure and compositions of materials down to atomic-scale resolution [16, 17]. In this study, APT analysis of samples 1 to 8 was performed to better understand the SD phase morphology in three dimensions, as well as a more accurate determination of the and composition and morphology at different heat-treatment stages. TEM was used to reveal the crystallographic relationship between different phases. In each sample, grains with their crystal orientation parallel to the external magnetic field direction were first identified on the polished longitudinal sections (electron beam perpendicular to external field direction) using EBSD, on an Amray 1845 field emission SEM. This can exclude the effect of orientation difference between crystallographic and external field on SD microstructure [13]. Both APT and TEM samples were then lifted-out from the same selected grain to proceed with a more detailed structural analysis, as shown in Fig. 1. An FEI Nova 200 dual-beam focused ion beam (FIB) instrument was used to perform lift-outs and annular milling of targeted grains to fabricate needle-shaped APT specimens. A wedge lift-out geometry was used to mount multiple samples on a Si microtip array to enable the fabrication of several needles from one wedge lift-out [18]. APT was performed with a local electrode atom probe (LEAP) 4000X HR manufactured by CAMECA Instruments. Samples were run in voltage mode with a base temperature of and pulse fraction at a repetition rate of . The datasets were reconstructed and analyzed using the IVAS 3.6.12 software (CAMECA Instruments). An FEI Helios dual-beam FIB was used to perform lift-out of TEM samples with the sample surface normal parallel to the external field direction (transverse direction). An FEI probe aberration corrected Titan Themis TEM with a Super-X energy dispersive X-ray spectrometer (EDS) was used for structural characterization.
3 Experimental results
3.1 Magnetic properties
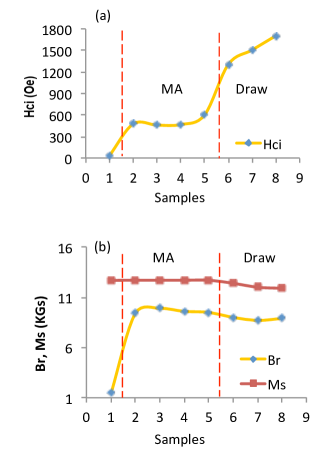
Magnetic properties of Samples 1-8 are summarized in Fig. 2. Compared with the as-solutionized sample (sample 1), short time MA (30 s, sample 2) already results in a dramatic improvement of from to , and from to . Increasing the MA time to further increase (), but plateaus between and of MA. The saturation magnetization () of sample 1 and MA samples (samples 2 to 5) is similar, indicating a similar volume fraction of the phase in those samples [6]. Drawing can triple the to (sample 8), with the most obvious improvement occurring after the initial drawing (Sample 6); however, both and slightly drop after the draw.
3.2 Microstructure after solutionization
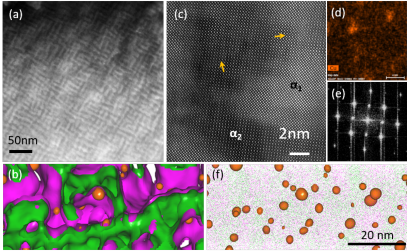
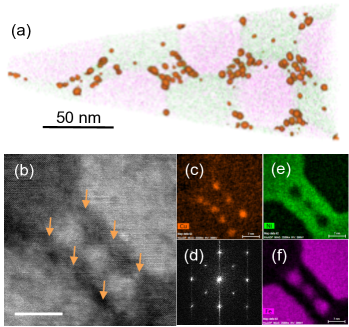
Chemical segregation has already begun after of solutionization, although the sample has almost no coercivity. High-angle-annular-dark-field (HAADF) scanning transmission electron microscopy (STEM) imaging was used to minimize strain contrast and differentiate phase morphology more clearly than can be achieved with traditional diffraction contrast TEM. The phase shows brighter contrast in HAADF STEM image due to the higher averaged atomic number of the elements. A mixture of disks, and long rods with a diameter of was observed in sample 1 (Fig. 3a). The disks and rods are sometimes connected to each other. The / interface is slightly blurry, which may be due to incomplete phase separation or sample thickness with respect to the 3D microstructure. Isoconcentration surfaces within the APT data of sample 1 reveals an interpenetrating nature of the and phases, as shown in Fig. 3b. The and phases are continuous with meandering boundaries within the entire analyzed volume. Both the and phases have diameters. The appearance of disk and rods within the STEM images is a projected view of the phase along different crystallographic directions.
A high density of Cu-enriched clusters were detected inside , as shown in Fig. 3 b and f. The Cu-enriched clusters have an average diameter of and occupy of the alloy’s volume. The Cu concentration at the cluster center was measured to be for sample 1 by APT. High-resolution HAADF STEM image (HRSTEM, Fig. 3c) and corresponding fast-Fourier-transform (FFT) (Fig. 3e) shows coherent /, /Cu interfaces. This result implies that the Cu-cluster and has the same lattice structure. Moreover, due to small size of the Cu-clusters, their positions (as indicated by arrows in Fig. 3c) in the HAADF STEM image can only be identified by overlaying the matching EDS elemental mapping (Fig. 3d).
3.3 Microstructure after magnetic field annealing
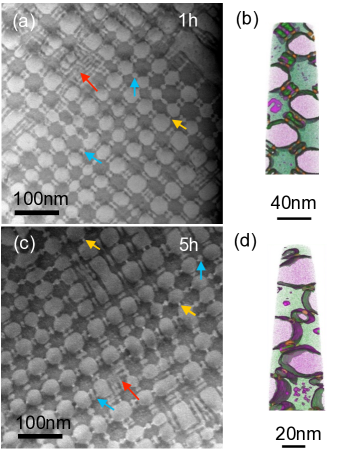
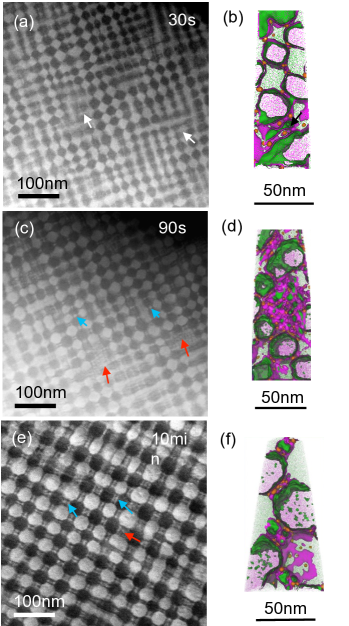
A faceted rod-shaped phase () is developed during the MA process. As shown in Fig. 4a, a well-defined mosaic structure composed by a faceted phase with a diameter was quickly developed in a large volume fraction of sample 2 after of MA. Some areas of sample 2 shows blurred imaging contrast, as indicated by white arrows, which implies regions with morphological differences. Increasing the MA time to (sample 3, Fig. 4c) caused a slight increase in the diameter to . facets started to appear in some phases. Small particles () located between facets of two adjacent large rods were also observed, as indicated by blue arrows in Fig. 4c. Moreover, clusters of particles (), as pointed out by red arrows, were formed, possibly from the white arrow regions indicated in Fig. 4a. A further MA time increase to (sample 5, Fig. 4e) modified the phase diameter size distribution into a bimodal distribution with large () and small () phases. Isoconcentration surfaces within the APT data clearly show phase elongation in all MA-treated samples, as demonstrated in Fig. 4b, d, and f. Regions with a morphology similar to sample 1 is also visible, as indicated by the black arrow in Fig. 4b, which may be regions indicated by the white arrow in Fig. 4a. These regions are most likely areas from the solutionization process that have not yet been modified from short time MA processes. Transformation of big isolated blocks from a parallelogram shape into an octagon shape with a cross-sectional diameter of after MA is also obvious. For all samples, the phase is continuous.
Isoconcentration surfaces within the APT data reveal that the location of Cu-enriched clusters tends to follow the edge of two adjacent facets in sample 2 (Fig. 4b). With increasing MA time, the region between two facets of shows a much higher Cu-enriched cluster density, as shown in Fig. 5a. This is also the area where most of the small phase is located. Figure 5b shows a HRSTEM image of sample 5. Small phases with a size are clearly visible between two facets of large rods. Locations of the Cu-clusters (indicated by orange arrows) were identified by comparing the matching EDS Cu elemental mapping (Fig. 5c). FFT analysis (Fig. 5d) shows that the Cu/ interface is coherent, which implies that the Cu-clusters still have the same lattice structure as after of MA. APT data shows no obvious change in Cu-cluster diameter (), volume fraction () and composition () from sample 2 thru 5.
3.4 Microstructure after low temperature drawing
A slight increase of large rod diameters to after a low temperature draw was observed by STEM imaging and APT, as shown in Fig. 6. Small phases in between two large phases agglomerate and form smaller rods with a diameter, as indicated by blue arrows in Fig. 6a and c. Regions with clusters, as indicated by red arrows in Fig. 6a, tend to disappear after longer drawing hours (Fig. 6c). Moreover, additional phase precipitates from the phase after longer drawing hours, as shown by the pink isosurfaces within the phases in Fig. 6b and d. These clusters are slightly bigger in sample 8 than in sample 6.
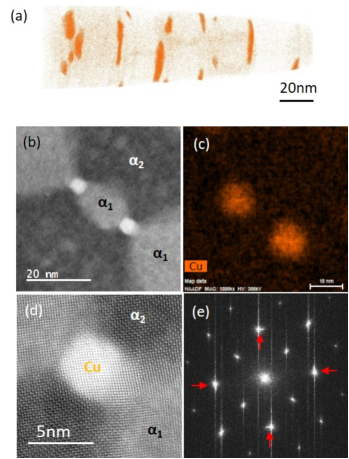
A distinctive morphological change was observed for the Cu-enriched phase after drawing. A transformation from clusters to rod shapes occurs, as shown by the APT Cu elemental map in Fig. 7a. From samples 6 to 8, the Cu-rods show an average diameter of , which is 2-3 times larger than those found in sample 5. Moreover, the central composition of Cu tends to increase substantially from in sample 5 to in sample 6, and finally to in sample 8. Although APT aberrations could distort the particle concentrations, with a greater distortion for smaller particles, structural differences revealed by STEM indicate a higher Cu concentration (brighter contrast) for the larger particles in sample 8, consistent with the APT results. Figure 7b shows a HAADF STEM image of sample 8, the bright contrast Cu-enriched phase is clearly visible, as confirmed by matching EDS Cu elemental mapping in Fig. 7c. The HRSTEM image shows lattice distortion in the bright Cu-enriched phase region (Fig. 7d), which is also manifested by a streaking/satellite peak in the (110) spots of the image FFT (Fig. 7e), which is further evidence that the Cu content is higher in the drawn samples.
3.5 Chemistry evolution in and phases
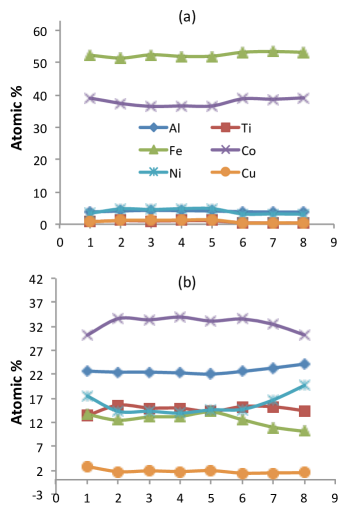
The and phase compositions in samples 1 thru 8 are summarized in Fig. 8. Results were extracted from cropped volumes of the APT data that were completely contained within the phases and away from the interface, so that the chemical variation caused by the interfacial profile could be excluded. The phase chemistry was relatively stable during the whole heat-treatment process, except for a slight increase in the Fe and Co content after drawing. More obvious chemistry changes were detected in the phase. After the first of MA, there was an increase of Co and Ti content, and a decrease of Al content, while the chemical composition tends to be stable during the following MA processes. Drawing at gradually increased the Al and Ni concentration, while that of Co and Fe decreased. The Ti concentration plateaued during the MA and drawing step. This indicates that the diffusion speed of all elements is fast enough at to approach its thermodynamically stable concentration within , however, there is an obvious diffusion speed decrease at , and therefore, it takes a much longer time to reach the equilibrium concentration.
4 Discussion
The APT combined with detailed TEM and magnetization measurements provide a clear picture of relationships between the phase evolution and magnetic properties. Observation of phase separation in sample 1 indicates that oil quenching cannot provide a fast enough quench to bypass initiation of the SD. After only of MA, the optimal coercivity imparted from this step is observed, even though the APT and TEM shows further morphological changes up to of MA. The small changes in chemistry from sample 2 to 5 implies that the chemical diffusion is rapid and the observed gradual morphology change is more likely to be driven by minimization of interfacial and magnetic energy. After MA, particles are not only elongated, but also become less interconnected to each other, which helps increase .
The draw has a remarkable effect on both and refinement of the chemistry between the and phases. The conventional explanation is that drawing further increases the chemical separation of the two phases [19]. However, our results suggest that the draw effect on enhancement likely involves several mechanisms, including chemistry, ordering, as well as subtle structural features, such as evolution of the Cu-enriched phase. For the phase, the Fe and Co concentration slightly increases after the first draw step (comparing sample 5 and 6), then it is nearly constant. On the other hand, in the phase, Fe and Co contents continue to decrease with increasing draw time, which is likely due to the coarsening/growth in of precipitates. Overall, the chemical variation is small and may not change the magnetization of the phase significantly. On the other hand, site ordering in the phase may play an important role. Our previous study showed that formation energy is lower and decreases with increasing site ordering (from BCC to DO3 and L21) [6]. Thus, draw annealing may promote site ordering in the region, possibly due to a decreases in the Fe and Co content in the phase. Considering that of is near room temperature, both chemistry changes and site ordering decrease magnetization of the phase at room temperature, which increases .
The most dramatic change is in the growth of the Cu-enriched regions. Transformation of small Cu-enriched clusters into larger and longer Cu-enrich rods may be driven by minimization of interfacial energy as the center of the clusters has higher and higher Cu concentration. Similar elongated precipitates along elastic soft direction has been reported in Cu2at.%Co system [heinrich2007sia]. These elongated large Cu-rods may provide better pinning for magnetic domain wall movement. The Cu-enriched phase not only becomes bigger and longer but also less magnetic, which can further separate rods. The Cu lattice shearing from the bcc structure may be because the fcc structure of Cu is thermodynamically more stable. Moreover, since some branching types may be very detrimental to , a larger Cu cluster can isolate two originally connected rods and increases [20]. Finally, formation of small rods or even chains of spheres, along with the previously reported formation of Ni-rich () separation phase at the / interface can also help to increase [21].
5 Conclusions
Coercivity enhancement is a complex interplay between the intrinsic properties of the alnico alloy and its nanostructure. With MA, the kinetics of the SD is rapid and the near optimum geometric spacing is quickly reached due to higher annealing temperature. MA sets the template for the spinodal and locks in remanence, while the draw process is responsible for the finer microstructural and chemical tuning, which controls the coercivity. The profound effect of draw on improving is likely due to a combination of several mechanisms, including chemical, site ordering, and subtle microstructural variations. The draw process does not introduce dramatic microstructural changes of and phases, but does affect the size, shape, and distribution of the intervening Cu-rich phase forming in-between these phases. This new understanding provides possible directions for further property enhancement of alnico.
Acknowledgment
Research was supported by U.S. DOE, Office of Energy Efficiency and Renewable Energy (EERE), under its Vehicle Technologies Office, Electric Drive Technology Program, through the Ames Laboratory, Iowa State University under contract DE-AC02-07CH11358. APT rwas conducted at ORNL’s Center for Nanophase Materials Sciences (CNMS), which is a DOE Office of Science User Facility.
References
References
- McCurrie [1982] R. McCurrie, Chapter 3 the structure and properties of alnico permanent magnet alloys, volume 3 of Handbook of Ferromagnetic Materials, Elsevier, 1982, pp. 107–188.
- Watanabe et al. [2006a] T. Watanabe, S. Tsurekawa, X. Zhao, L. Zuo, Grain boundary engineering by magnetic field application, Scripta Materialia 54 (2006a) 969–975.
- Watanabe et al. [2006b] T. Watanabe, S. Tsurekawa, X. Zhao, L. Zuo, C. Esling, A new challenge: grain boundary engineering for advanced materials by magnetic field application, Journal of Materials Science 41 (2006b) 7747–7759.
- Cahn [1963] J. W. Cahn, Magnetic aging of spinodal alloys, Journal of Applied Physics 34 (1963) 3581–3586.
- Kramer et al. [2012] M. Kramer, R. McCallum, I. Anderson, S. Constantinides, Prospects for non-rare earth permanent magnets for traction motors and generators, JOM Journal of the Minerals, Metals and Materials Society 64 (2012) 752–763.
- Zhou et al. [2014] L. Zhou, M. Miller, P. Lu, L. Ke, R. Skomski, H. Dillon, Q. Xing, A. Palasyuk, M. McCartney, D. Smith, S. Constantinides, R. McCallum, I. Anderson, V. Antropov, M. Kramer, Architecture and magnetism of alnico, Acta Materialia 74 (2014) 224–233.
- McCallum et al. [2014] R. McCallum, L. Lewis, R. Skomski, M. Kramer, I. Anderson, Practical aspects of modern and future permanent magnets, Annual Review of Materials Research 44 (2014) 451–477.
- Stanek et al. [2010] M. Stanek, L. Wierzbicki, M. Leonowicz, Investigations of thermo-magnetic treatment of alnico 8 alloy, Archives of Metallurgy and Materials Vol. 55 (2010) 571–577.
- Sergeyev and Bulygina [1970] V. Sergeyev, T. Bulygina, Magnetic properties of alnico 5 and alnico 8 phases at the sequential stages of heat treatment in a field, Magnetics, IEEE Transactions on 6 (1970) 194–198.
- Takeuchi and Iwama [1976] M. Takeuchi, Y. Iwama, Effects of titanium upon magnetic anisotropy and coercivity in alnico magnet alloys, Transactions of the Japan Institute of Metals 17 (1976) 489–496.
- Iwama and Takeuchi [1974] Y. Iwama, M. Takeuchi, Spinodal decomposition in alnico 8 magnet alloy, Transactions of the Japan Institute of Metals 15 (1974) 371–377.
- Iwama et al. [1970] Y. Iwama, M. Inagaki, T. Miyamoto, Effects of titanium in alnico 8-type magnet alloys, Transactions of the Japan Institute of Metals 11 (1970) 268–274.
- Zhou et al. [2014] L. Zhou, M. K. Miller, H. Dillon, A. Palasyuk, S. Constantinides, R. W. McCallum, I. E. Anderson, M. J. Kramer, Role of the applied magnetic field on the microstructural evolution in alnico 8 alloys, Metallurgical and Materials Transactions E 1 (2014) 27–35.
- Zhou et al. [2017] L. Zhou, W. Tang, L. Ke, W. Guo, J. D. Poplawsky, I. E. Anderson, M. J. Kramer, Microstructural and magnetic property evolution with different heat-treatment conditions in an alnico alloy, Acta Materialia 133 (2017) 73 – 80.
- Tang et al. [2015] W. Tang, L. Zhou, A. G. Kassen, A. Palasyuk, E. M. White, K. W. Dennis, M. J. Kramer, R. W. McCallum, I. E. Anderson, New alnico magnets fabricated from pre-alloyed gas-atomized powder through diverse consolidation techniques, IEEE Transactions on Magnetics 51 (2015) 1–3.
- Miller and Russell [2007] M. K. Miller, K. F. Russell, Performance of a local electrode atom probe, Surface and Interface Analysis 39 (2007) 262–267.
- Williams and Carter [1996] D. B. Williams, C. B. Carter, The Transmission Electron Microscope, Springer US, Boston, MA, 1996.
- Thompson et al. [2007] K. Thompson, D. Lawrence, D. Larson, J. Olson, T. Kelly, B. Gorman, In situ site-specific specimen preparation for atom probe tomography, Ultramicroscopy 107 (2007) 131–139.
- McCurrie and Jackson [1980] R. McCurrie, S. Jackson, Rotational hysteresis and magnetization curling of elongated single-domain particles in alnico permanent magnets, IEEE Transactions on Magnetics 16 (1980) 1310–1319.
- Ke et al. [2017] L. Ke, R. Skomski, T. D. Hoffmann, L. Zhou, W. Tang, D. D. Johnson, M. J. Kramer, I. E. Anderson, C.-Z. Wang, Simulation of alnico coercivity, Applied Physics Letters 111 (2017) 022403.
- Nguyen et al. [2017] M. C. Nguyen, L. Zhou, W. Tang, M. J. Kramer, I. E. Anderson, C.-Z. Wang, K.-M. Ho, Cluster-expansion model for complex quinary alloys: Application to alnico permanent magnets, Phys. Rev. Applied 8 (2017) 054016.