Real-time projections of epidemic transmission and estimation of vaccination impact during an Ebola virus disease outbreak in the Eastern region of the Democratic Republic of Congo
Abstract
Background: As of October 12, 2018, 211 cases of Ebola virus disease (EVD) were
reported in North Kivu Province, Democratic Republic of Congo.
Since the beginning of October the outbreak has largely shifted into
regions in which active armed conflict is occurring, and in which EVD
cases and their contacts are difficult for health workers to reach.
We used available data on the current outbreak with
case-count time series from prior outbreaks to project the short-term
and long-term course of the outbreak.
Methods:
For short and long term projections
we modeled Ebola virus transmission using a stochastic branching
process that assumes gradually quenching transmission estimated from
past EVD outbreaks, with outbreak trajectories conditioned on
agreement with the course of the current outbreak,
and with multiple levels of vaccination coverage.
We used a negative binomial autoregression for short-term projections,
a Theil-Sen regression model for final sizes,
and a baseline minimum-information projection using Gott’s law
to construct an ensemble of forecasts to be compared and
recorded for future evaluation against final outcomes.
From August 20 to October 13, short-term model projections
were validated against actual case counts.
Results:
During validation of short-term projections, from one week to four weeks,
we found models consistently scored higher on shorter-term forecasts.
Based on case counts as of October 13,
the stochastic model projected a median case count of
226 cases by October 27
(95% prediction interval: 205–268)
and
245 cases by November 10
(95% prediction interval: 208–315),
while the auto-regression model projects median case counts of
240
(95% prediction interval: 215–307)
and
259
(95% prediction interval: 216–395)
cases for those dates, respectively.
Projected median final counts range from 274 to 421.
Except for Gott’s law,
the projected probability of an outbreak comparable to
2013–2016 is exceedingly small.
The stochastic model estimates that vaccine coverage in this outbreak
is lower than reported in its trial setting in Sierra Leone.
Conclusions:
Based on our projections we believe that the epidemic had not yet peaked at the
time of these estimates, though a trajectory on the scale of the West African
outbreak is exceedingly improbable. Validating our models in real time allowed
us to generate more accurate short-term forecasts, and this process may provide
a useful roadmap for real-time short-term forecasting. We estimate that
transmission rates are higher than would be seen under target levels of 62%
coverage due to contact tracing and vaccination, and this model estimate may
offer a surrogate indicator for the outbreak response challenges.
Introduction
On August 1, 2018, the World Health Organization (WHO) announced a new outbreak of Ebola virus disease (EVD) in North Kivu Province in Eastern Democratic Republic of Congo (DRC). Epidemiological investigations traced EVD cases back to the week of April 30 and identified the initial epicenter to be Mabalako. North Kivu has over eight million inhabitants, some of whom suffer from armed conflict, humanitarian crisis, and displacement from their bordering countries of Uganda and Rwanda. Since the outbreak began, EVD cases have spread across ten health zones in two provinces at a rate outpacing the case counts of the other 2018 DRC Ebola outbreak in Equateur Province. As of October 13, 211 EVD cases were reported (31 probable and 180 confirmed); Ministry of Health of DRC, World Health Organization, and other organizations were responding to the Ebola outbreak.
As new interventions such as vaccines or rapid diagnostics are being implemented during outbreaks, their impact on epidemic transmission is poorly understood, requiring assumptions to be made that may lead to inaccurate forecasting results. Unknown social or environmental differences affecting transmission can also affect forecasts in unknown ways. For example, the overlap of the outbreak with regions where armed conflict is occurring in North Kivu, DRC, might result in higher under-reporting rates and lower vaccine coverage than in other outbreaks, causing increased transmission and decreased accuracy of reporting, or might result in reduced transmission due to reduced mobility or other considerations. Since the beginning of October, an increased rate of detection of new cases has been observed in the conflict zone, perhaps due to reduced disease control.
During an Ebola outbreak, real-time forecasting has the potential to support decision-making and allocation of resources, but highly accurate forecasts have proven difficult for Ebola 1, 2 as well as other diseases.3, 4, 5, 6 Moreover, there are mathematical reasons to believe that highly accurate forecasts of small, noisy outbreaks may never be possible.7 Nevertheless, while predicting the exact number of cases is unlikely to ever be possible, forecasts which are accurate enough to be useful may be possible. Previous work has found that probabilistic forecasts can have relatively high accuracy within a few weeks, though they become less useful as time horizons grow longer 8, and short-term forecasts may provide useful information for response organizations.
In this paper we apply a suite of independent methods of real-time forecasting to the Eastern DRC outbreak, to generate both short-term and long-term projections of future case counts as of the time of writing. We validate short-term projections by scoring projections derived from case count reports obtained earlier in the outbreak against subsequent known counts. We include past and present projections (in supplemental material) for future evaluation. We summarize model results in terms of projections of the future course of the outbreak, and interpret their implications relevant to current rates of transmission and vaccine coverage in conflict zones and overall.
Methods
We used four techniques to derive real-time projections of future case counts: a stochastic simulation model calibrated to time-dependent transmission rates measured from past outbreaks of EVD and constrained to the observed partial trajectory of the current outbeak, extending the model used in our previous work on the Spring outbreak; a negative binomial auto-regression model predicting the course of the outbreak from its course to date together with the course of previous outbreaks; a regression model for final size based on past outbreaks; and a simple final size projection using Gott’s law, which assumes only that the proportion of the outbreak observed so far is entirely unknown.
Data sources
Data on the current outbreak was collected from the WHO website in real time as updated information was published.9 A cumulative case count of probable and confirmed cases was generated to be consistent with the best knowledge at the time. Copies of the list of case counts were kept as of multiple dates (Figure 8), to be used in retrospective scoring of model projections against subsequently known counts. Though the epidemic was officially reported in late July as a cluster of cases occurring in June and July, seven sporadic early cases from April and May were later linked to the current outbreak and added to later case totals. This additional knowledge was added retrospectively to the time series of cumulative case counts only for predictions made for days on or after September 15th, when these cases were officially linked to the current outbreak.
Stochastic model
We modeled Ebola virus transmission using a stochastic branching process model, parameterized by transmission rates estimated from the dynamics of prior EVD outbreaks, and conditioned on agreement with reported case counts from the 2018 EVD outbreak to date. We incorporated high and low estimates of vaccination coverage into this model. We used this model to generate a set of probabilistic projections of the size and duration of simulated outbreaks in the current setting. This model is similar to one described in previous work 10, with the addition of a smoothing step allowing transmission rates intermediate between those estimated from previous outbreaks.
To estimate the reproduction number as a function of the number of days from the beginning of the outbreak, we included reported cases by date from fourteen prior outbreaks (Table 1).11, 12, 13, 14, 15, 16, 17, 18, 19, 20, 21, 22, 23, 24 The first historical outbreak reported in each country was excluded (e.g., 1976 outbreak in Yambuko, DRC). As there is a difference in the Ebola response system as well as community sensitization to EVD following a country’s first outbreak, we employed this inclusion criterion to reflect the Ebola response system in DRC during what is now its tenth outbreak. We used the Wallinga-Teunis technique to estimate for each case and therefore for each reporting date in these outbreaks.25 The serial interval distribution used for this estimation was a gamma distribution with a mean of 14.5 days and a standard deviation of 5 days, with intervals rounded to the nearest whole number of days, consistent with the understanding that the serial interval of EVD cases ranges from 3 to 36 days with mean 14 to 15 days. We estimated an initial reproduction number and quenching rate for each outbreak by fitting an exponentially quenched curve to the outbreak’s estimates of by day (Figure 9).
We modeled transmission using a stochastic branching process model in which the number of secondary cases caused by any given primary case is drawn from a negative binomial distribution whose mean is the reproduction number as a function of day of the outbreak, and variance is controlled by a dispersion parameter .26, 27All transmission events were assumed to be independent. The interval between date of detection of each primary case and that of each of its secondary cases is assumed gamma distributed with mean 14.5 days and standard deviation 5 days, rounded to the nearest whole number of days, as above.
We used the pairs estimated from past outbreaks to provide values for simulation. values were sampled uniformly from the range of values estimated from past outbreaks. We fit a linear regression line through the values of and estimated for past outbreaks, above, and used the resulting regression line to assign a mean to each , used with the residual variance of as a distribution from which to sample values for simulation given . The pair of parameters and sampled in this way, together with each of three values of the dispersion parameter , , , and , consistent with transmission heterogeneity observed in past Ebola outbreaks, were used to generate simulated outbreaks.
This model generated randomly varying simulated outbreaks with a range of case counts per day. The outbreak was assumed to begin with a single case. The simulation was run multiple times, each instance producing a proposed epidemic trajectory, generated by the above branching process with the given parameters , , and , and these were then filtered by discarding all proposed outcomes but those whose cumulative case counts matched known counts of the current 2018 EVD outbreak on known dates. In earlier, smaller, data sets we filtered against all reported case counts, while in later, more complete data sets we thinned the case counts, for computational tractability, by selecting five case counts evenly spaced in the data set plus the final case count (Figure 8). The filtration required an exact match of the first target value, and at subsequent target dates accepted epidemics within a number of cases more or less than each recorded value. On the earlier data sets in which the beginning dates of the epidemic were unknown, the first target value was allowed to match on any day, and subsequent target dates were assigned relative to that day.
Thus this model embodies a set of assumptions that transmission rates are overall gradually declining from the start of the outbreak to its end, though possibly in noisy ways. When the tolerance of the filter on case counts is small, quenching of transmission through time must closely track case counts, while when tolerance is high, fluctuations in the rate of generation of new cases can reflect a pattern of ongoing quenching of transmission more loosely and on the long term, while being more insensitive to short-term up and down fluctuations in transmission rates reflected by the true case counts.
We varied the tolerance as the data set became more complete to maintain a roughly fixed rate of generation of filtered trajectories: on the August 20 data set we allowed a tolerance of 4 cases more or less than each target count, on August 27 and September 5, 6 cases, on September 15, 10 cases, on October 7, 12 cases, and on October 13, 17 cases. This one-step particle filtering technique produced an ensemble of model outbreaks, filtered on agreement with the recorded trajectory of the outbreak to date. This filtered ensemble was then used to generate projections of the eventual outcome of the outbreak.28
To model vaccination coverage with respect to total transmission (unreported and reported), we multiplied the estimate of vaccine effectiveness by low and high estimates of reported cases. In a ring vaccination study at the end of the West Africa outbreak, the overall estimated rVSV-vectored vaccine efficacy was 100% and vaccine effectiveness was 64.6% in protecting all contacts and contacts of contacts from EVD in the randomized clusters, including unvaccinated cluster members.29 We used estimates of vaccine effectiveness in our stochastic model. The ring vaccination study found the vaccine to be effective against cases with onset dates 10 days or more from the date of vaccine administration, so we modeled the vaccination program as a proportionate reduction in the number of new cases with onsets 10 days or more after the program start date.
We used past estimates of the proportion of unreported cases to estimate the proportion of exposed individuals not covered by the vaccination process. Based on a Sierra Leonean study from the 2013–2016 outbreak,30 we estimated that the proportion of reported cases in DRC would rise over time from a low of 68% to a high of 96%. Given these low and high estimates of reported cases and the estimate of vaccine effectiveness, a low estimate of vaccination program coverage was 44% () and a high estimate of vaccination program coverage was 62% (). We modeled the course of the outbreak with and without the vaccination program based on approximate dates available from situation reports.9
For simulation based on cases as of October 13, 320 outbreaks were retained from 34,663,104 simulated outbreaks after filtering on approximate agreement with DRC case counts. (Numbers of simulations from earlier data sets are reported in Supplemental Materials.) The simulated outbreaks that were retained after filtering were continued until they generated no further cases. Rare simulated outbreaks that exceeded 300,000 cases were capped at the first value reached above that number, to avoid wasted computation. We used this ensemble to derive a distribution of final outbreak sizes, and of cumulative counts at specific forecasting dates. Projection distributions were derived using kernel density estimation with leave-one-out cross-validation to determine bandwidth, using a log-normal kernel for final sizes, due to the extended tail of the values, and a normal kernel for all other estimates. We calculated median values and 95% prediction intervals using the 2.5 and 97.5 percentiles of simulated outbreak size and duration. We conducted the analyses using R 3.4.2 (R Foundation for Statistical Computing, Vienna, Austria).
Auto-Regression model
A negative binomial autoregressive model was chosen through a validation process to forecast additional new case counts at time points one week, two week, four weeks, and two months from the current date. To adjust for disparities in the frequency of case reporting in historic outbreaks, the data were weighted by the inverse square root of the number of observations contributed to the model. Models considered included parameters for historic raw case counts at different time points, logs of raw case counts, ratio of historic case counts to try and capture the trend of the epidemic curve, log(time), and an offset for current case total. When historic case counts for specific dates were missing, each missing case count was linearly interpolated from the two nearest case counts, allowing the model to remain agnostic about the current trend of the epidemic. After model fitting and validation, the final model chosen was a log-link regression for additional cases on the number of new cases identified in the previous two weeks, the previous four weeks and the ratio of these two case counts.
Regression model
We conducted a simple regression forecast based solely on outbreaks of size 10 or greater, based on prior outbreaks.11, 12, 13, 14, 15, 16, 17, 18, 19, 20, 21, 22, 23, 24 Nonparametric Theil-Sen regression (R package mblm) was used to project the final outbreak size based on values of the outbreak size at a specific earlier time. All time series were aligned on the day they reached 10 cases. Finally, we reported the median and 95% central coverage intervals for the prediction distribution, conditional on the predicted value being no smaller than the observed value for each day. Full details are given in 10. All analyses were conducted using R 3.4.2 (R Foundation for Statistical Computing, Vienna, Austria).
Gott’s law model
With Gott’s Law, we assume we have no special knowledge of our position on the epidemic curve.31 If we assume a non-informative uniform prior for the portion of the epidemic included in the last available report, the corresponding probability density function for the final size is , . We constructed a probability mass function by assigning all probability density to the whole number of days given by the integer part of each value. We used this probability mass function as a projection of the final outbreak size.
Scoring
Each of the above models was used to generate an assignment of probability to possible values of multiple quantities:
-
Case count 1 week after the last available case count
-
Case count 2 week after the last available case count
-
Case count 4 weeks after the last available case count
-
Case count 2 months after the last available case count
-
Final outbreak size
Each model’s performance on each of these projections was scored by recording the natural logarithm of the probability it assigned to the subsequently known true value of the quantity in question.
The short-term projections based on real-time reporting were used to evaluate and calibrate the models during the epidemic, based on the data available at multiple time points during the outbreak. Final outbreak size projections were recorded for future evaluation of their performance.
Results
| Data as of 8-20-2018 | Data as of 8-27-2018 |
 |
 |
| Data as of 9-5-2018 | Data as of 9-15-2018 |
 |
 |
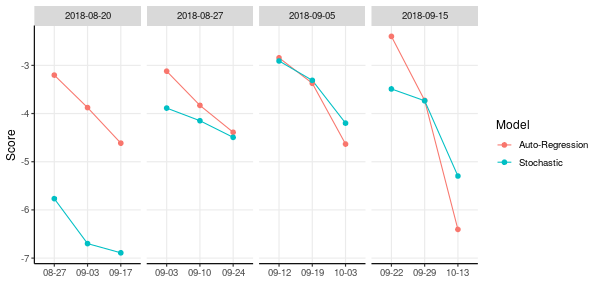
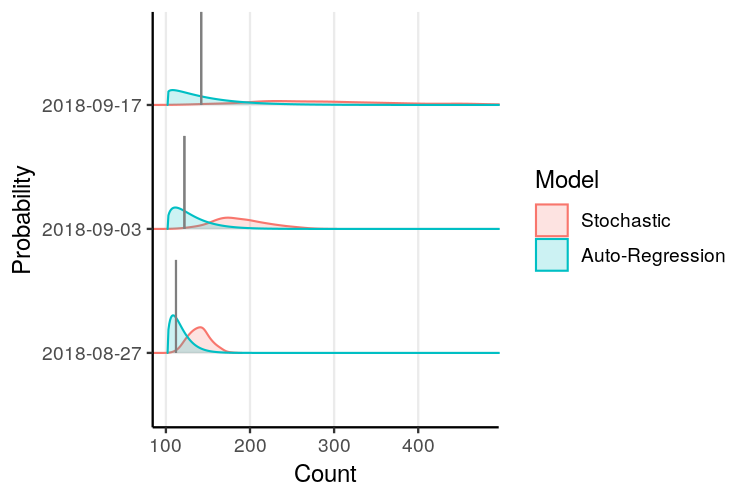
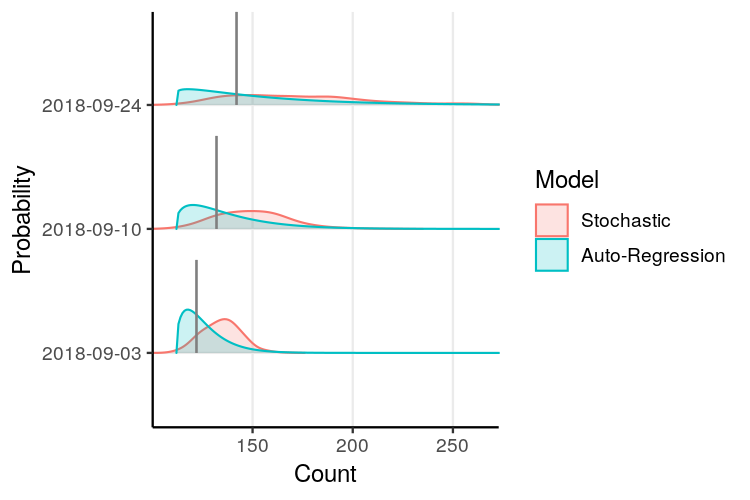
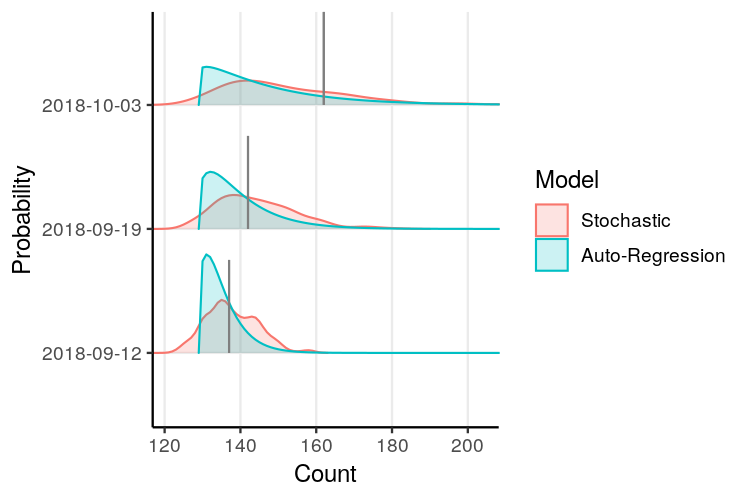
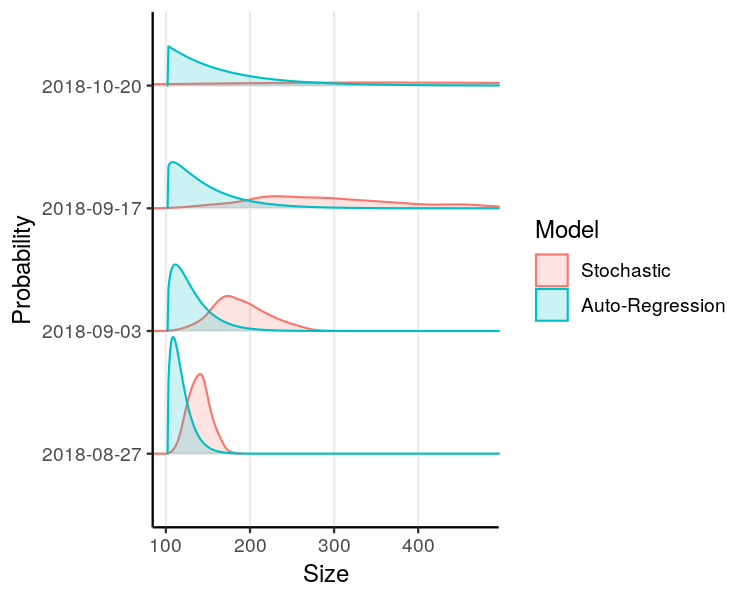
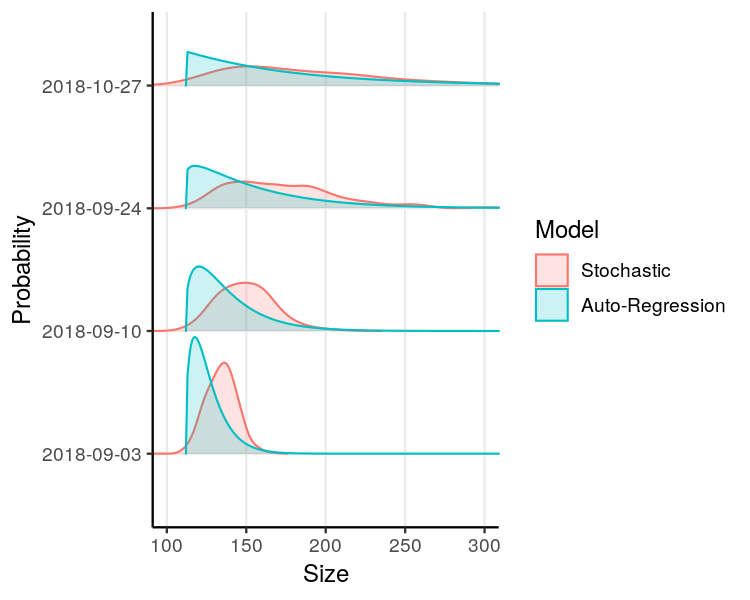
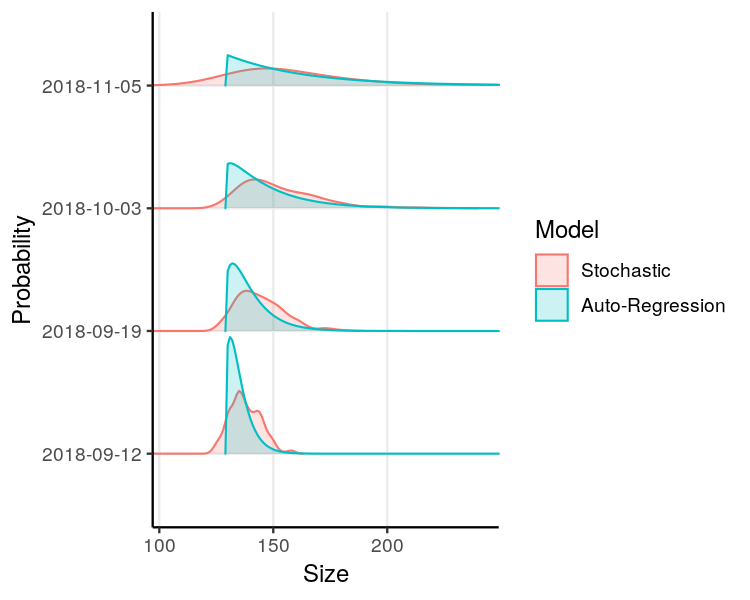
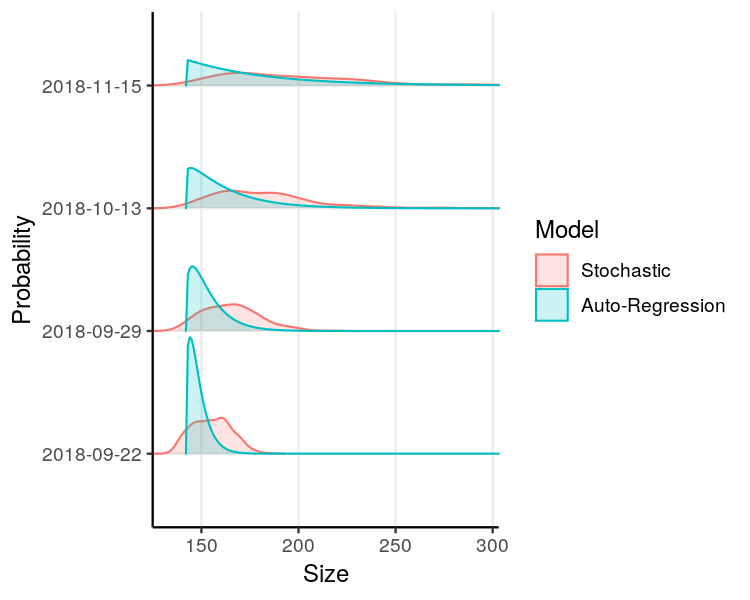
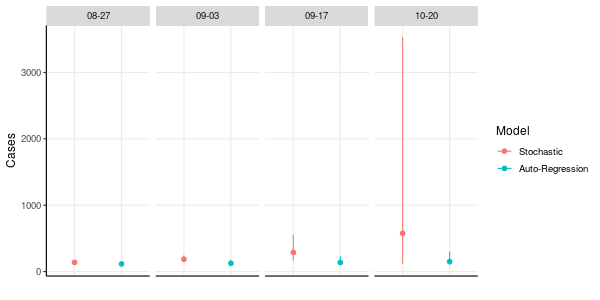
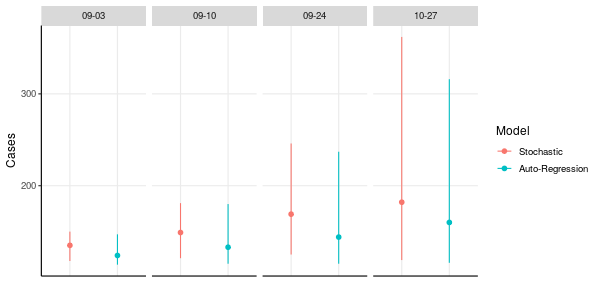
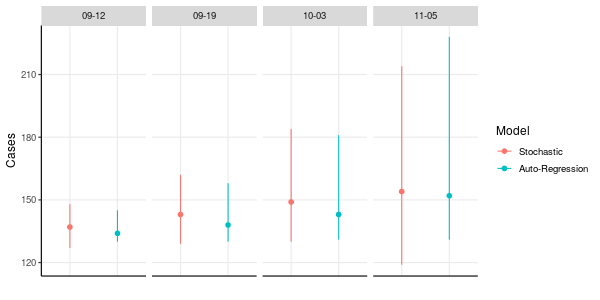
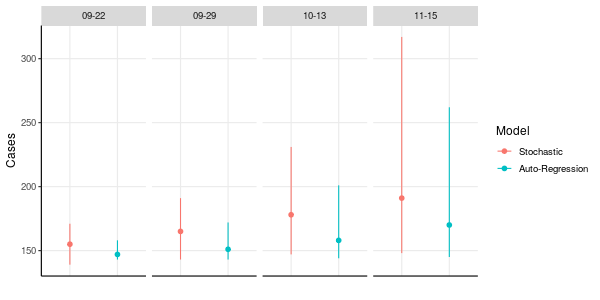
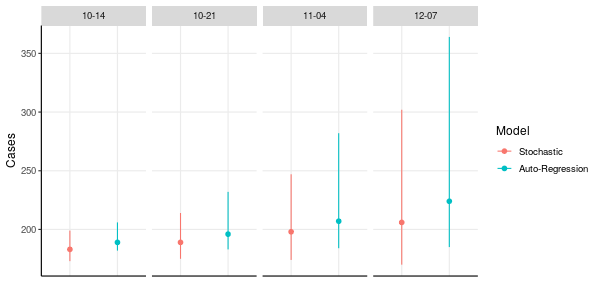
When we started performing our short-term forecasts on August 20, 2018, there were 102 reported EVD cases in North Kivu and Ituri provinces, DRC. We used our stochastic and auto-regression models to project one-week, two-week, four-week, and two-month forecasts of outbreak size. As time lapsed, we compared predicted and actual outbreak sizes and found a higher probability of accurate forecasts at one week than two months (Figures 1, 2). Log-likelihood scores typically declined as the model extended its projection time into the future. However, the largest decline in log-likelihood score occurred between the four-week and two-month forecasts. Concurrently, there were larger prediction intervals associated with these longer-term forecasts. As the epidemic curve accelerated in early October, we observed that model projections were less likely to predict actual case counts. These findings were consistent for both models.
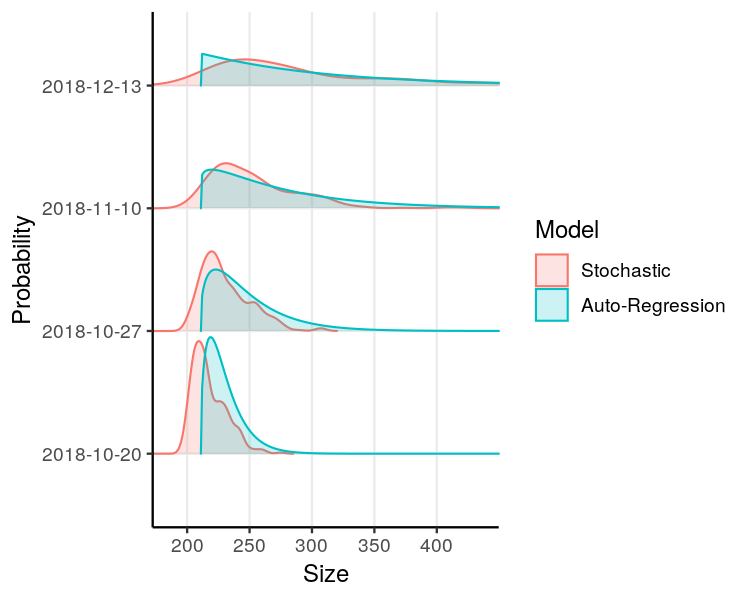
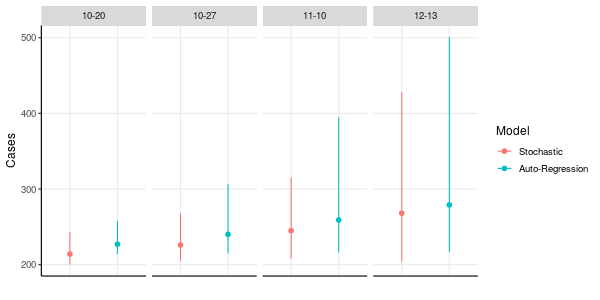
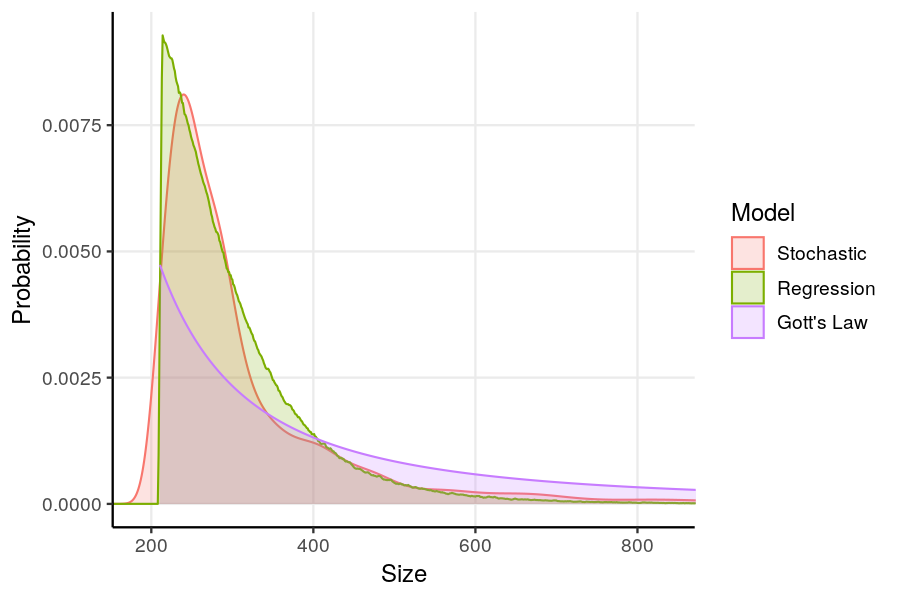
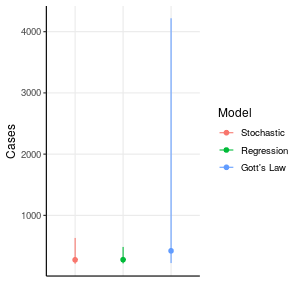
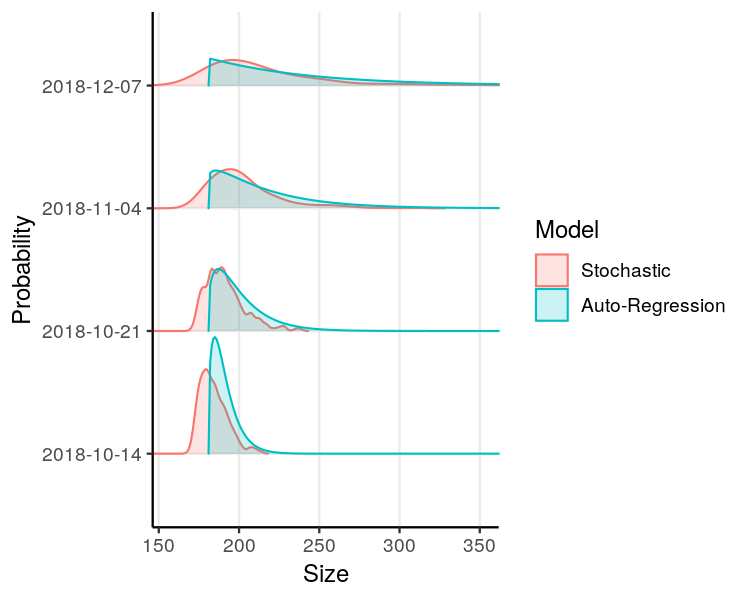
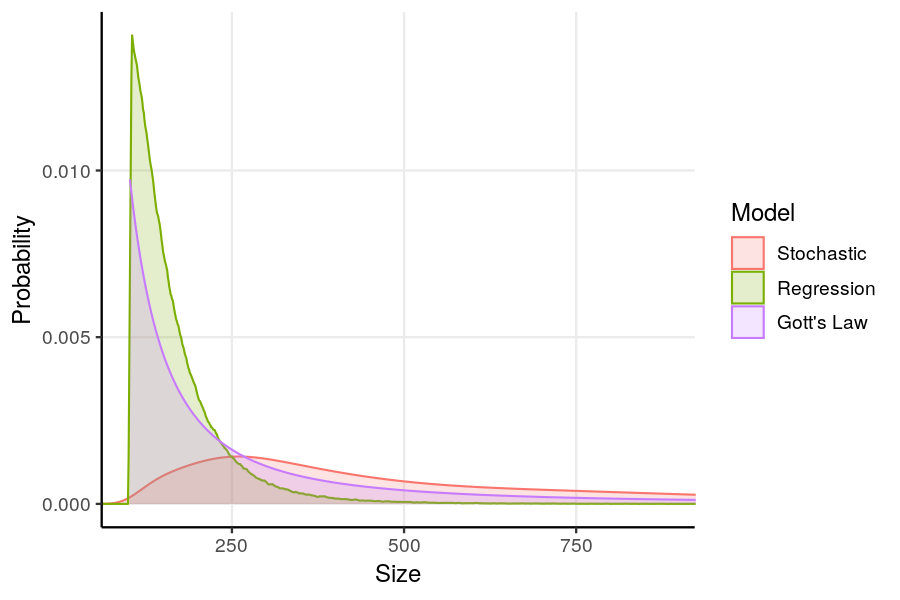
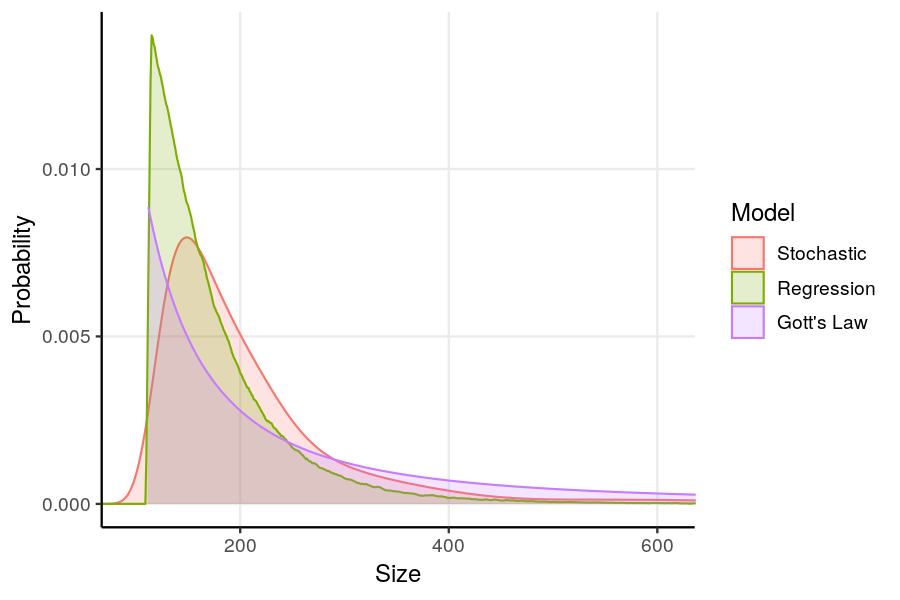
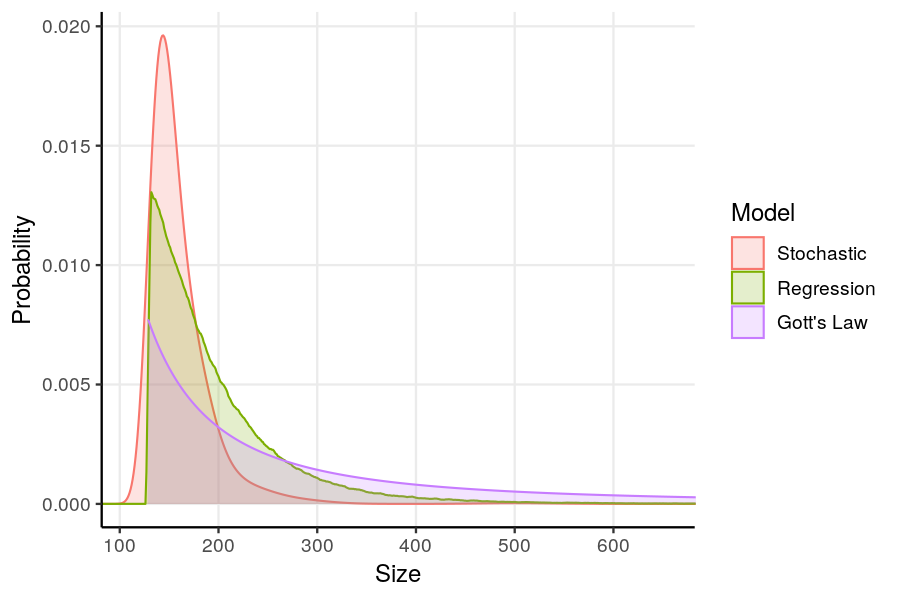
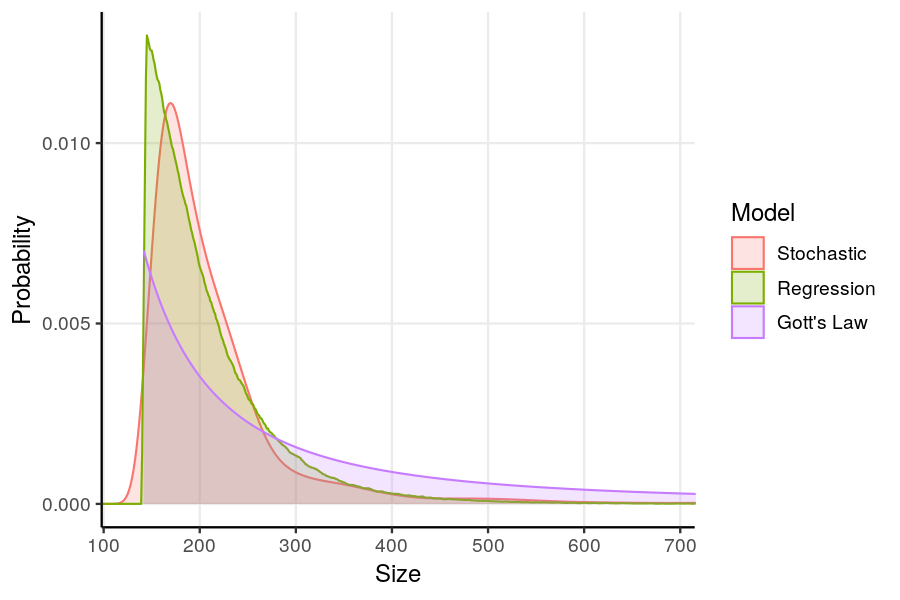
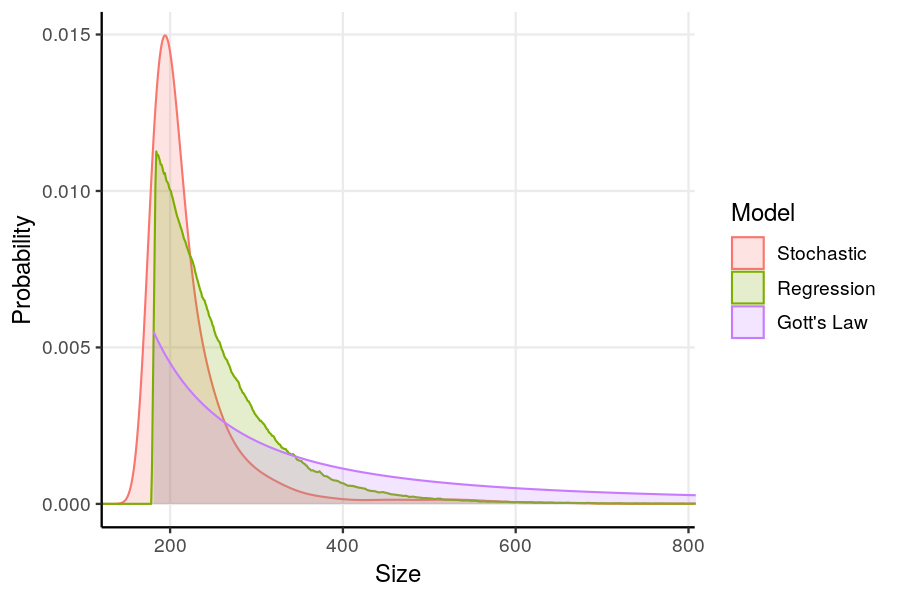
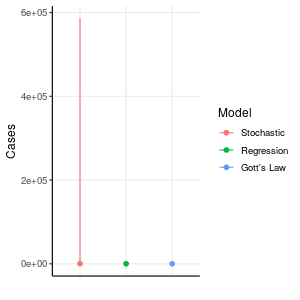
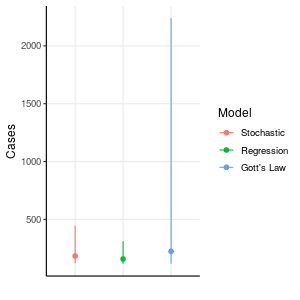
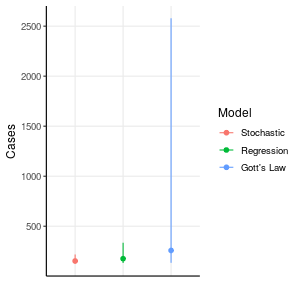
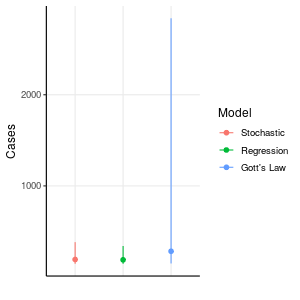
After our model validation process was completed, we used the stochastic and auto-regression models to project one-week, two-week, four-week, and two-month outcomes (Figures 3, 4). We used the Gott’s law and Theil-Sen regression models together with the stochastic model to project final outbreak sizes (Figures 5, 6). As of October 13, there were 216 reported EVD cases. With the stochastic model, the four-week projection of median outbreak size was 245 cases (95% prediction interval: 208–315). Median final outbreak size was 274 cases (95% prediction interval: 210–632). With the auto-regression model, the four-week projection of median outbreak size was 259 cases (95% prediction interval: 216–395). With Gott’s law, median final outbreak size was 421 cases (95% prediction interval: 222–4219). Median final outbreak size projected by the regression model was 277 cases (95% prediction interval: 216–485).
Because the question has been raised of whether the current outbreak might exceed the catastrophic West Africa outbreak in size, we evaluated the model’s projected probability of a final size of at least the 28,616 cases reported in that outbreak.24 A final outbreak size of 28,616 or more cases was projected to have an exceedingly low probability of less than 1 in 10,000 in all cases except the Gott’s law model, whose projected probability distribution is very long-tailed, which projects a probability of about 0.005 (roughly 1 in 190) for that event. However, as with all of the above projections, it should be understood that they are conditional on model assumptions being met. If unpredictable events should change patterns of transmission, for example escape of the outbreak into a region where sustained high transmission rates violate the assumption of gradual quenching of transmission, model projections will no longer be applicable.
Stochastic model
In order to produce model outbreak trajectories consistent with the reported overall case counts since the beginning of October, it was necessary to make the filtering step of the model more tolerant to variation in counts in order to accommodate the rapidly rising count. This is because higher transmission rates in late September and early October were necessary to generate case counts of that size than are consistent with the earlier counts.
If this model’s assumptions of continually quenching overall rate of transmission is accepted, this result could be taken as evidence in favor of increased transmission in the conflict zone, since the increase in cases reported in October reflects cases recorded there.
The likelihoods of the three scenarios of zero, low, and high vaccine coverage estimated by the stochastic model, on the basis of which scenarios are selected by the filtering step, indicate that the lower vaccine coverage scenario was consistently found more likely than the higher vaccine coverage scenario (Figure 7). However, no vaccine coverage was the most likely scenario in all forecasts.
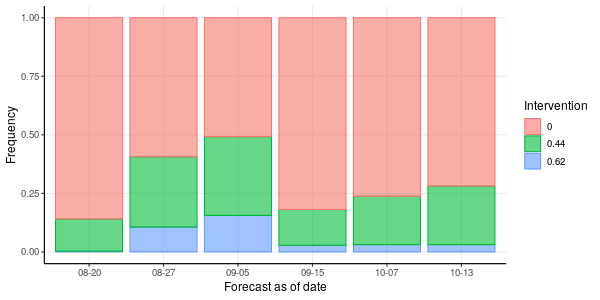
This could be read as evidence for decreased vaccine coverage in the conflict zone. It should be said clearly, however, that the model’s quenching assumption could be violated by the presence of other causes of increased transmission relative to past outbreaks that it can not distinguish and would misidentify as decreased vaccine coverage.
Stochastic model parameters conditioned on filtering by true case counts, stochastic model outcomes for multiple snapshots of reported data, and short-term and long-term projections generated by all models from past snapshots are reported in Supplemental Material.
Discussion
Political instability, mobility and community impenetrability to health workers in Eastern DRC present new challenges to efforts to respond to the ongoing EVD outbreak. Public health responders have not been able to trace up to 80% of contacts of EVD cases, and new chains of transmission are being identified on a routine basis. At present, the most reliable source of data is the weekly case counts that can be found in the WHO situation reports; those have indicated that the number of additional cases is increasing rather than decreasing. In such situations of data scarcity, modeling in real time can be useful, particularly in the short term.
Our projection with multiple models, as of October 13, 2018, predicts growth in the short term consistent with rates recorded in the recent past. In the long term our models do not project large-scale growth of the outbreak into a public health emergency of international concern, even considering worst case scenarios. However, these outcomes are likely dependent on highly contingent events such as escape of the outbreak into additional regions or nations which can not be predicted by mechanistic models.
This is the first EVD outbreak in a conflict zone, and the first with deployment of the vaccine since the beginning of the outbreak, so the suitability of prior mathematical models to predict the course of this particular outbreak is unknown. We validated the short-term forecasting performance of two mathematical models during the early part of the ongoing outbreak.
Our short-term projections of the future course of the outbreak at the time of writing are in rough agreement with expert consensus that the outbreak has gained speed as cases appear in the conflict zone, and will likely continue at roughly the same rate of growth in the short term. Our models do not indicate that the epidemic has yet peaked. Longer term forecasts are less certain and depend on whether intervention, conflict and mass behavior are able to stem continued transmission.
There are limitations to our projections. Projection distributions are right-skewed, with long tails (and we therefore report the median instead of the mean). We were unable to include all the 23 observed EVD outbreaks with a case count greater than ten cases in our estimates due to data availability.The simple regression projection is based entirely on past outbreaks of Ebola virus disease (measured and reported in different ways), and cannot account for the improved control measures and vaccination in the way that a mechanistic model does. We included as much real-time information into our estimates as possible, but situations such as the introduction of EVD into a zone of armed conflict and the recent introduction of vaccination are not reflected by the suite of past outbreaks. The stochastic model did not include vaccination of healthcare workers. We estimated vaccination effectiveness, reported cases, and time from symptom onset to reporting using studies from West Africa, not DRC. A strength of our approach was the use of multiple methods to estimate the outbreak size, even though Gott’s Law has not been validated for outbreak projections.
Our models confirm that the speedup in the conflict area appears to reflect increased transmission, possibly due to decreased vaccination coverage. Before October, there was no data to suggest whether the conflict zone would manifest more transmission and less detection due to inaccessibility of health services, or less transmission because of reduced mobility, or other outcomes. The October data suggests that transmission is increased there. It is of course not clear whether reported counts underrepresent true numbers of cases in these areas. It may be that a model that explicitly distinguishes transmission rates in these zones from those in other areas would model the dynamics underlying these cases more faithfully and produce more accurate projections. Most of the EVD cases reported in late September and early October occurred in active conflict zones, and challenges impeding an effective outbreak response have increased. Strong international partners such as the U.S. Centers for Disease Control and Prevention withdrew their support due to the security concerns. Although there was rapid deployment of vaccines during this outbreak, we found that the impact of vaccines on transmission reduction has been limited at best. Our stochastic model, which included high, low, and no vaccine coverage scenarios, was much less likely to fit high coverage scenarios than those with low or no coverage, especially with more recent data included. Thus, as contact tracing efforts faltered and estimates of vaccine coverage became increasingly unreliable, our stochastic model produced estimates of transmission rates more consistent with levels of vaccine coverage lower than target levels of 62% coverage associated with past programs of contact tracing and vaccination.
As of October 2018, the current outbreak is ongoing and does not yet appear to be concluding. We believe current rates of accumulation of cases will continue at least in the short term. We do not see evidence to indicate it will expand to the scale of the 2013–16 outbreak, although the possibility can not be dismissed. We believe the increased rate of case detection corresponding to the shift of transmission into conflict zones is due to increased transmission, probably driven by reduced ability to detect and vaccinate contacts in those locations. Even as control efforts falter, case fatality rates have been decreasing during the outbreak.9 With aggressive supportive care, experimental therapeutics and high-quality facilities (e.g. air-conditioned, individualized), health-seeking behaviors may reduce transmission potential in communities that are resistant to control efforts.8
References
- 1 Butler D. Models overestimate Ebola cases. Nature. 2014;515(7525):18.
- 2 Shaman J, Yang W, Kandula S. Inference and forecast of the current West African Ebola outbreak in Guinea, Sierra Leone and Liberia. PLoS Curr. 2014;6.
- 3 Reis J, Yamana T, Kandula S, Shaman J. Superensemble forecast of respiratory syncytial virus outbreaks at national, regional, and state levels in the United States. Epidemics. 2018;S1755-4365(17):30174–3.
- 4 Yamana T, Kandula S, Shaman J. Superensemble forecasts of dengue outbreaks. J R Soc Interface. 2016;13(123).
- 5 Reich N, Lauer S, Sakrejda K, Iamsirithaworn S, Hinjoy S, Suangtho P, et al. Challenges in Real-Time Prediction of Infectious Disease: A Case Study of Dengue in Thailand. PLoS Negl Trop Dis. 2016;10(6):e0004761.
- 6 Graham M, Suk J, Takahashi S, Metcalf C, Jimenez A, Prikazsky V, et al. Challenges and Opportunities in Disease Forecasting in Outbreak Settings: A Case Study of Measles in Lola Prefecture, Guinea. Am J Trop Med Hyg. 2018;98(5):1489–1497.
- 7 Li M, Dushoff J, Bolker B. Fitting mechanistic epidemic models to data: A comparison of simple Markov chain Monte Carlo approaches. Stat Methods Med Res. 2018;27(7):1956–1967.
- 8 Funk S, Camacho A, Kucharski AJ, Lowe R, Eggo RM, Edmunds WJ. Assessing the performance of real-time epidemic forecasts: A case study of the 2013-16 Ebola epidemic. bioRxiv. 2018;Available from: https://www.biorxiv.org/content/early/2018/04/24/177451.
- 9 World Health Organization. Ebola situation reports: Democratic Republic of the Congo; 2018. Online; accessed 15-October-2018. http://www.who.int/ebola/situation-reports/drc-2018/en/.
- 10 Kelly JD, Worden L, Wannier R, Hoff NA, Mukadi P, Sinai C, et al. Real-time projections of Ebola outbreak size and duration with and without vaccine use in Équateur, Democratic Republic of Congo, as of May 27, 2018. bioRxiv. 2018;Available from: https://www.biorxiv.org/content/early/2018/06/04/331447.1.
- 11 Ebola haemorrhagic fever in Sudan, 1976. Report of a WHO/International Study Team. Bull World Health Organ. 1978;56(2):247–70. Available from: https://www.ncbi.nlm.nih.gov/pubmed/307455.
- 12 Breman JG, Heymann DL, Lloyd G, McCormick JB, Miatudila M, Murphy FA, et al. Discovery and Description of Ebola Zaire Virus in 1976 and Relevance to the West African Epidemic During 2013-2016. J Infect Dis. 2016;Available from: https://www.ncbi.nlm.nih.gov/pubmed/27357339.
- 13 Baron RC, McCormick JB, Zubeir OA. Ebola virus disease in southern Sudan: hospital dissemination and intrafamilial spread. Bull World Health Organ. 1983;61(6):997–1003. Available from: https://www.ncbi.nlm.nih.gov/pubmed/6370486.
- 14 Georges AJ, Leroy EM, Renaut AA, Benissan CT, Nabias RJ, Ngoc MT, et al. Ebola hemorrhagic fever outbreaks in Gabon, 1994-1997: epidemiologic and health control issues. J Infect Dis. 1999;179 Suppl 1:S65–75. Available from: https://www.ncbi.nlm.nih.gov/pubmed/9988167.
- 15 Khan AS, Tshioko FK, Heymann DL, Le Guenno B, Nabeth P, Kerstiëns B, et al. The reemergence of Ebola hemorrhagic fever, Democratic Republic of the Congo, 1995. Commission de Lutte contre les Epidémies à Kikwit. J Infect Dis. 1999;179 Suppl 1:S76–86. Available from: https://www.ncbi.nlm.nih.gov/pubmed/9988168.
- 16 CDC and Ministry of Health: T Oyok, Odonga C, Mulwani E, Abur J, Kaducu F, Akech M, et al. Outbreak of Ebola Hemorrhagic Fever — Uganda, August 2000–January 2001. MMWR: Morbidity and Mortality Weekly Report. 2001;50(5):73–77. Available from: https://www.cdc.gov/mmwr/PDF/wk/mm5005.pdf.
- 17 Outbreak(s) of Ebola haemorrhagic fever, Congo and Gabon, October 2001-July 2002. Wkly Epidemiol Rec. 2003;78(26):223–8. Available from: https://www.ncbi.nlm.nih.gov/pubmed/15571171.
- 18 Boumandouki P, Formenty P, Epelboin A, Campbell P, Atsangandoko C, Allarangar Y, et al. Prise en charge des malades et des défunts lors de l’épidémie de fièvre hémorragique due au virus Ebola d’octobre à décembre 2003. Bull Soc Pathol Exot. 2005;98(3):218–223. Available from: https://www.researchgate.net/publication/280954258_Prise_en_charge_des_malades_et_des_defunts_lors_de_l%27epidemie_de_fievre_hemorragique_due_au_virus_Ebola_d%27octobre_a_decembre_2003.
- 19 World Health Organization. Weekly epidemiological record. Abonnement annuel. 2005;43(80):369–376. Available from: http://www.who.int/wer/2005/wer8043.pdf.
- 20 Nkoghe D, Kone ML, Yada A, Leroy E. A limited outbreak of Ebola haemorrhagic fever in Etoumbi, Republic of Congo, 2005. Trans R Soc Trop Med Hyg. 2011;105(8):466–72. Available from: https://www.ncbi.nlm.nih.gov/pubmed/21605882.
- 21 Rosello A, Mossoko M, Flasche S, Van Hoek AJ, Mbala P, Camacho A, et al. Ebola virus disease in the Democratic Republic of the Congo, 1976-2014. Elife. 2015;4. Available from: https://www.ncbi.nlm.nih.gov/pubmed/26525597.
- 22 MacNeil A, Farnon EC, Morgan OW, Gould P, Boehmer TK, Blaney DD, et al. Filovirus outbreak detection and surveillance: lessons from Bundibugyo. J Infect Dis. 2011;204 Suppl 3:S761–7. Available from: https://www.ncbi.nlm.nih.gov/pubmed/21987748.
- 23 Uganda: Ebola Situation Report. Bull World Health Organ. 2013;Available from: https://reliefweb.int/sites/reliefweb.int/files/resources/Uganda-Ebola-27august2012.pdf.
- 24 Centers for Disease Control and Prevention. Number of Cases and Deaths in Guinea, Liberia, and Sierra Leone during the 2014-2016 West Africa Ebola Outbreak. 2017;Online; accessed 10-May-2018.
- 25 Wallinga J, Teunis P. Different epidemic curves for severe acute respiratory syndrome reveal similar impacts of control measures. Am J Epidemiol. 2004;160(6):509–16. Available from: https://www.ncbi.nlm.nih.gov/pubmed/15353409.
- 26 Blumberg S, Lloyd-Smith JO. Comparing methods for estimating from the size distribution of subcritical transmission chains. Epidemics. 2013;5(3):131–45. Available from: https://www.ncbi.nlm.nih.gov/pubmed/24021520.
- 27 Lloyd-Smith JO, Schreiber SJ, Kopp PE, Getz WM. Superspreading and the effect of individual variation on disease emergence. Nature. 2005;438(7066):355–9. Available from: https://www.ncbi.nlm.nih.gov/pubmed/16292310.
- 28 Dalziel B, Lau M, Tiffany A, et al. Unreported cases in the 2014–2016 Ebola epidemic: Spatiotemporal variation, and implications for estimating transmission. PLoS Negl Trop Dis. 2018;12(e0006161).
- 29 Henao-Restrepo AM, Camacho A, Longini IM, Watson CH, Edmunds WJ, Egger M, et al. Efficacy and effectiveness of an rVSV-vectored vaccine in preventing Ebola virus disease: final results from the Guinea ring vaccination, open-label, cluster-randomised trial (Ebola Ça Suffit!). Lancet. 2017;389(10068):505–518. Available from: https://www.ncbi.nlm.nih.gov/pubmed/28017403.
- 30 Dalziel BD, Lau MSY, Tiffany A, McClelland A, Zelner J, Bliss JR, et al. Unreported cases in the 2014-2016 Ebola epidemic: Spatiotemporal variation, and implications for estimating transmission. PLoS Negl Trop Dis. 2018;12(1):e0006161. Available from: https://www.ncbi.nlm.nih.gov/pubmed/29357363.
- 31 Gott III JR. Implications of the Copernican principle for our future prospects. Nature. 1993;363:315–319.
Supplemental Information
Results
Data Sources
| Time Period | Country | Reported Count | Time Series Count | Regression? | Stochastic? | Auto-Regression? |
| Aug–Sep 1976 | DRC* | 318 | 262 | Yes | No | Yes |
| Jun–Nov 1976 | Sudan | 284 | 284 | Yes | No | Yes |
| Aug–Sep 1979 | Sudan | 34 | 34 | Yes | Yes | Yes |
| Dec 1994–Feb 1995 | Gabon | 52 | 49 | Yes | No | Yes |
| May–Jul 1995 | DRC | 315 | 317 | Yes | Yes | Yes |
| Jan–Apr 1996 | Gabon | 37 | 29 | Yes | Yes | Yes |
| Jul 1996–Mar 1997 | Gabon | 60 | – | No | No | No |
| Oct 2000–Jan 2001 | Uganda | 425 | 436 | Yes | No | Yes |
| Oct 2001–Jul 2002 | Gabon, Republic of the Congo | 124 | 124 | Yes | Yes | Yes |
| Dec 2002–Mar 2003 | Republic of the Congo | 143 | – | No | No | No |
| Nov–Dec 2003 | Republic of the Congo | 35 | 35 | Yes | Yes | Yes |
| Apr–Jun 2004 | Sudan | 17 | 17 | Yes | Yes | Yes |
| Apr–May 2005 | DRC | 12 | 12 | Yes | Yes | Yes |
| Aug–Nov 2007 | DRC | 264 | 264 | Yes | Yes | Yes |
| Dec 2007–Jan 2008 | Uganda | 131 | 127 | Yes | Yes | Yes |
| Dec 2008–Feb 2009 | DRC | 32 | 32 | Yes | Yes | Yes |
| Jun–Aug 2012 | Uganda | 24 | 24 | Yes | Yes | Yes |
| Jun–Nov 2012 | DRC | 52 | 52 | Yes | Yes | Yes |
| Aug–Nov 2014 | DRC | 66 | 62 | Yes | Yes | Yes |
| Jul–Oct 2014 | Nigeria (offshoot of West African outbreak) | 20 | – | No | No | No |
| Jan 2014–Jun 2016 | Guinea, Liberia, Sierra Leone | 28,616 | 21,422 | Yes | No | Yes |
| Apr–Jun 2018 | DRC | 53 | 53 | Yes | Yes | Yes |
*Democratic Republic of Congo (formerly Zaire)
Table 1 summarizes the past outbreaks used as data to inform our models.
We retained snapshots of the set of available case counts at multiple time points, for use in scoring of retrospective model projections against known subsequent counts (Figure 8). In later data sets, due to the larger number of data points, a subset of the case counts was selected for use in the stochastic model’s particle filtering step, as noted in the figure.
| Data as of 8-20-2018 | Data as of 8-27-2018 |
 |
 |
| Data as of 9-5-2018 | Data as of 9-15-2018 |
 |
 |
| Data as of 10-7-2018 | Data as of 10-13-2018 |
 |
 |
Stochastic Model
Epidemic curves reported for past Ebola outbreaks were used to estimate time series of effective reproduction number () by day, which were then fit to an exponential quenching curve (Figure 9). The parameters and estimated by that curve fitting on past epidemics were then used to create a distribution from which values were sampled to parametrize the stochastic simulation (Figure 10).

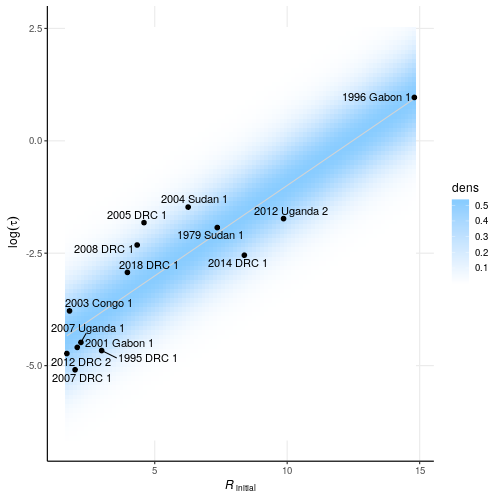
The and parameters driving simulated outbreaks that were successful in passing the particle filtering step tended to cluster in particular locations within the assumed distribution (Figure 11). In some cases, distinct ranges of and/or were selected in conjunction with the different vaccine coverage scenarios.
| Data as of 8-20-2018 | Data as of 8-27-2018 |
 |
 |
| Data as of 9-5-2018 | Data as of 9-15-2018 |
 |
 |
| Data as of 10-7-2018 | Data as of 10-13-2018 |
 |
 |
For simulation based on cases as of August 20, 320 outbreaks were retained from 10,196,928 simulated outbreaks after filtering based on approximate agreement with reported case counts from the current outbreak. For the August 27 data set, 320 were retained from 11,622,528; for September 5, 321 were retained from 6,492,672; for September 15, 320 from 39,537,792; and for October 7, 320 from 48,845,376.
The simulations passing the particle filtering step, representing a distribution of parameter values and vaccine scenarios, were continued beyond the particle filtering points to generate a spreading set of projections of case counts at later dates (Figure 12), which was smoothed to create probabilistic projections of future case counts at the desired dates.
| Data as of 8-20-2018 | Data as of 8-27-2018 |
 |
 |
| Data as of 9-5-2018 | Data as of 9-15-2018 |
 |
 |
| Data as of 10-7-2018 | Data as of 10-13-2018 |
 |
 |
Projections
We have recorded the projections generated by our models from older data sets to assess the development of the projections as the outbreak has progressed, in Figures 13, 14, 15, and 16.
| Data as of 8-20-2018 | Data as of 8-27-2018 |
|---|---|
 |
 |
| Data as of 9-5-2018 | Data as of 9-15-2018 |
 |
 |
| Data as of 10-7-2018 | |
 |
| Data as of 8-20-2018 | Data as of 8-27-2018 |
|---|---|
 |
 |
| Data as of 9-5-2018 | Data as of 9-15-2018 |
 |
 |
| Data as of 10-7-2018 | |
 |
| Data as of 8-20-2018 | Data as of 8-27-2018 |
|---|---|
 |
 |
| Data as of 9-5-2018 | Data as of 9-15-2018 |
 |
 |
| Data as of 10-7-2018 | |
 |
| Data as of 8-20-2018 | Data as of 8-27-2018 |
|---|---|
 |
 |
| Data as of 9-5-2018 | Data as of 9-15-2018 |
 |
 |
| Data as of 10-7-2018 | |
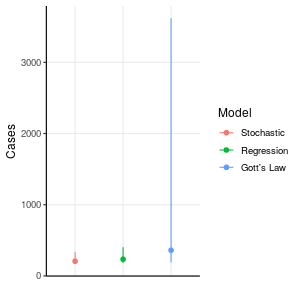 |
Table 2 summarizes the medians and 95% prediction intervals produced by each model on the most recent data set included, and their probabilities of outcomes exceeding the 2013–2016 outbreak.
| Forecast as of | Forecast | Model | Lower | Median | Upper | Over 28,616 |
|---|---|---|---|---|---|---|
| 2018-10-13 | 2018-10-20 | Auto-Regression | 214 | 227 | 258 | 0.00000 |
| 2018-10-13 | 2018-10-20 | Stochastic | 200 | 214 | 243 | 0.00000 |
| 2018-10-13 | 2018-10-27 | Auto-Regression | 215 | 240 | 307 | 0.00000 |
| 2018-10-13 | 2018-10-27 | Stochastic | 205 | 226 | 268 | 0.00000 |
| 2018-10-13 | 2018-11-10 | Auto-Regression | 216 | 259 | 395 | 0.00000 |
| 2018-10-13 | 2018-11-10 | Stochastic | 208 | 245 | 315 | 0.00000 |
| 2018-10-13 | 2018-12-13 | Auto-Regression | 217 | 279 | 501 | 0.00000 |
| 2018-10-13 | 2018-12-13 | Stochastic | 204 | 268 | 428 | 0.00000 |
| 2018-10-13 | final | Gott’s Law | 222 | 421 | 4219 | 0.00526 |
| 2018-10-13 | final | Regression | 216 | 277 | 485 | 0.00000 |
| 2018-10-13 | final | Stochastic | 210 | 274 | 632 | 0.00000 |