Rare finding of a 100 kpc large double-lobed radio galaxy hosted in the Narrow line Seyfert 1 galaxy SDSS J103024.95+551622.7
Abstract
Among the large varieties of active galactic nuclei (AGN) known, narrow line Seyfert 1 (NLSy1) galaxies are a puzzling class, particularly after the discovery of -ray emission in a handful of them using observations from the Fermi Gamma-ray Space Telescope. Here, we report the discovery of a rare large double lobed radio source with its radio core associated with a NLSy1 galaxy SDSS J103024.95+551622.7 at z = 0.435. The lobe separation is 116 kpc which is the second largest known projected size among NLSy1 radio sources. This finding is based on the analysis of 1.4 GHz data from the Faint Images of the Radio Sky at Twenty-centimeters (FIRST) archives. Along with the core and edge-brightened lobes we detected significant (30%) fraction of clear diffuse emission showing typical back-flow from FR II radio galaxy lobes. For the source, we estimated a jet power of 3 1044 erg s-1 suggesting that its jet power is similar to that of classical radio galaxies. Emission from the source is also found to be non-variable both in the optical and mid-infrared bands. Identification of more such sources may help to reveal new modes of AGN and understand their role in black hole galaxy evolution.
1 Introduction
Narrow Line Seyfert 1 (NLSy1) galaxies are a peculiar type of active galactic nuclei (AGN), characterized by the narrow H emission line with full width at half maximum (FWHM) less than 2000 km s-1 and weak [O III] lines relative to H with [O III]/H 3 (Osterbrock & Pogge, 1985; Goodrich, 1989). In addition, these sources have strong FeII emission in the UV optical region of the spectrum, soft X-ray excess, steep soft X-ray spectrum (Wang et al., 1996; Boller et al., 1996) and show rapid large amplitude X-ray flux variations (Leighly, 1999; Boller et al., 1996; Rani et al., 2017). These extreme properties shown by NLSy1 galaxies are generally attributed to them having low mass black holes(BHs) and accreting close to the Eddington limit (Boroson & Green, 1992; Sulentic et al., 2000). However, recent results on limited number of sources indicate that NLSy1 galaxies too have BH masses similar to BLSy1 galaxies and their observed black hole mass deficit could be due to geometrical effects (Calderone et al., 2013; Baldi et al., 2016; Liu et al., 2016; Rakshit & Stalin, 2017).
A fraction of about 7% NLSy1 galaxies are known to be radio-loud characterized by the radio loudness parameter ***R is defined as the ratio of the flux density in the radio band at 5 GHz and the flux density in the optical -band 10 (Kellermann et al., 1989). About 2% of NLSy1 galaxies are found to be very radio-loud (see Komossa et al., 2006; Zhou et al., 2006). Increasing the sample of NLSy1 galaxies too yielded a low fraction of radio-loud NLSy1 (RL-NLSy1) galaxies of around 5% (Rakshit et al., 2017). The low fraction of RL-NLSy1 galaxies relative to the quasar population of AGN indicates that they are either a rare population of sources or they are weak jet sources. However, detection of strong radio emission, compact core with high brightness temperature, significant radio variability etc. in some NLSy1 galaxies indicate the presence of relativistic jets with blazar like characteristic (Yuan et al., 2008; Lähteenmäki et al., 2017). Some of the NLSy1 galaxies exhibit flat or inverted radio spectra while others show steep radio spectra (Gu et al., 2015). Interestingly, from about a dozen RL-NLSy1 galaxies -ray emission has been detected by the Large Area Telescope (LAT; e.g., Abdo et al., 2009; D’Ammando et al., 2015; Paliya et al., 2018) on board the Fermi Gamma-ray Space Telescope, making them very special candidates to study the jet formation process. The broad band spectral energy distribution of these -ray detected NLSy1 galaxies have the double hump structure typical of blazars and specifically show resemblance to the flat spectrum category of AGN (Paliya et al., 2018). Accordingly, the low energy hump of their SED is explained by synchrotron emission processes and their high energy hump is attributed to external Compton processes.
In terms of radio morphology, RL-NLSy1 galaxies are generally considered to be compact and unresolved at the resolution of the images available in the Faint Images of the Radio Sky at Twenty-Centimeters (FIRST) archives based on observations with the Very Large Array in its B configuration. Only recently, RL-NLSy1 galaxies are known to have kilo parsec (kpc) scale radio emission and as of today less than two dozen NLSy1 galaxies have been detected with kpc scale jets (Whalen et al., 2006; Antón et al., 2008; Gliozzi et al., 2010; Doi et al., 2012, 2015; Richards & Lister, 2015; Congiu et al., 2017), that too, with linear sizes lesser than 150 kpc. As presented in Table 1, we see that none of them show Fanaroff & Riley II (FR II, Fanaroff & Riley 1974) like double lobed structure at 100 kpc scale, to be comparable to standard radio galaxies (Kapahi, 1989; Singal, 1993). Detection of 100 kpc scale emissions in RL-NLSy1 galaxies, making them comparable to standard radio galaxies is extremely important as this can shed new light into the jet-launching mechanism. Since radio jets are typically launched in low accretion rate on to high mass spinning black holes hosted in ellipticals, finding them in NLSy1 galaxies (typically low black hole mass, with high accretion rate in disk galaxies with gas rich central regions) is in clear contrary to expectations (Berton et al., 2018).
In this paper, we report the detection of 100 kpc radio emission with standard FR II radio galaxy like lobes, from SDSS J103024.95+551622.7, which was recently classified as a NLSy1 galaxy by Rakshit et al. (2017) using Sloan Digital Sky Survey (SDSS) DR 12 spectroscopic data (Alam et al., 2015). This source has FWHM(H) km s-1, , , monochromatic luminosity at 5100 , (erg s-1) and a black hole mass of (Rakshit et al., 2017). In the soft X-ray (0.1–2 KeV) using ROSAT observations, it was found to have a steep photon index of (Boller et al., 2016). The paper is structured as follows. The sample and the data are discussed in section 2. The results are given in section 3 followed by the interpretation and discussion in section 4. The conclusions are given in section 5. A cosmology with , and is used throughout.
.
2 Sample and Data
Our NLSy1 galaxy sample consists of all the 11,101 NLSy1 galaxies cataloged by Rakshit et al. (2017) from SDSS DR 12 spectroscopic data base. This is about five fold increase in the number of NLSy1 galaxies known prior to this work from Zhou et al. (2006). To find the radio counterparts to the NLSy1 galaxies reported in Rakshit et al. (2017) we cross matched each NLSy1 galaxy with the FIRST catalog (Catalog version 14dec17†††http://sundog.stsci.edu/first/catalogs.html) around a circular region of radius 2 arcsec. This search provided us with a sample of 555 NLSy1 galaxies detected by FIRST. We then visually examined each of these 555 FIRST detected NLSy1 galaxies for the presence of extended radio emission. This careful examination led to the discovery of one source, J103024.95+551622.7, with a very large extended radio emission. The core coincides with the optical nucleus with extended emission on both sides of the radio core.
3 Results
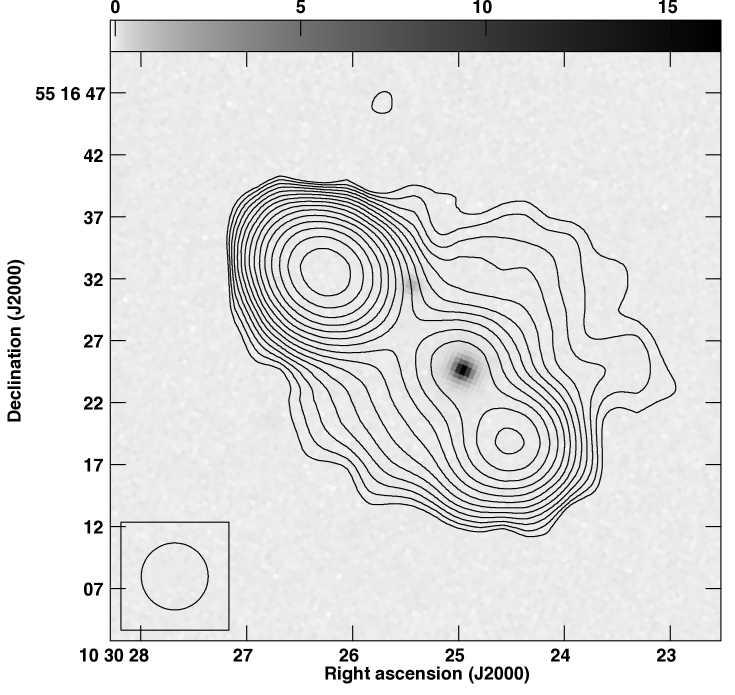
We report the detection of a large kpc scale structure in the RL-NLSy1 galaxy based on the analysis of the FIRST images. It was discovered in the course of our analysis of the radio properties of the new sample of NLSy1 galaxies recently published by Rakshit et al. (2017). Figure 1 shows the radio contours of J103024.95+551622.7 from the FIRST image at 1.4 GHz superposed on its SDSS -band image.
3.1 Radio Structure
The source has a radio core ( = 10:30:24.787, = 55:16:18.48 with peak flux = 14 mJy beam-1) and extended radio structures. The angular separation between the north-east (NE) (72 mJy beam-1) and south-west (SW) (21 mJy beam-1) peaks is 20.5 arc sec which for the redshift of the host galaxy corresponds to a projected size‡‡‡Hereafter, all the sizes are projected size unless specified otherwise. of 116 kpc. Along with peaks at the lobes and the radio core coinciding with the host galaxy seen in the SDSS -band image, there is significant diffuse emission present on either sides of the double lobe. This is a strong evidence that the NE and SW peaks are not unrelated point sources but they constitute a single radio galaxy with FR II like radio structure with back flow from hotspot regions causing the diffuse emission. Integrated flux calculated for the whole source from the FIRST image is 155 mJy. So the diffuse emission (subtracting the core and peaks at lobes from the integrated flux ( mJy) constitute a major 30% of the whole radio source flux density. It may also be noted that the radio source (lobe-core-lobe) does not lie in a straight line and is slightly bent with the NE lobe brighter than the SW counterpart. Also, the presence of diffuse radio emission at the resolution of FIRST can be established from the dimensionless concentration parameter (Ivezić et al., 2002), , where and are the integrated and peak flux densities of the source respectively. is found to be 1.69, much larger than the value of 1.06 above which a source is defined as “resolved” by Kimball & Ivezić (2008), indicating an extended emission. Since, FIRST is a high resolution survey, it is insensitive to the very extended emission originating from the lobes. However, NVSS at the same frequency provides low resolution images thus detecting much extended emission. Therefore, following Singh et al. (2015), we estimated , where and are the integrated flux densities obtained from NVSS and FIRST images respectively. The value of turns out to be 2.18 suggesting the presence of additional faint low-surface-brightness radio component in the source apart from the extended radio emission detected in FIRST.
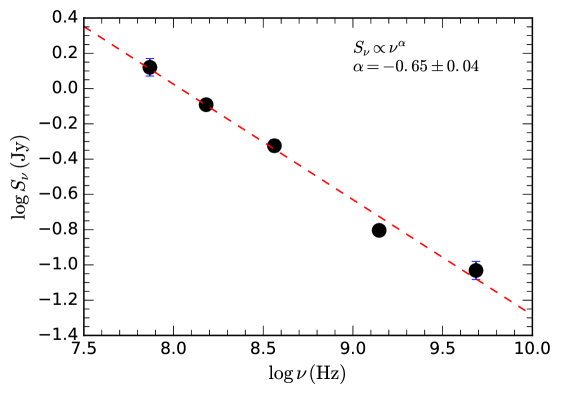
To estimate the radio spectral index () we collected the multi-frequency radio data from the NASA/IPAC Extragalactic Database (NED)§§§http://nedwww.ipac.caltech.edu and estimated using data from 74 MHz to 5 GHz utilizing a linear least-square fit in the log-log plane. This is shown in the bottom panel of Figure 1. A steep radio spectra () with has been found for this object suggesting an extended emission originating from the young radio lobes.
3.2 Variability
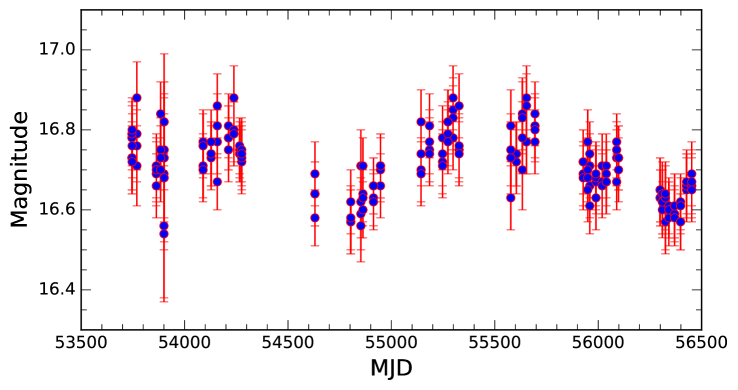
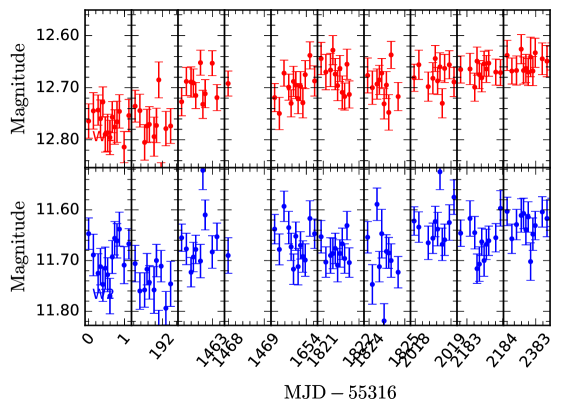
The variability of the source in the optical and mid-IR bands was also investigated using data from the Catalina Real Time Transient Survey (CRTS, Drake et al. 2009 and the Wide-field Infrared Survey Explorer (WISE; Wright et al., 2010) database, respectively. The CRTS optical light curve is shown in the top panel of Figure 2. The amplitude of variability () was calculated following Sesar et al. (2007) (see also Ai et al., 2010; Rakshit & Stalin, 2017). The source is found to be non-variable in optical. It is also found to be non-variable in the mid-infrared 1 and 2 bands both on short time scales ( 1 day) and long time scales ( 7 years).
.
.
3.3 Optical spectra
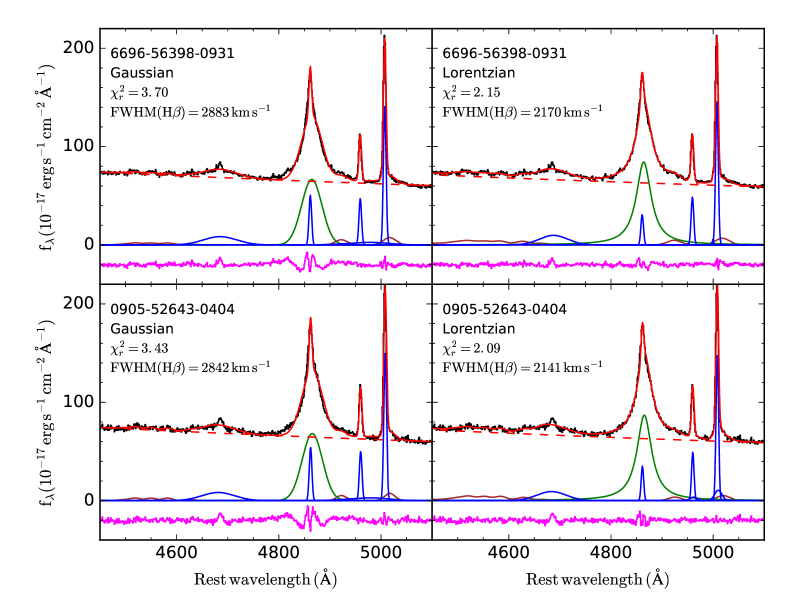
To check on the NLSy1 galaxy classification of SDSS J103024.95+551622.7, we collected the SDSS spectra, removed the effects of Galactic extinction, brought it to the rest frame, and re-analysed it using the spectral decomposition procedure described by Rakshit et al. (2017) but without subtracting the host galaxy component, which is negligible as the redshift of the object is . The source was observed twice, hence we fitted both the spectra as shown by the black line in the upper and lower panels of Figure 3 for two different cases; when broad H component was fitted using a Gaussian function (left) and a Lorentzian function (right). A Lorentzian function provides a better fit to the spectra having lower reduced- value in both the spectra. The use of Lorentzian function to fit the broad component of the H emission naturally provides narrower FWHM which are km s-1 and km s-1 for the two epochs compared to km s-1 and km s-1, respectively, found using a Gaussian function. The canonical definition of NLSy1 galaxies pertain to sources with FWHM(H) 2000 km s-1 (Goodrich, 1989). However, the criteria of FWHM(H) 2200 km s-1 has been used in the initial catalog of NLSy1 galaxies by Zhou et al. (2006) and recently by Rakshit et al. (2017) since the distribution of broad H line width is smooth with no sharp cutoff between NLSy1 and BLSy1 galaxies. Moreover, a higher cutoff of FWHM(H) km s-1 based on quasar main sequence (Sulentic et al., 2000), a luminosity-dependent cutoff value for H line width (Laor, 2000; Véron-Cetty et al., 2001), or a Eddington ratio cutoff () (Netzer & Trakhtenbrot, 2007) have also been suggested for NLSy1 galaxies. The source studied here is close to the boundary of 2200 km s-1 adopted by Zhou et al. (2006) and Rakshit et al. (2017). However, it has low [OIII]/H ratio and steep soft X-ray spectral index and a Eddington ratio of . Putting all the other characteristics together, it is most likely that SDSS J103024.95+551622.7 is a NLSy1 galaxy.
4 Interpretation and discussion
4.1 Comparison with a sample of NLSy1 galaxies
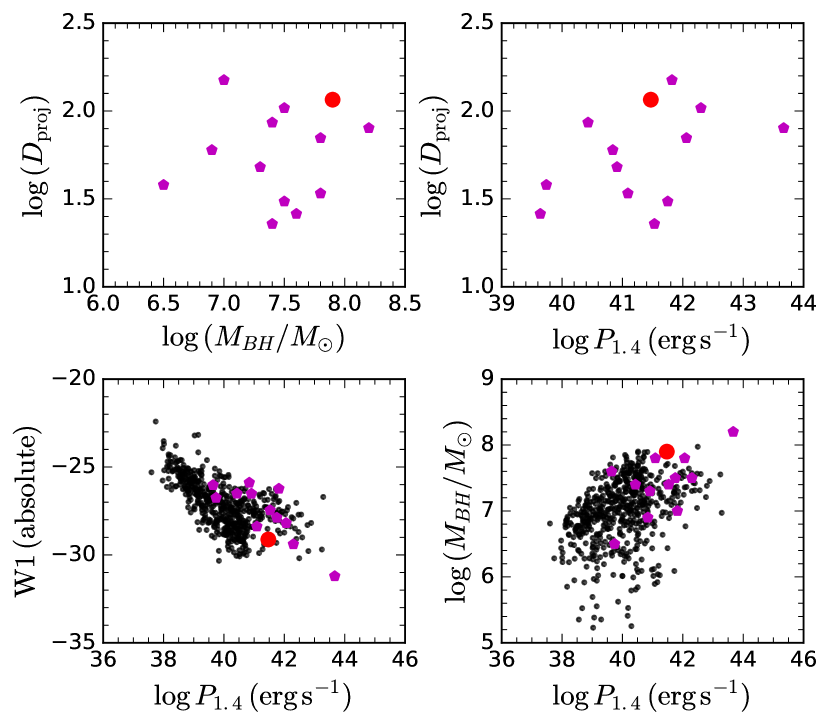
We collected various information of all the NLSy1 galaxies having larger than 20 kpc radio emission from the literature and tabulated them in Table 1. Note that one of the sources, NVSS J095317+283601 in Table 1 has FHWM of H (2162 201 km s-1) similar to the value of SDSS J103024.95+551622.7. A higher FWHM (H) will lead to a higher black hole mass. However, all the sources except SDSS J122222.55+041315.7 in Table 1 have black hole masses . We investigated the relationship between projected size of the radio jet () with and radio power at 1.4 GHz () for NLSy1 galaxies in Figure 4. The red point in each panel represents SDSS J103024.95+551622.7. The magenta polygons represent NLSy1 galaxies that have larger than 20 kpc extended radio structures (see Table 1). No correlation was found between the projected size both with (or jet power). When the sources are put in the WISE 1-band absolute magnitude vs. radio power diagram, a strong correlation is found. The points in this plot are the NLSy1 galaxies from Rakshit et al. (2017) which are detected in FIRST and WISE in 1-band with S/N 10. The Spearman correlation test on the full sample yields a correlation coefficient () of and a very low value () suggesting a significant negative correlation where absolute IR magnitude decreases with radio power. The black hole mass of all those objects is plotted against their radio power on the right panel. We found a positive correlation having which is similar to the correlation found by Liu et al. (2006) between jet power and black hole mass suggesting high powered jets originate from massive AGN. From Figure 4 (bottom right panel) it is evident that NLSy1 galaxies with 20 kpc radio structure predominantly occupy the region with large radio power and high black hole mass. In terms of the projected radio size SDSS J103024.95+551622.7 is the second largest NLSy1 galaxy after SDSS J110006.07+442144.3¶¶¶Note that SDSS J110006.07+442144.3 does not satisfy flux ratio (Tanaka et al., 2014) required for NLSy1 galaxy classification.. In Figure 4, it follows the anti-correlations and correlation, thus not different from other kpc scale radio emitting NLSy1 galaxies.
4.2 A standard powerful radio galaxy
From the radio spectrum in Figure 1, we see that the spectrum is steep. Considering the lobes of radio galaxies which are optically thin, the derived spectral index of 0.65 0.04 is very close to the theoretical value of injection spectral index of around 0.62∥∥∥A negative sign is used to match the definition of spectral index. (Kirk et al., 2000; Konar et al., 2013). If the radio jets have the same spectral index of 0.65 then the inverse-Compton effect of the cosmic microwave background (CMB) and radio photons together can give rise to a X-ray power-law spectrum in the 0.1 to 10 kev range whose photon index is supposed to be (1+0.65) = 1.65 (Konar et al., 2009). However, for the source SDSS J103024.95+551622.7 the photon index estimated from ROSAT data is 2.61 which is much steeper. To resolve this inconsistency, we need further observations in the 0.1 to 10 keV band. The presence of strong [O III] doublet, as seen in Figure 3, indicates strong black body emission from the accretion disk, suggesting a standard accretion disk through which the matter is being accreted onto the black hole of this source. Therefore, this NLSy1 radio galaxy is a High Excitation Radio Galaxy (HERG) in which cold mode accretion is taking place (Allen et al., 2006). Assuming the radio spectral index (0.65) of this radio galaxy to be the injection spectral index (), the correlation between and jet power , as published by Konar & Hardcastle (2013), in their Figure 2, we estimated a jet power of this source to be erg s-1. This suggests that this NLSy1 galaxy has a jet power typical of classical radio galaxies.
In the lower left panel of Figure 4, we see that there is a strong correlation between 1 and . Most of the luminosity in the 1-band of WISE comes from the old stars in the bulge. This means, more the 1 luminosity, heavier is the bulge. The heavier the bulge heavier the black hole mass (Kormendy & Richstone, 1995). Heavier the black hole mass, we might get higher jet power provided the Eddington scaled mass accretion rate and the spin of the black holes are in a narrow range. We indeed get a correlation between black hole mass and the radio power at 1.4 GHz (which is a proxy of jet power). Therefore, we can expect that all NLSy1 galaxies are accreting with Eddington scaled mass accretion rate within a very narrow range. If spin of the black hole has a role in deciding the jet power, then all the NLSy1 galaxies must have spin within a very narrow range (or jet power has no dependence on the spin). Therefore, the correlations in the left and right bottom panels are quite expected.
Similarly, the absence of correlation in the top right and top left panels are also quite expected. Let us consider the top left panel, where source size vs. has been plotted. If the source size would have depended only on the jet power, then we would have perhaps got a correlation between source size and the black hole mass. However, the source size depends on jet power (), density () of ambient medium and the angle () of the jet with the Line of Sight (LoS). Even if the jet power is correlated with the black hole mass, the scatter of the values of and from source to source will spoil any correlation between source size and the black hole mass. Since black hole mass and are correlated, it is not expected to get any correlation between source size and , as there is no correlation between source size and black hole mass. A larger sample will help to address this.
4.3 Link with Speca:
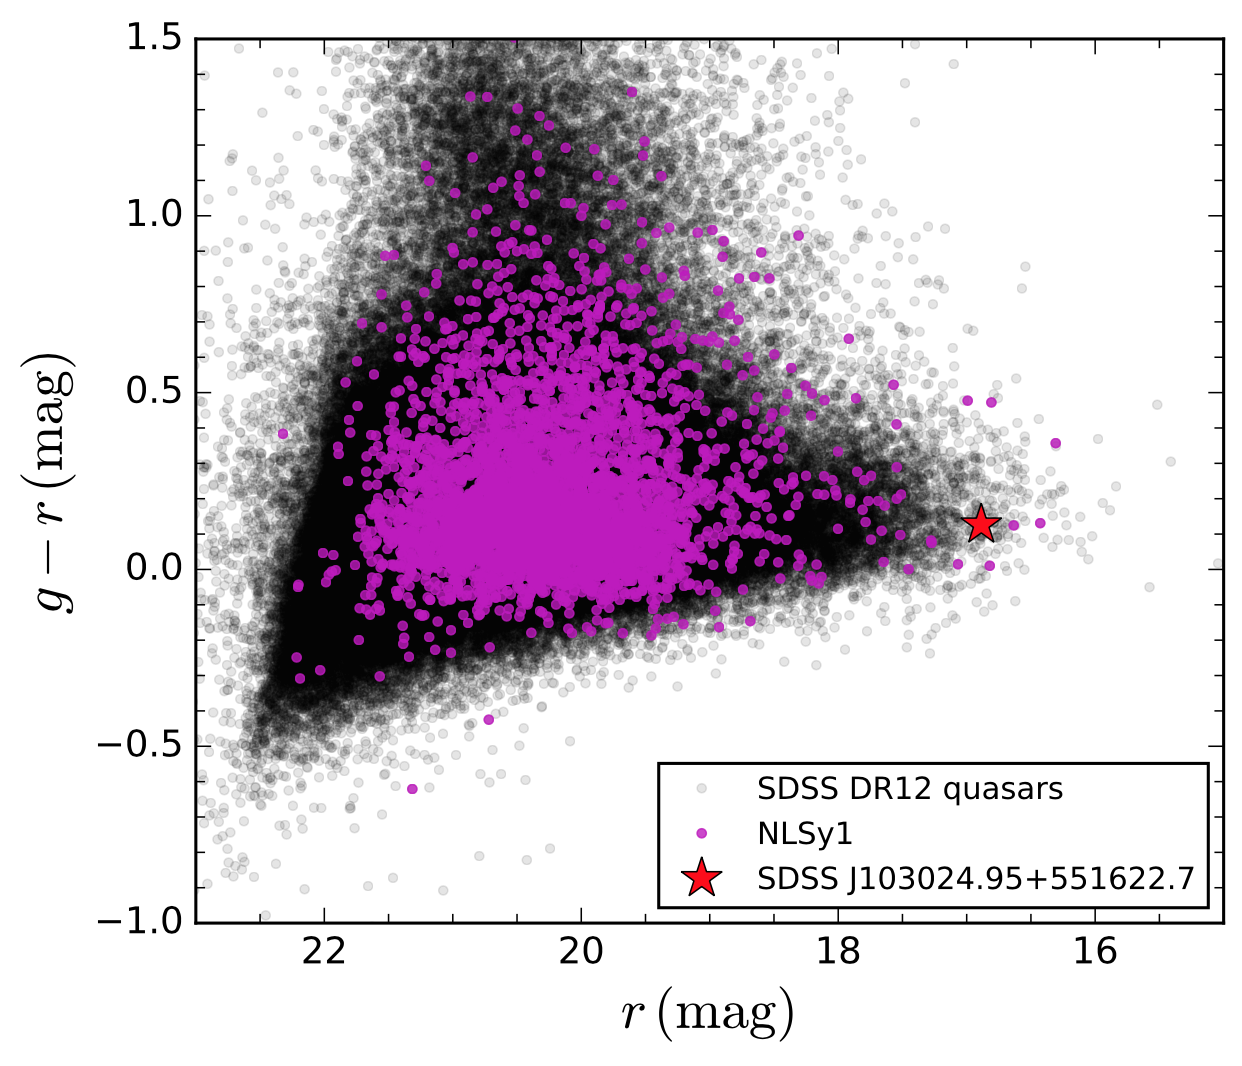
NLSy1 galaxies are more often associated with spiral or disk galaxies with rich gaseous central regions (Deo et al., 2006; Ohta et al., 2007). Not only in NLSy1 galaxies but also in general Seyfert galaxies, radio-loud galaxies with over 100 kpc large radio lobes are rare. While almost all large (over 100 kpc) radio galaxies are hosted in elliptical galaxies only six of them are known to be hosted in disk/spiral galaxies with large radio lobes. In Figure 5, we plotted the optical color against magnitude of NLSy1 galaxies from Rakshit et al. (2017) in dots (magenta) along with SDSS quasars in the background (black dots). Our target is represented by a star symbol having a color of 0.10 mag. According to Banerji et al. (2010), a galaxy can be defined as a spiral if the observer-frame mag (see also Tempel et al., 2011). Thus, SDSS J103024.95+551622.7 can be considered as a spiral galaxy following the above criteria. According to the plot, majority of the NLSy1 galaxy is expected to be spiral. However, deep imaging observations of NLSy1 galaxies are needed to confirm if the hosts of NLSy1 galaxies are indeed spirals. Nevertheless, a few examples of spiral host radio galaxies are known such as J0313-192 (Ledlow et al., 1998), Speca (Hota et al., 2011), J0314-1906, J2345-0449, J0836+0532 and MCG+07-47-10 (Hota et al., 2016). It is likely that such spiral host radio galaxies could be more frequent in the early Universe, prior to the quasar/radio galaxy era ( 23 ) and when spiral galaxies were more prevalent than the merger-remnant ellipticals (Hota et al., 2016). Thus, this new object reported here SDSS J103024.95+551622.7, and hosted in a spiral galaxy may represent an opportunity to investigate non-standard modes of relativistic jet production in passively evolving galaxies with smaller black holes masses which may have been more common in the early Universe, prior to the rise of merger-remnant ellipticals and supermassive black holes.
4.4 Doppler factor, inclination angle and age
The observed core dominance parameter (; Orr & Browne 1982) can be calculated from the ratio of core (Score) to lobe (Slobe) flux densities. At 1.4 GHz from FIRST, the source has an integrated core flux density of 32.7 mJy with the SW and NE lobes having integrated flux densities of 21.9 mJy and 95.3 mJy respectively. The observed core dominance parameter is thus . This value is higher than that known for radio galaxies with FR I and FR II radio morphologies having median values = 0.022 and 0.003 respectively (Morganti et al., 1997). We note that blazars show extreme core dominance, which is caused by Doppler boosting of the core (Chen et al., 2015). We calculated Doppler factor () following Doi et al. (2012)
| (1) |
where is the intrinsic core dominance parameter and is the core spectral index. We assumed the core spectral index to be flat with . Calculation of needs an estimation of the intrinsic core power. We derived the intrinsic core power using the empirical relation known for radio galaxies and given by (Giovannini et al., 2001), where is the core radio power at 5 GHz and is the total radio power at 408 MHz. Using the core flux at 5 GHz and the total flux at 365 MHz from NED, we found = 0.008. This is much lower than suggesting strong Doppler boosting in the core. Using equation 1 we estimated .
To constrain the jet speed () and inclination angle () we used the relation . This relation is highly degenerate, however, we obtained values of and . These values are similar to that obtained by Doi et al. (2012) for a sample of NLSy1 galaxies suggesting that radio-loud NLSy1 galaxies are viewed pole-on. Similar low inclination values in the range of were also obtained by Richards & Lister (2015) for other kpc-scale jetted NLSy1 galaxies. Considering a viewing angle of 12∘, we found the deprojected size of the source as kpc.
The source exhibits a two-sided structure at kpc scale as seen in Figure 1. Therefore, the flux ratio of the approaching and receding lobes () were used to calculate the speed of the kpc scale lobes following Richards & Lister (2015)
| (2) |
where the spectral index . Using, , we obtained . Assuming the inclination angle to remain constant between the core and kpc scale lobes, i.e. , we obtained . Considering the expansion speed of and a two-sided expansion, we estimated the kinetic age of the source using , where is the deprojected size of the source. We obtained yr.
We also estimated the limiting radiative age of this radio source as , where is the lobe magnetic field expressed in nT, nT is the Cosmic Microwave Background equivalent magnetic field (Konar et al., 2006) and is the break frequency (in GHz) observed in the radio spectrum. From the above expression, we get the highest radiative age, when . Using nT, we obtained a radiative age of 20.2 Myr for the break frequency of 5 GHz. Since there is no break observed in the radio spectrum, the highest observed radio frequency is the lower limit of the break frequency. Thus, GHz, corresponds to Myr. Both the kinetic and radiative age measurements agree well and provide a strong constraint on the age of SDSS J103024.95+551622.7 to be yr. This also lies within the age range of yr found for other radio-loud NLSy1 galaxies by Doi et al. (2012) and Richards & Lister (2015). It is thus likely that NLSy1 galaxies are young AGN (Mathur et al., 2001).
5 Conclusion
The object SDSS J103024.95+551622.7 has recently been classified as a NLSy1 galaxy by Rakshit et al. (2017) after carefully modeling the spectrum from SDSS DR 12 database. While studying the 1.4 GHz radio images obtained by the FIRST survey, the source is found to have a 116 kpc (projected size) large double lobe FR II like radio structure and a central core coinciding with the NLSy1 optical galaxy. The core and diffuse emission, associated with the back flow from lobes, conclusively proves the radio lobes and host galaxy association.
The source exhibits a steep radio spectrum with estimated from the multi-frequency radio data collected from NED database. The source is non-variable in the optical and mid-infrared bands. We modeled the emission spectra of the source obtained by SDSS during its 2 epochs of observation and found that a Lorentzian function can best represent the broad component of H line rather than a Gaussian function. The results obtained from the fitting of two spectra are consistent having width less than 2200 km s-1 and F([O III])/ F(H) making it a NLSy1 galaxy as also cataloged by Rakshit et al. (2017). Though nearly a dozen NLSy1 galaxies have been found to have 20150 kpc extended radio emission, none of them are observed to be fully blown double-lobed, larger than 100 kpc sources to be compared to classical radio galaxies. This is a large (116 kpc) FR II like double lobe radio source associated with a NLSy1 as the host galaxy. As radio galaxies are typically hosted in ellipticals and extremely rarely (only six) with spirals, understanding of the host or parent population of these NLSy1 galaxies with jets and lobes are far from clear. Radio jets are typically produced in massive spinning black holes with low accretion rate and hence this counter-trend NLSy1 galaxy, SDSS J103024.95+551622.7 with larger than 100 kpc radio lobes may help to understand the unexplored parameter space of jet production mechanism and AGN feedback-driven galaxy evolution.
| Name | RA (2000) | Dec (2000) | z | FWHM | log() | W1 | Ref. | ||||
|---|---|---|---|---|---|---|---|---|---|---|---|
| (km s-1) | (kpc) | (erg s-1) | (mag) | ||||||||
| (1) | (2) | (3) | (4) | (5) | (6) | (7) | (8) | (9) | (10) | (11) | (12) |
| 1H 0323+342* | 03:24:41.1 | 34:10:46 | 0.063 | 1520 | 7.3 | 48 | 40.91 | 1.21 | 0.1 | 10.74 0.02 | Doi et al. (2012) |
| PKS 0558-504 | 05:59:47.4 | 50:26:52 | 0.137 | 1250 | 7.8 | 34 | 41.09 | 1.18 | 0.3 | 10.67 0.02 | Gliozzi et al. (2010) |
| PMN J0948+0022* | 09:48:57.3 | 00:22:26 | 0.585 | 1432 | 7.5 | 104 | 42.30 | 1.01 | 0.77 | 13.28 0.02 | Doi et al. (2012) |
| NVSS J095317+283601 | 09:53:17.1 | 28:36:02 | 0.659 | 2162 | 7.8 | 70.2 | 42.06 | 1.03 | 0.50 | 14.80 0.03 | Richards & Lister (2015), |
| SDSS J103024.95+551622.7 | 10:30:24.9 | 55:16:23 | 0.435 | 2170 | 7.9 | 116.0 | 41.47 | 1.69 | 0.65 | 12.78 0.02 | This work |
| SDSS J110006.07+442144.3 | 11:00:06.1 | 44:21:44 | 0.84 | 1900 | 7.0 | 150 | 41.82 | 1.37 | 0.20 | 17.40 0.13 | Tanaka et al. (2014), Gabányi et al. (2017) |
| SDSS J120014.08-004638.7 | 12:00:14.1 | 00:46:39 | 0.179 | 1945 | 7.4 | 86 | 40.43 | 1.81 | — | 13.18 0.02 | Doi et al. (2012) |
| SDSS J122222.55+041315.7* | 12:22:22.5 | 04:13:16 | 0.966 | 1734 | 8.2 | 80 | 43.67 | 1.03 | 0.30 | 12.80 0.02 | Yao et al. (2015) |
| Mrk 783 | 13:02:58.8 | 16:24:27 | 0.067 | 770 | 7.6 | 26.0 | 39.64 | 1.24 | 0.67 | 11.37 0.02 | Congiu et al. (2017) |
| NVSS J143509+313149 | 14:35:09.5 | 31:31:48 | 0.502 | 1719 | 7.5 | 30.6 | 41.75 | 1.06 | 0.72 | 14.39 0.03 | Richards & Lister (2015) |
| SDSS J145041.93+591936.9 | 14:50:41.9 | 59:19:37 | 0.202 | 1159 | 6.5 | 38 | 39.74 | 1.02 | — | 13.23 0.02 | Doi et al. (2012) |
| PKS 1502+036* | 15:05:06.5 | 03:26:31 | 0.409 | 1082 | 6.6 | 25 | 42.46 | 1.02 | 0.70 | 14.02 0.02 | D’Ammando et al. (2013) |
| FBQS J1644+2619* | 16:44:42.5 | 26:19:13 | 0.144 | 1507 | 6.9 | 60 | 40.84 | 1.01 | 0.38 | 13.28 0.02 | Doi et al. (2012) |
| NVSS J172206+565452 | 17:22:06.0 | 56:54:52 | 0.426 | 1385 | 7.4 | 22.8 | 41.53 | 1.03 | 0.64 | 14.39 0.03 | Richards & Lister (2015) |
References
- Abdo et al. (2009) Abdo, A. A., Ackermann, M., Ajello, M., et al. 2009, ApJ, 699, 976
- Ai et al. (2010) Ai, Y. L., Yuan, W., Zhou, H. Y., et al. 2010, ApJ, 716, L31
- Alam et al. (2015) Alam, S., Albareti, F. D., Allende Prieto, C., et al. 2015, ApJS, 219, 12
- Allen et al. (2006) Allen, S. W., Dunn, R. J. H., Fabian, A. C., Taylor, G. B., & Reynolds, C. S. 2006, MNRAS, 372, 21
- Antón et al. (2008) Antón, S., Browne, I. W. A., & Marchã, M. J. 2008, A&A, 490, 583
- Baldi et al. (2016) Baldi, R. D., Capetti, A., Robinson, A., Laor, A., & Behar, E. 2016, MNRAS, 458, L69
- Banerji et al. (2010) Banerji, M., Lahav, O., Lintott, C. J., et al. 2010, MNRAS, 406, 342
- Berton et al. (2018) Berton, M., Congiu, E., Järvelä, E., et al. 2018, ArXiv e-prints, arXiv:1801.03519
- Boller et al. (1996) Boller, T., Brandt, W. N., & Fink, H. 1996, A&A, 305, 53
- Boller et al. (2016) Boller, T., Freyberg, M. J., Trümper, J., et al. 2016, A&A, 588, A103
- Boroson & Green (1992) Boroson, T. A., & Green, R. F. 1992, ApJS, 80, 109
- Calderone et al. (2013) Calderone, G., Ghisellini, G., Colpi, M., & Dotti, M. 2013, MNRAS, 431, 210
- Chen et al. (2015) Chen, Y. Y., Zhang, X., Zhang, H. J., & Yu, X. L. 2015, MNRAS, 451, 4193
- Congiu et al. (2017) Congiu, E., Berton, M., Giroletti, M., et al. 2017, ArXiv e-prints, arXiv:1704.03881
- D’Ammando et al. (2015) D’Ammando, F., Orienti, M., Larsson, J., & Giroletti, M. 2015, MNRAS, 452, 520
- D’Ammando et al. (2013) D’Ammando, F., Orienti, M., Doi, A., et al. 2013, MNRAS, 433, 952
- Deo et al. (2006) Deo, R. P., Crenshaw, D. M., & Kraemer, S. B. 2006, AJ, 132, 321
- Doi et al. (2012) Doi, A., Nagira, H., Kawakatu, N., et al. 2012, ApJ, 760, 41
- Doi et al. (2015) Doi, A., Wajima, K., Hagiwara, Y., & Inoue, M. 2015, ApJ, 798, L30
- Drake et al. (2009) Drake, A. J., Djorgovski, S. G., Mahabal, A., et al. 2009, ApJ, 696, 870
- Fanaroff & Riley (1974) Fanaroff, B. L., & Riley, J. M. 1974, MNRAS, 167, 31P
- Gabányi et al. (2017) Gabányi, K. É., Frey, S., Paragi, Z., et al. 2017, ArXiv e-prints, arXiv:1709.07202
- Giovannini et al. (2001) Giovannini, G., Cotton, W. D., Feretti, L., Lara, L., & Venturi, T. 2001, ApJ, 552, 508
- Gliozzi et al. (2010) Gliozzi, M., Papadakis, I. E., Grupe, D., et al. 2010, ApJ, 717, 1243
- Goodrich (1989) Goodrich, R. W. 1989, ApJ, 342, 224
- Gu et al. (2015) Gu, M., Chen, Y., Komossa, S., et al. 2015, ApJS, 221, 3
- Hota et al. (2011) Hota, A., Sirothia, S. K., Ohyama, Y., et al. 2011, MNRAS, 417, L36
- Hota et al. (2016) Hota, A., Konar, C., Stalin, C. S., et al. 2016, Journal of Astrophysics and Astronomy, 37, 41
- Ivezić et al. (2002) Ivezić, Ž., Menou, K., Knapp, G. R., et al. 2002, AJ, 124, 2364
- Kapahi (1989) Kapahi, V. K. 1989, AJ, 97, 1
- Kellermann et al. (1989) Kellermann, K. I., Sramek, R., Schmidt, M., Shaffer, D. B., & Green, R. 1989, AJ, 98, 1195
- Kimball & Ivezić (2008) Kimball, A. E., & Ivezić, Ž. 2008, AJ, 136, 684
- Kirk et al. (2000) Kirk, J. G., Guthmann, A. W., Gallant, Y. A., & Achterberg, A. 2000, ApJ, 542, 235
- Komossa et al. (2006) Komossa, S., Voges, W., Xu, D., et al. 2006, AJ, 132, 531
- Konar & Hardcastle (2013) Konar, C., & Hardcastle, M. J. 2013, MNRAS, 436, 1595
- Konar et al. (2009) Konar, C., Hardcastle, M. J., Croston, J. H., & Saikia, D. J. 2009, MNRAS, 400, 480
- Konar et al. (2013) Konar, C., Hardcastle, M. J., Jamrozy, M., & Croston, J. H. 2013, MNRAS, 430, 2137
- Konar et al. (2006) Konar, C., Saikia, D. J., Jamrozy, M., & Machalski, J. 2006, MNRAS, 372, 693
- Kormendy & Richstone (1995) Kormendy, J., & Richstone, D. 1995, ARA&A, 33, 581
- Lähteenmäki et al. (2017) Lähteenmäki, A., Järvelä, E., Hovatta, T., et al. 2017, ArXiv e-prints, arXiv:1703.10365
- Laor (2000) Laor, A. 2000, ApJ, 543, L111
- Ledlow et al. (1998) Ledlow, M. J., Owen, F. N., & Keel, W. C. 1998, ApJ, 495, 227
- Leighly (1999) Leighly, K. M. 1999, ApJS, 125, 317
- Liu et al. (2016) Liu, X., Yang, P., Supriyanto, R., & Zhang, Z. 2016, International Journal of Astronomy and Astrophysics, 6, 166
- Liu et al. (2006) Liu, Y., Jiang, D. R., & Gu, M. F. 2006, ApJ, 637, 669
- Mathur et al. (2001) Mathur, S., Kuraszkiewicz, J., & Czerny, B. 2001, New A, 6, 321
- Morganti et al. (1997) Morganti, R., Oosterloo, T. A., Reynolds, J. E., Tadhunter, C. N., & Migenes, V. 1997, MNRAS, 284, 541
- Netzer & Trakhtenbrot (2007) Netzer, H., & Trakhtenbrot, B. 2007, ApJ, 654, 754
- Ohta et al. (2007) Ohta, K., Aoki, K., Kawaguchi, T., & Kiuchi, G. 2007, ApJS, 169, 1
- Orr & Browne (1982) Orr, M. J. L., & Browne, I. W. A. 1982, MNRAS, 200, 1067
- Osterbrock & Pogge (1985) Osterbrock, D. E., & Pogge, R. W. 1985, ApJ, 297, 166
- Paliya et al. (2018) Paliya, V. S., Ajello, M., Rakshit, S., et al. 2018, ApJ, 853, L2
- Rakshit & Stalin (2017) Rakshit, S., & Stalin, C. S. 2017, ApJ, 842, 96
- Rakshit et al. (2017) Rakshit, S., Stalin, C. S., Chand, H., & Zhang, X.-G. 2017, ApJS, 229, 39
- Rani et al. (2017) Rani, P., Stalin, C. S., & Rakshit, S. 2017, MNRAS, 466, 3309
- Richards & Lister (2015) Richards, J. L., & Lister, M. L. 2015, ApJ, 800, L8
- Sesar et al. (2007) Sesar, B., Ivezić, Ž., Lupton, R. H., et al. 2007, AJ, 134, 2236
- Singal (1993) Singal, A. K. 1993, MNRAS, 263, 139
- Singh et al. (2015) Singh, V., Ishwara-Chandra, C. H., Wadadekar, Y., Beelen, A., & Kharb, P. 2015, MNRAS, 446, 599
- Sulentic et al. (2000) Sulentic, J. W., Zwitter, T., Marziani, P., & Dultzin-Hacyan, D. 2000, ApJ, 536, L5
- Tanaka et al. (2014) Tanaka, M., Morokuma, T., Itoh, R., et al. 2014, ApJ, 793, L26
- Tempel et al. (2011) Tempel, E., Saar, E., Liivamägi, L. J., et al. 2011, A&A, 529, A53
- Véron-Cetty et al. (2001) Véron-Cetty, M.-P., Véron, P., & Gonçalves, A. C. 2001, A&A, 372, 730
- Wang et al. (1996) Wang, T., Brinkmann, W., & Bergeron, J. 1996, A&A, 309, 81
- Whalen et al. (2006) Whalen, D. J., Laurent-Muehleisen, S. A., Moran, E. C., & Becker, R. H. 2006, AJ, 131, 1948
- Wright et al. (2010) Wright, E. L., Eisenhardt, P. R. M., Mainzer, A. K., et al. 2010, AJ, 140, 1868
- Yao et al. (2015) Yao, S., Yuan, W., Zhou, H., et al. 2015, MNRAS, 454, L16
- Yuan et al. (2008) Yuan, W., Zhou, H. Y., Komossa, S., et al. 2008, ApJ, 685, 801
- Zhou et al. (2006) Zhou, H., Wang, T., Yuan, W., et al. 2006, ApJS, 166, 128