Dust in and around galaxies: dust in cluster environments and its impact on gas cooling
Abstract
Simulating the dust content of galaxies and their surrounding gas is challenging due to the wide range of physical processes affecting the dust evolution. Here we present cosmological hydrodynamical simulations of a cluster of galaxies, , including a novel dust model for the moving mesh code Arepo. This model includes dust production, growth, supernova-shock-driven destruction, ion-collision-driven thermal sputtering, and high temperature dust cooling through far infrared re-radiation of collisionally deposited electron energies. Adopting a rather low thermal sputtering rate, we find, consistent with observations, a present-day overall dust-to-gas ratio of , a total dust mass of , and a dust mass fraction of . The typical thermal sputtering timescales within are around , and increase towards the outer parts of the cluster to at a cluster-centric distance of . The condensation of gas phase metals into dust grains reduces high temperature metal-line cooling, but also leads to additional dust infrared cooling. The additional infrared cooling changes the overall cooling rate in the outer parts of the cluster, beyond , by factors of a few. This results in noticeable changes of the entropy, temperature, and density profiles of cluster gas once dust formation is included. The emitted dust infrared emission due to dust cooling is consistent with observational constraints.
keywords:
methods: numerical – cosmology: theory – cosmology: galaxy formation1 Introduction
Dust is an integral component of the galactic ecosystem and is crucial for a plethora of physical processes in the interstellar medium (ISM). Within the ISM, dust undergoes different surface reactions and acts as a catalyst for the formation of molecules (Hollenbach & Salpeter, 1971; Mathis, 1990; Li & Draine, 2001; Draine, 2003). Gas phase metals condense onto dust grains, which leads to the depletion of the gas phase metal budget in the ISM (Calzetti et al., 1994, 2000; Netzer et al., 2007; Spoon et al., 2007). The actual dust mass of a galaxy depends on its properties and also its redshift. For the Milky Way about of the metal mass is locked into the dust component. This amounts to of the total mass budget in the ISM. Furthermore, dust grains absorb stellar radiation in the ultraviolet and re-emit this radiation in the infrared (IR) (Spitzer, 1978; Draine & Lee, 1984; Mathis, 1990; Tielens, 2005). The presence of cosmic dust is inferred through its IR emission or reddening of stellar light. An observational challenge is its detection around galaxies and especially in galaxy clusters and in the intracluster medium (ICM) (e.g., Planck Collaboration et al., 2016; Erler et al., 2018; Melin et al., 2018). Information about the dust content in the ICM would lead to insights into dust production, destruction, dust cooling mechanisms, and gas and dust stripping from galaxies. More generally, there is a strong interest in quantifying the amount and distribution of dust around galaxies outside of the ISM (e.g., Ménard et al., 2010).
| Model Name | Dust Thermal Sputtering | Dust IR Cooling | Dust Grain Size | Comment |
|---|---|---|---|---|
| no-dust | – | – | – | no dust included |
| fiducial | fiducial | fiducial | fiducial () | McKinnon et al. (2016) |
| w/ reduced thermal sputtering | ||||
| + dust growth only in star-forming gas | ||||
| + dust IR cooling | ||||
| slow-sputter | ten times slower () | fiducial | fiducial | strongly reduced thermal sputtering |
| large-grains | fiducial | fiducial | five times larger () | larger dust grains |
| more-cooling | fiducial | five times more () | fiducial | enhanced dust IR cooling |
The overall cluster dust-to-gas mass ratio, , is not well constrained. Chelouche et al. (2007) found that the dust-to-gas ratio in clusters should be less than of the local ISM value of based on extinction studies. Giard et al. (2008) found if all their detected IR luminosity towards galaxy clusters is produced by thermal emission from ICM dust. This is close to as reported in McGee & Balogh (2010). By modelling IR properties of the galactic population of the SDSS-maxBCG clusters Roncarelli et al. (2010) found an upper limit of . The Planck Collaboration et al. (2016) used cluster stacking of IR spectral energy distributions to infer for their full cluster sample (). For the low- () and high-redshift () sub-samples, they found and , respectively. They also identified a trend with halo mass, where () and (). Kitayama et al. (2009) searched for IR emission within the Coma cluster and found an upper limits of within the central by masking out IR point sources. Gutiérrez & López-Corredoira (2014) found a dust mass ratio within their cluster sample of and a dust-to-gas ratio about three orders of magnitude lower than the value found in the Milky Way. Despite the measurement uncertainties and differences between all these studies, it is evident that there is most likely only a small amount of dust present in the ICM. It is expected that the hot ICM environment very efficiently destroys dust and therefore causes an overall low abundance of dust in the ICM.
So far, only a limited number of theoretical studies have tried to quantify the dust content within groups and clusters, which is mainly due to the lack of detailed dust models. Some simple dust models have predicted that the mass fraction of dust in clusters can reach of the galactic value (Polikarpova & Shchekinov, 2017). Masaki & Yoshida (2012) predicted dust mass fractions in groups to be of the order of . More recently, Gjergo et al. (2018) presented the most detailed dust calculation of a galaxy cluster so far using a combination of a dust model coupled to a galaxy formation model. They studied four clusters adopting a two size grain approximation, and predicted a dust content that is largely consistent with the measurements of the Planck Collaboration et al. (2016). Interestingly, they had to increase the thermal sputtering timescale of their fiducial model by a factor of to match the observed dust content of clusters.
Once dust grains are produced and exist, they also act as a heating source or coolant depending on the physical state of the surrounding gas and radiative environment. Heating operates via the photoelectric effect if the stellar radiation field is strong enough, and high temperature dust cooling occurs through IR re-radiation of collisionally deposited energy on grains by impinging free electrons (Ostriker & Silk, 1973). Unfortunately, only little is known about the importance of this cooling channel within galaxy clusters. Montier & Giard (2004) predicted that dust cooling is important in the ICM for gas temperatures and if . Da Silva et al. (2009) found a normalisation change for the relation and a change for the and cluster scaling relations in the presence of dust. Similarly, Pointecouteau et al. (2009) found changes in the relation by as much as for clusters with temperatures around for models that include dust cooling. However, those results are based on simplified dust models and it is currently unclear whether they capture the correct physical behaviour. A more detailed inclusion of dust physics has only recently been achieved in galaxy formation simulations (e.g., Bekki, 2015; McKinnon et al., 2016; Zhukovska et al., 2016; Aoyama et al., 2017; Popping et al., 2017; McKinnon et al., 2017; Aoyama et al., 2018; Gjergo et al., 2018; McKinnon et al., 2018). However, none of these models included the effect of dust cooling so far.
In this paper we present cosmological simulations of dust within galaxy clusters and the ICM using a self-consistent model for dust physics including dust production, growth, destruction, thermal sputtering and IR cooling. The scope of our work is similar to that of Gjergo et al. (2018), who recently studied the global dust content of galaxy clusters through simulations. Here we focus also on the spatial distribution of dust within the cluster, and we also study its impact on the thermodynamic properties of the ICM gas by including dust IR cooling. Our paper is structured as follows. In Section 2 we present our model and simulation details. In Section 3 we then discuss the global dust content of the cluster and compare our predictions with observational constraints. In the following Section 4 we study the distribution of dust in the cluster gas. In Section 5 we then explore how and whether dust can affect the thermodynamics of the gas in clusters. We give our conclusions in Section 6.
2 Methods
We simulate a galaxy cluster, , based on zoom-in initial conditions using the moving-mesh Arepo code (Springel, 2010) combined with the IllustrisTNG galaxy formation model (Weinberger et al., 2017; Pillepich et al., 2018), which is an update of the original Illustris model (Vogelsberger et al., 2013; Torrey et al., 2014; Vogelsberger et al., 2014b, a). This model is complemented by a novel dust model (McKinnon et al., 2016, 2017) with additional far IR dust cooling. The cosmological parameters of the simulation are: , , , , , and . The high resolution dark matter and gas masses of our zoom-in simulation are and respectively with a dark matter softening length of and an adaptive gas cell softening.
The dust is modelled and followed using a fluid passive scalar that evolves according to characteristic timescales for different physical processes such that the dust mass, , within a gas cell evolves as (McKinnon et al., 2016, 2017):
where is the mass in gas phase metals in the cell. The dust mass evolution is determined by three timescales associated with different physical processes. The growth timescale, , the dust destruction timescale due to type II supernovae (SNeII), , and the dust destruction timescale due to thermal sputtering, . The first factor in the parentheses depends on the local dust-to-metal ratio and slows the accretion rate down as gas-phase metals are condensed into dust.

The production of dust is coupled to the stellar evolution implementation of
our galaxy formation model, where we assume that some of the metals condense
into dust grains based on specific dust condensation efficiency
parameters (see McKinnon et al., 2016, 2017, for details). We adopt different parametrisations for the amount of dust produced from asymptotic giant
branch (AGB) stars and from SNe. Additionally, we make a distinction between
AGB stars with in their stellar envelope, which are expected to
produce carbonaceous solids (e.g., graphite or amorphous carbon), and those
with , which are thought to form primarily silicate dust. Once
the dust has been produced during stellar evolution, the time evolution of its
mass budget follows the mass equation above assuming that dust behaves as a
passive scalar within the underlying fluid. In the following, we briefly
describe the different physical processes that are relevant for the dust
evolution once the grains have been produced. We specify the relevant
timescale for each process.
Dust growth: Dust grains in the ISM gain mass when gas atoms collide with them and stick onto their surfaces (Draine, 1990). The dust growth timescale due to gas condensation onto existing dust grains is given by:
where is the dust grain size, is the gas temperature, and is the
gas mass density (Dwek, 1998; Hirashita, 2000). This growth timescale is
shortest in dense gas where dust-gas collisions are more frequent. We slightly
modify the original growth prescriptions of McKinnon et al. (2016) such that dust
can only grow in star-forming gas. is a
normalisation constant.
Dust destruction due to SNII shocks: Blast waves from SNeII produce harsh environments for dust that shrink dust grains and cause them to lose mass. The dust SNII shock destruction timescale for a gas cell of mass is given by:
where is the dust destruction efficiency, is the local SNII
rate, and is the mass of gas shocked to at least
(Dwek &
Scalo, 1980; McKee, 1989) calculated using the Sedov-Taylor
solution of a homogeneous environment.
Dust destruction due to thermal sputtering: At high temperatures, gas ions have large thermal velocities and can collisionally erode dust grains. For dust in the ICM, this process of thermal sputtering plays a crucial role since it is the main destruction mechanism in this hot environment (e.g., Draine & Salpeter, 1979). The thermal sputtering timescale for dust in hot gas can be approximated by (Tsai & Mathews, 1995):
where is a normalisation constant. This
sputtering timescale parametrisation has also been used in the recent dust model
of Gjergo
et al. (2018).
High temperature dust cooling: Hot gas plasma electrons that collide with dust grains can lose energy and cool, while the dust grains heat up and subsequently radiate this energy away in the IR. The original model of McKinnon et al. (2016, 2017) did not include any heating or cooling effects due to dust. Here we include dust cooling due to IR radiation in high temperature gas environments such as the ICM.
The electron collisional heating rate for a single grain of radius in gas of temperature and electron density is given by with (Dwek & Werner, 1981; Dwek, 1987):
where . We note that we neglect heating through proton collisions and radiation since those are subdominant in the ICM (Montier & Giard, 2004). The volumetric gas cooling rate, with , due to dust heating is then given by
where
is the number density of dust grains for a given dust-to-gas ratio , is the grain mass, and is the hydrogen mass fraction. Here, is calculated using the internal grain density . We can turn this volumetric cooling rate into a cooling function
with .
We note that for a hot plasma we have , where is the helium mass fraction. The
dust IR cooling rate therefore scales linearly with the dust-to-gas ratio, ,
and depends on the grain size such that larger grains typically lead to
less cooling. We implement this cooling function in Arepo in addition
to the primordial and metal line cooling.
|
Fiducial dust model, model uncertainties and model variations: Our dust model includes some free and adjustable parameters, which have to be set to certain values. Our fiducial dust model parameters are (McKinnon et al., 2016, 2017): (typical ICM grains have (Ferrara et al., 1991)), , , , , and . We note that this model employs a sputtering timescale ten times larger than the fiducial model originally discussed in McKinnon et al. (2017). We have found that this increase is required to match the observed dust abundance in the cluster. Higher sputtering rates result in significantly too low dust masses, which are in tension with current observational estimates. We note that Gjergo et al. (2018) came to a similar conclusion as we will discuss in more detail below.
The parametrisations of the different physical processes have some uncertainties. For example, we assume constant sticking efficiencies for our dust growth timescale, which can lead to growth rate variations (Zhukovska et al., 2016). The thermal sputtering timescale is also modelled using a fit (Tsai & Mathews, 1995) to ab initio calculations, which causes inaccuracies of around depending on grain composition and temperature (e.g., Barlow, 1978; Draine & Salpeter, 1979). This inaccuracy is potentially also the reason the fiducial thermal sputtering fit employed in McKinnon et al. (2017) leads to too much dust destruction, and we must employ a ten times higher normalisation for the sputtering timescale in this work. Our shock destruction implementation depends on the destruction efficiency , which is expected to be in the range from to (McKee, 1989) and is therefore also not certain. The exact IR dust cooling rates also depend on the detailed composition of the dust (e.g., Da Silva et al., 2009), which we do not track in detail in our simulations. This introduces additional uncertainties in the cooling rate of our model.
Given these uncertainties, we do not simulate only our fiducial dust model but also study model variations, which are summarised in Table 1. We specifically explore variations of the thermal sputtering rate, the dust IR cooling rate, and the dust grain size. Thermal sputtering is the main mechanism that destroys dust in the ICM, and we expect that variations in the sputtering timescales significantly affect the amount of dust in the ICM. There are additional uncertainties in the dust cooling rates, and we therefore also explore a model where we increase the dust cooling rate. This is mainly to explore how strongly dust cooling can actually affect the thermodynamic state of the cluster gas in the ICM. Our model also assumes a single grain size, while the actual dust population follows a certain grain size distribution, so we explore also variations of the grain size. Unlike the changes in sputtering and cooling rates, the change in grain size affects multiple dust processes since this quantity enters the growth rates, the sputtering timescales and the cooling rates. We expect that these model variations roughly bracket the overall uncertainties of our model. In the following Section we will explore these model variations to understand the abundance, distribution, and impact of dust in the cluster environment.
3 Global Dust content
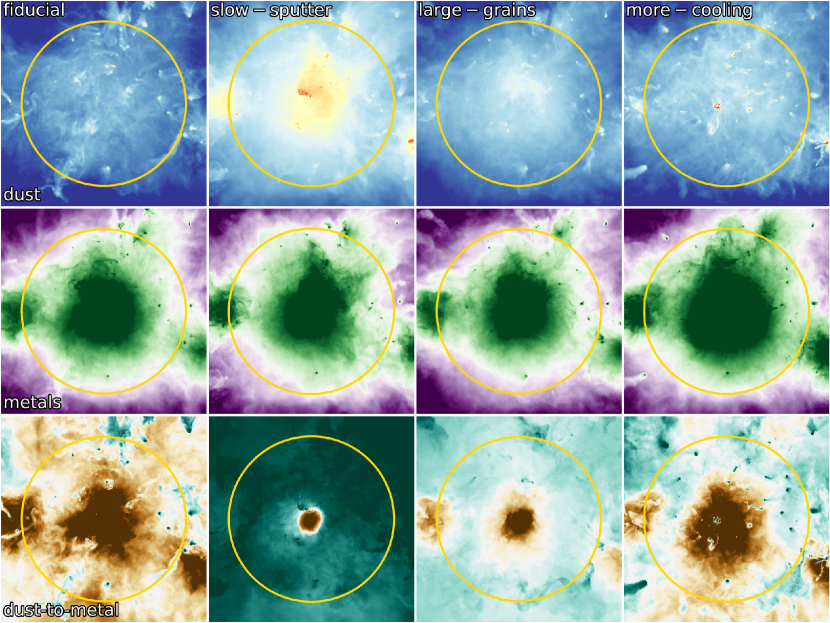
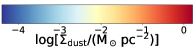
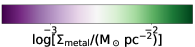
To get a first impression of the simulation results we present in Figure 1 dust maps of the cluster at for the different dust models presented in Table 1. The top row shows the dust surface density, the middle row the metal surface density, and the bottom row the dust-to-metal ratio. The maps in the three rows are related since dust production occurs at the expense of gas phase metals. Furthermore dust destruction in the ICM due to thermal sputtering returns metals to the gas phase. The dust maps reveal that the amount of dust in the ICM increases significantly for the model with reduced thermal sputtering, slow-sputter. This is expected given that thermal sputtering is the main destruction channel for dust in the ICM, where SNII destruction cannot occur. We can also identify the main production sites of dust as the cluster member galaxies, where dust is produced during the stellar evolution process and grows in the ISM. Stripping of gas, metals and dust from these cluster member galaxies then enriches the ICM. The overall amount of dust in the ICM is set by the competition between stripping and thermal sputtering. The stripping of dust is also visible in the dust maps through various stream like features. The model with slow thermal sputtering, slow-sputter, shows a rather uniform distribution of dust in the ICM. This is reminiscent of the uniform distribution of metals in the ICM that is both found observationally and in simulation studies (e.g., Werner et al., 2013; Vogelsberger et al., 2018). For these low sputtering rates, the dust component behaves similar to the gas phase metals in the ICM since it is stripped from member galaxies and then mixes within the ICM but is not destroyed due to the lack of efficient thermal sputtering. Furthermore, dust in the ICM does not experience any other growth or destruction processes. The fact that dust traces the metal distribution very well for the slow-sputter model can also be seen in the dust-to-metal ratio map for this model. This map is nearly constant except for deviations in the inner region, which are caused by dust growth and destruction in the ISM of the central galaxy. For all other dust models, the dust-to-metal ratio maps show fluctuations in the cluster gas, which are caused by the non-negligible thermal sputtering occurring for these models. For example, for the fiducial model we can see quite large fluctuations in the dust-to-metal ratio within the cluster. These fluctuations can be as large as two orders of magnitude. We can also see that the model variations with more cooling, more-cool, or larger grains, large-grains, produce slightly more dust in the cluster. The increased cooling leads to an increased production of dust, and a larger grain size leads to a lower thermal sputtering rate since the timescale for thermal sputtering depends linearly on the dust grain size for a single grain size population as adopted in our study. We note that a larger grain size will also slow down the dust growth in the ISM of galaxies and at the same time also reduce the dust IR cooling. However, the impact of thermal sputtering on the total amount of dust in the cluster is larger than these other two effects, and we therefore see an overall increase of the dust mass for larger grains. These results are consistent with the findings of Gjergo et al. (2018), who also found that large grains are more abundant in the cluster gas since smaller ones are destroyed more quickly due to sputtering. We also note that the maximum dust surface densities in the fiducial models reach values of about , which is roughly in agreement with the findings in Gjergo et al. (2018), and also consistent with observational constraints as we will discuss below.
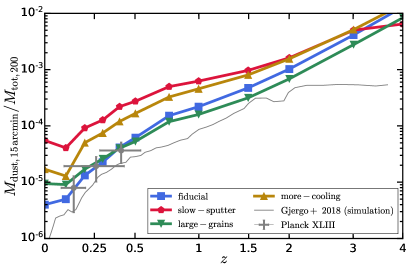
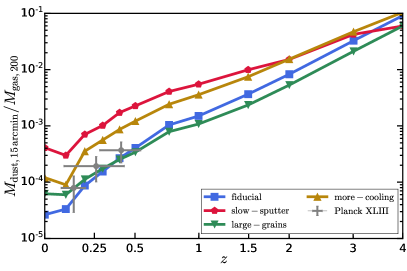
Next we study the time evolution of the total amount of dust in the cluster more quantitatively. These results are presented in Figure 2, where we show the dust mass evolution as a function of redshift. The left panel shows the total dust mass within around the cluster center at each redshift. This specific radial cut is chosen to compare to observational constraints from Planck as described below. At lower redshifts we replace this radius with a restriction within once the radius corresponding to is smaller than . We show the enclosed dust mass relative to the total cluster mass within , i.e. . We find that this ratio decreases towards lower redshifts, and drops for most models by more than three orders of magnitude from to . Around a redshift of the different models predict nearly the same amount of dust roughly corresponding to of the total cluster mass being in dust. This ratio decreases then for the fiducial model towards , where we predict that the total amount of dust in the cluster is only of . This decrease of dust is largely driven by dust destruction in the ICM due to thermal sputtering. For example, the model with slower sputtering, slow-sputter, has a dust mass which is about one order of magnitude larger than the dust mass of the fiducial model at . Switching to larger grains also increases the dust mass compared to the fiducial model since the larger grains lead to slower sputtering due to the linear dependence of the sputtering timescale on the grain size as discussed above. The model with increased dust cooling rates also leads to a larger dust mass caused by more dust production due to the increase in the overall cooling rate.
The right panel of Figure 2 also shows the total dust mass within but divided by the total gas mass within . Again we replace by at lower redshifts. The panel essentially shows the time evolution of the average dust-to-gas ratio within the cluster. This ratio also decreases towards lower redshifts. The fiducial model predicts a global dust-to-gas ratio of about at . The model with strongly reduced sputtering, slow-sputter, on the other hand, predicts a dust-to-gas ratio about one order of magnitude larger at . The ordering for the different models at various redshifts is the same in the two panels of Figure 2, demonstrating that the cluster gas fractions between the different dust models must be rather similar. We have confirmed explicitly that the gas fractions indeed only vary at the percent level between the different dust models.
So far we have not yet confronted our dust predictions with observations, which is a crucial test for the validity of our dust model. Unfortunately, little is known observationally about the dust content of galaxy clusters and their ICM due the difficulties of its detection both through IR emission or reddening. Here we compare our results to the cluster dust IR measurements of the Planck Collaboration et al. (2016). Although IR dust emission from clusters of galaxies had already been statistically detected using IRAS data, it has not been possible to sample the spectral energy distribution of this emission over its peak, which is required to break the degeneracy between dust temperature and mass. The Planck Collaboration et al. (2016) provided new constraints on the IR spectrum of thermal dust emission in clusters of galaxies improving on these existing cluster IR detections. We include in both panels of Figure 2 dust mass estimates from Planck based on their full cluster sample with an average mass of . In addition we also include the low redshift () and high redshift () Planck samples with average masses of and , respectively. We note that other observational studies found similar dust mass fractions. For example, Gutiérrez & López-Corredoira (2017) reported, based on clusters in the redshift range , that dust should contribute a fraction of about to the total cluster mass. This value, however, refers only to dust in the ICM since they subtracted known dust contributions from cluster galaxies. The Planck Collaboration et al. (2016) also provided observational estimates for the total dust-to-gas ratios; i.e. the ratio of the total dust mass measured within over the gas mass contained within , where they assumed . We include those estimates in the right panel of Figure 2. We caution here that the Planck cluster samples have different average masses than the halo we study here at the various redshifts. Specifically, at , which is the average redshift of the full Planck sample, we find that at for the simulated cluster in this work, which is therefore slightly less massive than the average cluster in the Planck sample. The low redshift Planck sample has an average redshift of ; and at the simulated cluster has a mass of , which is quite close to the average mass of the Planck low redshift sample. The high redshift Planck sample has an average redshift of ; and at the simulated cluster has a mass of , which is less massive than the average mass of the Planck high redshift sample.
With all these caveats in mind, we can compare the different dust models to the Planck data in both panels of Figure 2. We find that this observational data agrees reasonably well with our fiducial model, which has a reduced thermal sputtering rate compared to the original McKinnon et al. (2017) model as mentioned above. We also find that the model with larger grains is consistent with the Planck data as well. The model with increased dust cooling rates is slightly inconsistent producing too much dust compared to the Planck data. The slow-sputter model, however, overpredicts the amount of dust significantly as can be seen in both panels of Figure 2. Knowing that the fiducial model describes the low redshift observational data correctly, we can also make predictions for the cluster dust content at higher redshifts using this model. For example, at our fiducial model predicts a dust mass fraction of around and a dust-to-gas ratio of around . Finally, we note that the dust-to-gas ratio values of our fiducial model is consistent with other observational findings. For example, Roncarelli et al. (2010) studied the IR emission of clusters with found an upper limit of .
Besides comparing to observational data, we can also compare our predictions to the recent cluster dust simulations of Gjergo et al. (2018). Their model shares similarities with ours, but also some differences. For example, they consider two grain populations, large and small, but do not include dust IR cooling. The implementation of the growth timescales also differs between the two models. Furthermore, the underlying galaxy formation model and simulation methods are also rather different. In the left panel of Figure 2 we show the dust mass redshift evolution of their halo with a redshift zero mass of in their reduced sputtering model with a five times larger sputtering timescale compared to their fiducial model. The cluster mass of their cluster is nearly identical to our cluster mass, . Interestingly, Gjergo et al. (2018) found that they also had to increase their fiducial sputtering timescale to be consistent with observational data for the total dust mass. We can compare their effective sputtering timescale with ours, and find that for a given density, temperature and grain size their best-fit thermal sputtering timescales is nearly identical with ours. Specifically, our fiducial model thermal sputtering timescale is only about larger than the one presented in Gjergo et al. (2018). Despite the fact that the details of the implementation of the other dust model processes and the galaxy formation model do vary between the models, it seems that both models favour a nearly identical thermal sputtering timescale. We note that the adopted density and temperature dependence of the sputtering timescale is also identical between the two models. It therefore seems that, at least based on these two simulation results, dust can survive longer in the ICM than expected based on the fiducial model of Gjergo et al. (2018) and the original model of McKinnon et al. (2017). This seems to be a rather robust prediction given that both models vary in most other model parts. We note that the two model predictions deviate a bit towards higher redshifts, and that the normalisation towards lower redshift is a bit smaller for the Gjergo et al. (2018) simulations compared to our fiducial model predictions. Nevertheless, the overall redshift evolution and the present-day predictions are in remarkable agreement between the two models. This is most likely related to the fact that thermal sputtering is the most important process for setting the overall dust budget in the ICM.
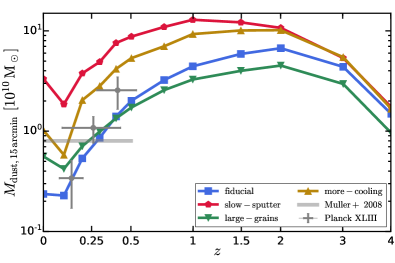
Instead of showing ratios of the dust mass with respect to the total halo mass or gas mass, we can also inspect the absolute total dust mass within the cluster and its time evolution. In Figure 3 we plot the total dust mass as a function of time within without normalising to the total cluster mass or gas mass. As discussed above we replace this radial cut with at lower redshifts. We also added the dust mass estimates from the Planck Collaboration et al. (2016) for the full, low redshift, and high redshift sample to that plot. For the whole sample, Planck obtained an average dust mass of . This estimate is similar to the values obtained with different techniques. For example, Muller et al. (2008) found for a sample of comparable redshift distribution. For a relatively low mass sample Gutiérrez & López-Corredoira (2014) found dust masses . Gutiérrez & López-Corredoira (2017) estimated the typical dust mass of their sample to be . Planck finds for their low redshift sample , and for the high redshift sample. The difference in dust mass between these two samples is largely driven by the different average masses of the two samples. We note that the dust mass redshift evolution revealed by Figure 3 shows an increase towards and then a decrease. The peak roughly occurs at the time of maximum star formation rate activity when dust production is largest. After that the amount of dust decreases due to thermal sputtering in the hot atmospheres of the cluster. Comparing the observational estimates with the different dust models, we can see that the fiducial model is within the error bars for at least the lowest two redshift points. However, the higher redshift data point has a dust mass above the mass predicted from the fiducial model for that redshift. The more-cooling model results in a slightly too high dust mass that compared to the observational data. Combining these findings with the time evolution shown in Figure 2 we conclude that the fiducial, large-grains and more-cooling are roughly consistent with the observationally inferred cluster dust masses.
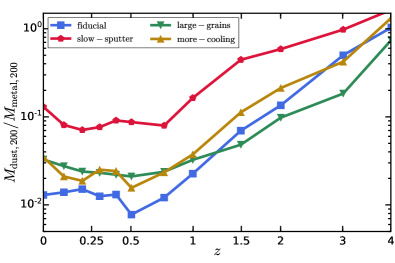
The production of dust goes along with the production of gas phase metals since dust essentially consists of condensed gas phase metals. We therefore show in Figure 4 the time evolution of the dust-to-metal ratios within . This ratio also decreases towards lower redshifts, which is again driven by thermal sputtering, efficiently destroying dust grains in the hot ICM, and correspondingly increases the abundance of metals in the ICM. The importance of thermal sputtering can also be inferred by comparing the fiducial model to the model with lower sputtering rates, slow-sputter. This model shows a slower decrease of the dust-to-metal ratio towards lower redshifts, and the cluster ends up with a larger amount of dust at for this model. Our fiducial model predicts at a dust-to-metal ratio of close to , which is consistent with the dust-to-gas ratios measured by Planck assuming an average cluster metallicity of solar. Specifically, for the lowest redshift Planck dust-to-gas ratio we can infer a dust-to-metal ratio of assuming a solar metallicity of . This value is roughly consistent with the prediction of our fiducial model. The simulated dust-to-metal ratios stay rather constant back to and then increase towards higher redshifts. At we find a ratio of for the fiducial model. At even higher redshifts, , we find nearly the same amount of metals and dust within the cluster. This high redshift prediction is rather independent of the model variations since the main physical process that affects the dust content of the cluster, thermal sputtering, is not yet active at these high redshifts because of a too low gas temperature in the ICM. A common trend seen for all models is that the dust-to-metal ratio stays rather constant starting at roughly all the way down to . The normalisation of the ratio differs between the models.
We conclude from this Section that our fiducial dust model agrees well with current observational data and makes predictions for the high redshift dust content of the clusters and their ICM. Furthermore, our results also agree with the recent simulations of Gjergo et al. (2018).
4 Dust Profiles
Our simulation not only predicts the total amount of dust of the cluster but also the spatially resolved dust distribution. We can therefore construct various radial dust profiles to understand not only the overall abundance of dust in the cluster, but also its spatial distribution. In this Section we will explore these dust profiles.
|
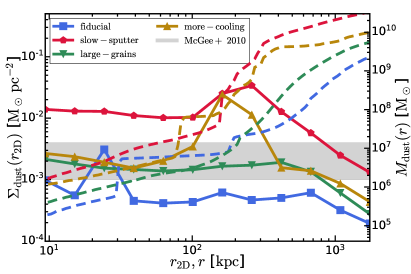
We begin with Figure 5, which shows dust surface density profiles (solid lines), and cumulative dust mass profiles (dashed lines). We note that the dust surface density is plotted as a function of a two-dimensional radius, , whereas the cumulative dust mass is shown as a function of the spherical radius, . Consistent with the results for the time evolution of the dust mass, we find that the model with reduced sputtering rates, slow-sputter, leads to a larger dust surface density and cumulative mass. Specifically, the model with slow sputtering leads to a total dust mass greater than within . Furthermore, this model also predicts a high dust surface density within a few hundred of about . The gray band shows some observational estimate for the dust surface density taken from the innermost radial bin of the dust surface density profile presented in McGee & Balogh (2010) based on a reddening study of groups and clusters. The slow-sputter model overshoots this observational data substantially. The fiducial model, which agrees well with the total dust mass estimates as demonstrated in the previous Section, leads to a slightly too low dust surface density. We note however, that these observational estimates of dust surface densities have rather large systematic uncertainties, and we therefore conclude that except for the slow sputtering model, all our models are likely consistent with these observed dust surface density values. Indeed, our surface density predictions are also consistent with the few other observational estimates for the dust surface density in clusters. For example, Kitayama et al. (2009) studied the IR emission of the Coma cluster and found an upper limit of by combining their measurements with the theoretical model of Yamada & Kitayama (2005).
The profiles of the dust surface density demonstrate that all dust models show a rather flat dust surface density profile within . This therefore seems to be a rather generic result. For example, the predicted dust surface density of the fiducial changes only very little going from beyond to the inner ; except for the inner spike. Interestingly, the reddening study from McGee & Balogh (2010) based on uniformly selected galaxy groups and clusters also found evidence for a relatively uniform distribution of dust in clusters, which is in qualitative agreement with our results. The cumulative dust mass profiles follow the same order as the data in Figure 3. For most of the models this order also stays the same at different radii.
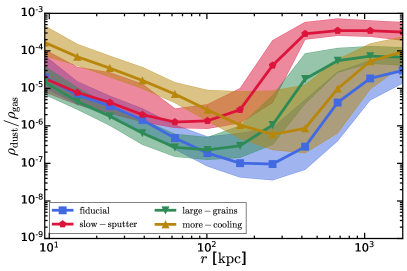
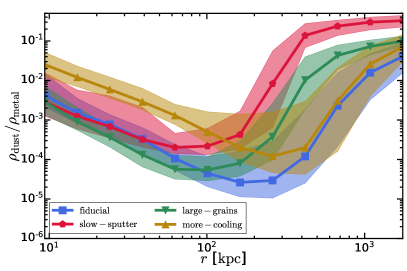
Dust abundances are often quantified as dust-to-gas and dust-to-metal ratios as discussed above. We therefore show in Figure 6 the median profiles for dust-to-gas (left panel) and dust-to-metal (right panel) ratios. The shaded regions mark the spread around those medians. The different models produce rather similar functional shapes for the dust-to-gas and dust-to-metal profiles, but with quite different normalisations. Specifically, these profiles have a minimum at intermediate radii around and increase towards smaller and larger cluster-centric distances. For the dust-to-gas ratio we find that the difference between this minimum and the larger values in the inner and outer parts of the cluster decreases for the model with reduced sputtering. The same trend can be seen for the dust-to-metal ratios. The reason for this behaviour is that the model with less sputtering leads to an overall more uniform and higher level of dust in the ICM. In fact, we have tested that a model with no thermal sputtering at all leads to a nearly flat profile for both ratios because no dust is being destroyed in this case. For the fiducial model we find on the other hand that the lowest dust-to-total-mass ratio is around and occurs at radii slightly larger than . The largest ratio occurs in the outer parts of the cluster, where we find a ratio of the order of , which is slightly larger than the central value of . We find a similar trend for the dust-to-metal ratios in the right panel. Here the fiducial model predicts a central dust-to-metal ratio of about , while the value in the outer cluster parts increase to ratios larger than a few times .
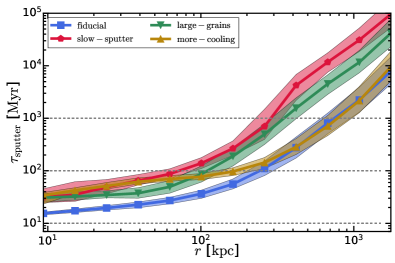
To qualitatively understand the origin of the particular functional shape of both of these ratio profiles, we have to inspect primarily the thermal sputtering behaviour in the ICM since this is the main dust process affecting the dust abundance in the cluster. The efficiency of thermal sputtering is set by the thermal sputtering timescale . In Figure 7 we therefore show radial profiles of the median thermal sputtering timescales for the different dust models. The shaded regions show the scatter around these profiles. We consider here only non-star-forming gas in the ICM. All thermal sputtering timescale profiles have a quite similar shape, where timescales are shortest in the center and longest in the outer part of the halo. In addition the spread around those median values is relatively small. The thermal sputtering timescale depends on some of the dust model parameters, most importantly the parameters which directly influence the overall sputtering timescale normalisation. This is obvious for the slow-sputter model, where the value has been increased by factors of with respect to the fiducial model. Similarly a change in grain size also directly changes the overall normalisation of the sputtering timescale as it depends linearly on the size of dust grain. Therefore, the model with five times larger grains, large-grains, will typically have five times larger sputtering timescales. For all models, we find that despite the variations in normalisation, the sputtering timescales are shorter than within . Beyond a distance from the center all models predict also sputtering timescales which are larger than . The slow-sputter model predicts timescales even longer than in these outer regions of the ICM. Any dust in this part of the ICM will therefore be able to survive very long times without being destroyed through sputtering.
The overall shape of the sputtering profiles is set through the underlying gas density and temperature profiles, which regulate the thermal sputtering timescale. Gas densities and temperatures are highest towards the central part of the cluster, and therefore sputtering is most efficient in this region of the ICM, while the opposite is true for the outer parts of the halo. This explains the general shape of these thermal sputtering profiles. We note that both the thermal sputtering timescale profiles and the entropy profiles of clusters are functions of temperature and density. It is therefore not too surprising that they share some similarities like different functional forms in the inner and outer part. In fact, we will see below that the gas entropy profiles also change functional shape at a radius of as the thermal sputtering profiles do.
|
|
Based on our fiducial dust model, we can infer from the thermal sputtering profiles that dust in the ICM should have a typical sputtering timescale of about in the inner halo within . In the outer part, these timescales get much longer so that at cluster-centric distance, the sputtering timescale is already larger than . This inferred thermal sputtering timescale is in rough agreement with other estimates for this timescale. For example, Draine & Salpeter (1979) originally estimated
for the thermal sputtering rate of dust grains in hot gases. For our fiducial grain size of and a rough hydrogen number density of we find , which is a typical sputtering rate of our fiducial model based on Figure 7. As described above our thermal sputtering timescale is also consistent with the dust thermal sputtering timescales of the best-fit model in Gjergo et al. (2018). We stress however again that these sputtering timescales have been increased compared to the fiducial values of McKinnon et al. (2017).
Knowing how the sputtering rates change as a function of radius allows us to qualitatively understand the shapes of the dust-to-gas and dust-to-metal ratio profiles discussed above. The fact that the amount of dust increases towards the outer parts of the cluster is due to the very long thermal sputtering timescales in that part of the ICM, where dust can then survive longer. Looking only at the sputtering timescales one would then naively also expect that the amount of dust should be very low within . In fact, the minima of the ratio profiles occur at around these radii, but the dust-to-gas and dust-to-metal ratios then increase again towards the cluster center. This is caused by stronger dust production and dust growth towards the center of the cluster, where the central galaxy provides conditions such that dust can also grow quite efficiently. Therefore, despite the fact that the sputtering timescales in the center are as short as about , we find that the dust-to-gas and dust-to-metal ratios increase towards the center due to an increased dust production and growth in the inner regions. Therefore, the combination of dust production and growth together with the shape of the thermal sputtering timescale profiles explain the radial dependence of the dust-to-gas and dust-to-metal profiles.
We conclude from this Section that the distribution of dust within the cluster is consistent with existing observational data. Our fiducial model predicts a typical thermal sputtering timescale of about for the inner parts of the ICM.
5 Impact of dust on thermodynamic cluster profiles
So far, we have quantified the abundance of dust and its distribution in the cluster. Our models predict a small amount of dust in agreement with current observational constraints and estimates. Specifically, our fiducial model predicts an overall dust-to-gas ratio of about averaged over the full cluster. This small amount of dust in the ICM can potentially also affect the thermodynamic state of the cluster gas due to dust IR cooling and the reduction of gas phase metals due to metal to dust condensation, which leads to a reduction of metal-line cooling. Various works have in the past studied the potential impact of dust on the thermodynamic structure of galaxy clusters (e.g., Montier & Giard, 2004; Pointecouteau et al., 2009; Da Silva et al., 2009; Melin et al., 2018). For example, Montier & Giard (2004) predicted that dust IR cooling is important in the ICM for gas temperatures , and if . Da Silva et al. (2009) found a normalisation change for the relation and change for the and cluster scaling relations in the presence of dust. Similarly, Pointecouteau et al. (2009) found changes in the relation by as much as for clusters with temperatures around for models that include dust cooling. However, these results are based on rather crude and limited dust models. We will therefore inspect the impact of dust on the thermodynamic profiles of the ICM for our dust model in more detail in this Section.
There are mainly two different mechanisms through which dust can affect the thermodynamics of the cluster gas. First, the condensation of gas phase metals into dust grains reduces the strength of metal line cooling due to the reduced metal budget in the gas. Second, the presence of dust in the hot ICM causes IR cooling of the gas. Both of these effects act in opposite directions; i.e. it is a priori not clear how the addition of dust to the ICM affects the overall cooling. Another complication is the backreaction of these cooling changes on the feedback mechanisms in the cluster. Most importantly, the accretion rate onto the central supermassive black hole (SMBH) is sensitive to the gas cooling, which regulates how much gas can flow towards the cluster center. We therefore expect that the change of gas cooling due to dust will also impact the accretion rate onto the supermassive black hole and consequently the active galactic nuclei (AGN) feedback. All these effects are coupled in a non-linear way, making it difficult to predict the final impact of dust on the thermodynamic structure on the cluster. Given this difficult interplay it is crucial to study this problem through numerical simulations. Before discussing our results, we stress that our work represents only an initial exploration of these effects since our sample contains only one cluster. The impact of dust depends most likely on halo mass as well as details of the formation history. One has to keep these limitations in mind for the following.
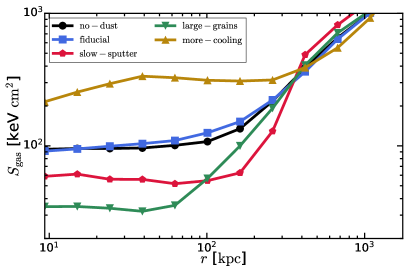
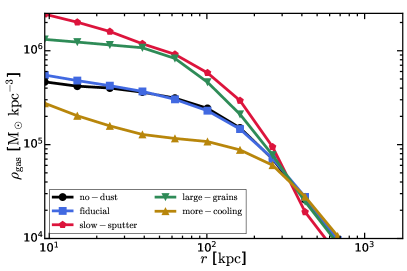
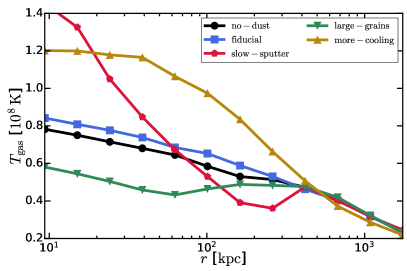
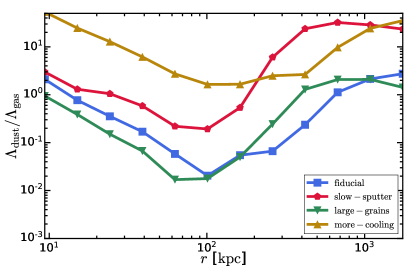
In Figure 8 we present the basic thermodynamic profiles of the ICM for the different dust models: entropy profiles (upper left), gas density profiles (upper right), gas temperature profiles (lower left). We also present in the lower right panel the ratio of dust IR cooling and gas cooling. Gas cooling here includes both primordial and metal line cooling. For the entropy, density and temperature profiles we only consider non-star-forming gas in the ICM. All thermodynamic profiles demonstrate that dust physics indeed has an impact on the thermodynamic state of the ICM gas. However, there seems to be no simple one-to-one mapping from included dust physics to the final outcome of the thermodynamic profiles. This has to do with the non-linear coupling between the different effects caused through the inclusion of dust as described above. Two of our dust models, large-grains and slow-sputter, lead to an overall reduction of the central entropy compared to the no-dust model. The more-cooling model, on the other hand, leads to a significantly higher central entropy compared to the no-dust case. This is caused by an increased central temperature and reduced central density as can be seen in the other panels. We have also inspected the injected AGN energy, which is higher for this model; i.e. the central gas is more heated compared to the other models due to the increased gas accretion rate caused by the large amount of dust cooling occurring for that model. As mentioned above, the competition between altered central AGN heating, dust-induced reduced gas phase metal line cooling, and dust IR cooling leads to the large variety of thermodynamic profiles once dust physics is included in the simulation. Despite these complications, we conclude that in any case dust can alter the thermodynamic profiles of the cluster. Interestingly, the different dust driven effects lead to a nearly unchanged entropy profile for the fiducial model. We note that the stellar mass of the central galaxy is also affected by the presence of dust. The slow-sputter dust model causes the largest impact on the stellar mass with an overall increase of stellar mass by a factor of compared to the no-dust model.
The effect of reduced metal line cooling due to dust-to-metal condensation can be inferred indirectly through the dust-to-metal profiles presented in Figure 6. However, some of this reduction in metal line cooling is compensated by the additional dust IR cooling that we discuss next. The strength of this dust IR cooling is presented in the lower right panel of Figure 8, where we present the ratio of dust IR cooling over the sum of primordial and metal line cooling. The various dust models lead to a large variation in the amount and distribution of dust in the ICM as demonstrated above. It is therefore not surprising to see strong variations in the contribution of dust to the overall gas cooling in the cluster. For example, the contribution from dust IR cooling can vary by more than two orders of magnitudes for gas at around cluster-centric distance. The question then arises of how much dust cooling we can realistically expect in a cluster, and how large is its impact on the thermodynamic profile of the cluster compared to the case where we do neglect all dust physics. We have demonstrated above that essentially all dust models, except the slow-sputter model, agree reasonably well with most observational constraints. We can therefore expect that these models roughly bracket the potential impact of dust on the thermodynamic cluster profiles.
The cooling ratio panel demonstrates that dust cooling is most relevant in the innermost and outermost parts of the cluster. In fact, in the outer part the cooling due to dust IR emission can overcome the metal line contribution for the fiducial model. For the model with even lower and most likely unrealistic sputtering rates, slow-sputter, we find that the dust cooling rate is at most radii significantly larger than the metal line cooling rate. Especially at larger radii we find that the dust cooling is more than a factor of larger then metal-line cooling of the gas. The model with larger grains, large-grains, also leads to a slightly increased cooling rate at most radii. We note that in this case multiple physical effects are altered once the grain size is changed. First, dust can survive much longer in the ICM due to the increase sputtering timescale, i.e. its abundance and consequently the dust-to-gas ratio increase substantially. Second, the growth also slows down, but the net effect of the reduced growth and reduced sputter is still a substantially increased dust-to-gas ratio in the ICM as demonstrated in Figure 6. Third, the cooling rate itself is also sensitive to the grain size. And last, for larger grains the gas phase metal abundance is also strongly reduced in the ICM due to the longer survival of larger grains in this hot environment. Therefore, the gas metal line cooling is also reduced. Obviously, the model with five times larger dust cooling rates also has a larger ratio between dust cooling and metal-line cooling compared to the slow-sputter model.
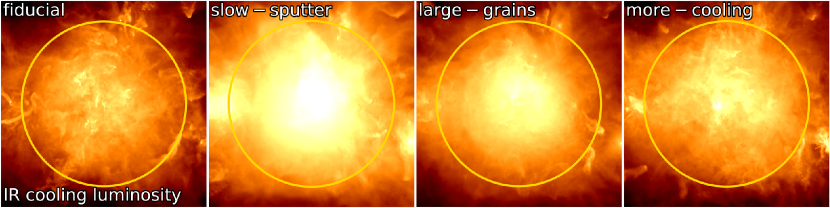
The dust cooling process works through the emission of IR radiation from the dust to radiate away the energy of the gas. We can therefore use cluster IR measurements to quantify whether the bolometric IR cooling luminosity predicted by our model is consistent with those measurements or exceeds it. Since we are only interested in the bolometric dust IR luminosity, we do not need any information about the IR spectral shape, which would require a model to track the dust temperature, which is not included in our simulations. For the bolometric dust IR luminosity we can simply sum up the dust cooling rate within the cluster and assume that this cooling rate is equivalent to the bolometric dust IR emission. We present maps of this dust cooling IR radiation for our different dust models in Figure 9. We note that these bolometric IR maps only account for the cooling emission due to dust, and do not take into account other sources of IR emission. As expected, the emission is strongest for the slow-sputter model, which contains the largest amount of dust in the ICM. The fiducial model emits much less IR radiation. In those maps we can also see the emission of stripped dust more clearly. Larger grains also lead to slightly more cooling emission compared to the slow-sputter case. Boosting the dust cooling efficiency, as in the more-cool model, obviously also increases the amount of IR emission.
The dust IR emission is quantified in more detail in Figure 10, where we present both IR surface brightness profiles (solid lines), and cumulative dust luminosity profiles (dashed lines) for the different dust models. We only include non-star-forming gas here. For the total luminosity we also show some observational results from Gutiérrez & López-Corredoira (2017), who measured the ICM IR emission using a sample of clusters of galaxies subtracting the contribution of identified sources from the whole emission of the clusters. Their massive low redshift sample has an average cluster mass of and an average redshift of with a range of . For this high mass sample, they find an IR luminosity of . We note that their derivation of the bolometric IR luminosity depends on some assumptions about, for example, the dust temperature in the ICM, which introduces some systematic uncertainties in the derived value. Comparing their derived luminosity with our dust model results, we find that the slow-sputter and more-cooling produce too much IR radiation. However, we note that the average mass of the observational cluster sample is slightly lower than the mass of our simulated cluster. It is therefore possible that even the more-cooling model could still be consistent. We therefore conclude that the IR dust emission of all our dust models, except slow-sputter, are consistent with these observational findings. We note that radiative dust heating due to the UV and Cosmic Microwave Background can be neglected here, given the low radiation field in the intracluster medium (Montier & Giard, 2004).
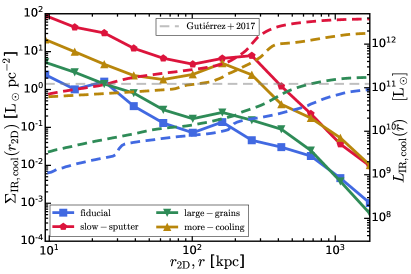
We can also compare the total IR luminosities due to dust cooling to theoretical estimates. For example, Montier & Giard (2004) estimated analytically that the total IR dust cooling emission should be a function of the dust-to-gas ratio and the electron density in the ICM given by:
Here is a geometrical factor. If we assume that and as typical values, we find roughly , which is in reasonable agreement with the results of our model.
We conclude from this Section that the small amounts of dust in the ICM alter the thermodynamic profiles of the ICM due to changes in the overall cooling rate. The dust IR cooling emission is consistent with current cluster IR measurements and also with previous theoretical estimates.
6 Conclusions
We have performed cosmological hydrodynamical simulations to study the dust content of a galaxy cluster, , using a novel self-consistent dust model including dust production, growth, supernova-shock-driven destruction, ion-collision-driven thermal sputtering, and high temperature dust cooling through far infrared re-radiation of deposited electron energies. This dust model is coupled to a galaxy formation model implemented in the moving-mesh code Arepo. Our main results are:
-
•
Our fiducial dust model, which employs a reduced thermal sputtering rate compared to our McKinnon et al. (2017) sputtering parametrisation, reproduces the observed dust abundances in clusters at low redshifts. The average dust-to-total-mass and dust-to-gas ratios decrease as a function of time and reach their lowest values at redshift . The dust mass itself, on the other hand, increases at high , has a broad maximum at around , and then declines again towards lower redshifts. Our fiducial model predicts at the present day a total dust mass fraction of within . Within the same radius, the model also predicts at a dust-to-gas ratio of . These values correspond to an absolute dust mass of about . All these values are consistent with current observational data and constraints. The peak dust mass at higher redshifts around is close to .
-
•
For our fiducial model, thermal sputtering timescales for the inner of the ICM are approximately . The sputtering timescales then rise towards the outskirts of the ICM such that at cluster-centric distance, the timescales are of the order of . These sputtering timescales are consistent with those recently found by Gjergo et al. (2018).
-
•
Our fiducial dust model predicts a dust-to-metal ratio of at lower redshifts, with ratios increasing towards higher redshifts. All our models predict a dust-to-metal ratio close to unity at . A model with a ten times longer thermal sputtering timescale, slow-sputter, predicts at a ten times larger dust-to-metal ratio of about .
-
•
Most of our dust models predict very flat dust surface density profiles consistent with observational findings. Our fiducial model yields a dust surface density slightly below . The model with a ten times lower thermal sputtering rate, slow-sputter, results in an about higher dust surface density.
-
•
The dust-to-gas and dust-to-metal radial profiles show a characteristic shape with minima occurring at around cluster-centric distance and rising ratios towards the center and outskirts of the cluster. The increase towards the outskirts is due to the smaller thermal sputtering rates caused by lower gas temperatures and densities in the outer parts of the ICM. Towards the inner parts, the thermal sputtering rates are higher, but dust production and growth in these regions is also larger. The combined effect of increased production and growth rates towards the center and the reduced sputtering towards the outer parts lead to the characteristic profile shape of the dust-to-gas and dust-to-metal ratio profiles. Our fiducial model predicts a central dust-to-gas ratio of and a minimum ratio of at intermediate radii. The ratio increases again towards larger radii and reaches a value of about at cluster-centric distance.
-
•
Dust has an impact on the thermodynamic profiles of the cluster gas. This is caused by the rather complicated interplay of three effects. First, the formation of dust occurs at the expense of gas-phase metals such that metal-line cooling rates are reduced. Second, dust itself is an efficient coolant in hot plasma due to the emission of IR radiation. These two effects work in opposite directions on the total cooling rates. Third, the overall change in the cooling rate also implies a change in the AGN feedback activity due to the change in the accretion rates onto the SMBH. These three effects combine and affect the thermodynamic state of the ICM. We stress, however, that these results are based on a single halo. Given the non-linear coupling between the three effects discussed above, it is likely that the impact can fluctuate quite strongly from halo to halo.
-
•
Dust cooling operates through the emission of IR radiation. The predicted IR bolometric luminosities by our fiducial model are consistent with current constraints from cluster IR measurements. Our fiducial model produces a bolometric IR luminosity of about within . A model with reduced thermal sputtering rates, slow-sputter, results in a nearly times higher IR luminosity.
We conclude that, according to our simulations, small amounts of dust should be present in ICM despite the hostile environment for dust survival. However, the exact amount of dust is very sensitive to the details of the thermal sputtering model. Our fiducial model is consistent with current observational dust constraints. However, this agreement is achieved mostly due to a reduced thermal sputtering rate. Further studies are required to fully quantify this phenomena in more detail exploring a wider halo mass range. We also expect that dust formation has a significant effect in lower mass halos by altering the gas cooling rates and changing gas-phase metal abundances in the circumgalactic medium due to dust-to-metal condensation.
Acknowledgements
We thank the anonymous referee for very useful feedback. We thank Volker Springel for giving us access to Arepo. The simulations were performed on the joint MIT-Harvard computing cluster supported by MKI and FAS. MV acknowledges support through an MIT RSC award, a Kavli Research Investment Fund, NASA ATP grant NNX17AG29G, and NSF grants AST-1814053 and AST-1814259. RM acknowledges support from the DOE CSGF under grant number DE-FG02-97ER25308. RK acknowledges support from NASA through Einstein Postdoctoral Fellowship grant number PF7-180163 awarded by the Chandra X-ray Center, which is operated by the Smithsonian Astrophysical Observatory for NASA under contract NAS8-03060.
References
- Aoyama et al. (2017) Aoyama S., Hou K.-C., Shimizu I., Hirashita H., Todoroki K., Choi J.-H., Nagamine K., 2017, MNRAS, 466, 105
- Aoyama et al. (2018) Aoyama S., Hou K.-C., Hirashita H., Nagamine K., Shimizu I., 2018, MNRAS, 478, 4905
- Barlow (1978) Barlow M. J., 1978, MNRAS, 183, 367
- Bekki (2015) Bekki K., 2015, MNRAS, 449, 1625
- Calzetti et al. (1994) Calzetti D., Kinney A. L., Storchi-Bergmann T., 1994, ApJ, 429, 582
- Calzetti et al. (2000) Calzetti D., Armus L., Bohlin R. C., Kinney A. L., Koornneef J., Storchi-Bergmann T., 2000, ApJ, 533, 682
- Chelouche et al. (2007) Chelouche D., Koester B. P., Bowen D. V., 2007, ApJ, 671, L97
- Da Silva et al. (2009) Da Silva A. C., Catalano A., Montier L., Pointecouteau E., Lanoux J., Giard M., 2009, MNRAS, 396, 849
- Draine (1990) Draine B. T., 1990, in Blitz L., ed., Astronomical Society of the Pacific Conference Series Vol. 12, The Evolution of the Interstellar Medium. pp 193–205
- Draine (2003) Draine B. T., 2003, ARA&A, 41, 241
- Draine & Lee (1984) Draine B. T., Lee H. M., 1984, ApJ, 285, 89
- Draine & Salpeter (1979) Draine B. T., Salpeter E. E., 1979, ApJ, 231, 77
- Dwek (1987) Dwek E., 1987, ApJ, 322, 812
- Dwek (1998) Dwek E., 1998, ApJ, 501, 643
- Dwek & Scalo (1980) Dwek E., Scalo J. M., 1980, ApJ, 239, 193
- Dwek & Werner (1981) Dwek E., Werner M. W., 1981, ApJ, 248, 138
- Erler et al. (2018) Erler J., Basu K., Chluba J., Bertoldi F., 2018, MNRAS, 476, 3360
- Ferrara et al. (1991) Ferrara A., Ferrini F., Barsella B., Franco J., 1991, ApJ, 381, 137
- Giard et al. (2008) Giard M., Montier L., Pointecouteau E., Simmat E., 2008, A&A, 490, 547
- Gjergo et al. (2018) Gjergo E., Granato G. L., Murante G., Ragone-Figueroa C., Tornatore L., Borgani S., 2018, MNRAS, 479, 2588
- Gutiérrez & López-Corredoira (2014) Gutiérrez C. M., López-Corredoira M., 2014, A&A, 571, A66
- Gutiérrez & López-Corredoira (2017) Gutiérrez C. M., López-Corredoira M., 2017, ApJ, 835, 111
- Hirashita (2000) Hirashita H., 2000, PASJ, 52, 585
- Hollenbach & Salpeter (1971) Hollenbach D., Salpeter E. E., 1971, ApJ, 163, 155
- Kitayama et al. (2009) Kitayama T., et al., 2009, ApJ, 695, 1191
- Li & Draine (2001) Li A., Draine B. T., 2001, ApJ, 554, 778
- Masaki & Yoshida (2012) Masaki S., Yoshida N., 2012, MNRAS, 423, L117
- Mathis (1990) Mathis J. S., 1990, ARA&A, 28, 37
- McGee & Balogh (2010) McGee S. L., Balogh M. L., 2010, MNRAS, 405, 2069
- McKee (1989) McKee C., 1989, in Allamandola L. J., Tielens A. G. G. M., eds, IAU Symposium Vol. 135, Interstellar Dust. p. 431
- McKinnon et al. (2016) McKinnon R., Torrey P., Vogelsberger M., 2016, MNRAS, 457, 3775
- McKinnon et al. (2017) McKinnon R., Torrey P., Vogelsberger M., Hayward C. C., Marinacci F., 2017, MNRAS, 468, 1505
- McKinnon et al. (2018) McKinnon R., Vogelsberger M., Torrey P., Marinacci F., Kannan R., 2018, MNRAS, 478, 2851
- Melin et al. (2018) Melin J.-B., Bartlett J. G., Cai Z.-Y., De Zotti G., Delabrouille J., Roman M., Bonaldi A., 2018, A&A, 617, A75
- Ménard et al. (2010) Ménard B., Scranton R., Fukugita M., Richards G., 2010, MNRAS, 405, 1025
- Montier & Giard (2004) Montier L. A., Giard M., 2004, A&A, 417, 401
- Muller et al. (2008) Muller S., Wu S.-Y., Hsieh B.-C., González R. A., Loinard L., Yee H. K. C., Gladders M. D., 2008, ApJ, 680, 975
- Netzer et al. (2007) Netzer H., et al., 2007, ApJ, 666, 806
- Ostriker & Silk (1973) Ostriker J., Silk J., 1973, ApJ, 184, L113
- Pillepich et al. (2018) Pillepich A., et al., 2018, MNRAS, 473, 4077
- Planck Collaboration et al. (2016) Planck Collaboration et al., 2016, A&A, 596, A104
- Pointecouteau et al. (2009) Pointecouteau E., da Silva A., Catalano A., Montier L., Lanoux J., Roncarelli M., Giard M., 2009, Advances in Space Research, 44, 440
- Polikarpova & Shchekinov (2017) Polikarpova O. L., Shchekinov Y. A., 2017, Astronomy Reports, 61, 89
- Popping et al. (2017) Popping G., Somerville R. S., Galametz M., 2017, MNRAS, 471, 3152
- Roncarelli et al. (2010) Roncarelli M., Pointecouteau E., Giard M., Montier L., Pello R., 2010, A&A, 512, A20
- Spitzer (1978) Spitzer L., 1978, Physical processes in the interstellar medium, doi:10.1002/9783527617722.
- Spoon et al. (2007) Spoon H. W. W., Marshall J. A., Houck J. R., Elitzur M., Hao L., Armus L., Brandl B. R., Charmandaris V., 2007, ApJ, 654, L49
- Springel (2010) Springel V., 2010, MNRAS, 401, 791
- Tielens (2005) Tielens A. G. G. M., 2005, The Physics and Chemistry of the Interstellar Medium
- Torrey et al. (2014) Torrey P., Vogelsberger M., Genel S., Sijacki D., Springel V., Hernquist L., 2014, MNRAS, 438, 1985
- Tsai & Mathews (1995) Tsai J. C., Mathews W. G., 1995, ApJ, 448, 84
- Vogelsberger et al. (2013) Vogelsberger M., Genel S., Sijacki D., Torrey P., Springel V., Hernquist L., 2013, MNRAS, 436, 3031
- Vogelsberger et al. (2014a) Vogelsberger M., et al., 2014a, MNRAS, 444, 1518
- Vogelsberger et al. (2014b) Vogelsberger M., et al., 2014b, Nature, 509, 177
- Vogelsberger et al. (2018) Vogelsberger M., et al., 2018, MNRAS, 474, 2073
- Weinberger et al. (2017) Weinberger R., et al., 2017, MNRAS, 465, 3291
- Werner et al. (2013) Werner N., Urban O., Simionescu A., Allen S. W., 2013, Nature, 502, 656
- Yamada & Kitayama (2005) Yamada K., Kitayama T., 2005, PASJ, 57, 611
- Zhukovska et al. (2016) Zhukovska S., Dobbs C., Jenkins E. B., Klessen R. S., 2016, ApJ, 831, 147