Diagnostics of a Nuclear Starburst: Water and Methanol Masers
Abstract
We test models of starburst driven outflows using observations of the 22.2 GHz H2O and 36.2 GHz class I CH3OH maser lines. We have observed the starburst galaxy NGC 253 using the Karl G. Jansky Very Large Array. We present evidence for entrainment of star-forming dense-molecular gas in the outflow of NGC 253. We also show that H2O masers are associated with forming super star clusters and not with supernova remnants. We detect four new 36 GHz CH3OH masers in the central kpc and show possible evidence for a star-formation origin of two class I CH3OH masers. Such high resolution observations are essential for understanding the origin of these masers.
keywords:
galaxies: individual: NGC 253 – radio lines: ISM – masers – galaxies: nuclei – galaxies: starburst1 Introduction
Feedback from stars is critical to galaxy evolution in order to slow down star formation and remove baryons from the galactic disk (e.g., Hopkins et al., 2012). Galactic winds are one particular mechanism thought to slow the formation of stars over cosmic time. They potentially do this by removing large amounts of molecular gas from the disk of star-forming galaxies, i.e., ejective feedback (e.g., Somerville & Davé, 2015). Starburst driven winds are a result of feedback in the form of supernovae and stellar winds (e.g., Veilleux et al., 2005; Li et al., 2017). In this paper we explore the nuclear starburst of the nearby galaxy NGC 253 using astrophysical H2O and CH3OH masers.
NGC 253 lies at a distance of 3.5 Mpc measured from the planetary nebulae luminosity function (Rekola et al., 2005). It has a total star-formation rate of 4.2 M⊙ yr-1 of which is concentrated in the nuclear starburst (Leroy et al., 2015). The nuclear region is 1 kpc in diameter and contains about 90% of the CO luminosity of the galaxy (Young et al., 1995). The intense star formation at the center drives a molecular outflow of 30 M⊙ yr-1 (Bolatto et al., 2013).
The molecular gas in the central kpc is also highly turbulent as shown by large line widths of molecular clouds in the central kpc (Leroy et al., 2015). The clouds are located in a 1 kpc long molecular bar. The central kpc also hosts a rich spectrum of molecular lines at mm and cm wavelengths (e.g., Martín et al., 2006; Meier et al., 2015; Gorski et al., 2017). These molecular lines are useful tracers of physical conditions in the molecular interstellar medium (ISM). Utilizing the ALMA 3mm band, Meier et al. (2015) detect 50 different spectral lines towards the central kpc of NGC 253 that are used to identify different conditions from photon dominated regions (PDRs), strong and weak shocks, and gas densities and opacities. NGC 253 is the prototypical starburst used for high redshift studies. The proximity of NGC 253 makes detailed studies of its galactic wind and nuclear starburst possible. Westmoquette et al. (2011) model the approaching (southern) side of the bi-conical H emitting outflow with a frustum (truncated cone) aligned along the minor axis of the galaxy and with an opening angle of 60∘. They determine that at its greatest height above the disk the H cone has a diameter of kpc and a recessional velocity of a few 100 km s-1 relative to the systemic velocity for NGC 253 (234 km s-1Whiting, 1999). Strickland et al. (2000, 2002) studied the X-ray and H emission from the nuclear starburst of NGC 253. From their analysis, they propose four models that can give rise to the outflow morphology seen in X-ray and H emission (see figure 11 in Strickland et al., 2002). They predict various degrees of entrainment of material from the disk. Model (a) shows an interaction of hot outflowing gas with cool ambient halo clouds. These cool clouds come from accretion of primordial material or gas ejected as galactic fountains (Norman & Ikeuchi, 1989). Models (b) and (c) imply entrainment of dense gas from the disk with differences in the properties of the X-ray emitting gas. (b) shows sheaths of X-ray emitting material around dense cloud cores, whereas (c) shows a shell of X-ray emitting gas encompassing the entire outflow. In the last model, (d), the hot outflow interacts with the galactic disk and generates a shell of cooler shocked material around the hot ionized outflow. If there is entrained star-forming gas it may be traced by maser emission as tentatively shown by H2O masers extended along the axis of the outflow as reported by Gorski et al. (2017). This would support models (b) and (c) of Strickland et al. (2002) indicating entrained gas from the disk. Sites where the hot ionized outflow is collimated out of the disk may be traced by CH3OH masers (Ellingsen et al., 2014) supporting model (d) of Strickland et al. (2002).
In this paper we focus on H2O and CH3OH masers as diagnostic tools for studying the nuclear starburst and outflow in NGC 253. Gorski et al. (2017) detect 17 spectral lines of which they focus on three species: H2O (22.2 GHz), the metastable NH3(J=K) lines (23.6945 GHz27.4779 GHz), and CH3OH (36.2 GHz). H2O and CH3OH are well known maser lines. Masers provide a unique opportunity to probe star-forming environments. Gorski et al. (2017) showed evidence for H2O maser emission along the axis of the hot ionized outflow. They also resolved the first extra galactic 36 GHz CH3OH masers from Ellingsen et al. (2014) into five, unusually luminous sources at the edges of the molecular bar.
The 22 GHz H2O line requires dense gas cm-3 and kinetic temperatures K to mase if it is collisionally pumped. The line can also be radiatively pumped with background infrared radiation with temperatures of K (Gray et al., 2016). 22 GHz water masers are classified into three groups: the stellar class ( L⊙), kilomasers ( L⊙ L⊙), and megamasers (L L⊙) (see Hagiwara et al. 2001 for a description of this nomenclature). The stellar and kilomaser classes are mostly associated with star formation (e.g., Hagiwara et al. 2001; Walsh et al. 2011; Tarchi 2012). Walsh et al. (2011) estimate that 90% of these stellar class water masers are associated with high mass star formation (Young Stellar Objects, YSOs) and the other 10% associated with either low mass star formation or evolved stars. Their survey is sensitivity limited with 50% completeness at a flux limit of 5.5 Jy. We will use the 22 GHz H2O maser as a sign of intense star formation and hot shocked gas in our analysis of NGC 253’s nuclear starburst and outflow.
CH3OH masers are divided into two classes defined by their pumping schemes. Class I is collisionally pumped, such as the 36 GHz transition, and class II is radiatively pumped (Menten, 1991). These masers trace shocks and dense gas cm-3 (Pratap et al., 2008). The first detection of 36 GHz CH3OH masers in the extra-galactic context was by Ellingsen et al. (2014) in NGC 253. To date there have been detections in five galaxies other than the Milky Way: NGC 253 (Ellingsen et al., 2014), Arp220 (Chen et al., 2015), NGC 4945 (McCarthy et al., 2017), IC 342, and NGC 6946 (Gorski et al., 2018). The morphology of the 36 GHz CH3OH emission in NGC 253 and IC 342 is similar to that of the HNCO molecule a weak shock tracer (Gorski et al., 2017, 2018). Ellingsen et al. (2017) and McCarthy et al. (2017) interpret the emission as coming from large scale flows resulting in cloud-cloud collisions in NGC 253 and NGC 4945. Here we use the 36 GHz CH3OH maser as a tracer of shocks where the molecular outflow meets the disk in NGC 253.
In § 2 we describe our observations and methods for detecting masers. § 3 we report the measurements of H2O and CH3OH masers in the nuclear region and outflow of NGC 253. In § 4 we discuss the detected maser luminosities, positions, and velocities as relevant to models by Strickland et al. (2002) and forming super star clusters from Leroy et al. (2018). Lastly, in § 5 we summarize our findings.
2 Methods and Observations
2.1 Observations
We have acquired Karl G. Jansky Very Large Array (VLA)111The National Radio Astronomy Observatory is a facility of the National Science Foundation operated under cooperative agreement by Associated Universities, Inc. observations of the nuclear starburst of NGC 253 (Project code: 16B-337). The VLA was in A configuration. We targeted the 22.2 GHz H2O and 36.2 GHz CH3OH maser lines. For the 22 GHz observations we acquired 2 hours 40 minutes of integration time on source and 1 hours 30 minutes for the 36 GHz observations. To observe the H2O line we centred a 64 MHz wide sub-band at 22.216 GHz with 4096 channels (15.6 kHz or 0.21 km s-1per channel). For the CH3OH line we centred a 128 MHz wide sub-band at 36.130 GHz with 6144 channels ( 20.8 kHz or 0.17 km s-1per channel). We also acquired 1 GHz of continuum bandwidth centred at 33.5 GHz with 1.0 MHz (8.9 km s-1) channel widths. The data were calibrated in CASA 4.7.1 (McMullin et al., 2007) using the CASA scripted pipeline version 1.3.9222https://science.nrao.edu/facilities/vla/data-processing/pipeline/scripted-pipeline. We observed 3C48 as the flux density calibrator, J2253+1608 as the bandpass calibrator, and J0120-2701 as the complex gain calibrator. We then self-calibrated the data in phase only using a continuum image made from line-free channels . All the image cubes were CLEANed to 3 rms noise with natural weighting. All velocities are in the LSRK frame unless stated otherwise. All positions are relative to the phase tracking center (J0210-2701) with an uncertainty of 0.002″ RA: 01h20m31.663334s Dec: -27∘01′24.652570″ . The final rms of the 33.5 GHz continuum image is 0.02 mJy beam-1. The rms of the image cubes is discussed in the §2.2.
For H2O, we have imaged the entire primary beam out to the half power width (1.5′ in diameter). We did this to capture potential masers at large heights above the disk of NGC 253. Due to the large data sizes we could not image the entire primary beam in one image cube. We made 25 image cubes with dimensions of 800 pix800 pix1640 channels. We smoothed the image cubes to a common spatial resolution of 0.23″0.13″ with a position angle 20∘ east of north. The image cubes were made with 0.03″ pixels. We binned the spectral axis to a spectral resolution of 0.5 km s-1.
For CH3OH, we made three image cubes with 0.015″ pixels. We did not search the entire primary beam, because in the 100 pc resolution observations from Gorski et al. (2017) there are no observed masers with anomalous velocities or positions relative to the molecular bar (Ellingsen et al., 2014 and Gorski et al., 2017). Each image cube is 1200 pix1200 pix500 channels. Their centers are listed in Table 1.
| RA (J2000) | DEC(J2000) |
|---|---|
| 00h47m33.890s | -25∘17′13.350″ |
| 00h47m33.043s | -25∘17′18.357″ |
| 00h47m32.090s | -25∘17′25.573″ |
These locations are chosen to cover the five CH3OH masers from Gorski et al. (2017) and the central molecular zone. We smoothed the image cubes to a common beam size with an angular resolution of 0.13″0.10″ and a position angle of 6∘ east of north, and binned the velocity axis to a resolution of 1 km s-1. We also generated a continuum image of the central kpc centered at 33.5 GHz with bandwidth of 1 GHz, a native resolution of 0.096″0.045″, and a position angle of 2.1∘.
2.2 Maser Identification
Finding masers over large areas of sky is a question of how many real sources can be reliably identified without claiming spurious sources as real ones. Walsh et al. (2012) have provided a method for detecting galactic masers in the H2O Southern Galactic Plane Survey (HOPS). They use a combination of visual inspection and the source finding algorithm DUCHAMP333https://www.atnf.csiro.au/people/Matthew.Whiting/Duchamp/ (Whiting, 2012). We use a slightly different version of Walsh et al. (2012)’s detection method, modified for our data set.
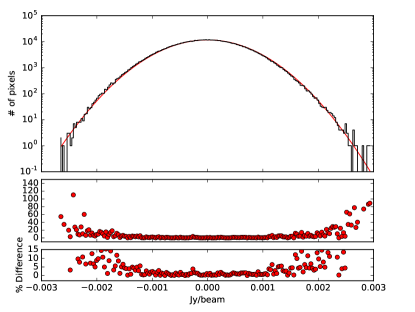
As narrow masers ( km s-1) can appear almost identical to spurious noise we first measure the rms of the image cube from the negative fluxes. This provides us with a meaningful way to quantify the quality of the data without accidentally including real sources or misidentifying real sources as noise. From the image cube we extracted a histogram of pixel values ignoring 10% of channels at the band. We fit a Gaussian to the negative half of the distribution of pixel values in each channel. Figure 1 shows the fit extended to the positive half of the distribution for a single channel. The standard deviation in the H2O cubes is measured from the FWHM and has an average value of 1.30.1 mJy beam-1 across all channels. The uncertainty is measured from the minimum and maximum values from all channels. Notably the absolute minimum value from the negative pixels over all channels is -8.8 mJy beam-1 or -6.5. This will be relevant for detection criteria later. For the CH3OH data cubes the standard deviation is 1.50.1 mJy beam-1.
Masers in the Milky Way are mostly point sources (Walsh et al., 2014). At the distance of NGC 253 we therefore do not expect any spatially resolved sources given our resolution of pc. This means we assume all sources in our data should appear beam shaped. We now consider two cases. The first case is where the maser is spectrally resolved or partially spectrally resolved. The second case is where the maser is completely spectrally unresolved resulting in a single bright channel.
In the spectrally resolved or partially-spectrally resolved case we impose the condition that the maser must appear in three or more channels and have a peak flux density of at least 5 with two 3 adjacent channels. The number of pixels in the area sustained by the half power of the synthesized beam is pixels. A 5 point source convolved with a Gaussian 38 pixel beam will fill pixels above 3. We therefore impose the condition that the source must fill at least 27 pixels in the brightest channel above 3 and at least 45 voxels (a voxel is 1 spatial pixel by 1 spectral pixel). The condition of 45 voxels is chosen because we expect a 3 source to fill pixels above 2.5, and we expect source over all 25 image cubes with a 5 bright channel adjacent to two 3 channels. This setup provided us with 10’s of sources per image cube that could be visually inspected.
In the totally spectrally unresolved case we have two subsets of criteria. Either may be satisfied to be considered a spectrally unresolved source. First, because there are no negative fluxes below -6.5, we consider any positive pixel with a value above 6.5 as a candidate source. The source must also consist of at least 38 pixels (the beam area) with values greater than 3. This is because a 6.5 source convolved with a Gaussian beam fills at least 38 pixels above 3 and a spurious bright pixel will not. This is slightly different from Walsh et al. (2012) where they chose a peak flux density value of 8. We do not impose any condition on the position angle (PA). Second we choose sources with peak flux densities and consisting of 38 pixels , We chose a limit as we expect source in the entire primary beam and entire spectral bandwidth should the noise be well described by a Gaussian. We do this by counting the number of beams, not pixels, in the image as interferometer noise is correlated (Greisen, 2002). We include the criterion that a detected source must have a Gaussian fit with the same PA as the synthesized beam. From our results in §3 we determine the range of acceptable PAs to be 20.07.8∘. The uncertainty in position angle is determined from the maximum deflection from 20∘of the four sources we detect with peak fluxes . This is a new constraint we impose, compared to Walsh et al. (2012).
The program DUCHAMP was run twice on the same image cube: once looking for spectrally resolved or partially resolved sources, and a second time looking for spectrally unresolved sources using the constraints defined above. Each list of sources was then visually inspected to eliminate any spurious detections (e.g. groups of pixels with irregular borders; figures 2 and 3 from Walsh et al., 2012). What remains we consider a detection of a maser.
3 Results
3.1 H2O Masers
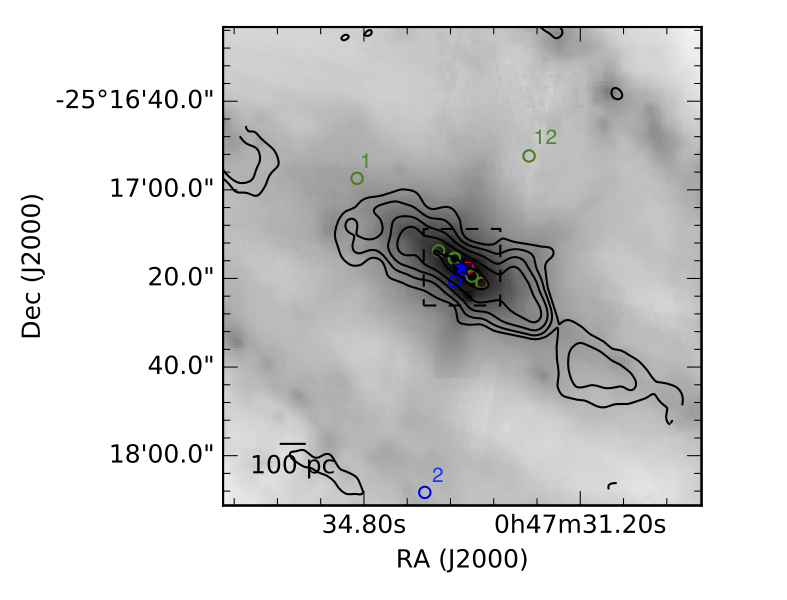
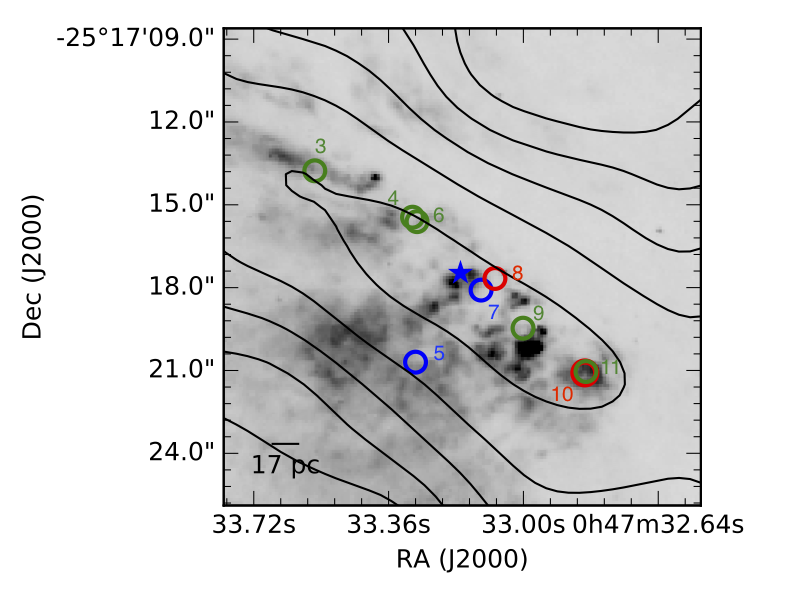
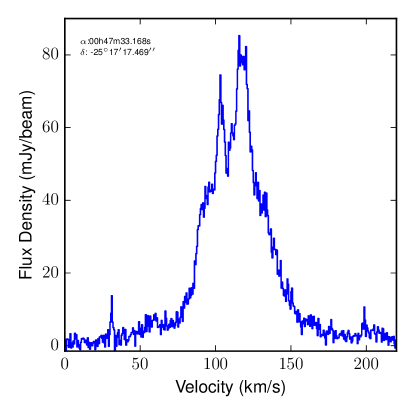
We have identified 13 spatially resolved locations with H2O masers in NGC 253. These locations are plotted in Figure 2. The maser velocities span a range from 8347 km s-1. We colour code the masers according to their velocities. Masers identified in green have velocities between 170300 km s-1 consistent with the molecular bar (e.g., Leroy et al., 2013; Gorski et al., 2017). Velocities km s-1 are plotted in blue and velocities km s-1 are plotted in red. We have detected the nuclear kilomaser (e.g., Henkel et al., 2004; Brunthaler et al., 2009; Gorski et al., 2017; W1 in Gorski et al. 2017), indicated by a star-sign in Figure 2, and 12 other stellar class masers. Eight of these masers lie along the molecular bar, with one spatially displaced ″ (54 pc) to the southeast of the molecular bar, and three in other locations in the disk (Figure 2). We show the spectrum of each maser in Figure 3 except W1, the bright kilomaser, which is shown in Figure 4. In the cases where the line is resolved we fit the spectrum with a Gaussian. Fluxes and flux densities are corrected for the primary beam attenuation. The maser properties are recorded in Table 2. All the sources have been given a number, except W1, and we have named the sources according to the International Astronomical Union specifications (Lortet et al., 1994) . Generally the primary beam correction is small, , however for the three masers not in the nuclear starburst it can be as high as 40%. The spectrum of the nuclear kilomaser, W1, could not be fit with a simple Gaussian or combination of Gaussians. The spectrum of W1 shows many velocity components spanning km s-1. We estimated the total integrated flux of W1 by making an integrated flux map excluding 10% of the channels at the edge of the sub-band. The total integrated flux is 3.600.05 Jy km s-1 for a luminosity of 1.020.01 L⊙.
| # | Name | RA (J2000) | DEC(J2000) | Luminosity | ||||
|---|---|---|---|---|---|---|---|---|
| 00h47m | -25∘ 17′ | (mJy km s-1) | (km s-1) | (km s-1) | (mJy) | L⊙ | ||
| 1 | WM 004734.9-251657.4 | 34.915s | 16′57.412″ | 5.41.6 | 211.5 | 0.5 | 11.11.6 | 1.50.4 |
| 2 | WM 004733.7-251808.0 | 33.787s | 18′8.031″ | 7.22.2 | 8.0 | 0.5 | 14.42.2 | 2.10.6 |
| 3 | WM 004733.5-251713.7 | 33.557s | 13.769″ | 12.11.8 | 172.20.1 | 1.60.3 | 7.41.0 | 3.40.5 |
| 4 | WM 004733.2-251715.4 | 33.296s | 15.449″ | 7.91.5 | 174.50.1 | 1.10.3 | 6.81.3 | 2.30.4 |
| 5 | WM 004733.2-251720.6 | 33.288s | 20.699″ | 6.41.1 | 71.90.1 | 0.80.2 | 7.91.5 | 1.80.3 |
| 6 | WM 004733.2-251715.6 | 33.284s | 15.610″ | 34.24.5 | 218.50.7 | 10.51.7 | 3.00.4 | 9.71.3 |
| W1 | WM 004733.1-251717.5 | 33.168s | 17.469″ | 3.600.05 | 116.00.1 | 85.21.3 | 1.020.01 | |
| 7 | WM 004733.1-251718.0 | 33.113s | 18.089″ | 16.61.7 | 157.00.1 | 1.50.2 | 10.51.1 | 4.70.5 |
| 8 | WM 004733.0-251717.6 | 33.076s | 17.669″ | 25.42.8 | 347.00.2 | 3.90.5 | 6.10.7 | 7.20.8 |
| 9 | WM 004733.0-251719.4 | 33.001s | 19.496″ | 10.31.6 | 207.40.1 | 1.30.2 | 7.51.1 | 2.90.5 |
| 10 | WM 004732.8-251721.1 | 32.836s | 21.089″ | 10.71.6 | 310.80.1 | 1.30.2 | 8.11.2 | 3.00.5 |
| 11 | WM 004732.8-251721.0 | 32.833s | 21.039″ | 12.31.7 | 294.60.1 | 1.40.2 | 8.41.2 | 3.50.5 |
| 12 | WM 004732.0-251652.3 | 32.052s | 16′52.355 | 5.21.5 | 265.5 | 0.5 | 10.41.5 | 1.50.4 |
3.2 CH3OH Masers
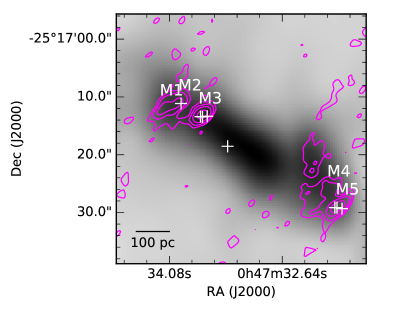
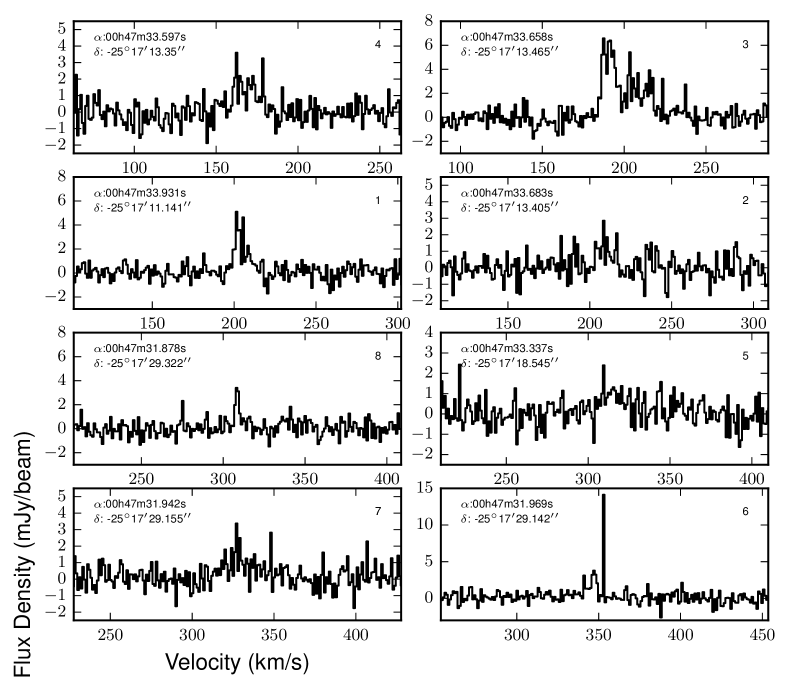
We detect seven compact masers at the locations of M2, M3, and M5 from Gorski et al. (2017) or MM6, MM4, or MM1 in Ellingsen et al. (2017) respectively, and one new maser. Four of these sources were not detected by Chen et al. (2018). With an rms of 20 mJy beam-1 km s-1 (channel width of 8.3 km s-1) it is unlikely that they would have detected the fainter sources. The locations of all the CH3OH masers are shown in Figure 5. The extracted spectra are shown in Figure 6 and the properties are listed in Table 3.
The total integrated CH3OH flux from Ellingsen et al. (2014) is 5.8 Jy km s-1 whereas we have measured Jy km s-1. The Ellingsen et al. (2014) observations have a rms noise per channel 0.8 mJy beam-1, a synthesized beam of 8.0″4.2″, and minimum and maximum baselines of 61 and 192 m respectively. This means 92% of the flux is resolved out on ″ scales if these masers are not variable. If all the emission is from compact maser sites, we would expect to recover all the flux, so this low percentage suggests most of the emission from Ellingsen et al. (2014) may be thermal and spatially extended, or there is relatively diffuse maser emission as in Galactic star forming regions like the W3(OH) region. Menten et al. 1992 and Harvey-Smith & Cohen 2006 shows maser emission over two orders of magnitude in spatial scale, from 0.1-0.001″, in the W3(OH) region. The brightness temperatures constrain this issue somewhat. We detect a range of peak flux density values in the range 1.116.5 mJy or brightness temperatures of approximately 601500 K The molecular gas is estimated to have two temperature components, a cool 574 K component and a warm 1348 K component (Gorski et al., 2017). It is possible that the less luminous sources could be thermal emission, though as these sources are unresolved, the brightness temperatures are lower limits. In general the measured properties of the CH3OH masers are in good agreement with Chen et al. (2018).
| # | Name | LabelA | RA (J2000) | DEC(J2000) | Luminosity | ||||
|---|---|---|---|---|---|---|---|---|---|
| 00h47m | -25∘ 17′ | (mJy km s-1) | (km s-1) | (km s-1) | (mJy) | ||||
| 1 | MM 004733.93-251711.14 | MM6 | 33.931s | 11.141″ | 38.43.4 | 204.00.4 | 9.11.0 | 3.80.4 | 17.61.5 |
| 2 | MM 004733.68-251713.40 | - | 33.683s | 13.405″ | 17.13.3 | 209.51.0 | 10.32.5 | 1.60.3 | 7.91.6 |
| 3a | MM 004733.65-251713.45 | MM4 | 33.658s | 13.456″ | 116.520.7 | 207.21.7 | 31.45.6 | 4.90.4 | 53.99.6 |
| 3b | MM4 | 33.658s | 13.456″ | 82.410.3 | 189.30.5 | 12.81.6 | 8.20.9 | 36.74.7 | |
| 4 | MM 004733.57-251713.35 | - | 33.579s | 13.350″ | 37.24.7 | 168.31.2 | 18.92.9 | 1.70.2 | 17.22.2 |
| 5 | MM 004733.33-251718.54 | - | 33.337s | 18.545″ | 20.13.8 | 315.41.6 | 17.03.9 | 1.10.2 | 9.31.8 |
| 6a | MM 004731.96-251729.14 | MM2 | 31.969s | 29.142″ | 43.711.1 | 348.40.8 | 10.32.0 | 4.10.7 | 20.25.7 |
| 6b | MM2 | 31.969s | 29.142″ | 19.41.8 | 353.5 | 1.0 | 19.41.7 | 8.90.8 | |
| 7 | MM 004731.94-251729.15 | MM1 | 31.942s | 29.155″ | 45.86.7 | 330.32.0 | 26.64.7 | 1.60.2 | 24.93.1 |
| 8 | MM 004731.87-251729.32 | - | 31.878s | 29.322″ | 14.82.1 | 309.00.2 | 2.80.5 | 5.11.2 | 6.81.0 |
4 Discussion
We detect thirteen water masers in NGC 253: twelve stellar class masers and one kilomaser. We also detect eight class I CH3OH 36 GHz masers. We will interpret these results using models from Strickland et al. (2002) that describe the relationship between the nuclear starburst and the outflow. We also discuss the association of H2O masers with compact radio sources and forming super star clusters (SSCs) described in Leroy et al. (2018).
4.1 H2O Masers and The Outflow
All the H2O masers we have detected have a luminosity L⊙ classifying them as stellar class masers with the exception of the nuclear kilomaser W1. Palagi et al. (1993) suggest that the maximum luminosity of evolved-star water masers is L⊙, hence all our detected masers are likely star formation related. Gorski et al. (2017) showed possible evidence of an H2O maser extension along the minor axis of the galaxy. This suggested either a jet (e.g., Peck et al., 2003) from an active galactic nucleus (AGN) or entrained star-forming material in the outflow. In the subarcsecond resolution observations we provide in this paper we do not see masers organized along the minor axis of the galaxy in a jet like extension suggested in Gorski et al. (2017). Their extension is likely an artifact resulting from generating a super-resolved image cube. This reinforces the picture that NGC 253’s nuclear environment has a pure starburst nature (Brunthaler et al., 2009).
From Leroy et al. (2013) and Gorski et al. (2017) we see that the molecular gas in the central 300 pc, which is associated with the molecular bar, has velocities in the range of 170300 km s-1. In Figure 2 we colour code masers with these velocities. Four of the nine masers in the nuclear 300 pc have velocities inconsistent with the molecular bar. Westmoquette et al. (2011) show that the southeast hot ionized outflow has velocities km s-1 blueshifted with respect to the systemic velocity of NGC 253. The redshifted side, which is pointed away from the observer, was not detected. It is likely obscured by the foreground disk. Masers with velocities of 35185 km s-1 could be associated with the ionized outflow. As a precaution we only consider masers with velocities km s-1 to be part of the ionized outflow as this velocity range does not overlap with the molecular bar. W1 and three other stellar H2O masers are in this range. The H2O sources 2 and 5 do not lie in the molecular bar but to the southeast of the nuclear starburst. It is important to note that water masers often have velocities offset from the systemic velocity of their associated system. In the Milky Way the largest offset is 100 km s-1 (Titmarsh et al., 2013), but the strongest emission is within 10 km s-1 of the systemic velocity of the system (Breen & Ellingsen, 2011).
We interpret the velocities and positions of the H2O masers to indicate entrainment of star-forming molecular gas in the hot ionized outflow of NGC 253. This supports models (b) and (c) from Strickland et al. (2002) that show entrainment of the ISM from the disk. The redshifted masers, H2O 8 and 10, would represent the receding side of the outflow in this picture. The receding outflow is difficult to observe in the center of the galaxy because optical, ultraviolet, and X-ray observations are obscured by the disk. Bolatto et al. (2013) measure the velocity of the receding outflow to have velocities of 240-400 km s-1 from emission, consistent with the velocity of H2O source 8.
The nuclear kilomaser, W1, shows an increase in luminosity from 0.67 L⊙ from Gorski et al. (2017) to 1.0 L⊙ a % 42 increase. The features W1c and W3 in Gorski et al. (2017) was not detected. The W2 feature appeared in Gorski et al. (2017) as a broad faint feature with several possible sources. Here we present many narrow spectral features within 100 kms of W2. Though we do not see any sources related to the peaks in W2 from Gorski et al. (2017). This is unsurprising as water masers are notoriously variable and can vary on time scales of days, weeks, or months (e.g., Braatz et al., 1996; Claussen et al., 1996; Felli et al., 2007; Breen et al., 2013). This shows that there are many variable water masers in the nuclear region of NGC 253.
4.2 Super Star Clusters and Supernovae
Five water masers are spatially coincident, within 0.23″, or one VLA synthesized beam width at 22 GHz, with super star clusters (SSCs). Leroy et al. (2018) has identified 14 candidate super star clusters with stellar and gas masses M⊙ in the central 200 pc of NGC 253. They accomplished this by comparing 350 GHz with 36 GHz continuum emission. They estimated dynamical masses from the widths of the CS () and H13CN() lines, and the stellar masses from the ionizing photon rate (Murphy et al., 2011 and Leitherer et al., 1999). Of these 14 sources, numbers 3,6,9,11 and 14 from Leroy et al. (2018) have associated stellar class H2O maser emission indicating strong star formation. H2O source 11 is closest to the nuclear kilomaser suggesting particularly strong star formation at this location. Figure 7 shows the location of the SSCs relative to our water masers, and supernova remnants (SNRs) and H ii regions from Ulvestad & Antonucci (1997).
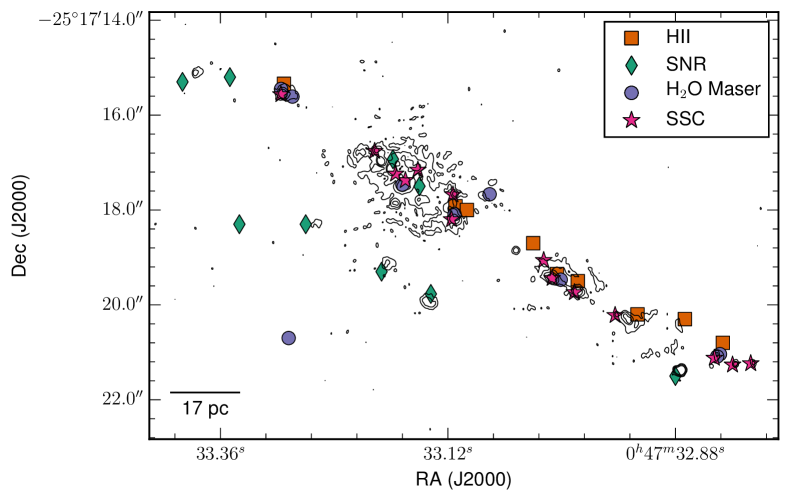
While not all the radio continuum sources show H2O maser emission, only sources identified as H ii regions in Ulvestad & Antonucci (1997) show H2O maser emission within one synthesized beam width. Figure 7 shows the 33.5 GHz continuum image. At these frequencies the radio continuum is dominated by free-free emission that is a result of ionizing radiation from young stars, and it has a relatively flat spectral index (; e.g., Condon, 1992; Murphy et al., 2011, 2018). Continuum sources with spectral index () in Ulvestad & Antonucci (1997) show no water maser emission. This is similar to Milky Way studies (e.g., Claussen et al., 1999; Woodall & Gray, 2007) that show that the shocks in supernova remnants do not excite the H2O maser line. (Claussen et al., 1999) suggest that unusually high densities ( cm-3) or shock velocities ( km s-1) could potentially excite water masers. This is consistent with what we know of the molecular clouds in NGC 253. The density of the molecular clouds is cm-3 (Leroy et al., 2015) or cm-3(Meier et al., 2015) in the denser regions. They are likely not dense enough for the excitation of 22 GHz H2O masers via interaction with SNR.
H2O masers are variable, thus we would not necessarily expect H2O maser detections to be associated with all SSC candidates. For example we do not detect the maser W3 from Gorski et al. (2017), however, we detect H2O from Henkel et al. (2004) with a flux of 12.11.8 mJy km s-1. This maser was not detected in Gorski et al. (2017) indicating an increase in brightness between 2013 and 2016, but a decrease since it was first detected in 2002. Our results reinforce the interpretation of the emission from NGC253 as due to the starburst and not an AGN, and show that monitoring of maser sites in the nucleus could reveal more sites of intense star formation.
4.3 CH3OH Masers
Chen et al. (2018) showed that the compact 36 GHz CH3OH sources are mostly masers with brightness temperatures of K. However, most of the emission is resolved out in subarcsecond-resolution interferometric observations.
In the Milky Way surveys of class I CH3OH masers, where supernova remnants interact with molecular clouds (e.g., Pihlström et al., 2014 and McEwen et al., 2016), are revealed to have linewidths of km s-1. Typical class I stellar CH3OH masers have FWHMs km s-1 (Voronkov et al., 2014). All of our linewidths are greater than 1 km s-1 with the exception of the bright component MM 6a (Ellingsen et al., 2017; MM1) at a velocity of 353.5 km s-1. This suggests either a potentially different origin for most of our sources or we are averaging over many sources in the pc sythensized beam. Ellingsen et al. (2017) compares the 36 GHz CH3OH maser with 44.1 GHz CH3OH maser. In both cases the luminosity is much greater than what would be expected, for high mass star formation. Due to the proximity of the CH3OH masers to the inner Limblad resonances, Ellingsen et al. (2017) claim that the emission is generated through cloud-cloud collisions. Our results are mostly consistent with this interpretation. The exception is the source MM 6a which is likely stellar in origin as the line is unresolved (km s-1).
Leurini et al. (2016) estimate that class I CH3OH masers should not vary in brightness on time scales of yrs should the maser be saturated. The maser spot has a size of AU, and a shock velocity of 30 kms. The time between the observations presented in Chen et al. (2018) (August 2015) and this paper (October 2016) is yr. Of the four masers detected in Chen et al. (2018) we measure the same fluxes within the uncertainties. Half of our masers would be too weak to detect with their sensitivity, so it is unknown if they are variable. The time between the observations from Gorski et al. (2017) and this paper’s observations is yrs, but the two sets of observations are in different array configurations meaning different spatial frequencies were sampled. This makes determining variability impossible as most emission is resolved out. However as the scale of the emission is AU, we would not expect any maser variability unless the masers are not saturated.
There is a dearth of CH3OH maser emission within the central 300 pc of NGC 253. The one maser we detect in this region is fairly weak with a peak flux density of 1.1 mJy. It is possible that this is because the density of molecular gas rises in the galaxy center (Leroy et al., 2015) and CH3OH maser emission could be quenched at densities cm-3(e.g., Menten, 1991; McEwen et al., 2014). CH3OH source 5 may be an isolated star-forming region obscured by dust, or a spurious site of lower density. It is also possible that methanol is depleted due to a stronger ultraviolet radiation field.
Ellingsen et al. (2014) suggests that the sites of the 36 GHz methanol masers indicate the edges of the molecular outflow. This could provide evidence for model (d) of Strickland et al. (2002) showing sites of swept up molecular gas or collimation sites of the outflow. The west group of methanol masers has velocities km s-1and the east has velocities km s-1. These velocities are more consistent with the molecular bar and molecular outflow ( east: km s-1, west: km s-1 Bolatto et al., 2013), than that of the hot-ionized outflow ( km s-1 Westmoquette et al., 2011 ). We do not observe any obvious indication that these are related to the molecular outflow of NGC 253.
5 Summary
We have presented subarcsecond observations of the 22 GHz H2O maser and 36 GHz CH3OH maser of the nuclear starburst in NGC 253. We have interpreted the results through the models of outflows in Strickland et al. (2002) and compared to the formation of SSCs of Leroy et al. (2018). We have found the following:
-
1.
We have detected thirteen water masers in NGC 253 and provided evidence for entrainment of dense star-forming material in the hot ionized outflow of NGC 253. The minor axis extension of H2O maser emission from Gorski et al. (2017) is not related to an AGN. This was inferred from the lack of an extended structure and detection of only discrete sites of maser emission.
-
2.
We have shown that H2O masers are positionally associated with sites of strong star formation, and possible super star cluster formation, but not with supernova remnants. The nuclear kilomaser is associated with a forming super star cluster.
-
3.
We detected eight sites with 36 GHz CH3OH maser emission. These sites are located at the edges of the molecular bar. They are unusually luminous compared to CH3OH masers in star-forming regions. We are in agreement with Chen et al. (2018) that cloud-cloud collisions are the likely sources of these masers. It is possible that these are collimation sites of the galactic wind, however the orientation of NGC 253 makes this very difficult to determine. We detect one weak CH3OH maser in the centre of NGC 253, and a narrow spectral component towards MM 6a suggesting a possible star-formation origin.
The detection of star-forming dense molecular gas with velocities peculiar to the molecular bar provides evidence for the Strickland et al. (2002) models of outflows that entrain dense gas from the disk. The detection of water masers shows that that the entrained gas can form stars. From our CH3OH maser observations we cannot rule out the model where gas is swept up from the disk generating a cool shell around the hot ionized outflow. It is possible that neither of these models completely describe galactic winds. Bolatto et al. (2013) show ample evidence for a cool molecular shell about the hot ionized outflow. Therefore combined models of entrained star forming gas and swept up cool molecular shells more accurately describe the outflow process than either model independently.
Acknowledgements
We would like to thank Pauline Barmby for her helpful and insightful comments on the draft.
The National Radio Astronomy Observatory is a facility of the National Science Foundation operated under cooperative agreement by Associated Universities, Inc.
This research has made use of the NASA/IPAC Extragalactic Database (NED) and NASA/IPAC Infrared Science Archive, which is maintained by the Jet Propulsion Laboratory, Caltech, under contract with the National Aeronautics and Space Administration (NASA) and NASA’s Astrophysical Data System Abstract Service (ADS).
References
- Bolatto et al. (2013) Bolatto, A. D., Warren, S. R., Leroy, A. K., et al. 2013, Nature, 499, 450
- Braatz et al. (1996) Braatz, J. A., Wilson, A. S., & Henkel, C. 1996, ApJS, 106, 51
- Breen & Ellingsen (2011) Breen, S. L., & Ellingsen, S. P. 2011, MNRAS, 416, 178
- Breen et al. (2013) Breen, S. L., Lovell, J. E. J., Ellingsen, S. P., et al. 2013, MNRAS, 432, 1382
- Brunthaler et al. (2009) Brunthaler, A., Castangia, P., Tarchi, A., et al. 2009, A&A, 497, 103
- Chen et al. (2015) Chen, X., Ellingsen, S. P., Baan, W. A., et al. 2015, ApJ, 800, L2
- Chen et al. (2018) Chen, X., Ellingsen, S. P., Shen, Z.-Q., et al. 2018, ApJ, 856, L35
- Claussen et al. (1996) Claussen, M. J., Wilking, B. A., Benson, P. J., et al. 1996, ApJS, 106, 111
- Claussen et al. (1999) Claussen, M. J., Goss, W. M., Frail, D. A., & Seta, M. 1999, AJ, 117, 1387
- Condon (1992) Condon, J. J. 1992, ARA&A, 30, 575
- Dale et al. (2009) Dale, D. A., Cohen, S. A., Johnson, L. C., et al. 2009, ApJ, 703, 517
- Ellingsen et al. (2014) Ellingsen, S. P., Chen, X., Qiao, H.-H., et al. 2014, ApJ, 790, L28
- Ellingsen et al. (2017) Ellingsen, S. P., Chen, X., Breen, S. L., & Qiao, H.-H. 2017, MNRAS, 472, 604
- Felli et al. (2007) Felli, M., Brand, J., Cesaroni, R., et al. 2007, A&A, 476, 373
- Gorski et al. (2017) Gorski, M., Ott, J., Rand, R., et al. 2017, ApJ, 842, 124
- Gorski et al. (2018) Gorski, M., Ott, J., Rand, R., et al. 2018, ApJ, 856, 134
- Gray et al. (2016) Gray, M. D., Baudry, A., Richards, A. M. S., et al. 2016, MNRAS, 456, 374
- Greisen (2002) Greisen, E. W. 2002, Astronomical Data Analysis Software and Systems XI, 281, 260
- Hagiwara et al. (2001) Hagiwara, Y., Henkel, C., Menten, K. M., & Nakai, N. 2001, ApJ, 560, L37
- Harvey-Smith & Cohen (2006) Harvey-Smith, L., & Cohen, R. J. 2006, MNRAS, 371, 1550
- Henkel et al. (2004) Henkel, C., Tarchi, A., Menten, K. M., & Peck, A. B. 2004, A&A, 414, 117
- Hopkins et al. (2012) Hopkins, P. F., Quataert, E., & Murray, N. 2012, MNRAS, 421, 3522
- Leitherer et al. (1999) Leitherer, C., Schaerer, D., Goldader, J. D., et al. 1999, ApJS, 123, 3
- Leroy et al. (2013) Leroy, A. K., Walter, F., Sandstrom, K., et al. 2013, AJ, 146, 19
- Leroy et al. (2015) Leroy, A. K., Bolatto, A. D., Ostriker, E. C., et al. 2015, ApJ, 801, 25
- Leroy et al. (2018) Leroy, A. K., Bolatto, A. D., Ostriker, E. C., et al. 2018, arXiv:1804.02083
- Leurini et al. (2016) Leurini, S., Menten, K. M., & Walmsley, C. M. 2016, A&A, 592, A31
- Li et al. (2017) Li, M., Bryan, G. L., & Ostriker, J. P. 2017, ApJ, 841, 101
- Lortet et al. (1994) Lortet, M.-C., Borde, S., & Ochsenbein, F. 1994, A&AS, 107, 193
- Martín et al. (2006) Martín, S., Mauersberger, R., Martín-Pintado, J., Henkel, C., & García-Burillo, S. 2006, ApJS, 164, 450
- McCarthy et al. (2017) McCarthy, T. P., Ellingsen, S. P., Chen, X., et al. 2017, ApJ, 846, 156
- McEwen et al. (2014) McEwen, B. C., Pihlström, Y. M., & Sjouwerman, L. O. 2014, ApJ, 793, 133
- McEwen et al. (2016) McEwen, B. C., Sjouwerman, L. O., & Pihlström, Y. M. 2016, ApJ, 832, 129
- McMullin et al. (2007) McMullin, J. P., Waters, B., Schiebel, D., Young, W., & Golap, K. 2007, Astronomical Data Analysis Software and Systems XVI, 376, 127
- Meier et al. (2015) Meier, D. S., Walter, F., Bolatto, A. D., et al. 2015, ApJ, 801, 63
- Menten (1991) Menten, K. 1991, Atoms, Ions, and Molecules: New Results in Spectral Line Astrophysics, 16, 119
- Menten et al. (1992) Menten, K. M., Reid, M. J., Pratap, P., Moran, J. M., & Wilson, T. L. 1992, ApJ, 401, L39
- Murphy et al. (2011) Murphy, E. J., Condon, J. J., Schinnerer, E., et al. 2011, ApJ, 737, 67
- Murphy et al. (2018) Murphy, E. J., Dong, D., Momjian, E., et al. 2018, ApJS, 234, 24
- Norman & Ikeuchi (1989) Norman, C. A., & Ikeuchi, S. 1989, ApJ, 345, 372
- Palagi et al. (1993) Palagi, F., Cesaroni, R., Comoretto, G., Felli, M., & Natale, V. 1993, A&AS, 101, 153
- Peck et al. (2003) Peck, A. B., Henkel, C., Ulvestad, J. S., et al. 2003, ApJ, 590, 149
- Pihlström et al. (2014) Pihlström, Y. M., Sjouwerman, L. O., Frail, D. A., et al. 2014, AJ, 147, 73
- Pratap et al. (2008) Pratap, P., Shute, P. A., Keane, T. C., Battersby, C., & Sterling, S. 2008, AJ, 135, 1718
- Rekola et al. (2005) Rekola, R., Richer, M. G., McCall, M. L., et al. 2005, MNRAS, 361, 330
- Somerville & Davé (2015) Somerville, R. S., & Davé, R. 2015, ARA&A, 53, 51
- Strickland et al. (2000) Strickland, D. K., Heckman, T. M., Weaver, K. A., & Dahlem, M. 2000, AJ, 120, 2965
- Strickland et al. (2002) Strickland, D. K., Heckman, T. M., Weaver, K. A., Hoopes, C. G., & Dahlem, M. 2002, ApJ, 568, 689
- Tarchi (2012) Tarchi, A. 2012, IAU Symposium, 287, 323
- Titmarsh et al. (2013) Titmarsh, A. M., Ellingsen, S. P., Breen, S. L., Caswell, J. L., & Voronkov, M. A. 2013, ApJ, 775, L12
- Ulvestad & Antonucci (1997) Ulvestad, J. S., & Antonucci, R. R. J. 1997, ApJ, 488, 621
- Veilleux et al. (2005) Veilleux, S., Cecil, G., & Bland-Hawthorn, J. 2005, ARA&A, 43, 769
- Voronkov et al. (2014) Voronkov, M. A., Caswell, J. L., Ellingsen, S. P., Green, J. A., & Breen, S. L. 2014, MNRAS, 439, 2584
- Walsh et al. (2011) Walsh, A. J., Breen, S. L., Britton, T., et al. 2011, MNRAS, 416, 1764
- Walsh et al. (2012) Walsh, A. J., Purcell, C., Longmore, S., Jordan, C. H., & Lowe, V. 2012, Publ. Astron. Soc. Australia, 29, 262
- Walsh et al. (2014) Walsh, A. J., Purcell, C. R., Longmore, S. N., et al. 2014, MNRAS, 442, 2240
- Watson et al. (1996) Watson, A. M., Gallagher, J. S., III, Holtzman, J. A., et al. 1996, AJ, 112, 534
- Westmoquette et al. (2011) Westmoquette, M. S., Smith, L. J., & Gallagher, J. S., III 2011, MNRAS, 414, 3719
- Whiting (1999) Whiting, A. B. 1999, AJ, 117, 202
- Whiting (2012) Whiting, M. T. 2012, MNRAS, 421, 3242
- Woodall & Gray (2007) Woodall, J. M., & Gray, M. D. 2007, MNRAS, 378, L20
- Young et al. (1995) Young, J. S., Xie, S., Tacconi, L., et al. 1995, ApJS, 98, 219