Characteristics of long-lived persistent spectral holes in Eu3+:Y2SiO5 at 1.2 K
Abstract
Properties of persistent spectral holes (SHs) relevant for frequency metrology have been investigated in the system Eu3+:Y2SiO5(0.5%) at crystallographic site 1 and a temperature of Kelvin. Hole linewidths as small as 0.6 kHz have been reliably achieved. The theoretically predicted dependence of the frequency shift with temperature has been confirmed with high precision. The thermal hysteresis of the SH frequency between 1.15 K and 4.1 K was measured to be less than fractionally. After initially burning a large ensemble of SHs, their properties were studied on long time scales by probing different subsets at different times. SHs could still be observed 49 days after burning if not interrogated in the meantime. During this time, the SH linewidth increased from 4 to 5.5 kHz, and the absorption contrast decreased from 35% to 15%. During a 14-day interval the absolute optical frequencies of previously unperturbed spectral holes were measured with respect to a GPS-monitored active H-maser, using a femtosecond frequency comb. The fractional frequency drift rate exhibited an upper limit of , 65 times smaller than the most stringent previous limit.
I Introduction
Recent progress in the performance of optical clocks, based on cold atom ensembles or single ions (Derevianko and Katori, 2011; Poli et al., 2013; Ludlow et al., 2015; Hong, 2017), has become possible due to a strong improvement of the short-term frequency stability of the “clock” lasers that interrogate the atomic transitions (Kessler et al., 2012; Häfner et al., 2015). Today’s clock lasers are realized by using macroscopic solid-state references, high-finesse optical cavities. Ultimately, the frequency stability of a clock laser corresponds to the stability of the cavity’s length. The latter is fundamentally limited by thermal noise, and often also by vibrations induced by environmental noise. Nevertheless, excellent frequency instabilities have been reached, with lowest values currently at fractionally (Matei et al., 2017). As of today, only very few approaches have been identified that have the potential of surpassing the resonator approach (Meiser et al., 2009).
One solution is the use of persistent spectral holes in rare-earth-doped crystals at cryogenic temperatures. Here, a large ensemble of atomic ions () is embedded in a crystalline host; on the order of ions contribute to a single spectral hole, and provide a narrow-linewidth frequency reference. This approach, suggested already more than two decades ago (Macfarlane and Shelby, 1987; Sellars et al., 1994; Sellin et al., 1999, 2001; Pryde et al., 2002), combines advantageous features of atomic and macroscopic solid-state references.
The first report of frequency-stabilization of a laser to a SH, using the Pound-Drever-Hall technique, dates back to 1999 (Sellin et al., 1999). A complication in this approach is that a SH is not a “static” reference but is modified dynamically by the interrogating laser field (Julsgaard et al., 2007), a fact that must be taken into account in the experimental scheme. More recent work showed that SHs with narrow, kHz-level linewidths persist for times up to weeks with a high signal contrast (Thorpe et al., 2011). In order to minimize the modification of the SHs by the laser radiation to be stabilized, Cook et al. have developed a technique that uses a pattern of hundreds of SH for frequency stabilization (Cook et al., 2015). An excellent frequency instability at the fractional level was thereby achieved for a 580 nm laser resonant with the transition of the Eu3+:Y2SiO5system at 580 nm. Recently, in the same system, a heterodyne detection technique for laser frequency locking to a single spectral hole was demonstrated (Gobron et al., 2017). Both techniques allow continuous (uninterrupted) frequency stabilization of a laser.
The long-term frequency stability of a SH on timescales of minutes and longer and therefore its utility for long-term frequency stabilization of lasers or for potential studies of fundamental physics depends also on systematic effects caused by external disturbances. Disturbances such as variations of temperature and of magnetic field, vibrations, but also energy exchange on the atomic scale, result in a SH frequency shift, SH contrast decrease and SH linewidth increase over time. These issues were studied in detail in the system Eu3+:Y2SiO5 at 4 K (Thorpe et al., 2011, 2013; Cook et al., 2015) and at 3 K (Chen et al., 2011), including accurate determinations of the temperature dependence of the SH frequency. To minimize the influence of this latter effect, (Thorpe et al., 2011) implemented a compensation system making use of the dependence of SH frequency on gas pressure.
In laser frequency stabilization on long time intervals, an extreme case is the time scale of days and weeks after burning SHs. On this time scale the drift of the SH frequency and the modification of the SH lineshape was first investigated in (Chen et al., 2011). A drift consistent with zero ( at level) was observed at 3 K, which was later confirmed in (Leibrandt et al., 2013).In this paper we extend the study of the long–term properties of persistent SHs to lower temperature, near 1.2 K. This is one of the lowest temperatures used so far in SH studies. One particular aspect of our approach was to probe the spectral holes cautiously. For example, SHs were left unperturbed spectrally for up to 49 days until interrogation occurred and then interrogated only once, by a single absorption scan.
II Experiment
Absorption spectroscopy experiments were carried out on the 7F05D0 transition of Eu3+ ions of the crystallographic site 1 in a Y2SiO5 host crystal (Macfarlane and Shelby, 1987), in the temperature range 1.15 - 4.1 K. A schematic of the experimental setup is shown in Fig. 1.
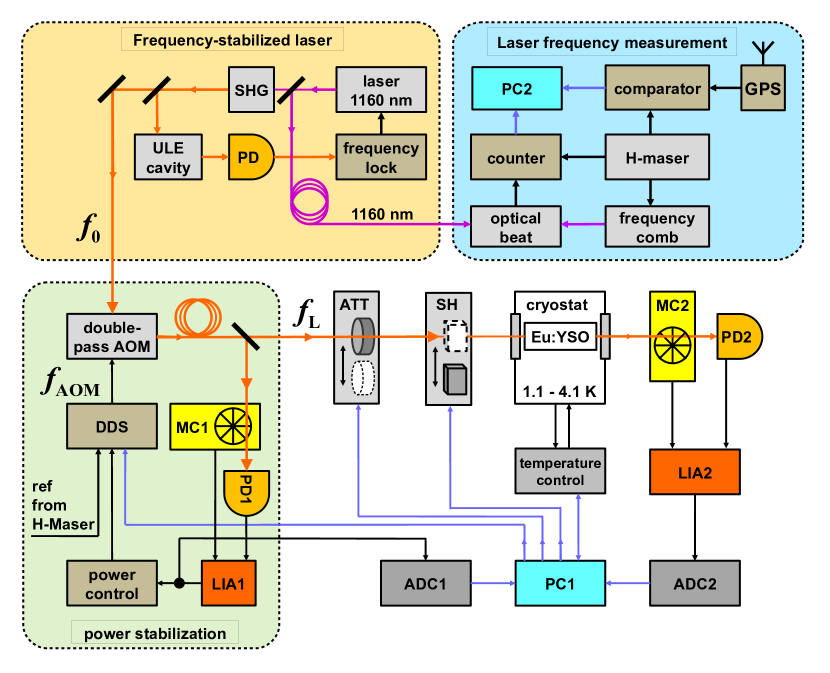
The Eu3+:Y2SiO5 crystal with 0.5% rare-earth ion concentration has dimensions of mm3, with the polished mm2 facets parallel to the D1 and D2 axes. The crystal was placed inside a ring-shaped rare-earth permanent magnet with a maximum magnetic field of approximately 0.8 T. The crystal and magnet were mounted on a copper plate inside the cryostat. A closed-cycle pulse-tube cooler cryostat equipped with a Joule-Thomson stage was used for cooling. This allowed achieving crystal temperatures as low as 1.15 K.
For burning and interrogating SHs we used an external-cavity diode laser stabilized to a high-finesse ULE optical resonator. A description of this system, operating at 1156 nm, is given in (Vogt et al., 2011). In the present experiment, with the laser operating at 1160 nm, the linewidth was approximately 50 Hz. The radiation was frequency doubled to 580 nm, led to the cryostat using a 5 m long polarization-maintaining optical fiber, and focused into the crystal using a fiber collimator. The beam diameter in the focus was 300 m. The light transmitted through the crystal was detected with a low-noise silicon photodetector (PD2). A remotely controlled attenuator, based on a neutral density filter (ATT) and a mechanical shutter (ST), were used to control the duration and laser power of SH burning and SH read-out phases.
Before entering the cryostat, the laser light passed a beam splitter which deflected 30% of the radiation to a reference Si photodetector (PD1). Its signal was used for active stabilization of the laser power entering the crystal. To this end, an analog servo regulated the amplitude of the RF driver of an acusto-optic modulator (AOM). In addition, during the spectroscopy experiments, the output of PD1 was used for normalization of the value of the transmitted laser power, so as to reduce the influence of the laser power fluctuations on the measurements. The laser waves reaching the photodetectors PD1 and PD2 were modulated with chopper wheels (MC1, MC2) at frequencies of 600 Hz and 650 Hz, respectively. The photodetector signals were demodulated by respective lock-in amplifiers (LIA1 and LIA2). A typical lock-in integration time constant was 0.3 s. The output signals of both lock-in amplifiers were read out with a 10-bit A/D converter.
To tune the laser frequency, we used the AOM in a double-pass configuration driven by a computer-controlled DDS. It was referenced to a 10 MHz reference signal coming from an active hydrogen maser. The complete experiment including the DDS, the choppers, lock-in detectors, etc. was computer-controlled with a LabVIEW program. The absolute frequency of the wave interrogating the Eu3+-ions at 580 nm is determined by the stabilized, but slowly drifting laser frequency at 580 nm, , plus the total frequency shift introduced by the AOM, .
The laser frequency was measured at 1160 nm () relative to the frequency of the active hydrogen maser, using a commercial erbium-doped fiber laser frequency comb (FC), optically stabilized to a home-built ULE cavity stabilized 1562 nm laser system by controlling the FC repetition rate. To this end, a fraction of the laser radiation was led to the comb laboratory via a 150 m long, unstabilized fiber. The heterodyne beat signal of the laser with a comb mode was measured with a dead-time-free frequency counter. The laser frequency was then evaluated in a conventional way from the beat frequency, the repetition rate, and the carrier envelope offset frequency. All respective counters were referenced to the maser. In addition, the maser’s long-term frequency drift was monitored by a GPS receiver.
III Spectral holes
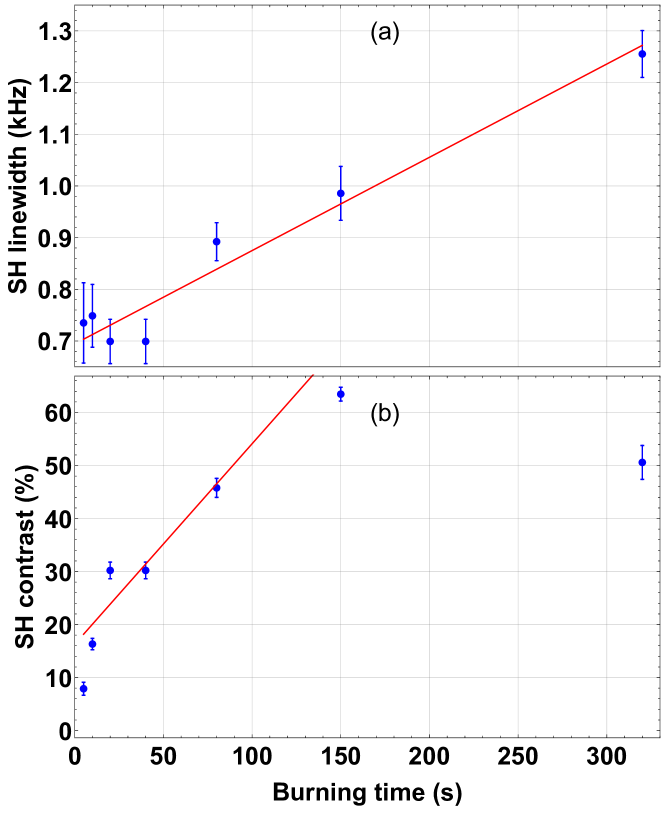
A basic investigation consisted in the determination of conditions under which the burning produced SHs of appreciable strength but still having narrow linewidth. To this end, we measured the dependence of the SH linewidth and SH contrast on the burn phase duration. We define the SH contrast as , where is the laser power measured by the transmission detector PD2 for a given interrogation laser detuning from SH line center, . is the power detected on-resonance for a “deeply” burnt SH, the crystal then being essentially transparent.
Different sets of 5 SHs with a frequency spacing of 20 kHz were burned with a laser power of 1.7 nW for durations from 10 s to 320 s. Spectroscopy of the holes was carried out by tuning the frequency in steps of 100 Hz within a frequency range around the SH center frequencies with a dwell time of 0.7 s. For these measurements the laser power was reduced to 0.86 nW. The transmission data taken during such scans were fitted with Lorentzians and the FWHM (full width at half maximum) linewidth values were determined. The mean FWHM values of 5-hole sets are presented in Fig. 2a. The SH linewidth dependence on burn duration was found to be approximately linear, with a slope of . For small burn time up to 150 s dwell time, the SH contrast (Fig. 2b) follows a linear dependence with a slope of 25%/min. At 320 s burn time we observed a strong saturation effect.
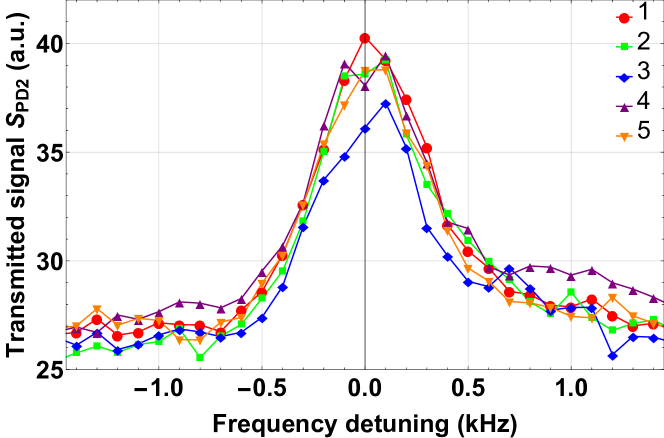
We investigated the operational parameters for obtaining minimum SH linewidths. For example, we produced SHs with the same burn power level of 1.7 nW and a short burn time of 7 s. The parameters for the subsequent interrogation scan were optimized to obtain a high signal-to-noise ratio. The frequency of the interrogation wave was stepped in 100 Hz increments every 0.5 s. The SH spectra obtained are shown in Fig. 3. The mean FWHM linewidth is kHz. This should be compared to the minimum possible value, the homogeneous linewidth of the SHs, , derived from photon echo decay measurements (Yano et al., 1991; Equall et al., 1994). We note that even for our comparatively low linewidth value, the signal contrast is still appreciable. E.g. for the spectral hole 1 in Fig. 3, it was 15%. Further reduction of the burning laser power and of the interrogation time did not allow obtaining narrower linewidths.
IV Temperature-induced frequency shifts and thermal hysteresis
The temperature-induced shift of the SH center frequency was measured previously by Könz et al. in the range 4 to 320 K for sites 1 and 2, and a discussion of the underlying physics was given (Könz et al., 2003). A precision measurement was performed by Chen et al. (Chen et al., 2011) in the range 3 to 4 K for site 1, and by Thorpe et al. for sites 1 and 2 in the ranges 2.2 - 8.5 K (Thorpe et al., 2011) and 2.5 - 5.5 K (Thorpe et al., 2013). In the present experiment we measured the site 1 shift in the range of 1.15 K to 4.1 K. The determination of the shift at the lower end of this range is challenging, due to its drop-off according to an expected - dependence.The frequency shift upon temperature cycling was studied by (Chen et al., 2011). No effect was observed at the few kHz level. Here we set a more precise upper limit.
IV.1 Procedures
After starting the laser frequency () measurement, 66 SHs were burnt at 1.15 K, spaced by kHz. The burning time was set to 2 s, the laser power to 26 nW. The holeburning procedure had a total duration of about 8 minutes. During the burn phase the laser frequency exhibited a non-linear drift. Its time dependence was therefore fitted by a non-linear function. By this procedure we assigned a center frequency to every SH created at a particular time . The typical uncertainty was Hz.
Over the course of 1 hour, the temperature was increased to 4.1 K in steps of several 0.1 K and afterwards decreased again. After each step, at constant temperature, three so far not interrogated SHs were scanned and the mean of their center frequencies was determined. For this SH spectroscopy, the laser power was reduced by a factor of 10 and the AOM frequency was changed in steps of 100 Hz with a dwell time of 0.7 s. The recorded data were fitted assuming a Lorentzian line shape, determining and introducing an error of about 10 Hz.
The frequency of the laser during the spectroscopy was evaluated at the time instant when the SH center was reached, using a nonlinear fit as above. This resulted in the SH frequency . Its uncertainty arises from and from the error of the FC measurement . Finally, the frequency shift of a SH is We assigned to it the uncertainty . A typical value was 90 Hz.
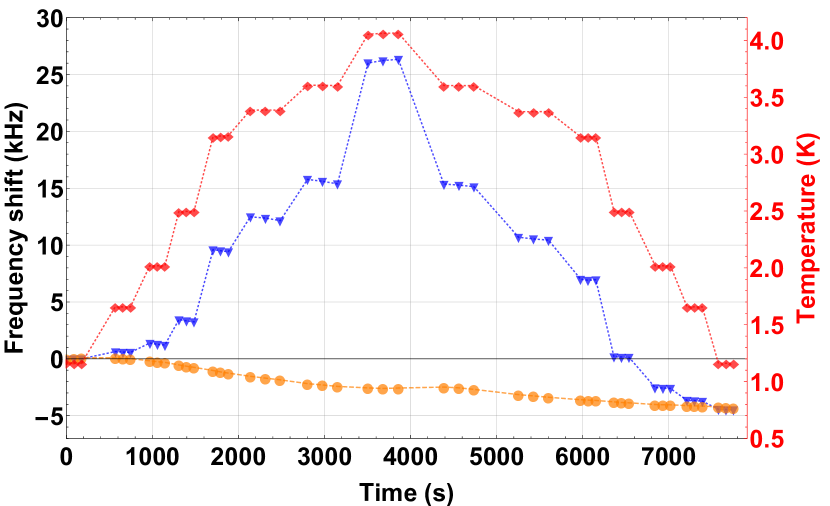
An overview of the recorded (raw) data is presented in Fig. 4. The red line shows the temperature measured at the crystal. The orange line shows explicitly the drift of the frequency-doubled laser frequency . The blue line shows which is the difference of the frequency offsets produced by the AOM at the observation time and at the burning time.
IV.2 Thermal frequency shift
The frequency shift data is sheown as a function of temperatumeasuredre in Fig. 5 (a).A theoretical model of the SH shift predicts a dependence, caused by a two-phonon Raman process affecting the impurity ions (Macfarlane and Shelby, 1987; McCumber and Sturge, 1963; Könz et al., 2003). Our data was therefore fitted with the function . This resulted in an accurate description of the data, and small residuals, see panels (a) and (b) in Fig. 5, with and . Note that because of the small hysteresis (see section IV.3) we take into account the data for both rising and falling temperatures. In the work of (Könz et al., 2003) a value of Hz/ has been found for the temperature induced shift at site 1. However, only values above 70 K were considered in the determination of the coefficient.
Our coefficient also differs from the value (for site 1) measured previously by Thorpe et. al (Thorpe et al., 2013). As shown in that work the application of external pressure on the crystal through helium gas induces a linear frequency shift countering the effect of the temperature induced frequency shift. This could explain the lower coefficient.
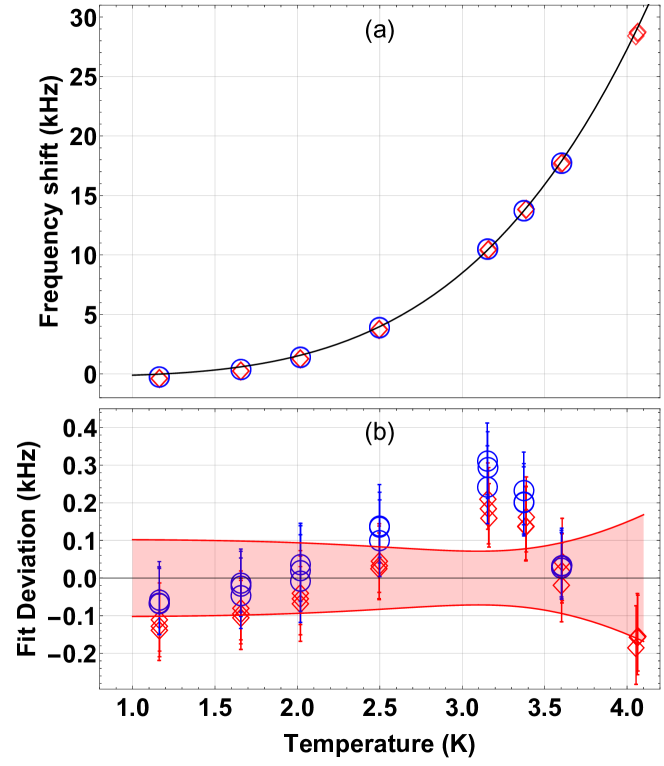
Figure 6 shows the temperature dependence of the SH linewidth. The theoretical model (McCumber and Sturge, 1963; Könz et al., 2003) predicts a dependence of the type . A fit of this function to our data yields .
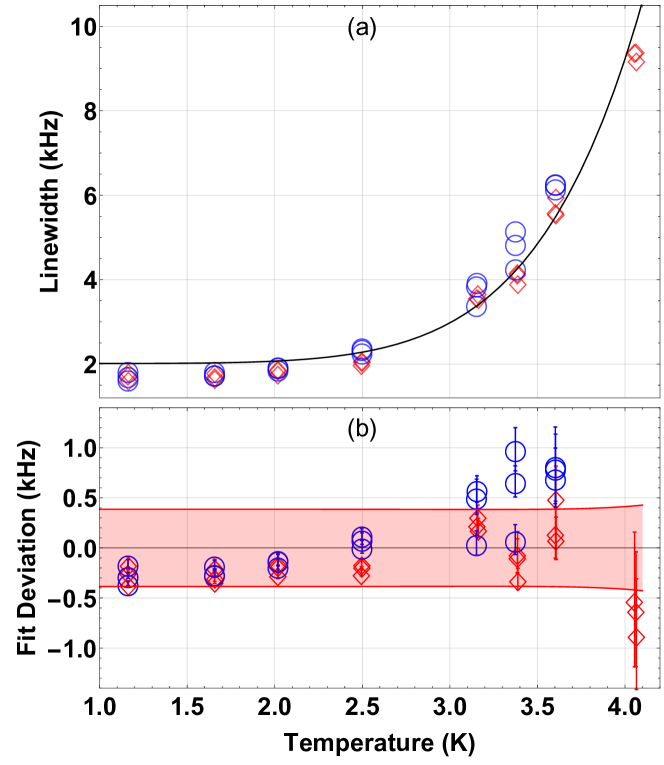
The value differs significantly from the value found by (Könz et al., 2003), . However, this value was obtained from photon-echo-decay measurements. This method differs from our method: the photon-echoes were measured on a timescale of microseconds whereas our measurements where on the timescales of minutes (the typical duration of a frequency scan over a SH linewidth).
IV.3 Thermal hysteresis
In Fig. 4 the AOM-induced frequency shift (blue line) and the independently measured laser frequency drift (orange line) rejoin at the end of the temperature cycle. Correspondingly, the red and blue data point at K in Fig. 4 (b) nearly coincide. This shows that the thermal hysteresis of the SH frequencies is very small. More precisely, the residual shift upon returning to the initial temperature was 59 Hz which is within the measurement error . Relating the sum of and to the maximum frequency shift of 27 kHz at K allows us to state an upper limit of for the fractional hysteresis.
V Long-term frequency drift measurement
V.1 Properties of long-lived spectral holes
In order to probe in a careful way the intrinsic long-term stability of the frequency of persistent SHs, we modified the experimental protocol compared to our previous work (Chen et al., 2011) in two significant aspects: (1) operation at significantly lower temperature, 1.15 K, and (2) not performing multiple read-outs of the same SH. Our procedure consisted in initially burning a sufficiently large “reservoir” of 200 SHs with a frequency spacing kHz. The burning time was set to 2 s with a relatively high laser power of 86 nW. The hole-burning procedure had a total duration of about 15 minutes. For the SH spectroscopy, the laser power was reduced by a factor of 10 and the AOM frequency was changed in steps of 100 Hz with a dwell time of 0.7 s per frequency value.
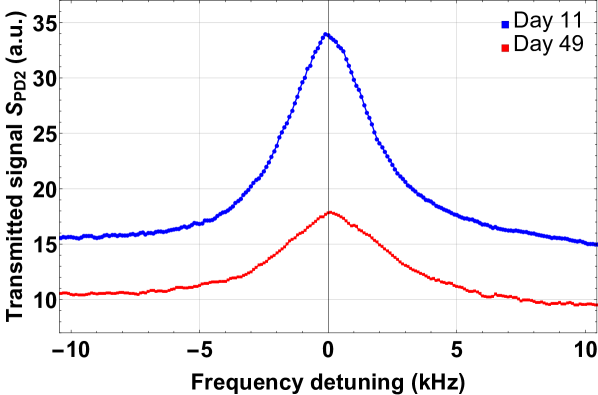
A typical line scan obtained under such conditions is shown in Fig. 7. During the scan the laser frequency was measured by the FC. The determination of the SH frequency shift from , and the measurement errors , and were obtained in the same fashion as described in sec. IV.
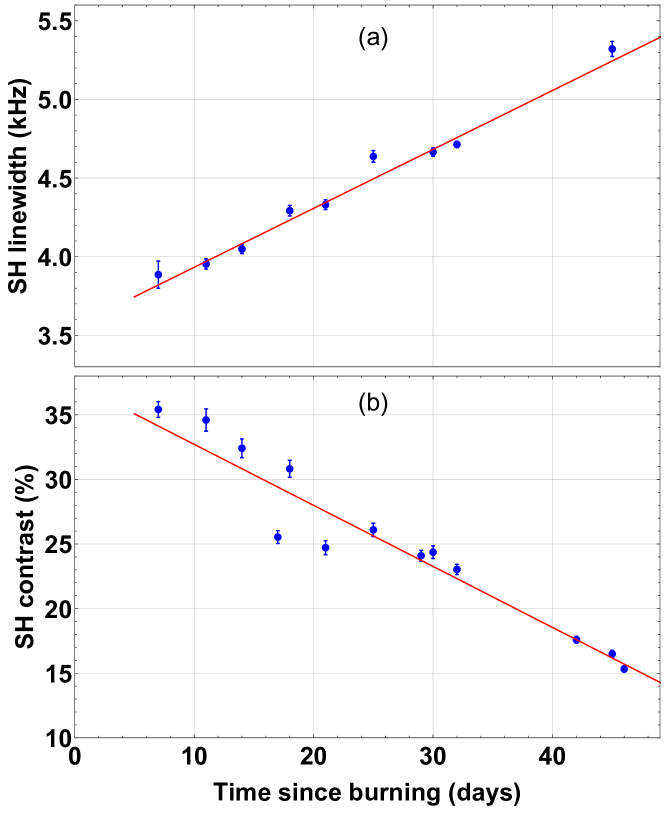
Several times per week, over a period of 49 days, a subset of new (previously not interrogated) SHs was scanned. At the same time, the laser frequency was measured with the FC. 9 shows an example of the result obtained on a particular day. The long-term variation of the SHs linewidths and contrasts are presented in Fig. 8. After 49 days we observed an increase of the linewidth by about 25%. The - SH lifetime, extrapolated from the contrast decrease, is 50 days. This value is consistent with (Könz et al., 2003) who measured a value days at 2 K for site 1.
V.2 Long-term frequency drift
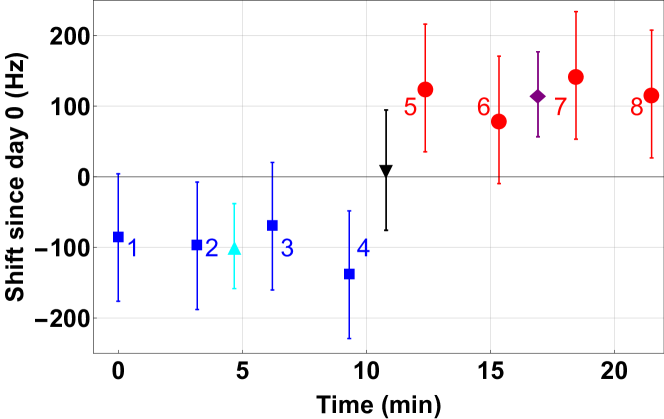
A systematic frequency shift occurs when determining the SH center frequency: the latter depends on the sign of the frequency introduced by the AOM during the line scan. We measured this effect precisely for the above mentioned settings by burning 20 SHs within 2 minutes and scanning them 2 to 18 minutes later. One half of the SHs was scanned by increasing ; the other half was scanned in reverse. We measured a difference of 298(47) Hz between the average center frequencies of the two subsets. Therefore, in our long-term measurements, we determined the frequency shifts as follows. At a particular (nominal) time , we measured, within approximately half an hour, the mean SH center frequency of a set of at least 4 SHs scanned with rising AOM frequency and the mean frequency of another set of at least 4 SHs with falling frequency. The average frequency shift of the SHs at time is the mean of and . An example of such a determination is shown in Fig. 9.
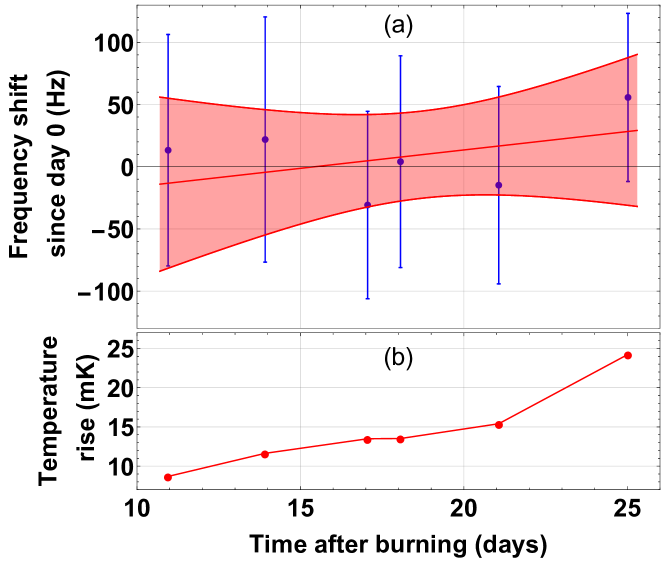
The complete measurement lasting two weeks is shown in Fig. 10. A linear fit of the data shows a fractional SH frequency drift of , where the uncertainty is statistical. The drift rate is consistent with zero.
The statistical uncertainty originates from the three contributions already discussed in Sec. IV.1, which resulted in Hz for an individual measurement .
A systematic effect is a frequency shift due to long-term temperature drift. The temperature increased monotonically by 30 mK during the measurement period, see Fig. 10 (b). Taking into account the measured temperature sensitivity (see Sec. IV) the resulting total SH frequency shift is 10 Hz, which is not negligible. Therefore, the data shown in Fig. 10 (a) was corrected for the respective calculated thermal shift.
A further possible systematic error is a drift of our frequency reference, the hydrogen maser. A comparison of its frequency with the 1 PPS signal received from GPS showed that the maser frequency drift during the measurement period was on the order of , and can thus be neglected
VI Summary and Conclusion
We measured with high frequency resolution and high accuracy the linewidth, the long-term frequency drift and the temperature-induced frequency shift and line broadening of persistent spectral holes in Eu3+:Y2SiO5 at a temperature significantly lower than previously, 1.15 K. Our measurements demonstrated a significant increase of the spectral hole’s lifetime in comparison to results at 3 - 4 K (Chen et al., 2011; Cook et al., 2015), confirming the estimations (Könz et al., 2003). We determined the properties of spectral holes as long as 49 days after burning and found that even at that “age”, the holes still exhibited good signal-to-noise ratio and a reasonably small linewidth (5.4 kHz), if previously left undisturbed. No long-term drift of the spectral holes center frequencies over 14 days could be observed, with an upper limit of . This is 65 times smaller than the upper limit measured in a previous experiment at 3 K, (Chen et al., 2011). For comparison, cryogenic silicon cavities with drifts as small as to have been reported (Hagemann et al., 2014; Wiens et al., 2016). We expect that it is feasible to reduce the uncertainty of the spectral hole drift by increasing the observation time interval, which in our case was limited because of cryostat performance. A measurement of the temperature-induced hole line shift over the range 1.2 K - 4.1 K accurately confirmed the predicted variation with the fourth power of the temperature. No hysteresis in the hole frequency was found within the measurement error after heating the crystal from 1.15 K to 4.1 K and cooling back to 1.15 K.
The long-term properties of spectral holes in this particular system do appear to make it suitable as a long-term-stable frequency reference. In particular, it is favorable that at 1.15 K the temperature sensitivity is only fractionally. This is comparable to the lowest values achieved with cryogenic silicon cavities (Wiens et al., 2016). If required for achieving the most demanding performance, an active temperature stabilization of a YSO crystal to the K level could be implemented (Chen et al., 2011) and this could reduce the effects of temperature instability to the -level.
The SH linewidth observed in this work is also comparable to that of silicon cavities (Wiens et al., 2016). The signal-to-noise ratio of the spectral hole signals is, of course, significantly lower than for a cavity. It could be increased e.g. by using longer crystals, interrogating several crystals in parallel, and increasing the europium concentration.
Acknowledgments
The authors thank D. Iwaschko for his technical assistance. R.O. acknowledges a fellowship from the Prof.-W.-Behmenburg-Schenkung. This work was performed in the framework of project Schi 431/15-1 of the Deutsche Forschungsgemeinschaft.
References
- Derevianko and Katori (2011) A. Derevianko and H. Katori, Rev. Mod. Phys. 83, 331 (2011).
- Poli et al. (2013) N. Poli, C. W. Oates, P. Gill, and G. M. Tino, Rivista del Nuovo Cimento 36, 555 (2013).
- Ludlow et al. (2015) A. D. Ludlow, M. M. Boyd, J. Ye, E. Peik, and P. O. Schmidt, Rev. Mod. Phys. 87, 637 (2015).
- Hong (2017) F.-L. Hong, Measurement Science and Technology 28, 012002 (2017).
- Kessler et al. (2012) T. Kessler, C. Hagemann, C. Grebing, T. Legero, U. Sterr, F. Riehle, M. J. Martin, L. Chen, and J. Ye, Nat. Photonics 6, 687 (2012).
- Häfner et al. (2015) S. Häfner, S. Falke, C. Grebing, S. Vogt, T. Legero, M. Merimaa, C. Lisdat, and U. Sterr, Opt. Lett. 40, 2112 (2015).
- Matei et al. (2017) D. G. Matei, T. Legero, S. Häfner, C. Grebing, R. Weyrich, W. Zhang, L. Sonderhouse, J. M. Robinson, J. Ye, F. Riehle, et al., Phys. Rev. Lett. 118, 263202 (2017).
- Meiser et al. (2009) D. Meiser, J. Ye, D. R. Carlson, and M. J. Holland, Phys. Rev. Lett. 102, 163601 (2009).
- Macfarlane and Shelby (1987) R. M. Macfarlane and R. M. Shelby (North-Holland, Amsterdam, 1987), chap. Coherent transient and hole-burning spectroscopy of rare earth ions in solids, ISBN 9780444598271.
- Sellars et al. (1994) M. J. Sellars, R. S. Meltzer, P. T. H. Fisk, and N. B. Manson, J. Opt. Soc. Am. B 11, 1468 (1994).
- Sellin et al. (1999) P. B. Sellin, N. M. Strickland, J. L. Carlsten, and R. L. Cone, Opt. Lett. 24, 1038 (1999).
- Sellin et al. (2001) P. B. Sellin, N. M. Strickland, T. Böttger, J. L. Carlsten, and R. L. Cone, Phys. Rev. B 63, 155111 (2001).
- Pryde et al. (2002) G. J. Pryde, T. Böttger, R. L. Cone, and R. C. C. Ward, J. Lumin. 98, 309 (2002).
- Julsgaard et al. (2007) B. Julsgaard, A. Walther, S. Kröll, and L. Rippe, Opt. Express 15, 11444 (2007).
- Thorpe et al. (2011) M. Thorpe, L. Rippe, T. Fortier, M. Kirchner, and T. Rosenband, Nat. Photonics 5, 688 (2011).
- Cook et al. (2015) S. Cook, T. Rosenband, and D.R. Leibrandt, Phys. Rev. Lett. 114, 253902 (2015).
- Gobron et al. (2017) O. Gobron, K. Jung, N. Galland, K. Predehl, R. L. Targat, A. Ferrier, P. Goldner, S. Seidelin, and Y. L. Coq, Opt. Express 25, 15539 (2017).
- Thorpe et al. (2013) M. J. Thorpe, D. R. Leibrandt, and T. Rosenband, New J. Phys. 15, 033006 (2013).
- Chen et al. (2011) Q.-F. Chen, A. Troshyn, I. Ernsting, S. Kayser, S. Vasilyev, A. Nevsky, and S. Schiller, Phys. Rev. Lett. 107, 223202 (2011).
- Leibrandt et al. (2013) D. R. Leibrandt, M. J. Thorpe, C.-W. Chou, T. M. Fortier, S. A. Diddams, and T. Rosenband, Phys. Rev. Lett. 111, 237402 (2013).
- Vogt et al. (2011) S. Vogt, C. Lisdat, T. Legero, U. Sterr, I. Ernsting, A. Nevsky, and S. Schiller, Appl. Phys. B 104, 741 (2011).
- Yano et al. (1991) R. Yano, M. Mitsunaga, and N. Uesugi, Opt. Lett. 16, 1884 (1991).
- Equall et al. (1994) R. W. Equall, Y. Sun, R. L. Cone, and R. M. Macfarlane, Phys. Rev. Lett. 72, 2179 (1994).
- Könz et al. (2003) F. Könz, Y. Sun, C. W. Thiel, R. L. Cone, R. W. Equall, R. L. Hutcheson, and R. M. Macfarlane, Phys. Rev. B 68, 085109 (2003).
- McCumber and Sturge (1963) D. E. McCumber and M. D. Sturge, J. Appl. Phys. 34, 1682 (1963).
- Hagemann et al. (2014) C. Hagemann, C. Grebing, C. Lisdat, S. Falke, T. Legero, U. Sterr, F. Riehle, M. J. Martin, and J. Ye, Opt. Lett. 39, 5102 (2014).
- Wiens et al. (2016) E. Wiens, A. Y. Nevsky, and S. Schiller, Phys. Rev. Lett. 117, 271102 (2016).