High-pressure CaF2 revisited: a new high-temperature phase and the role of phonons in the search for superionic conductivity
Abstract
We recently proposed a high-pressure and high-temperature -symmetry polymorph for CaF2 on the basis of ab initio random structure searching and density-functional theory calculations [Phys. Rev. B 95, 054118 (2017)]. We revisit this polymorph using both ab initio and classical molecular dynamics simulations. The structure undergoes a phase transition to a superionic phase in which calcium ions lie on a bcc-symmetry lattice (space group ), a phase not previously discussed for the group-II difluorides. We demonstrate that modelling this phase transition is surprisingly difficult, and requires very large simulation cells (at least 864 atoms) in order to observe correct qualitative and quantitative behaviour. The prediction of superionic behaviour in -CaF2 was originally made through the observation of a lattice instability at the harmonic level in DFT calculations. Using superionic -CaF2, CeO2, -PbF2 and Li2O as examples, we examine the potential of using phonons as a means to search for superionic materials, and propose that this offers an affordable way to do so.
I Introduction
Calcium difluoride (CaF2) has several technological applications, and as a result its electronic structure and properties have been widely studied Burnett_PRB_2001 ; Rubloff_PRB_1972 ; Shi_PRB_2005 ; Wu_PRB_2006 ; Nelson_PRB_2017 ; Nakamura_CI_2017 ; Boulfelfel_PRB_2006 ; Kalita_PRL_2017 ; Dorfman_PRB_2010 . Under ambient conditions, CaF2 adopts the cubic fluorite structure (-CaF2) with space group . This polymorph of CaF2 has a number of interesting optical properties, such as intrinsic birefringence Burnett_PRB_2001 and a wide direct band-gap at of 12.1 eV Rubloff_PRB_1972 ; Shi_PRB_2005 . The optical gap in -CaF2 is calculated to increase with pressure Wu_PRB_2006 ; Nelson_PRB_2017 . -CaF2 and doped variations thereof show good transmittance over a wide range of wavelengths Nakamura_CI_2017 , making it an ideal material for optical systems. At high temperatures, -CaF2 undergoes a superionic phase transition at K at ambient pressure, forming -CaF2, with F- ions as the diffusing species Boyer_PRL_1980 . -CaF2 is not alone in this regard; superionic phase transitions are ubiquitous in materials with the fluorite structure, such as PbF2, SrCl2, BaF2, CeO2 and Li2O Hull_PRB_1998 ; Oberschmidt_PRB_1980 ; Schmalzl_PRB_2007 ; Buckeridge_Ceria_2013 ; Gupta_PRB_2012 .
At high pressures, -CaF2 undergoes a phase transition to the denser, orthorhombic cotunnite phase (-CaF2 space group ) at around 9 GPa Kalita_PRL_2017 , and a further transition to a hexagonal -symmetry phase at 72 GPa Dorfman_PRB_2010 . Experimental data on high- CaF2 is scarcer. Currently available data suggests a high- modification of -CaF2 Mirwald_JPCS_1980 ; Cazorla_PRL_2014 (see also Ref. Mirwald_JPCS_1978 ), however, these data have not yet structurally characterized this phase. Theoretical work has proposed that -CaF2 melts directly at high temperature Zhao-Yi_CPL_2008 , becomes superionic at high temperature (in the same structure) Cazorla_JPCC_2013 , or undergoes a phase transition to another solid phase which then becomes superionic Cazorla_PRL_2014 . Our recent study proposed a -symmetry CaF2 structure as a high- modification of -CaF2 Nelson_PRB_2017 (Fig. 1). This conclusion was reached through structure prediction calculations Pickard_PRL_2006 ; AIRSS ; APL_AIRSS , treating thermodynamics within the quasiharmonic approximation. -CaF2 has the Fe2P structure and is a known high- polymorph of BaCl2 and BaI2 BaCl2_P62m ; BaI2_P62m ; this structure has also been observed in other AB2 compounds at high pressure such as TiO2 Dekura_PRL_2011 and ZrO2 Nishio_PCM_2015 . Whether -CaF2 is a feasible candidate polymorph for high pressure and temperature CaF2 has been recently debated Cazorla_JPCC_2018 ; Cazorla_Comment_2018 ; Nelson_Reply_2018 .
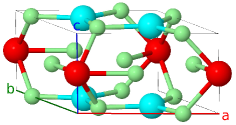
It was also proposed in Ref. Nelson_PRB_2017 that an unstable phonon mode could drive a superionic phase transition in -CaF2 (Fig. 1). This idea that certain lattice instabilities could trigger a superionic phase transition was discussed by Boyer for -CaF2 and the - transition Boyer_PRL_1980 , and has been used to infer superionic behaviour in a number of materials Boyer_Ferro_1981 ; Buckeridge_Ceria_2013 .
In this paper, we revisit the proposed -CaF2 structure and explore its high- behaviour through ab-initio molecular dynamics (AIMD) simulations. We discuss our methods first in Sec. II, before moving on to our results in Sec. III. In Sec. IV, we discuss our results, and we also examine links between phonon frequencies and superionic conductivity. Finally, we report our conclusions in Sec. V.
II Methods
AIMD simulations in this paper use the cp2k code CP2K and density-functional theory (DFT) with the PBE exchange-correlation functional PBE1996 . Goedecker-Teter-Hutter (GTH) pseudopotentials are used for Ca and F, which treat 10 and 7 electrons as valence, respectively GTH_pseudos_1 ; GTH_pseudos_2 ; GTH_pseudos_3 . These are used in conjunction with DZVP ‘MOLOPT’ Gaussian basis sets MOLOPT . The -point is used for Brillouin-zone integration in all AIMD simulations. Simulation cells containing 864 atoms are used in all cases; the reason for this choice of cell size is discussed further in Sec. III.1. When compared against larger TZV2P basis sets, the DZVP basis sets we use deliver energy differences accurate to 4 meV/CaF2, and the relative average absolute difference in forces and pressures is less than 5% for the two basis sets.
AIMD simulations in the canonical (NVT) ensemble use Nosé-Hoover thermostats with a time constant of 100 fs. In these simulations, all lattice parameters are fixed. AIMD simulations in the constant-stress NPT ensemble use the same thermostat time constant and a barostat time constant of 2000 fs, and allow variation of all lattice parameters (,,,,,). Pressure is applied hydrostatically to the simulation cell. A timestep of 1 fs is used throughout.
Classical molecular dynamics simulations use the lammps code LAMMPS alongside the same thermo- and barostat time constants given above. Pair potentials used in these simulations are of the Buckingham type and are taken from Refs. Faraji_PRB_2017 for CaF2, and Oda_JNM_2007 for Li2O.
Phonon frequency calculations use the castep plane-wave code and density-functional perturbation theory CASTEP ; DFPT , in conjunction with norm-conserving pseudopotentials generated by the castep code’s inbuilt ‘NCP17’ pseudopotential library. Phonon frequency calculations using pair potentials are performed with the GULP code GULP .
III Results
A stability field for -CaF2 was proposed at temperatures above 1500-2000 K and at pressures larger than about 10 GPa, on the basis of calculations using the quasiharmonic approximation Nelson_PRB_2017 . This section examines the behaviour of -CaF2 at 20 GPa and in the temperature range 2500-3000 K.
III.1 Preliminaries
The thermodynamic conditions 2500 K and 20 GPa lie within the stability field suggested for -CaF2, but not in the region where this structure is predicted to develop a phonon instability according to Ref. Nelson_PRB_2017 .
Prior to commencing our AIMD calculations, we use classical molecular dynamics to investigate the simulation cell size needed to obtain converged results, as suggested in Ref. Mulliner_PCCP_2015 . Here, and in what follows, we use an orthorhombic setting (with ) of the hexagonal unit cell of -CaF2 (which has - see Fig. 1). Convergence is judged by examining both the qualitative and quantitative behaviour of the mean-squared displacement (MSD) of Ca and F ions in -CaF2 as a function of the number of atoms, , in the simulation cell. The MSD of a particular set of ions is calculated using:
| (1) |
where is the position of ion in the set at time , is the center-of-mass of the set of ions at time , and the sum over runs over all ions in the set, of which there are in total. Time-windowed averaging is not performed.
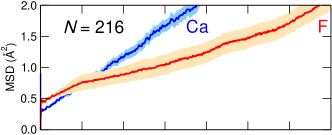
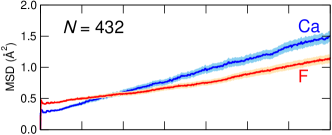
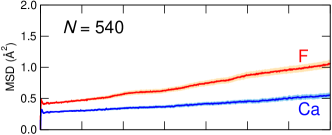
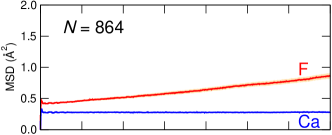
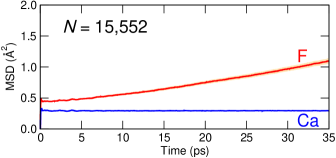
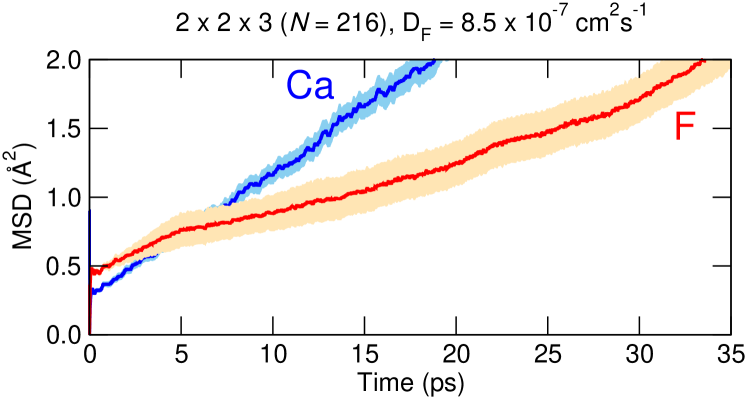
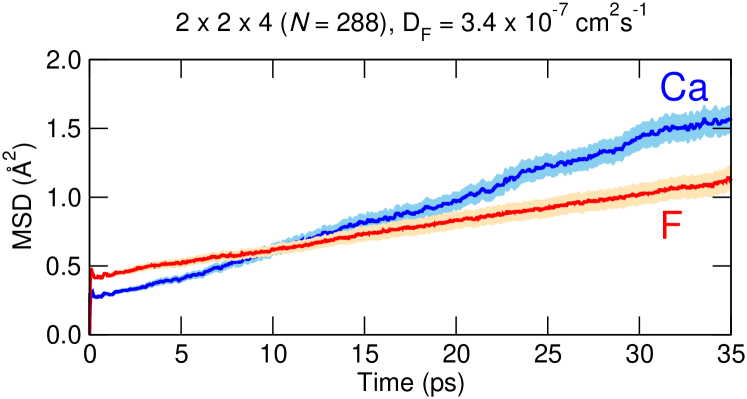
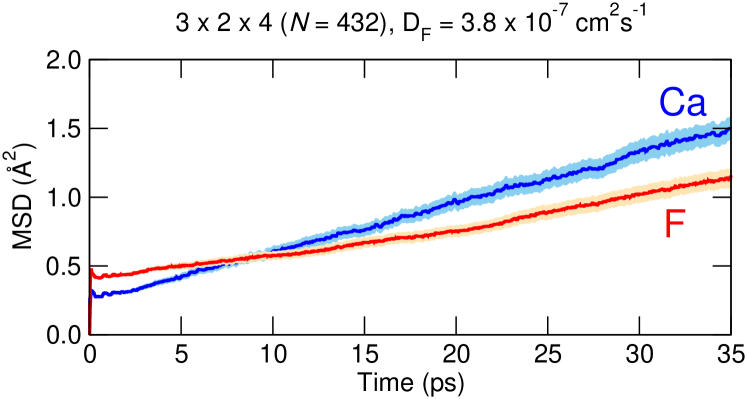
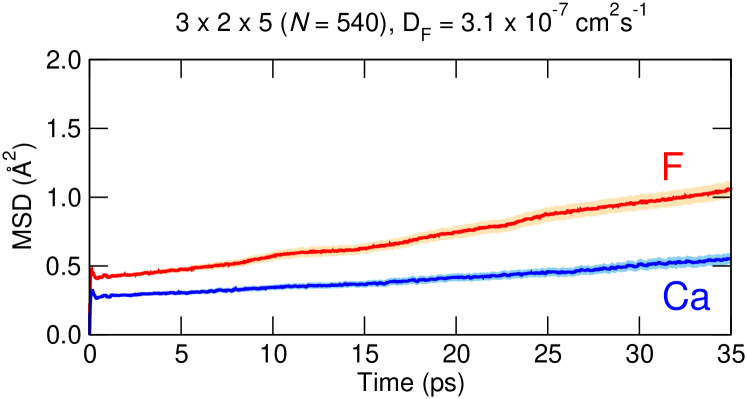
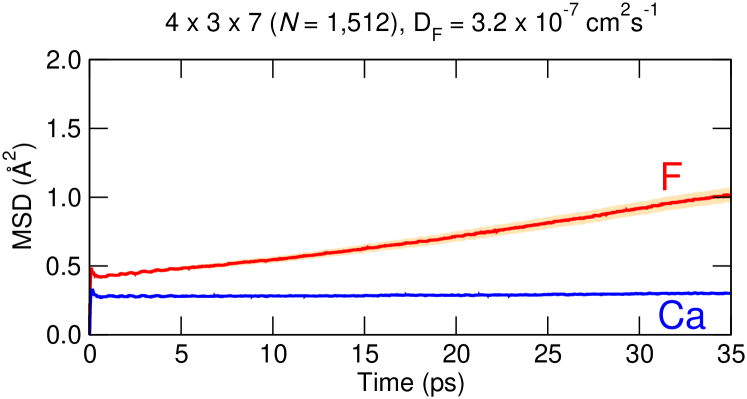
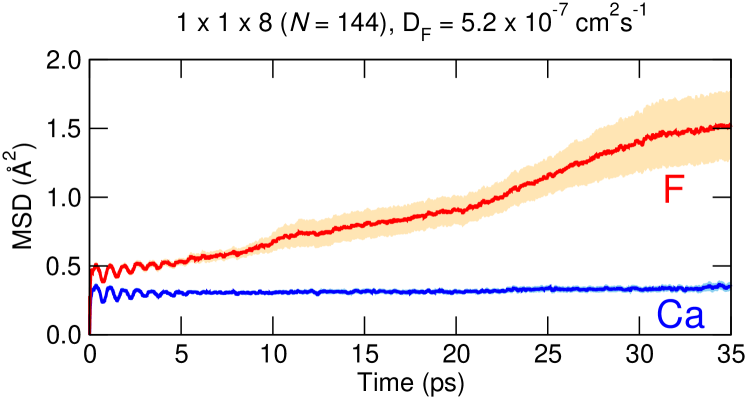
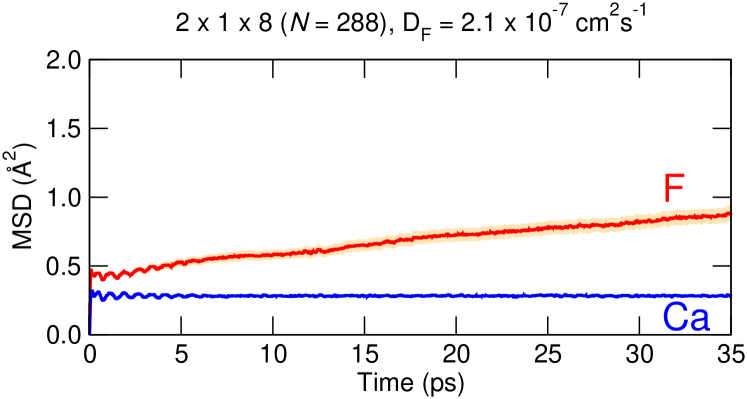
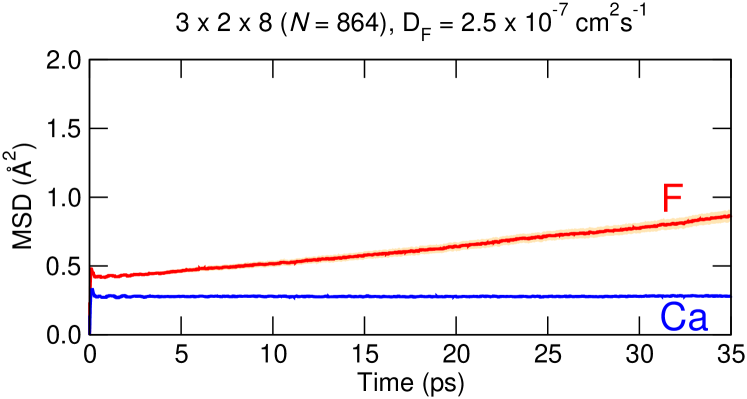
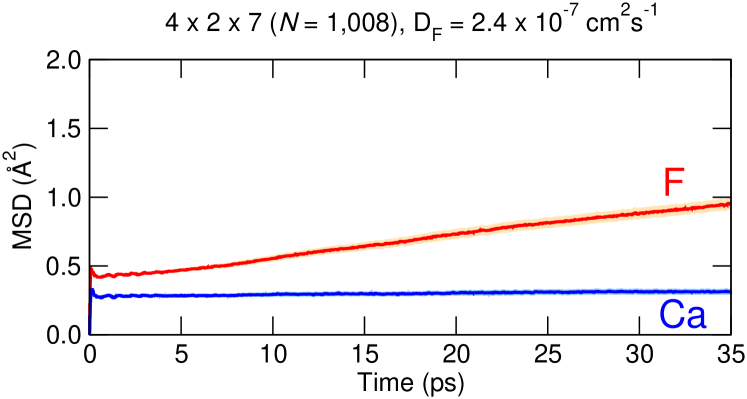
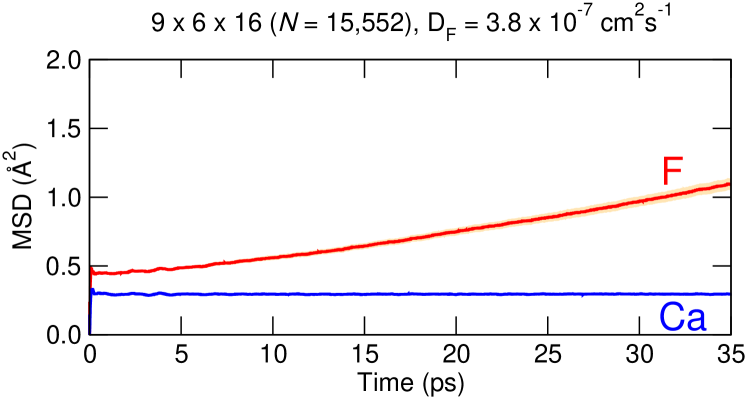
Fig. 2 shows the MSD of Ca and F ions in -CaF2 at 2500 K and 20 GPa as a function of cell size . Supercells are constructed to be very roughly cubic for a given . Uncertainties in the MSD, as indicated by the light-blue and orange shaded regions in Fig. 2, are obtained by averaging over 100 trajectories with different initial velocities (=216, 432, 540 and 864), or 20 trajectories (=15,552). The results shown in Fig. 2 were obtained in the NVT ensemble; cell sizes for these simulations were obtained by first evolving a cell with =15,552 in the NPT ensemble and then averaging the corresponding lattice parameters over time.
The results depicted in Fig. 2 show that the convergence of the MSD curves with respect to simulation cell size is slow, and surprisingly large simulation cells are required to see correct qualitative behaviour. At small cell sizes (=216), we observe significant Ca diffusion; we have also observed such behaviour in AIMD simulations at this cell size Nelson_Reply_2018 . There is a significant qualitative change in the MSD curves in going from =432 to =540: for cells containing fewer than 432 atoms, Ca ions exhibit a greater diffusivity than F ions (as inferred from the slope of the MSD curves), whereas cells with more than 540 atoms show the opposite behaviour. Referring to Fig. 2, we find that the MSD curves are not qualitatively converged (as judged against =15,552) until there are at least 864 atoms in the simulation cell.
The diffusion behaviour of Ca in the -direction is slowest to converge, and the most important factor in obtaining correct qualitative behaviour is the use of a simulation cell with a long -axis. Rather than using approximately cubic cells, we can also obtain correct qualitative behaviour using a cell which is very elongated in the -direction but uses fewer than 864 atoms, such as for the ‘’ cell given in the Supplemental Material ESI . However, when using such a cell, we find that the fluorine diffusion coefficient is underestimated by 45% compared to the =15,552 cell shown in Fig. 2. Better quantitative agreement is obviously obtained when going to larger cells, but we again find quite slow convergence. For our AIMD simulations in the next section, we elect to work with the =864 cell depicted in Fig. 2. This size of cell shows correct qualitative behaviour in the MSD of Ca and F, though it still underestimates the fluorine diffusion coefficient by 33% when compared against =15,552. The 864-atom cell is a 328 supercell of the aforementioned orthorhombic unit cell. This also means that it is commensurate with the Brillouin zone -point Monserrat_nondiag , where a phonon instability was previously reported at sufficiently large volumes Nelson_PRB_2017 (see also Fig. 1). Further MSD curves for other sizes of simulation cell can be found in the Supplemental Material ESI .
III.2 AIMD results
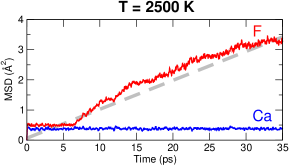
T = 2500 K. Fig. 3 gives the results of an 864-atom AIMD simulation on -CaF2 at 2500 K and 20 GPa, carried out in the NVT ensemble. As was the case for our classical MD simulations, the cell size was calculated by first evolving the system in the NPT ensemble. The results agree qualitatively with those obtained from classical MD simulations (Fig. 2) at the same cell size (=864), however the diffusivity of F ions is about 8 times larger in the AIMD simulation compared to the classical MD simulation. At this temperature and pressure, -CaF2 exhibits appreciable ionic conductivity, with F ions as the diffusing species. The diffusion coefficient for F is cm2s-1, per the slope of the F MSD curve (thick dashed line in Fig. 3). Assuming the applicability of the Nernst-Einstein equation Annamareddy_SciRep_2017 , the corresponding ionic conductivity is . No diffusion of Ca ions is observed at this temperature and pressure. Averaging the positions of Ca ions over the period shown in Fig. 3, and analysing the symmetry of the resulting structure using the c2x code c2x shows that Ca atoms retain their original positions in the structure. The symmetry of the Ca sublattice alone is . We do not observe any structural phase transitions in -CaF2 at 2500 K and 20 GPa, either in the NVT simulation shown in Fig. 3, or in the 20 ps long NPT trajectory used to obtain the cell size for the simulation shown in Fig. 3.
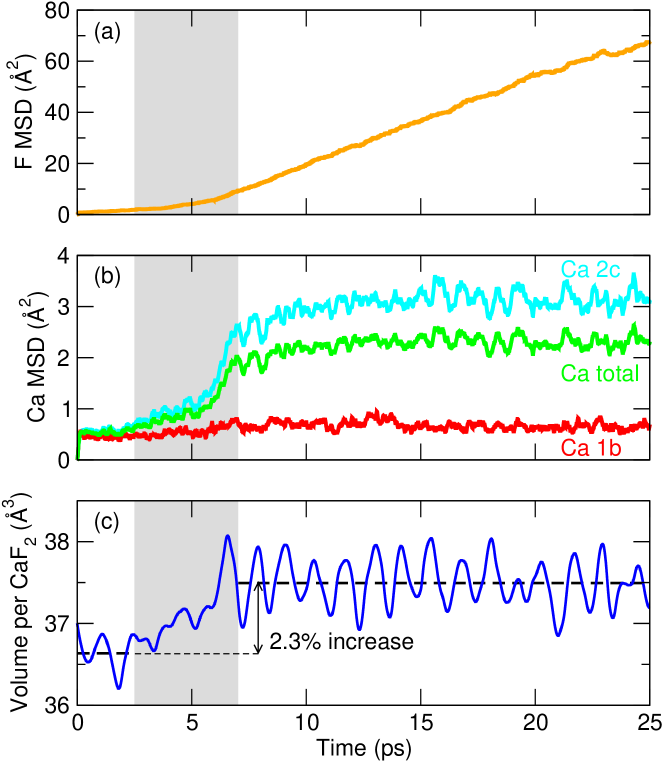
T = 2650 K. A set of equilibrated atom positions and velocities are taken from the trajectory shown in Fig. 3, and are evolved in the NPT ensemble at 2650 K and 20 GPa. Figs. 4(a)-(f) show the MSD of F and Ca, the volume, and the lattice parameters of the cell as a function of simulation time.
In the NPT ensemble, the atomic positions in Eq. (1) are affected by cell dilations. These show up as slow undulations in the calculated MSDs. To compensate for this, the initial positions are scaled using the lattice vectors at via , where , and are the lattice vectors at time , and . is then used in place of in Eq. (1) when the MSD is calculated. The initial centre-of-mass position is similarly scaled. This procedure aids in distinguishing genuine atomic motion from that due to cell dilations.
After a short period (2.5 ps), the cell volume increases and then re-stabilises at around the 7 ps mark. The overall volume increase is 2.3% (Fig. 4(c)), and occurs primarily as expansion in the -direction of the cell (3.4%) accompanied by a small contraction of the - and -axes (Fig. 4(d)). The hexagonal ratio between the and axes, , is unchanged (Fig. 4(e)). The cell remains numerically orthorhombic over the entire trajectory shown in Fig. 4, with , and .
The change in volume is indicative of a phase transition between 2.5 and 7.0 ps, and this time interval is indicated by the grey shaded regions in Fig. 4. Post volume-expansion, there is a significant increase in F diffusivity (Fig. 4(a)). Calcium ions on the Wyckoff sites in -CaF2 retain their relative positions, while those on the sites acquire a permanent displacement away from their initial positions (Fig. 4(b)). There is a period, post-volume expansion, lasting from 7.0 ps to around 15.0 ps in which the MSD curve for Ca ions on the site shows a slow increase before fully stabilising.
These results are suggestive of a structural rearrangement in the calcium sublattice, which is accompanied by a large increase in fluorine diffusion. Averaging the calcium ion positions and lattice parameters from 15.0 ps onward in the trajectory shown in Fig. 4 and analysing the symmetry of the resulting structure c2x , we find that the calcium ion sublattice is bcc (space group ).
To summarise, at 2650 K and 20 GPa, we observe a phase transition in -CaF2 in which the calcium sublattice becomes bcc and the fluorine ions display superionic conductivity. The structural changes and sudden increase in ionic conductivity are characteristic of a type-I (abrupt) superionic transition. The bcc superionic state we observe here is reasonably well known in AB2 compounds: examples include the silver chalcogenides -Ag2S and -Ag2Se Grier_PRB_1984 ; Kirchoff_PRB_1996 , and such a state is predicted for high-pressure and high-temperature H2O Wilson_PRL_2013 ; Hernandez_PRL_2016 ; however, we are not aware of any previous reports of such a phase in the group-II dihalides. A bcc superionic state has been reported in (PbF2)1-x(KF)x for Hull_PbF2KF , with fluorine diffusing, though the cation:anion ratio in this case is 1:1.667 as opposed to 1:2 in CaF2. Finally, we remark that this transition () can be observed in classical MD simulations, using the same interaction potentials as in Fig. 2.
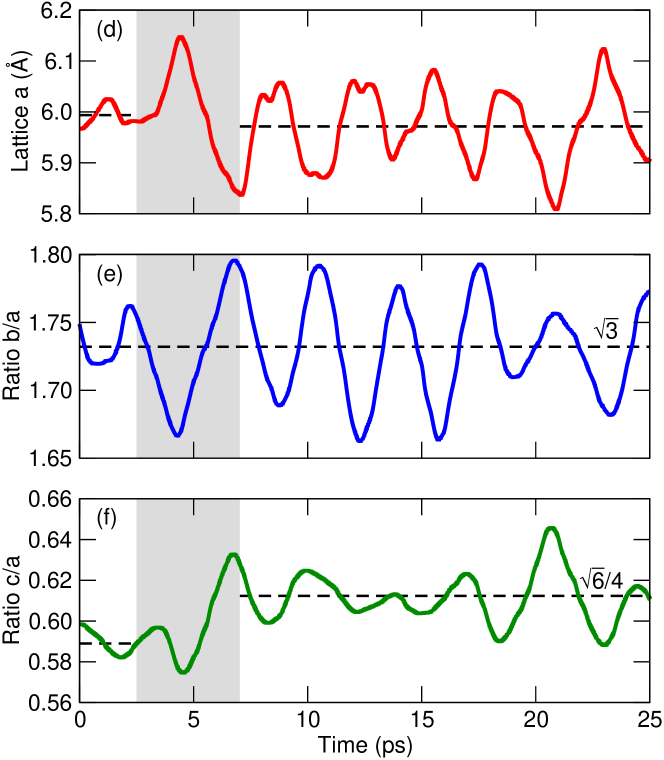
Fig. 5 shows schematically how the calcium sublattice changes during the transition. Calcium ions on Wyckoff sites in -CaF2 (red circles in Fig. 5) retain their relative positions, while those on sites (blue circles in Fig. 5) are displaced from their initial positions. The net effect of the transition is that these ions end up on new positions indicated by grey-dashed circles in Fig. 5(b). Accompanying this displacement is an expansion along the -axis. Fig. 5(c) shows, using blue-dashed lines, the bcc unit cell. To be consistent with cubic symmetry, we would expect the orthorhombically-set cell (black dashed lines in Fig. 5(c)) to have and , which is what we observe in Figs. 4(e) and (f).
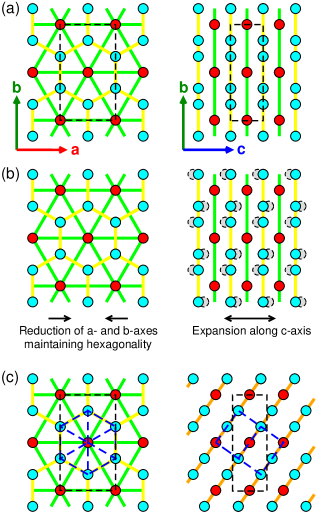
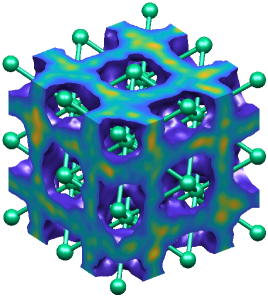
T = 3000 K. We also carry out an AIMD simulation in the NVT ensemble for -CaF2 at 3000 K. The cubic lattice parameter is adjusted so that the pressure is near 20 GPa. Fig. 6 gives the MSD of calcium and fluorine from this simulation. The calcium sublattice remains intact, while the diffusion coefficient for F is cm2s-1 (c.f. cm2s-1 at 2500 K), corresponding to a Nernst-Einstein conductivity of (c.f. at 2500 K). Fig. 7 shows the fluorine density isosurface at this temperature and pressure, drawn at the density isovalue 0.052 Å-3, which corresponds to the mean fluorine density. Heatmaps are shown in the (100), (010) and (001) planes, with yellow corresponding to the highest density. As is fairly typical for AB2-bcc superionic conductors, we see an accumulation of density (yellow regions in Fig. 7) on the tetrahedral and octahedral sites of the immobile sublattice (here calcium).
IV Discussion
IV.1 AIMD results
The results presented in Sec. III show a high-temperature and high-pressure bcc superionic state in CaF2 (-CaF2) formed from a -symmetry polymorph at high temperature. This transition was first predicted in Ref. Nelson_PRB_2017 by attributing the onset of a phonon instability at the Brillouin zone point (Fig. 1) to a superionic phase transition; molecular dynamics simulations were not carried out. The AIMD simulations in the present study indicate that the transition is both structural and superionic, as it involves a structural rearrangement of the calcium sublattice, as well as the onset of high fluorine diffusivity.
We suggested previously that -CaF2 would be stabilised over -CaF2 at high temperatures, on the basis of calculations of the - Gibbs free energy difference in the QHA Nelson_PRB_2017 . Combining this with the results of the present work, we anticipate the series of phase transitions (cotunnite) superionic with increasing temperature, in high-pressure CaF2. The free energy differences between -CaF2 and -CaF2 are small less than 10 meV/CaF2, even at high temperature Nelson_PRB_2017 . Examples of the cotunnite transition in other materials, such as in ZrO2 where the transition is pressure-induced Nishio_PCM_2015 , report similarly small energy differences and suggest that this results in slow kinetics for the transition, giving rise to a reasonably wide coexistence window for both polymorphs (cotunnite and ). Such a scenario is possible in CaF2.
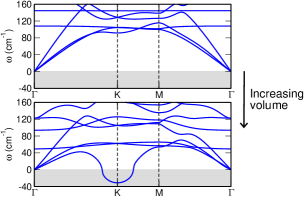
The evidence connecting the -point phonon instability (Fig. 1) to the superionic phase transition seen in Fig. 4 is that the soft mode eigenvector at involves displacements of all F and Ca ions only, and leaves stationary Ca ions on sites Nelson_PRB_2017 , which is a feature shared by the phase transition (Fig. 5). This is also the case for some of the low-energy (but not soft) phonon modes appearing around 62 cm-1 at K in Fig. 1, which show little dispersion along the --- path, and leave -Ca ions stationary along significant portions of this path. In light of this, the superionic phase transition may also involve one of these modes, or a combination of the modes discussed here. It is perhaps more conservative to postulate that these phonon modes drive the observed structural phase transition in -CaF2 (to -CaF2), but may not be involved in ion mobility, as some of the phonon modes to be discussed in Sec. IV.2 are.
Under PBE exchange-correlation, the mode is not found to be completely soft at the superionic transition volume: at 20 GPa, the transition occurs at a volume of 1.12, while full mode softening is seen at 1.17 Nelson_PRB_2017 , where is the static-lattice volume of -CaF2 at 20 GPa. This is not necessarily surprising, given that the - transition is first-order: if there is a soft mode driving this transition, its frequency need not vanish at exactly the transition temperature VENKATARAMAN_1979 ; Binder .
The AIMD results in Sec. III.2 differ substantially from AIMD simulations on -CaF2 carried out by previous authors Cazorla_JPCC_2018 ; Cazorla_Comment_2018 , where calcium (as opposed to fluorine) diffusion was reported at 20 GPa and 2500 K, and a melt state for -CaF2 was reported at 20 GPa and 3000 K. However, it is clear from the results given in Sec. III.1 that this is because the AIMD simulations in Refs. Cazorla_JPCC_2018 ; Cazorla_Comment_2018 used simulation cells that were not appropriately sized.
IV.2 Phonons and superionicity in fluorite-structured ionic conductors
As raised in Sec. I, Boyer Boyer_PRL_1980 connected a phonon instability at the Brillouin zone point in fluorite-structured -CaF2 to the superionic - transition. The soft phonon mode in this case is optical and has mode symmetry. Buckeridge et al. Buckeridge_Ceria_2013 have, in addition to the mode, shown a softening of the mode at in isostructural ceria (CeO2). We find it instructive to revisit a few more examples of this phenomenon. In Fig. 8, we plot the calculated frequencies of the phonon mode at for -CaF2, CeO2, and Li2O, and the frequency of the mode for PbF2, for three common exchange correlation functionals: LDA, PBE, and PBEsol LDA_1 ; LDA_2 ; PBE1996 ; PBESOL , and also give results for a pair potential for Li2O fitted to bulk properties (‘FIT-EMP’; Ref. Oda_JNM_2007 ). The choice of mode ( or ) for each compound corresponds to the mode which first softens at increasing volume, though as -PbF2 demonstrates, both eventually soften at high enough volumes. The reader can also refer to Refs. Schmalzl_PRB_2003 ; Buckeridge_Ceria_2013 ; Klarbring_Ceria_2018 ; Gupta_PRB_2012 ; Nelson_PRB_2017 for similar calculations. These four materials are all fluorite-structured, and all undergo type-II (continuous) superionic transitions at sufficiently high temperatures. Frequencies are plotted as a function of scaled volume , where is the K volume for each material as calculated in the quasiharmonic approximation.
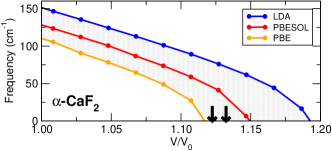
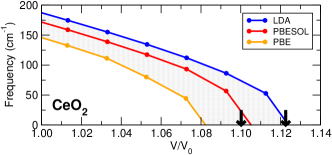
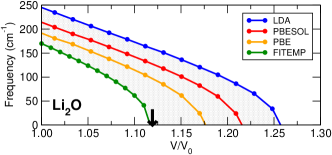
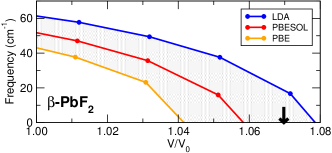
Fig. 8 also shows, using thick arrows, at the superionic phase transition as derived from experimental data. These values are obtained as follows. For CaF2, using = 1430 K Boyer_PRL_1980 , we deduce from the experimental EOS data of Ref. Schumann_thermal (left arrow in Fig. 8) and Ref. Angel_EOS (right arrow in Fig. 8). For CeO2, we assume = 2300 K Kovalenko_JNM and obtain using the experimental EOS data of Ref. Yashima_SSI (left arrow) and Ref. Omar_JACS (right arrow). For Li2O, we take = 1200 K Gupta_PRB_2012 and use the EOS data of Ref. Hull_JNM_1988 . Finally, for PbF2, we take = 710 K Hull_PRB_1998 and use the EOS data of Ref. Dickens_JPC_1979 . is either obtained directly from experimental data, or available data on the EOS is extrapolated to 0 K. Data is also extrapolated to if the available data does not extend to high enough temperatures.
The value of corresponding to complete mode softening varies a fair amount between different functionals. From Fig. 8 we observe that, to within the uncertainty introduced by the choice of exchange correlation functional (LDA, PBE or PBEsol), there is a softening of either the mode or mode coincident with the superionic phase transition in -CaF2, CeO2, and -PbF2. Complete softening of the mode is found at volumes larger than the transition volume in Li2O when these three functionals are used; however, the experimental value of at the transition agrees well with where the mode softens when using the aforementioned pair potential for Li2O. Functional-free techniques for calculating phonon frequencies, such as diffusion Monte Carlo Liu_PRB_2018 , could be used to further clarify this issue.
We close this section by re-emphasising that Fig. 8, and the discussion of phonon frequencies in this section, refer to harmonic phonon frequencies only. Recent work on superionic CeO2 Klarbring_Ceria_2018 using the temperature-dependent effective potential method TDEP has shown that temperature and anharmonic effects impede a complete softening of the phonon mode.
IV.3 Physical role of phonons
A number of physical phenomena are coincident with the onset of a superionic state. Examples include abrupt changes in heat capacities Keen_PRB_2003 , an increase in the number of vacancies, number of Frenkel or Schottky defects, or increase in occupation of interstitial sites Hull_PbF2KF ; Hull_PRB_1998 ; Keen_PRL_1996 ; Keen_PRB_2003 ; Hull_JSSC_2011 , a decrease in elastic constants Singh_PRB_1989 ; Gupta_PRB_2012 ; Buckeridge_Ceria_2013 ; Dickens_JPC_1979 ; Hull_JNM_1988 , and a softening of a particular phonon mode or modes Boyer_SSI_1981 ; Boyer_PRL_1980 ; Buckeridge_Ceria_2013 ; Schmalzl_PRB_2003 ; Schmalzl_PRB_2007 . Samara Samara_SSP_1984 discusses links between materials with a large dielectric constant and superionic behaviour, and Annamareddy et al. demonstrate the formation of string-like structures comprised of conduction anions Annamareddy_SciRep_2017 . These phenomena are not all independent, and not all of them are observed in every superionic conductor. Of the examples given here, elastic constants, phonon frequencies and dielectric constants can be accessed through static calculations, as can static defect and/or vacancy energies.
The physical role of phonons and in particular, low-energy or soft phonon modes in superionic conduction is described in a number of ways. Diffusing ions tend to move along directions of low curvature on the potential energy surface (PES), and these directions should in principle be detectable through the analysis of phonon modes, by which one can identify low energy directions for atomic movement. Phonons are effective in moving mobile ions toward saddle points and contribute to diffusive jumps of mobile ions Samara_SSP_1984 ; Wakamura_PRB_1997 . Energy barriers to ionic ‘hopping’ are expected to be smaller for ‘softer’ or more anharmonic lattices Samara_SSP_1984 , and low-lying or soft phonon modes should show strong anharmonicity. As a harmonic phonon mode develops an instability, there is a corresponding increase in amplitude of the softening mode and a concomitant creation of a double-well energy potential VENKATARAMAN_1979 . Such a double-well potential can promote defect creation and lead to a higher likelihood of mobile ions occupying interstitial sites Buckeridge_Ceria_2013 ; Klarbring_Ceria_2018 ; Ghosh_PCCP_2016 , and occurs in a regime in which the potential is too shallow to allow recrystallization into another phase Boyer_Ferro_1990 . Previous studies which have either explained or inferred superionic behaviour on the basis of phonon modes usually proceed by analysing phonon mode eigenvectors, and deciding whether there are soft or low-energy modes conducive to disorder or defect creation Buhrer_SSC_1975 ; Buckeridge_Ceria_2013 ; Boyer_PRL_1980 ; Nelson_PRB_2017 . Ionic conduction mechanisms proposed based on such analyses Boyer_PRL_1980 are supported by molecular dynamics calculations Zhou_SSC_1996 . Soft phonon modes have also been used to rationalise self-diffusive behaviour, such as that recently discussed in high- iron under Earth-core conditions Belonoshko_NGeo . Experimental neutron-diffraction data suggestive of soft phonon mode behaviour has been reported in superionic copper selenide Danilkin_JPSJ_2010 .
We suggest here that simple descriptors, such as phonon frequencies, offer a viable means by which to screen candidate materials for superionic behaviour. The vast majority of structure prediction studies on new materials proceed by first relaxing candidate structures using DFT, then using quasiharmonic lattice dynamics to re-assess the stabilities of low-enthalpy crystal structures, or to check for dynamic stability Nelson_PCCP_2015 ; Mayo_LiSn ; Shamp_JPCL_2015 . This approach is suitable for high-throughput calculations, and numerous predictions made using these techniques have been experimentally verified Errea_PRL_2015 ; Errea_Nature_2016 ; Li_PRB_2016 ; Marbella_JACS_2018 . A wealth of information about harmonic phonons is therefore obtained as a by-product of structure prediction. This data could be combed for low-energy or soft modes whose eigenvectors can be identified with creating disorder, as discussed for -CaF2, -CaF2, CeO2, Li2O and -PbF2 in this work. Frequencies of low-energy optical phonons at can also be examined; Wakamura Wakamura_PRB_1997 has demonstrated a strong correlation between these frequencies and the activation energies required for superionic conduction. Moving away from phonon frequencies, other descriptors such as dielectric constants and ionic sizes Bachman_ChemRev , elastic constants, or the Lindemann criterion Monserrat_PRL_2018 could prove useful in identifying potential superionics.
Directly screening large numbers of candidate materials using AIMD calculations is prohibitively expensive. Efforts are ongoing to substantially reduce the cost of AIMD simulations Kahle_PRM_2018 , however, its computational cost remains very high. Descriptors, such as those discussed here, are suggestive of superionic behaviour and could be used as a first step to shortlist a large set of candidate materials or crystal structures for superionicity, after which molecular dynamics simulations can then be carried out. In this work, carrying out AIMD simulations with 864-atom simulation cells on a single CaF2 polymorph (-CaF2) required about an order of magnitude more computing time than that used to search the entire CaF structure space in our original work Nelson_PRB_2017 . The latter approach has the added benefit of identifying new stable stoichiometries, such as CaF3 Nelson_PRB_2017 , and BaF3 and BaF4 Luo_JPCC_2018 (in the case of superionic BaF2) which may themselves be candidate superionic materials. It is not necessarily the case that all superionic systems will require large simulation cells as was the case in this work, but it is difficult to know this a priori.
V Conclusions
-CaF2, a polymorph suggested to be stable at high temperature and pressure Nelson_PRB_2017 , undergoes a type-I superionic phase transition to a bcc superionic state, -CaF2. We have observed this transition in constant-stress NPT simulations working at 2650 K and 20 GPa. The ionic conductivity is calculated to be in the neighbourhood of in -CaF2 at 20 GPa and 3000 K.
Modelling the -CaF2 phase at high temperature is difficult. Careful convergence tests need to be carried out to ensure that appropriately sized simulation cells are used. For -CaF2 at 2500 K and 20 GPa, the use of too small a simulation cell leads to the prediction of dominant calcium, rather than fluorine, diffusion a result that is both qualitatively and quantitatively incorrect. Finite-size effects such as this need to be routinely checked for, and avoided, in molecular dynamics simulations. Where empirical potentials are available, we suggest carrying out such convergence tests using classical MD with a large simulation cell as a benchmark, before any AIMD simulations are performed. If appropriate force fields are not available, a series of AIMD tests can still be carried out on small cells to check that diffusion coefficients are converged.
The softening of phonon modes at the Brillouin zone point are investigated for -CaF2, CeO2, -PbF2 and Li2O as a function of volume. Within the uncertainty due to the treatment of exchange-correlation (or choice of pair potential in the case of Li2O), these compounds exhibit a harmonic phonon instability at fractional volumes corresponding to a superionic phase transition. We have discussed the utility of descriptors, such as soft phonon frequencies, in predicting superionic behaviour.
Acknowledgements
The authors acknowledge useful discussions with Dr S. Hull, Dr B. Monserrat, Dr B. Karasulu, and Prof. A. Walsh. Calculations were carried out using the archer facility of the U.K.’s national high-performance computing service, for which access was obtained via the UKCP consortium (Grant No. EP/P022596/1).
References
- (1) J. H. Burnett, Z. H. Levine, and E. L. Shirley, Intrinsic birefringence in calcium fluoride and barium fluoride, Phys. Rev. B 64, 241102(R) (2001).
- (2) G. W. Rubloff, Far-Ultraviolet Reflectance Spectra and the Electronic Structure of Ionic Crystals, Phys. Rev. B 5, 662 (1972).
- (3) H. Shi, R. I. Eglitis, and G. Borstel, Ab initio calculations of the CaF2 electronic structure and F centers, Phys. Rev. B 72, 045109 (2005).
- (4) X. Wu, S. Qin, and Z. Wu, First-principles study of structural stabilities, and electronic and optical properties of CaF2 under high pressure, Phys. Rev. B 73, 134103 (2006).
- (5) J. R. Nelson, R. J. Needs, and C. J. Pickard, High-pressure phases of group-II difluorides: Polymorphism and superionicity, Phys. Rev. B 95, 054118 (2017).
- (6) F. Nakamura, T. Kato, G. Okada, N. Kawaguchi, K. Fukuda, and T. Yanagida, Scintillation and dosimeter properties of CaF2 transparent ceramic doped with Eu2+, Ceram. Int. 43, 604-609 (2017).
- (7) S. E. Boulfelfel, D. Zahn, O. Hochrein, Y. Grin, and S. Leoni, Low-dimensional sublattice melting by pressure: Superionic conduction in the phase interfaces of the fluorite-to-cotunnite transition of CaF2, Phys. Rev. B 74, 094106 (2006).
- (8) P. Kalita, P. Specht, S. Root, N. Sinclair, A. Schuman, M. White, A. L. Cornelius, J. Smith, and S. Sinogeikin, Direct Observations of a Dynamically Driven Phase Transition with in situ X-Ray Diffraction in a Simple Ionic Crystal, Phys. Rev. Lett. 119, 255701 (2017).
- (9) S. M. Dorfman, F. Jiang, Z. Mao, A. Kubo, Y. Meng, V. B. Prakapenka, and T. S. Duffy, Phase transitions and equations of state of alkaline earth fluorides CaF2, SrF2, and BaF2 to Mbar pressures, Phys. Rev. B 81, 174121 (2010).
- (10) L. L. Boyer, Nature of Melting and Superionicity in Alkali and Alkaline-Earth Halides, Phys. Rev. Lett. 45 1858 (1980).
- (11) S. Hull and D. A. Keen, Effect of hydrostatic pressure on the crystal structure and superionic behavior of lead (II) fluoride, Phys. Rev. B 58, 14837 (1998).
- (12) J. Oberschmidt and D. Lazarus, Ionic conductivity, activation volumes, and high-pressure phase transitions in PbF2 and SrCl2, Phys. Rev. B 21, 2952 (1980).
- (13) K. Schmalzl, Volume and pressure dependence of ground-state and lattice-dynamical properties of BaF2 from density-functional methods, Phys. Rev. B 75, 014306 (2007).
- (14) J. Buckeridge, D. O. Scanlon, A. Walsh, C. R. A. Catlow, and A. A. Sokol, Dynamical response and instability in ceria under lattice expansion, Phys. Rev. B 87, 214304 (2013).
- (15) M. K. Gupta, P. Goel, R. Mittal, N. Choudhury, and S. L. Chaplot, Phonon instability and mechanism of superionic conduction in Li2O, Phys. Rev. B 85, 184304 (2012).
- (16) P. W. Mirwald and G. C. Kennedy, Phase relations for SrF2 To 50 Kbars and 1900∘C and its compression to 40 Kbars at 25∘C, J. Phys. Chem. Sol. 41, 1157 (1980).
- (17) C. Cazorla and D. Errandonea, Superionicity and Polymorphism in Calcium Fluoride at High Pressure, Phys. Rev. Lett. 113, 235902 (2014).
- (18) P. W. Mirwald and G. C. Kennedy, The phase relations of calcium fluoride (fluorite) to 60 kbars and 1800∘C, J. Phys. Chem. Sol. 39, 859-861 (1978).
- (19) Z. Zhao-Yi, C. Xiang-Rong, Z. Jun, and H. Cui, Phase Transition and Melting Curves of Calcium Fluoride via Molecular Dynamics Simulations, Chinese Phys. Lett. 25, 230 (2008).
- (20) C. Cazorla and D. Errandonea, High-Pressure, High-Temperature Phase Diagram of Calcium Fluoride from Classical Atomistic Simulations, J. Phys. Chem. C 117 11292-11301 (2013).
- (21) C. J. Pickard and R. J. Needs, High-Pressure Phases of Silane, Phys. Rev. Lett. 97, 045504 (2006).
- (22) C. J. Pickard and R. J. Needs, Ab initio random structure searching, J. Phys.: Condens. Matter 23, 053201 (2011).
- (23) R. J. Needs and C. J. Pickard, Perspective: Role of structure prediction in materials discovery and design, APL Materials 4, 053210 (2016).
- (24) A. Haase and G. Brauer, Hydratstufen und Kristallstrukturen von Bariumchlorid, Zeit. für anorg. und allgemeine Chem. 441, 181 (1978).
- (25) H. P. Beck, A structure refinement of the high pressure modification BaI2-II, J. Solid State Chem. 47, 328 (1983).
- (26) H. Dekura, T. Tsuchiya, Y. Kuwayama, and J. Tsuchiya, Theoretical and Experimental Evidence for a New Post-Cotunnite Phase of Titanium Dioxide with Significant Optical Absorption, Phys. Rev. Lett. 107, 045701 (2011).
- (27) D. Nishio-Hamane, H. Dekura, Y. Seto, and T Yagi, Theoretical and experimental evidence for the post-cotunnite phase transition in zirconia at high pressure, Phys. Chem. Minerals 42, 385 (2015).
- (28) C. Cazorla, A. K. Sagotra, M. King, and D. Errandonea, High-Pressure Phase Diagram and Superionicity of Alkaline Earth Metal Difluorides, J. Phys. Chem. C 122, 1267-1279 (2018).
- (29) C. Cazorla and D. Errandonea, Comment on “High-pressure phases of group-II difluorides: Polymorphism and superionicity”, Phys. Rev. B 98, 186101 (2018).
- (30) J. R. Nelson, R. J. Needs, and C. J. Pickard, Reply to “Comment on “High-pressure phases of group-II difluorides: Polymorphism and superionicity” ”, Phys. Rev. B 98, 186102 (2018).
- (31) L. L. Boyer, First-principles theory of phase transformations in ionic solids, Ferroelectrics 35, 83-88 (1981).
- (32) J. Hutter, M. Iannuzzi, F. Schiffmann, and J. VandeVondele, CP2K: atomistic simulations of condensed matter systems, WIREs Comput. Mol. Sci. 4, 15-25 (2014).
- (33) J. P. Perdew, K. Burke, and M. Ernzerhof, Generalized Gradient Approximation Made Simple, Phys. Rev. Lett. 77, 3865-3868 (1996); Phys. Rev. Lett. 78, 1396 (1997); Phys. Rev. Lett. 80, 891 (1998).
- (34) S. Goedecker, M. Teter, and J. Hutter, Separable dual-space Gaussian pseudopotentials, Phys. Rev. B 54, 1703 (1996).
- (35) C. Hartwigsen, S. Goedecker, and J. Hutter, Relativistic separable dual-space Gaussian pseudopotentials from H to Rn, Phys. Rev. B 58, 3641 (1998).
- (36) M. Krack, Pseudopotentials for H to Kr optimized for gradient-corrected exchange-correlation functionals, Theor. Chem. Acc. 114, 145 (2005).
- (37) J. VandeVondele and J. Hutter, Gaussian basis sets for accurate calculations on molecular systems, J. Chem. Phys. 127, 114105 (2007).
- (38) S. J. Clark, M. D. Segall, C. J. Pickard, P. J. Hasnip, M. I. J. Probert, K. Refson, and M. C. Payne, First principles methods using CASTEP, Zeit. für Krist. 220, 567-570 (2005).
- (39) S. Plimpton, Fast Parallel Algorithms for Short-Range Molecular Dynamics, J. Comp. Phys. 117, 1-19 (1995); see also http://lammps.sandia.gov.
- (40) S. Faraji, S. A. Ghasemi, S. Rostami, R. Rasoulkhani, B. Schaefer, S. Goedecker, and M. Amsler, High accuracy and transferability of a neural network potential through charge equilibration for calcium fluoride, Phys. Rev. B 95, 104105 (2017).
- (41) T. Oda, Y. Oya, S. Tanaka, and W. J. Weber, Validation of potential models for Li2O in classical molecular dynamics simulation, J. Nuc. Mat. 367-370, 263-268 (2007).
- (42) K. Refson, P. R. Tulip, and S. J. Clark, Variational density-functional perturbation theory for dielectrics and lattice dynamics, Phys. Rev. B 73, 155114 (2006).
- (43) J. D. Gale, GULP: A computer program for the symmetry-adapted simulation of solids, J. Chem. Soc., Faraday Transactions 93, 629-637 (1997).
- (44) A. D. Mulliner, P. C. Aeberhard, P. D. Battle, W. I. F. David, and K. Refson, Diffusion in Li2O studied by non-equilibrium molecular dynamics for 873 1603, Phys. Chem. Chem. Phys. 17, 21470-21475 (2015).
- (45) See Supplemental Material appended to the end of this document.
- (46) J. H. Lloyd-Williams and B. Monserrat, Lattice dynamics and electron-phonon coupling calculations using nondiagonal supercells, Phys. Rev. B 92, 184301 (2015).
- (47) A. Annamareddy and J. Eapen, Low Dimensional String-like Relaxation Underpins Superionic Conduction in Fluorites and Related Structures, Sci. Rep. 7, 44149 (2017).
- (48) M. J. Rutter, C2x: A tool for visualisation and input preparation for Castep and other electronic structure codes, Comp. Phys. Comm. 225 174-179 (2018).
- (49) B. H. Grier, S. M. Shapiro, and R. J. Cava, Inelastic neutron scattering measurements of the diffusion in -Ag2S, Phys. Rev. B 29, 3810 (1984).
- (50) F. Kirchhoff, J. M. Holender, and M. J. Gillan, Structure, dynamics, and electronic structure of liquid Ag-Se alloys investigated by ab initio simulation, Phys. Rev. B 54, 190 (1996).
- (51) H. F. Wilson, M. L. Wong, and B. Militzer, Superionic to Superionic Phase Change in Water: Consequences for the Interiors of Uranus and Neptune, Phys. Rev. Lett. 110, 151102 (2013).
- (52) J.-A. Hernandez and R. Caracas, Superionic-Superionic Phase Transitions in Body-Centered Cubic H2O Ice, Phys. Rev. Lett. 117, 135503 (2016).
- (53) S. Hull, P. Berastegui, S. G. Eriksson, and N. J. G. Gardner, Crystal structure and superionic conductivity of PbF2 doped with KF, J. Phys.: Condens. Matter 10, 8429 (1998).
- (54) G. Venkataraman, Soft modes and structural phase transitions, Bull. Mat. Sci. 1, 129-170 (1979).
- (55) K. Binder, Theory of first-order phase transitions, Rep. Prog. Phys. 50 783 (1987).
- (56) D. M. Ceperley and B. J. Alder, Ground State of the Electron Gas by a Stochastic Method, Phys. Rev. Lett. 45, 566 (1980).
- (57) J. P. Perdew and A. Zunger, Self-interaction correction to density-functional approximations for many-electron systems, Phys. Rev. B 23, 5048 (1981).
- (58) J. P. Perdew, A. Ruzsinszky, G. I. Csonka, O. A. Vydrov, G. E. Scuseria, L. A. Constantin, X. Zhou, and K. Burke, Restoring the Density-Gradient Expansion for Exchange in Solids and Surfaces, Phys. Rev. Lett. 100, 136406 (2008); Phys. Rev. Lett. 101, 239702 (2008); Phys. Rev. Lett. 102, 039902(E) (2009).
- (59) K. Schmalzl, D. Strauch, and H. Schober, Lattice-dynamical and ground-state properties of CaF2 studied by inelastic neutron scattering and density-functional methods, Phys. Rev. B 68, 144301 (2003).
- (60) J. Klarbring, N. V. Skorodumova, and S. I. Simak, Finite-temperature lattice dynamics and superionic transition in ceria from first principles, Phys. Rev. B 97, 104309 (2018).
- (61) B. Schumann and H. Neumann, Thermal expansion of CaF2 from 298 to 1173 K, Crys. Res. and Tech. 19, K13-K14 (1984).
- (62) R. J. Angel, The high-pressure, high-temperature equation of state of calcium fluoride, CaF2, J. Phys.: Condens. Matter 5, L141 (1993).
- (63) M. A. Kovalenko and A. Ya. Kupryazhkin, Melting and superionic transition of Gd-doped ceria nanocrystals: Molecular dynamics study, J. Nuc. Mat. 430, 12-19 (2012).
- (64) M. Yashima, S. Kobayashi, and T. Yasui, Crystal structure and the structural disorder of ceria from 40 to 1497 ∘C, Sol. St. Ionics 177, 211-215 (2006).
- (65) S. Omar, E. D. Wachsman, J. L. Jones, and J. C. Nino, Crystal Structure-Ionic Conductivity Relationships in Doped Ceria Systems, J. Am. Cer. Soc. 92, 2674-2681 (2009).
- (66) S. Hull, T. W. D. Farley, W. Hayes, and M. T. Hutchings, The elastic properties of lithium oxide and their variation with temperature, J. Nuc. Mat. 160, 125-134 (1988).
- (67) M. H. Dickens, W. Hayes, M. T. Hutchings and W. G. Kleppmann, Neutron scattering studies of acoustic phonon modes in PbF2 up to high temperatures, J. Phys. C: Solid State Phys. 12, 17 (1979).
- (68) Y. Y. F. Liu, B. Andrews, and G. J. Conduit, Vibrational modes and atomic relaxation in Diffusion Monte Carlo, under review, Phys. Rev. B (2018).
- (69) O. Hellman, P. Steneteg, I. A. Abrikosov, and S. I. Simak, Temperature dependent effective potential method for accurate free energy calculations of solids, Phys. Rev. B 87, 104111 (2013).
- (70) D. A. Keen, S. Hull, A. C. Barnes, P. Berastegui, W. A. Crichton, P. A. Madden, M. G. Tucker, and M. Wilson, Nature of the superionic transition in Ag+ and Cu+ halides, Phys. Rev. B 68, 014117 (2003).
- (71) D. A. Keen, S. Hull, W. Hayes, and N. J. G. Gardner, Structural Evidence for a Fast-Ion Transition in the High-Pressure Rocksalt Phase of Silver Iodide, Phys. Rev. Lett. 77, 4914 (1996).
- (72) S. Hull, S. T. Norberg, I. Ahmed, S. G. Eriksson, and C. E. Mohn, High temperature crystal structures and superionic properties of SrCl2, SrBr2, BaCl2 and BaBr2, J. Solid State Chem. 184, 2925-2935 (2011).
- (73) R. K. Singh, C. N. Rao, and S. P. Sanyal, Temperature dependence of elastic constants of some fluorite crystals, Phys. Rev. B 39, 13493 (1989).
- (74) L. L. Boyer, Origin of superionicity in the alkaline earth halides, Sol. St. Ionics 5, 581-583 (1981).
- (75) G. A. Samara, High-Pressure Studies of Ionic Conductivity in Solids, Sol. St. Phys. 38, 1-80 (1984).
- (76) K. Wakamura, Roles of phonon amplitude and low-energy optical phonons on superionic conduction, Phys. Rev. B 56, 11593 (1997).
- (77) P. S. Ghosh, A. Arya, G. K. Dey, N. Kuganathan and R. W. Grimes, A computational study on the superionic behaviour of ThO2, Phys. Chem. Chem. Phys. 18, 31494-31504 (2016).
- (78) L. L. Boyer, Relating double wells to phase transitions from ab initio model calculations, Ferroelectrics 111, 63-69 (1990).
- (79) W. Bührer and P. Brüesch, Phonon dispersion and transition in silver iodide, Sol. State Comm. 16, 155-158 (1975).
- (80) L. X. Zhou, J. R. Hardy, and H. Z. Cao, Dynamical simulations of superionicity in alkaline-earth halides, Sol. State Comm. 98, 341 (1996).
- (81) A. B. Belonoshko, T. Lukinov, J. Fu, J. Zhao, S. Davis, and S. I. Simak, Stabilization of body-centred cubic iron under inner-core conditions, Nature Geoscience 10, 312-316 (2017).
- (82) S. A. Danilkin, M. Yethiraj, and G. J. Kearley, Phonon Dispersion in Superionic Copper Selenide: Observation of Soft Phonon Modes in Superionic Phase Transition, J. Phys. Soc. Jpn. 79, 25-28 (2010).
- (83) J. R. Nelson, R. J. Needs, and C. J. Pickard, Calcium peroxide from ambient to high pressures, Phys. Chem. Chem. Phys. 17, 6889-6895 (2015).
- (84) M. Mayo and A. J. Morris, Structure Prediction of Li-Sn and Li-Sb Intermetallics for Lithium-Ion Batteries Anodes, Chem. Mater. 29 5787-5795 (2017).
- (85) A. Shamp and E. Zurek, Superconducting High-Pressure Phases Composed of Hydrogen and Iodine, J. Phys. Chem. Lett. 6, 4067-4072 (2015).
- (86) I. Errea, M. Calandra, C. J. Pickard, J. R. Nelson, R. J. Needs, Y. Li, H. Liu, Y. Zhang, Y. Ma, and F. Mauri, High-Pressure Hydrogen Sulfide from First Principles: A Strongly Anharmonic Phonon-Mediated Superconductor, Phys. Rev. Lett. 114, 157004 (2015).
- (87) I. Errea, M. Calandra, C. J. Pickard, J. R. Nelson, R. J. Needs, Y. Li, H. Liu, Y. Zhang, Y. Ma, and F. Mauri, Quantum hydrogen-bond symmetrization in the superconducting hydrogen sulfide system, Nature 532, 81-84 (2016).
- (88) Y. Li, L. Wang, H. Liu, Y. Zhang, J. Hao, C. J. Pickard, J. R. Nelson, R. J. Needs, W. Li, Y. Huang, I. Errea, M. Calandra, F. Mauri, and Y. Ma, Dissociation products and structures of solid H2S at strong compression, Phys. Rev. B 93, 020103(R) (2016).
- (89) L. E. Marbella, M. L. Evans, M. F. Groh, J. Nelson, K. J. Griffith, A. J. Morris, and C. P. Grey, Sodiation and Desodiation via Helical Phosphorus Intermediates in High-Capacity Anodes for Sodium-Ion Batteries, J. Am. Chem. Soc. 140, 7994-8004 (2018).
- (90) J. C. Bachman, S. Muy, A. Grimaud, H.-H. Chang, N. Pour, S. F. Lux, O. Paschos, F. Maglia, S. Lupart, P. Lamp, L. Giordano, and Y. Shao-Horn, Inorganic Solid-State Electrolytes for Lithium Batteries: Mechanisms and Properties Governing Ion Conduction, Chem. Rev. 116, 140-162 (2016).
- (91) B. Monserrat, M. Martinez-Canales, R. J. Needs, and C. J. Pickard, Helium-iron compounds at terapascal pressures, Phys. Rev. Lett. 121, 015301 (2018).
- (92) D. Luo, Y. Wang, G. Yang, and Y. Ma, Barium in High Oxidation States in Pressure-Stabilized Barium Fluorides, J. Phys. Chem. C 122 12448 (2018).
- (93) L. Kahle, A. Marcolongo, and N. Marzari, Modeling lithium-ion solid-state electrolytes with a pinball model, Phys. Rev. Mat. 2, 065405 (2018).
Supplementary material for:
High-pressure CaF2 revisited: a new high-temperature phase
and the role of phonons in the search for superionic conductivity
J. R. Nelson,1,∗ R. J. Needs,1 and C. J. Pickard2,3
1Theory of Condensed Matter Group, Cavendish Laboratory,
J. J. Thomson Avenue, Cambridge CB3 0HE, United Kingdom
2Department of Materials Science and Metallurgy, University of Cambridge,
27 Charles Babbage Road, Cambridge CB3 0FS, United Kingdom
3Advanced Institute for Materials Research, Tohoku University,
2-1-1 Katahira, Aoba, Sendai, 980-8577, Japan
∗Email: jn336@cam.ac.uk
Effect of cell size and shape on mean-square displacements for -CaF2
Calculations here use classical molecular dynamics via the lammps code LAMMPS_2 alongside the Buckingham pair potentials discussed in Ref. Faraji_PRB_2017_2 for calcium and fluorine. The NVT ensemble is used with = 2500 K. -CaF2 is set orthorhombically in a cell with Å, Å and Å, which yields a pressure near 20 GPa at 2500 K. In the figures below, signifies the supercell size referred to this orthorhombic cell. is the fluorine diffusion coefficient, and the number of atoms. Uncertainties in the MSDs for Ca and F, indicated by light blue and orange shaded regions, are obtained by averaging across 100 trajectories, with each trajectory starting from different initial velocities. The exception to this is for =15,552, for which 20 trajectories instead of 100 are used for averaging.
References
- (1) S. Plimpton, Fast Parallel Algorithms for Short-Range Molecular Dynamics, J. Comp. Phys. 117, 1-19 (1995); see also http://lammps.sandia.gov.
- (2) S. Faraji, S. A. Ghasemi, S. Rostami, R. Rasoulkhani, B. Schaefer, S. Goedecker, and M. Amsler, High accuracy and transferability of a neural network potential through charge equilibration for calcium fluoride, Phys. Rev. B 95, 104105 (2017).