Reply to “Comment on “High-pressure phases of group-II difluorides: Polymorphism and superionicity” ”
Abstract
Cazorla et al. [preceding comment] criticize our recent results on the high- phase diagram of CaF2 [Phys. Rev. B 95, 054118 (2017)]. According to our analysis, Cazorla et al. have not converged their calculations with respect to simulation cell size, undermining the comment’s conclusions about both the high- behaviour of the -CaF2 polymorph, and the use of the QHA in our work. As such, we take this opportunity to emphasise the importance of correctly converging molecular dynamics simulations to avoid finite-size errors. We compare our quasiharmonic phase diagram for CaF2 with currently available experimental data, and find it to be entirely consistent and in qualitative agreement with such data. Our prediction of a superionic phase transition in -CaF2 (made on the basis of the QHA) is shown to be accurate, and we argue that simple descriptors, such as phonon frequencies, can offer valuable insight and predictive power concerning superionic behaviour.
Part of our recent work Nelson_PRB_2017 reports a pressure-temperature phase diagram for CaF2 (Fig. 8 of Nelson_PRB_2017 ) calculated using the quasiharmonic approximation (QHA). This phase diagram was constructed by first searching the potential energy surface of CaF2 using the ab initio random structure searching (AIRSS) technique AIRSS , after which the effects of finite temperature were treated by explicitly calculating the Gibbs free energy of candidate low-enthalpy phases in the QHA. We found that in the QHA, the Gibbs free energy difference between the known high-pressure -CaF2 phase, and a -symmetry structure found using AIRSS, closes at increased temperature, leading us to propose -CaF2 as a high- CaF2 phase. We consider this to be quite reasonable, given that the same structure is already a known high- phase in other alkaline earth metal halides e.g. BaCl2 BaCl2_P62m and BaI2 BaI2_P62m .
We also proposed that -CaF2 would undergo a superionic phase transition at still higher temperatures. This conclusion was reached through the identification and analysis of an unstable -point phonon mode present in the structure (Figs. 10 and 11 of Nelson_PRB_2017 ).
In reply to Cazorla and Errandonea’s (hereafter ‘CE’) criticism Cazorla_Comment_2018 , we demonstrate in Sec. I that our CaF2 phase diagram is completely consistent with available experimental data on high- CaF2. In Sec. II, we provide the results of ab initio molecular dynamics (AIMD) simulations on -CaF2. These simulations fully substantiate our prediction of a superionic phase transition in this polymorph Nelson_PRB_2017 , and show that -CaF2 is stable in one-phase simulations to at least 3000 K at 20 GPa. We find that the AIMD simulations presented by CE in Cazorla_Comment_2018 have not used sufficiently large simulation cells; accordingly, CE’s results on high- -CaF2 are erroneous. Given that CE base much of their criticism of our work on those flawed results, we are led to conclude that their comment is without merit. We end our reply with a discussion concerning phonons, the QHA, and superionicity.
I PT phase diagram of CaF2
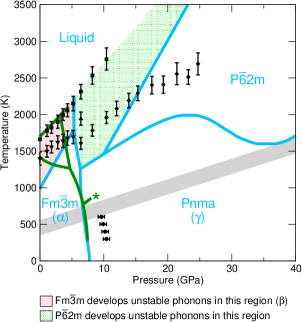
In Fig. 1 below, we plot the boundaries of our QHA phase diagram (blue lines Fig. 8 of Nelson_PRB_2017 ) alongside experimental data from Refs. Cazorla_Comment_2018 (points with error bars) and Mirwald_JPCS_1980 (solid green lines). An examination of Fig. 1 demonstrates that our QHA results are entirely consistent with both sets of experimental data. We identify two low-temperature solid states the known and phases and our - phase boundary shows good quantitative agreement with the data of Mirwald_JPCS_1980 , while the data of Ref. Cazorla_Comment_2018 lies about 3 GPa higher. Our QHA results suggest a high-temperature modification of -CaF2 as thermal expansion drives this compound to volumes at which it exhibits a harmonic phonon instability; this is consistent with Refs. Cazorla_Comment_2018 ; Mirwald_JPCS_1980 and the known high- -CaF2 phase.
Experimentally, the behaviour of CaF2 at higher pressures and temperatures is less clear. For example, following the - boundary with increasing temperature, the data of Ref. Mirwald_JPCS_1980 suggests (based on changes in the slope of the - boundary) a possible triple point involving the solid and phases, but not the superionic phase, to occur first, and this is what we qualitatively find in our QHA phase diagram. CE on the other hand have proposed that a triple point involving the , and phases occurs first (Fig. 1(a) of Cazorla_Comment_2018 ). Quantitatively, these triple points are separated by about 800 K, with our QHA results half-way in between (Fig. 1). We remark here that the experimental results in Refs. Cazorla_Comment_2018 ; Mirwald_JPCS_1980 do not offer any structural information about high- CaF2 phases.
Our QHA phase diagram uses a straight line to represent the melting curve of CaF2. This line is consistent with experimental data given in Ref. Cazorla_Comment_2018 (see Fig. 1). In practice, there is likely to be some curvature or change in curvature in the melting curve, particularly at any triple points.
The coexistence of -CaF2 with another superionic phase cannot be ruled out by currently available experimental data. As CE correctly acknowledge in their comment, the phase with which -CaF2 coexists (excluding the and liquid phases) is “experimentally not resolved”. Previous theoretical work on the CaF2 phase diagram is divided as to whether such a phase is solid, superionic or even liquid.
CE describe our - phase boundary as “inconsistent” with the experimental data in Ref. Cazorla_Comment_2018 , however Fig. 1 makes it obvious that this is not the case. Both sets of data (the blue - phase boundary, and the points with solid diamonds and errorbars in Fig. 1) are in clear qualitative agreement. The experimental data in this case does not extend to sufficiently high pressures to ascertain whether this boundary then falls in temperature, as predicted in the QHA. We reiterate here that the calculation of this particular phase boundary is subject to some uncertainty depending on the choice of equation-of-state (EOS) used for the Gibbs free energy calculation; this point, and details of the EOS we used for these calculations were comprehensively addressed in our work Nelson_PRB_2017 so we refer the interested reader there. We also remark that in the QHA, the free energy surfaces of the and phases are almost parallel (Fig. 6 of Nelson_PRB_2017 ), which introduces uncertainty in calculating their high- intersections Schieber_JCP_2018 .
In our QHA CaF2 phase diagram, we would expect the boundaries between the and phases, and the regions in which these phases develop phonon instabilities, to be essentially linear (Fig. 1). This is because these boundaries are isochores, corresponding to Å3/f.u. (-CaF2) and Å3/f.u. (-CaF2) Nelson_PRB_2017 , and is unrelated to the QHA.
A comparison of CE’s previous AIMD simulations on CaF2 and our QHA phase diagram is unproductive. CE’s previous simulations are limited to the and CaF2 phases only, and do not consider the CaF2 structure proposed in our work Nelson_PRB_2017 . Should a -induced transition between the and phases occur, as we predicted using the QHA, it is extremely unlikely that CE would have observed this transition in their simulations: among the difficulties are that the structure, with 9 atoms/unit cell, is incompatible with the 192-atom supercells used in CE’s previous work. The behaviour of CaF2 in those simulations should not therefore be expected to mirror the results found in our QHA phase diagram. The only AIMD simulations that CE do carry out on the -CaF2 structure have their own deficiencies, which we discuss in the next Section.
II High temperature behaviour of CaF2
We suggested in Ref. Nelson_PRB_2017 that -CaF2 would become superionic at sufficiently high temperatures. CE, however, present AIMD simulations in their comment (Figs. 2(a) and (b) of Cazorla_Comment_2018 ) in which they claim that -CaF2 is not superionic.
We discuss Fig. 2(a) of Cazorla_Comment_2018 first, which shows the results of an AIMD simulation on -CaF2 at K and GPa. Under these conditions, according to CE, the Ca sublattice in -CaF2 melts and Ca ions show diffusive behaviour. These results are unphysical: the diffusion of Ca (as opposed to F) is not expected. Coulombic arguments would instead lead us to expect that diffusion is more energetically costly for Ca2+ due to its higher ionic charge relative to F- Hull_RPP_2004 , which is supported by direct measurements of anion and cation diffusion coefficients in -CaF2 Matzke_JMS_1970 . As such, CE’s apparent observation of Ca diffusion suggests a problem with their AIMD simulations, rather than a criticism of our work. We therefore present our own results here. Our AIMD calculations use the cp2k code, the PBE exchange-correlation functional, GTH pseudopotentials for Ca and F, and DZVP ‘MOLOPT’ Gaussian basis sets CP2K ; PBE1996 ; GTH_pseudos_1 ; GTH_pseudos_2 ; GTH_pseudos_3 ; MOLOPT . Mean-squared displacement (MSD) calculations average over both the atoms of a particular species (Ca or F), and over different time origins. Positions are corrected for the center-of-mass motion in all cases.
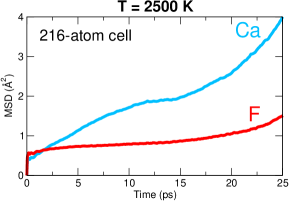
Fig. 2 shows the MSD of Ca and F ions at GPa and K for -CaF2, using a supercell containing 216 atoms, which is of a similar size to that used by CE in their comment. Comparing Figs. 2 and Fig. 2(a) of Cazorla_Comment_2018 , we indeed find analogous results: there is a relative stasis in F diffusion, and prominent Ca diffusion. However, it is clear that this behaviour does not persist upon increasing the simulation cell size. In Ref. Nelson_PRB_2018 , we show that large simulation cells are required to obtain results that are qualitatively converged with respect to simulation cell size.
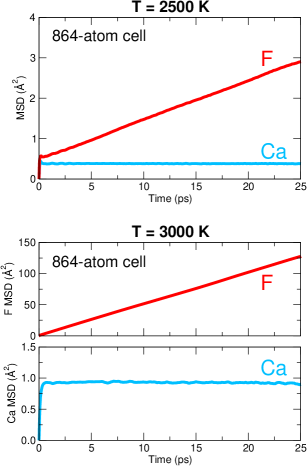
Fig. 3 provides the results of an AIMD simulation carried out with a larger, 864-atom cell. The results we obtain are very different from those using supercells with 216 atoms. At GPa and K, we observe mild F diffusion; note that there is no unphysical Ca diffusion. At K (with the same cell size), F diffusion is significantly higher than at K, consistent with a superionic phase transition occurring in -CaF2 between these two temperatures. We do not find -CaF2 to be in a melt state at 3000 K.
These results support the conclusions of our work Nelson_PRB_2017 : -CaF2 undergoes a high-temperature superionic phase transition. A comparison of Figs. 2 and 3 highlights the importance of correctly converging MD simulations with respect to supercell size in order to avoid drawing erroneous conclusions. Finite-size effects are, in this case, so severe that they led CE to predict the wrong diffusing species (Ca instead of F) at 2500 K and 20 GPa Cazorla_Comment_2018 . On the basis of the results in this section, we firmly reject CE’s claims that -CaF2 is not superionic, and that its melting temperature is below 3000 K. We are led to conclude that -CaF2 is an excellent candidate for a high- CaF2 phase.
III Phonons and superionicity
There is a considerable amount of literature discussing phonon modes either soft, or low-energy in conjunction with superionic conductivity e.g. Boyer_PRL_1980 ; Boyer_Phase_1981 ; Samara_SSP_1984 ; Zhou_SSC_1996 ; Wakamura_PRB_1997 ; Wakamura_PRB_1999 ; Gupta_PRB_2012 ; Buckeridge_Ceria_2013 ; Ghosh_PCCP_2016 ; Roychowdhury_AChem_2018 , and phonon modes have also been invoked to explain other types of diffusive behaviour, such as self-diffusion in transition metals Herzig_BB_1989 ; Marian_PRB_2002 .
The softening of a phonon mode at the harmonic level results in an increase in amplitude of the softening mode and the corresponding creation of a double-well energy potential Boyer_Ferro_1990 , which can favour defect creation and increase the probability of interstitial site occupation, as discussed for superionic ThO2 Ghosh_PCCP_2016 . However, the details require analysis of the soft mode’s eigenvectors Boyer_PRL_1980 ; Buckeridge_Ceria_2013 ; Ghosh_PCCP_2016 ; Nelson_PRB_2017 to understand their effect on ionic motion. We consider this to be an important point. Reading CE’s comment, one is left with the unfortunate impression that any soft phonon mode would result in a superionic phase transition; this does not follow, since the soft mode could be indicative of a different kind of transition, e.g. structural, ferroelectric, and so on. Instead, the mode (or combination of modes Buckeridge_Ceria_2013 ) should be examined to see whether they exhibit behaviour conducive to superionicity, such as leaving one atomic species motionless Boyer_PRL_1980 , or promoting the movement of ions toward interstitial sites Buckeridge_Ceria_2013 . This is how we proceeded in Ref. Nelson_PRB_2017 .
Previous studies have used the QHA and/or phonon modes to explain superionic behaviour in SrF2, BaF2, Li3OCl and AgI Boyer_SSI_1981 ; Makur_PSSB_1992 ; Zhao_JACS_2012 ; Buhrer_SSC_1975 . SrF2 and BaF2 are examined in Refs. Boyer_SSI_1981 ; Makur_PSSB_1992 ; Schmalzl_PRB_2007 ; as is the case for -CaF2 Boyer_PRL_1980 , a critical softening of a zone-boundary phonon at is seen at increasing volumes. Phonon frequencies in stoichiometric Li3OCl have been discussed in detail in Ref. Chen_PRB_2015 , and phonon instabilities in this compound (such as those shown in Fig. 3(c) of Cazorla_Comment_2018 ) are attributable to structural phase transitions which distort the high-symmetry perovskite structure. This kind of soft phonon mode can actively promote superionic behaviour, as discussed in Ref. Zhao_JACS_2012 .
AgI has a number of superionic polymorphs Han_JCP_2014 ; without the benefit of knowing which polymorph CE refer to in their comment, we restrict our discussion here to -AgI and its transition to the superionic -AgI phase. Ref. Buhrer_SSC_1975 identifies a low-energy optical phonon mode present in -AgI that strongly favours defect creation and thereby drives the superionic - transition in this compound. Ref. Li_JPCM_2008 provides examples of phonon modes that critically soften in -AgI upon decreasing volume. That the superionic transition in -AgI is first-order is no barrier to it being driven by either low-energy or soft phonons; however, the transition will be of the order-disorder, rather than displacive, type.
Direct experimental evidence for soft-mode behaviour in superionic materials has been reported in Ref. Danilkin_JPSJ_2010 for superionic Cu2-δSe. As such, CE’s criticisms of our use of the QHA in Nelson_PRB_2017 are not backed by experimental evidence; quite the contrary. Instead, CE’s confusion about currently available experimental results stems from their incorrect assumption that any soft phonon mode can cause a superionic phase transition.
Lastly, we address the issue of whether the QHA can give quantitatively accurate superionic transition temperatures. In our view, this would require (1) thermal expansion to be accurate in the QHA, and (2) the presence of a harmonic phonon mode (judged to be linked with the transition) which softens at the same volume at which the transition occurs. Point (1) was addressed in depth in our original work Nelson_PRB_2017 , where we provide a validity criteria for the QHA based on calculated thermal expansion coefficients Karki-2001 ; Wentzcovitch-2004 , and which is depicted in Fig. 1. Point (2) is less obvious, largely because the exact volume at which a phonon softens is strongly dependent on exchange-correlation. We expect to discuss it further in Ref. Nelson_PRB_2018 .
IV Conclusions
Revisiting our quasiharmonic phase diagram for CaF2 (Fig. 8 of Nelson_PRB_2017 ), we find it to be completely consistent with currently available experimental data on high- CaF2 (Fig. 1).
The AIMD calculations presented in the comment (Fig. 2 of Cazorla_Comment_2018 ) are incorrect because CE have not used appropriately sized simulation cells. CE’s description of the qualitative high- behaviour of -CaF2 is correspondingly incorrect. When adequately-sized simulation cells are used, we find that -CaF2 undergoes a high- superionic phase transition (Fig. 3), as predicted in our work Nelson_PRB_2017 . These results highlight the pitfalls of finite-size effects in molecular dynamics simulations and the importance of converging such simulations with respect to system size.
The QHA correctly predicts superionic phase transitions in -CaF2 and in -CaF2. The discussion in Sec. III, and references therein, makes it clear that this is a very general conclusion, and demonstrates the utility of the QHA in identifying superionic behaviour.
References
- (1) J. R. Nelson, R. J. Needs, and C. J. Pickard, Phys. Rev. B 95, 054118 (2017).
- (2) C. J. Pickard and R. J. Needs, J. Phys.: Condens. Matter 23, 053201 (2011).
- (3) A. Haase and G. Brauer, Zeit. für anorg. und allgemeine Chem. 441, 181 (1978).
- (4) H. P. Beck, J. Sol. State Chem. 47, 328 (1983).
- (5) C. Cazorla and D. Errandonea, Phys. Rev. B 98, 186101 (2018).
- (6) P. W. Mirwald and G. C. Kennedy, J. Phys. Chem. Sol. 41, 1157 (1980).
- (7) N. P. Schieber, E. C. Dybeck, and M. R. Shirts, J. Chem. Phys. 148, 144104 (2018).
- (8) S. Hull, Rep. Prog. Phys. 67, 1233 (2004).
- (9) H. Matzke, J. Mater. Sci. 5, 831 (1970).
- (10) J. Hutter, M. Iannuzzi, F. Schiffmann, and J. VandeVondele, WIREs Comput. Mol. Sci. 4, 15-25 (2014).
- (11) J. P. Perdew, K. Burke, and M. Ernzerhof, Phys. Rev. Lett. 77, 3865-3868 (1996); Phys. Rev. Lett. 78, 1396 (1997); Phys. Rev. Lett. 80, 891 (1998).
- (12) S. Goedecker, M. Teter, and J. Hutter, Phys. Rev. B 54, 1703 (1996).
- (13) C. Hartwigsen, S. Goedecker, and J. Hutter, Phys. Rev. B 58, 3641 (1998).
- (14) M. Krack, Theor. Chem. Acc. 114, 145 (2005).
- (15) J. VandeVondele and J. Hutter, J. Chem. Phys. 127, 114105 (2007).
- (16) J. R. Nelson, R. J. Needs, and C. J. Pickard, Phys. Rev. B in press (2018).
- (17) L. L. Boyer, Phys. Rev. Lett. 45 1858 (1980).
- (18) L. L. Boyer, Ferroelectrics 35, 83-88 (1981).
- (19) G. A. Samara, Sol. St. Phys. 38, 1-80 (1984).
- (20) L. X. Zhou, J. R. Hardy, and H. Z. Cao, Sol. State Comm. 98, 341 (1996).
- (21) K. Wakamura, Phys. Rev. B 56, 11593 (1997).
- (22) K. Wakamura, Phys. Rev. B 59, 3560 (1999).
- (23) M. K. Gupta, P. Goel, R. Mittal, N. Choudhury, and S. L. Chaplot, Phys. Rev. B 85, 184304 (2012).
- (24) J. Buckeridge, D. O. Scanlon, A. Walsh, C. R. A. Catlow, and A. A. Sokol, Phys. Rev. B 87, 214304 (2013).
- (25) P. S. Ghosh, A. Arya, G. K. Dey, N. Kuganathan and R. W. Grimes, Phys. Chem. Chem. Phys. 18, 31494-31504 (2016).
- (26) S. Roychowdhury, M. K. Jana, J. Pan, S. N. Guin, D. Sanyal, U. V. Waghmare, and K. Biswas, Angew. Chem. Int. Ed. 57, 4043 (2018).
- (27) C. Herzig, Ber. Bunsenges. Phys. Chem. 93, 1247 (1989).
- (28) J. Marian, B. D. Wirth, A. Caro, B. Sadigh, G. R. Odette, J. M. Perlado, and T. Diaz de la Rubia, Phys. Rev. B 65, 144102 (2002).
- (29) L. L. Boyer, Ferroelectrics 111, 63-69 (1990).
- (30) L. L. Boyer, Sol. St. Ionics 5, 581-583 (1981).
- (31) M. Makur and S. Ghosh, phys. stat. sol. (b) 173, 545-560 (1992).
- (32) Y. Zhao and L. L. Daemen, J. Am. Chem. Soc. 134 15042-15047 (2012).
- (33) W. Bührer and P. Brüesch, Sol. State Comm. 16, 155-158 (1975).
- (34) K. Schmalzl, Phys. Rev. B 75, 014306 (2007).
- (35) M.-H. Chen, A. Emly, and A. Van der Ven, Phys. Rev. B 91, 214306 (2015).
- (36) Y. H. Han, H. B. Wang, I. A. Troyan, C. X. Gao, and M. I. Eremets, J. Chem. Phys. 140, 044708 (2014).
- (37) Y. Li, L. J. Zhang, T. Cui, Y. W. Li, Y. Wang, Y. M. Ma, and G. T. Zou, J. Phys.: Condens. Mat. 20, 195218 (2008).
- (38) S. A. Danilkin, M. Yethiraj, and G. J. Kearley, J. Phys. Soc. Jpn. 79, 25-28 (2010).
- (39) B. B. Karki, R. M. Wentzcovitch, S. de Gironcoli and S. Baroni, Geophys. Research. Lett. 28, 2699-2702 (2001).
- (40) R. M. Wentzcovitch, B. B. Karki, M. Cococcioni, and S. de Gironcoli, Phys. Rev. Lett. 92, 018501 (2004).