33email: b.tercero@oan.es; [s.cuadrado;jose.cernicharo]@csic.es
Chemical segregation of complex organic O-bearing species
in Orion KL††thanks: This paper makes use of the following ALMA data:
ADS/JAO.ALMA#2011.0.00009.SV. ALMA is a partnership of
ESO (representing its member states), NSF (USA), and NINS (Japan), together with NRC (Canada), NSC and ASIAA (Taiwan), and KASI (Republic of Korea), in cooperation with the Republic of Chile. The Joint ALMA Observatory is operated by ESO, AUI/NRAO, and NAOJ.
We investigate the chemical segregation of complex O-bearing species (including the largest and most complex ones detected to date in space) towards Orion KL, the closest high-mass star-forming region. The molecular line images obtained using the ALMA science verification data reveal a clear segregation of chemically related species depending on their different functional groups. We map the emission of 13CH3OH, HCOOCH3, CH3OCH3, CH2OCH2, CH3COOCH3, HCOOCH2CH3, CH3CH2OCH3, HCOOH, OHCH2CH2OH, CH3COOH, CH3CH2OH, CH3OCH2OH, OHCH2CHO, and CH3COCH3 with 1.5′′ angular resolution and provide molecular abundances of these species toward different gas components of this region. We disentangle the emission of these species in the different Orion components by carefully selecting lines free of blending and opacity effects. Possible effects in the molecular spatial distribution due to residual blendings and different excitation conditions are also addressed. We find that while species containing the COC group, i.e. an ether group, exhibit their peak emission and higher abundance towards the compact ridge, the hot core south is the component where species containing a hydroxyl group (OH) bound to a carbon atom (COH) present their emission peak and higher abundance. This finding allows us to propose methoxy (CH3O) and hydroxymethyl (CH2OH) radicals as the major drivers of the chemistry in the compact ridge and the hot core south, respectively, as well as different evolutionary stages and prevailing physical processes in the different Orion components.
Key Words.:
Astrochemistry – Line: identification – ISM: abundances – ISM: clouds – ISM: molecules1 Introduction
Orion BN/KL (Becklin-Neugebauer / Kleinmann-Low) is the closest high-mass star-forming region ( 400 pc; Grossschedl et al. 2018; Kounkel et al. 2017; Menten et al. 2007) exhibiting several processes related to young stellar objects and high-mass star formation (see, e.g. Genzel & Stutzki 1989). This region is located at the core of the Orion Molecular Cloud 1 (OMC 1), which lies behind the Orion Nebula cluster (O’Dell 2001). The core of Orion KL contains at least three self-luminous objects (protostars), the compact H ii regions , , and ; these sources are within a region of 10′′ ( 0.02 pc). Their proper motions reveal that they are moving away from a common region (Gómez et al. 2005). Different scenarios, as well as the formation of high-mass stars, have been proposed to explain the complexity of this source. An explosion of a multi-star system (sources , , , and ) that took place 500 years ago (Gómez et al. 2005; Bally et al. 2017; Luhman et al. 2017; Rodríguez et al. 2017) has been proposed as the main factor responsible for most of Orion KL gas components (Zapata et al. 2011).
The different gas components show distinct physical and chemical properties. Classically, these components have been identified with single-dish telescopes by a characteristic systemic velocity (Blake et al. 1987; Schilke et al. 2001; Tercero et al. 2010): (i) hot core, a hot ( 200 300 K), dense clump rich in complex organic saturated N-bearing species such as CH3CH2CN, characterised by 5 15 km s-1 and 5 7 km s-1; (ii) extended ridge, the host, quiescent, and relatively cold ( 60 K) ambient cloud rich in simple species such as CS or HCN, emitting lines with 3 4 km s-1 and 8 9 km s-1; (iii) compact ridge, a warm ( 150 K), compact clump rich in organic saturated O-rich species such as HCOOCH3 or CH3OCH3, whose spectral features are characterised by 2 3 km s-1 and 7 8 km s-1; and (iv) plateau, molecular outflows presenting typical shock chemistry with molecules such as SO or SiO (Tercero et al. 2011; Goicoechea et al. 2015); here the low-velocity flow is characterised by lines with 20 km s-1 and 5 6 km s-1 (Bell et al. 2014), whereas the high-velocity flow presents lines with as wide as 150 km s-1 and 10 km s-1.
In the recent years, data from the last generation of telescopes have added further complexity to this region. Neill et al. (2013) and Crockett et al. (2014) noted that a component between hot core and compact ridge, called the hot core south ( 5 10 km s-1 and 6.5 8 km s-1) was required to correctly model the Herschel-HIFI emission of several molecules. In these works, this component was also revealed by mapping the emission of HDO, 13CH3OH, 13CH3CN, and HCOOCH3 using the ALMA Science Verification (SV) data. Moreover, Peng et al. (2012) previously noted that the strongest CH2DOH and CH3OH emissions come from the hot core south-west region with a velocity that is typical of the compact ridge.
This new component is especially important regarding the spatial distribution of the complex organic O-bearing molecules. A series of recent works based on interferometric data have demonstrated a clear spatial differentiation between the most complex O-bearing species detected in Orion KL. On the one hand, the following species (among others) emit from the compact ridge component: HCOOCH3 (Favre et al. 2011a; Widicus Weaver & Friedel 2012; Crockett et al. 2014; Tercero et al. 2015; Cernicharo et al. 2016), CH3OCH3 (Favre et al. 2011b; Widicus Weaver & Friedel 2012; Brouillet et al. 2013; Feng et al. 2015; Tercero et al. 2015; Cernicharo et al. 2016), CH3OH (Friedel & Widicus Weaver 2012; Peng et al. 2012; Neill et al. 2013; Feng et al. 2015; Tercero et al. 2015; Cernicharo et al. 2016), CH3CH2OCH3 (Tercero et al. 2015), HCOOCH2CH3 (Tercero et al. 2015), and CH2OCH2 (Cernicharo et al. 2016). On the other hand, complex organic O-rich species, whose major emission is associated with the hot core south, emit far away the compact ridge: CH3COCH3 (Widicus Weaver & Friedel 2012; Peng et al. 2013; Feng et al. 2015; Cernicharo et al. 2016), OHCH2CH2OH (Brouillet et al. 2015; Cernicharo et al. 2016; Favre et al. 2017), CH3COOH (Cernicharo et al. 2016; Favre et al. 2017), CH3CH2OH (Feng et al. 2015; Tercero et al. 2015; Cernicharo et al. 2016), and OHCH2CHO (Cernicharo et al. 2016). Favre et al. (2017) proposed that the rich molecular composition of the Orion core, which exhibits the emission peak of OHCH2CH2OH and CH3COOH, may reflect gas-phase chemistry in an induced shock or post-shock stage due to the impact of a bullet of matter ejected during the explosive event of Orion KL (Wright & Plambeck 2017).
Chemical segregation of complex organic molecules (COMs, Herbst & van Dishoeck 2009) in star-forming regions has been investigated concerning the spatial differentiation between the O- and N-bearing species (Peng et al. 2013; Öberg et al. 2013; Fayolle et al. 2015; Jiménez-Serra et al. 2016; Allen et al. 2017; Bergner et al. 2017; Suzuki et al. 2018). However, information about the spatial distribution of chemically related COMs is lacking, mostly due to the low abundances of the most complex species which prevent the detection of these species in the majority of star-forming regions. The identification of several O-bearing COMs in Orion KL allows us to investigate the spatial distribution of similar species (in terms of complexity and variety of atoms) but harbouring different chemical functional groups to test the COM formation and evolution.
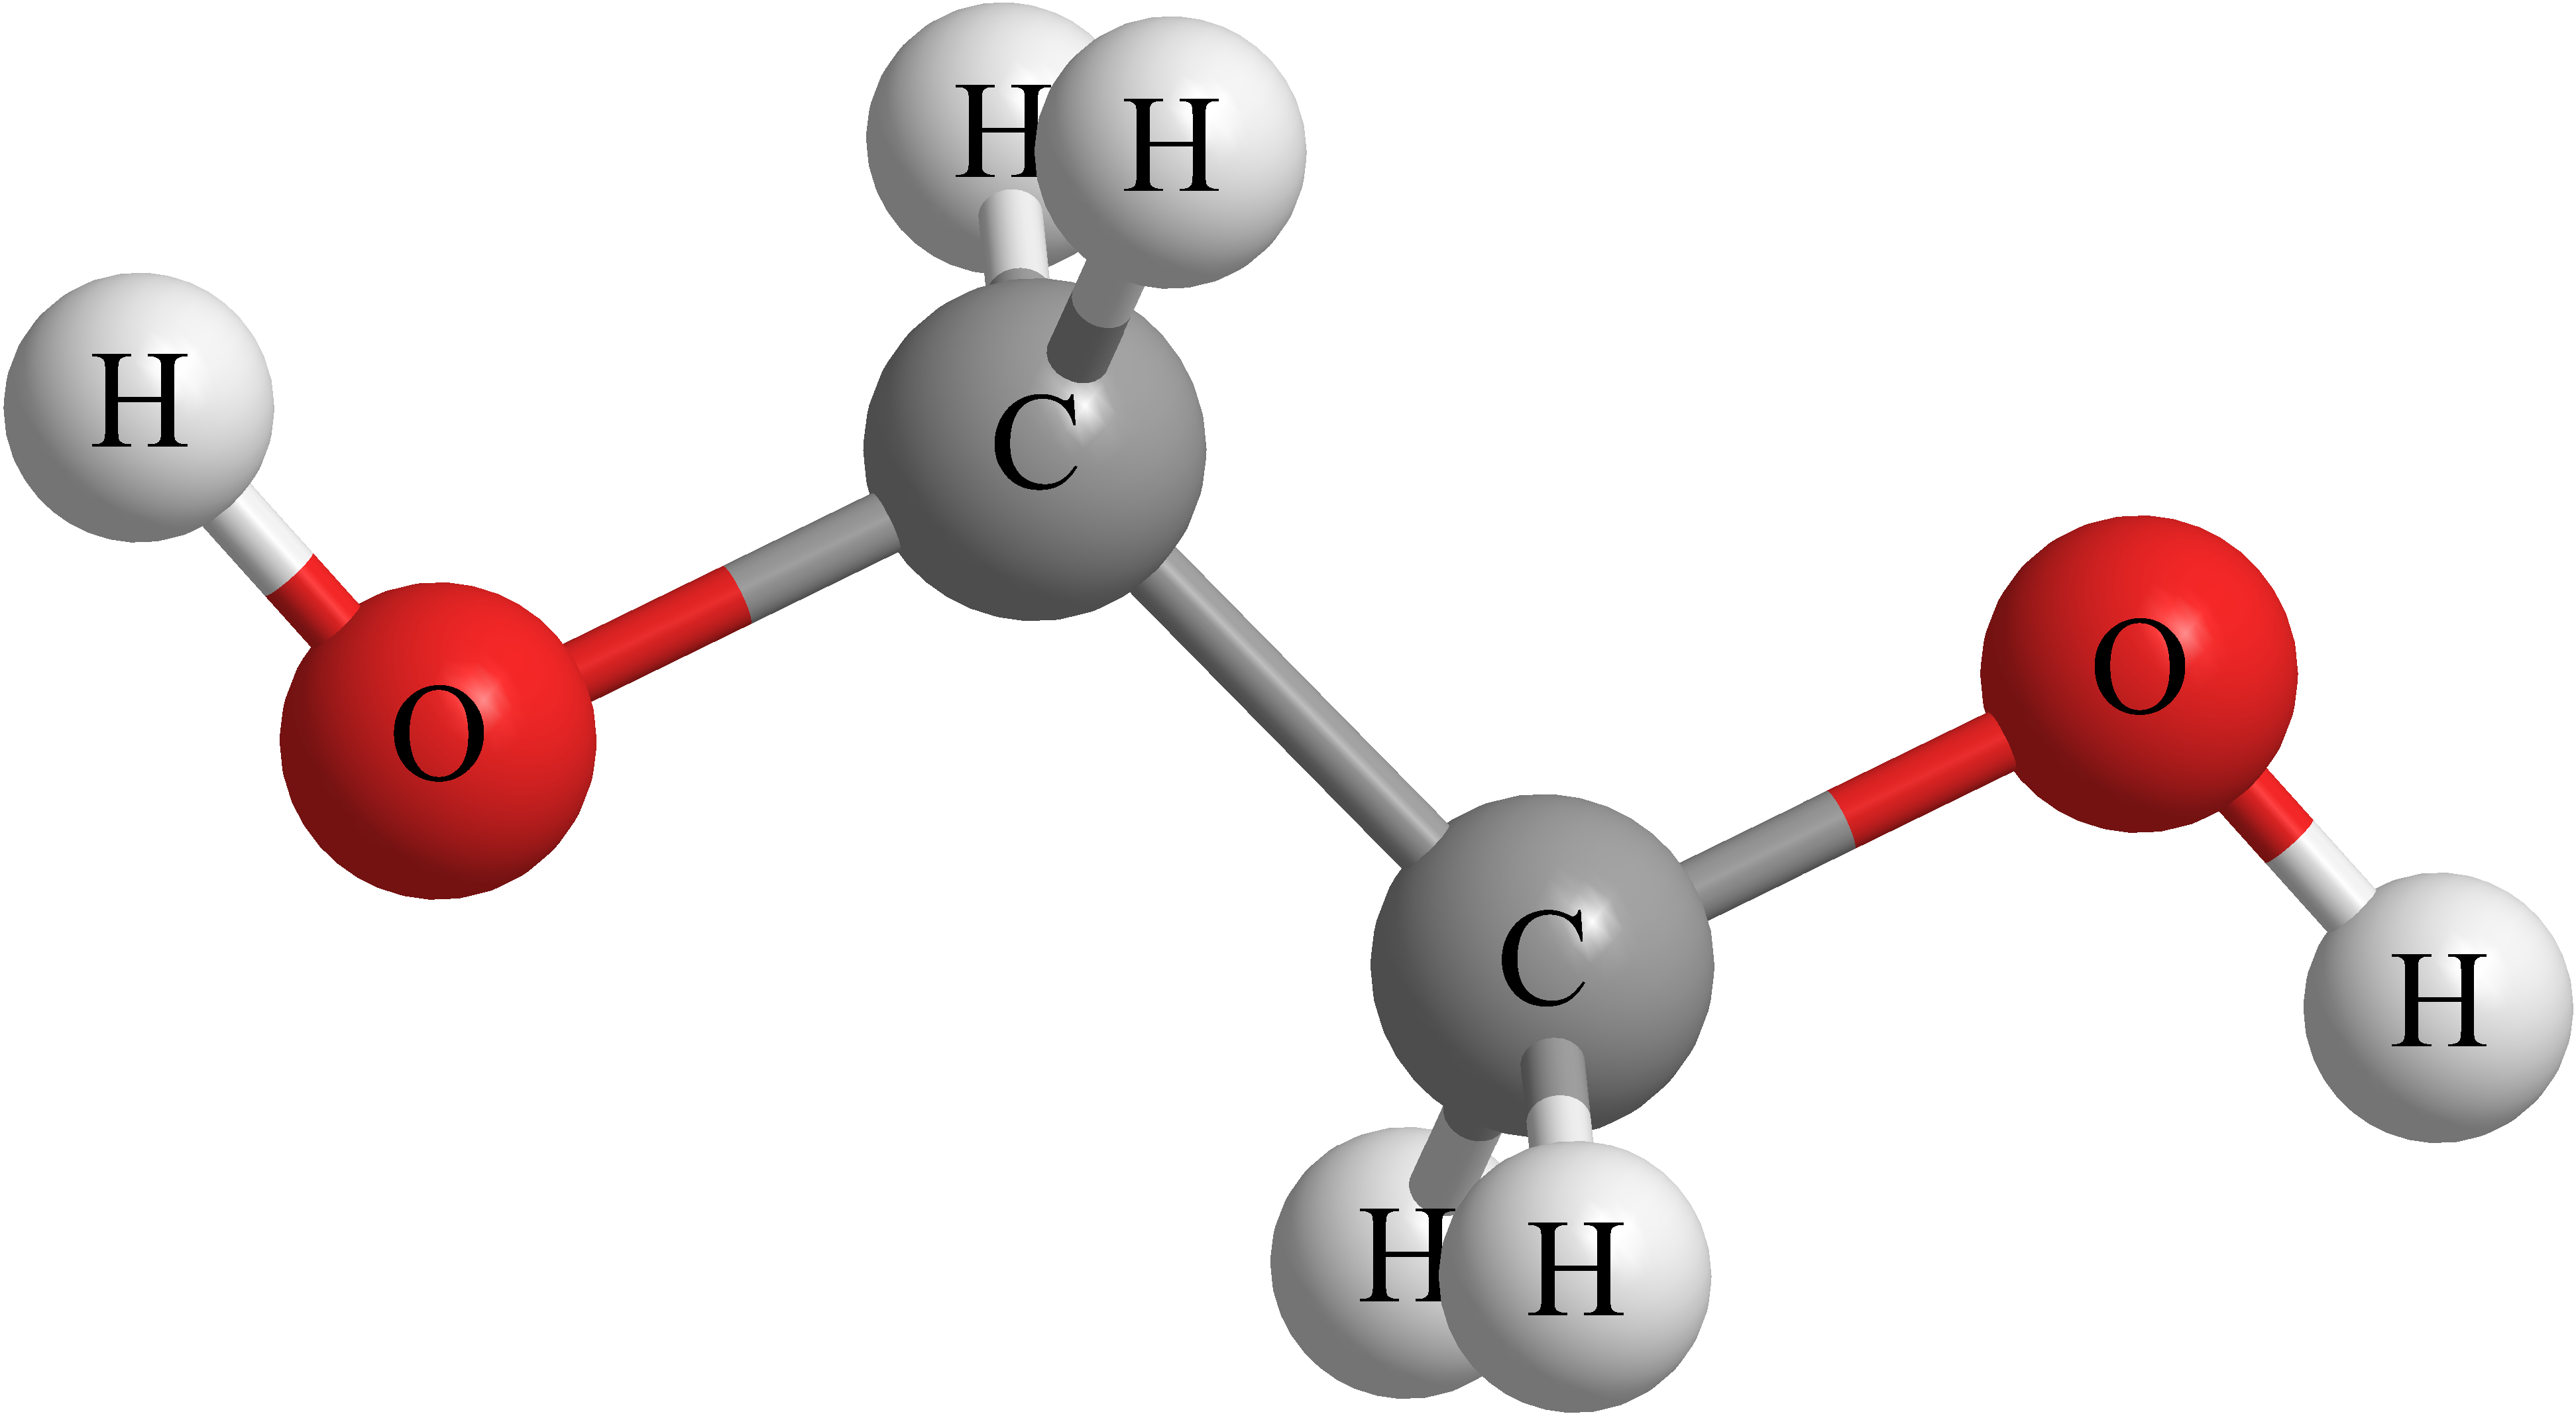
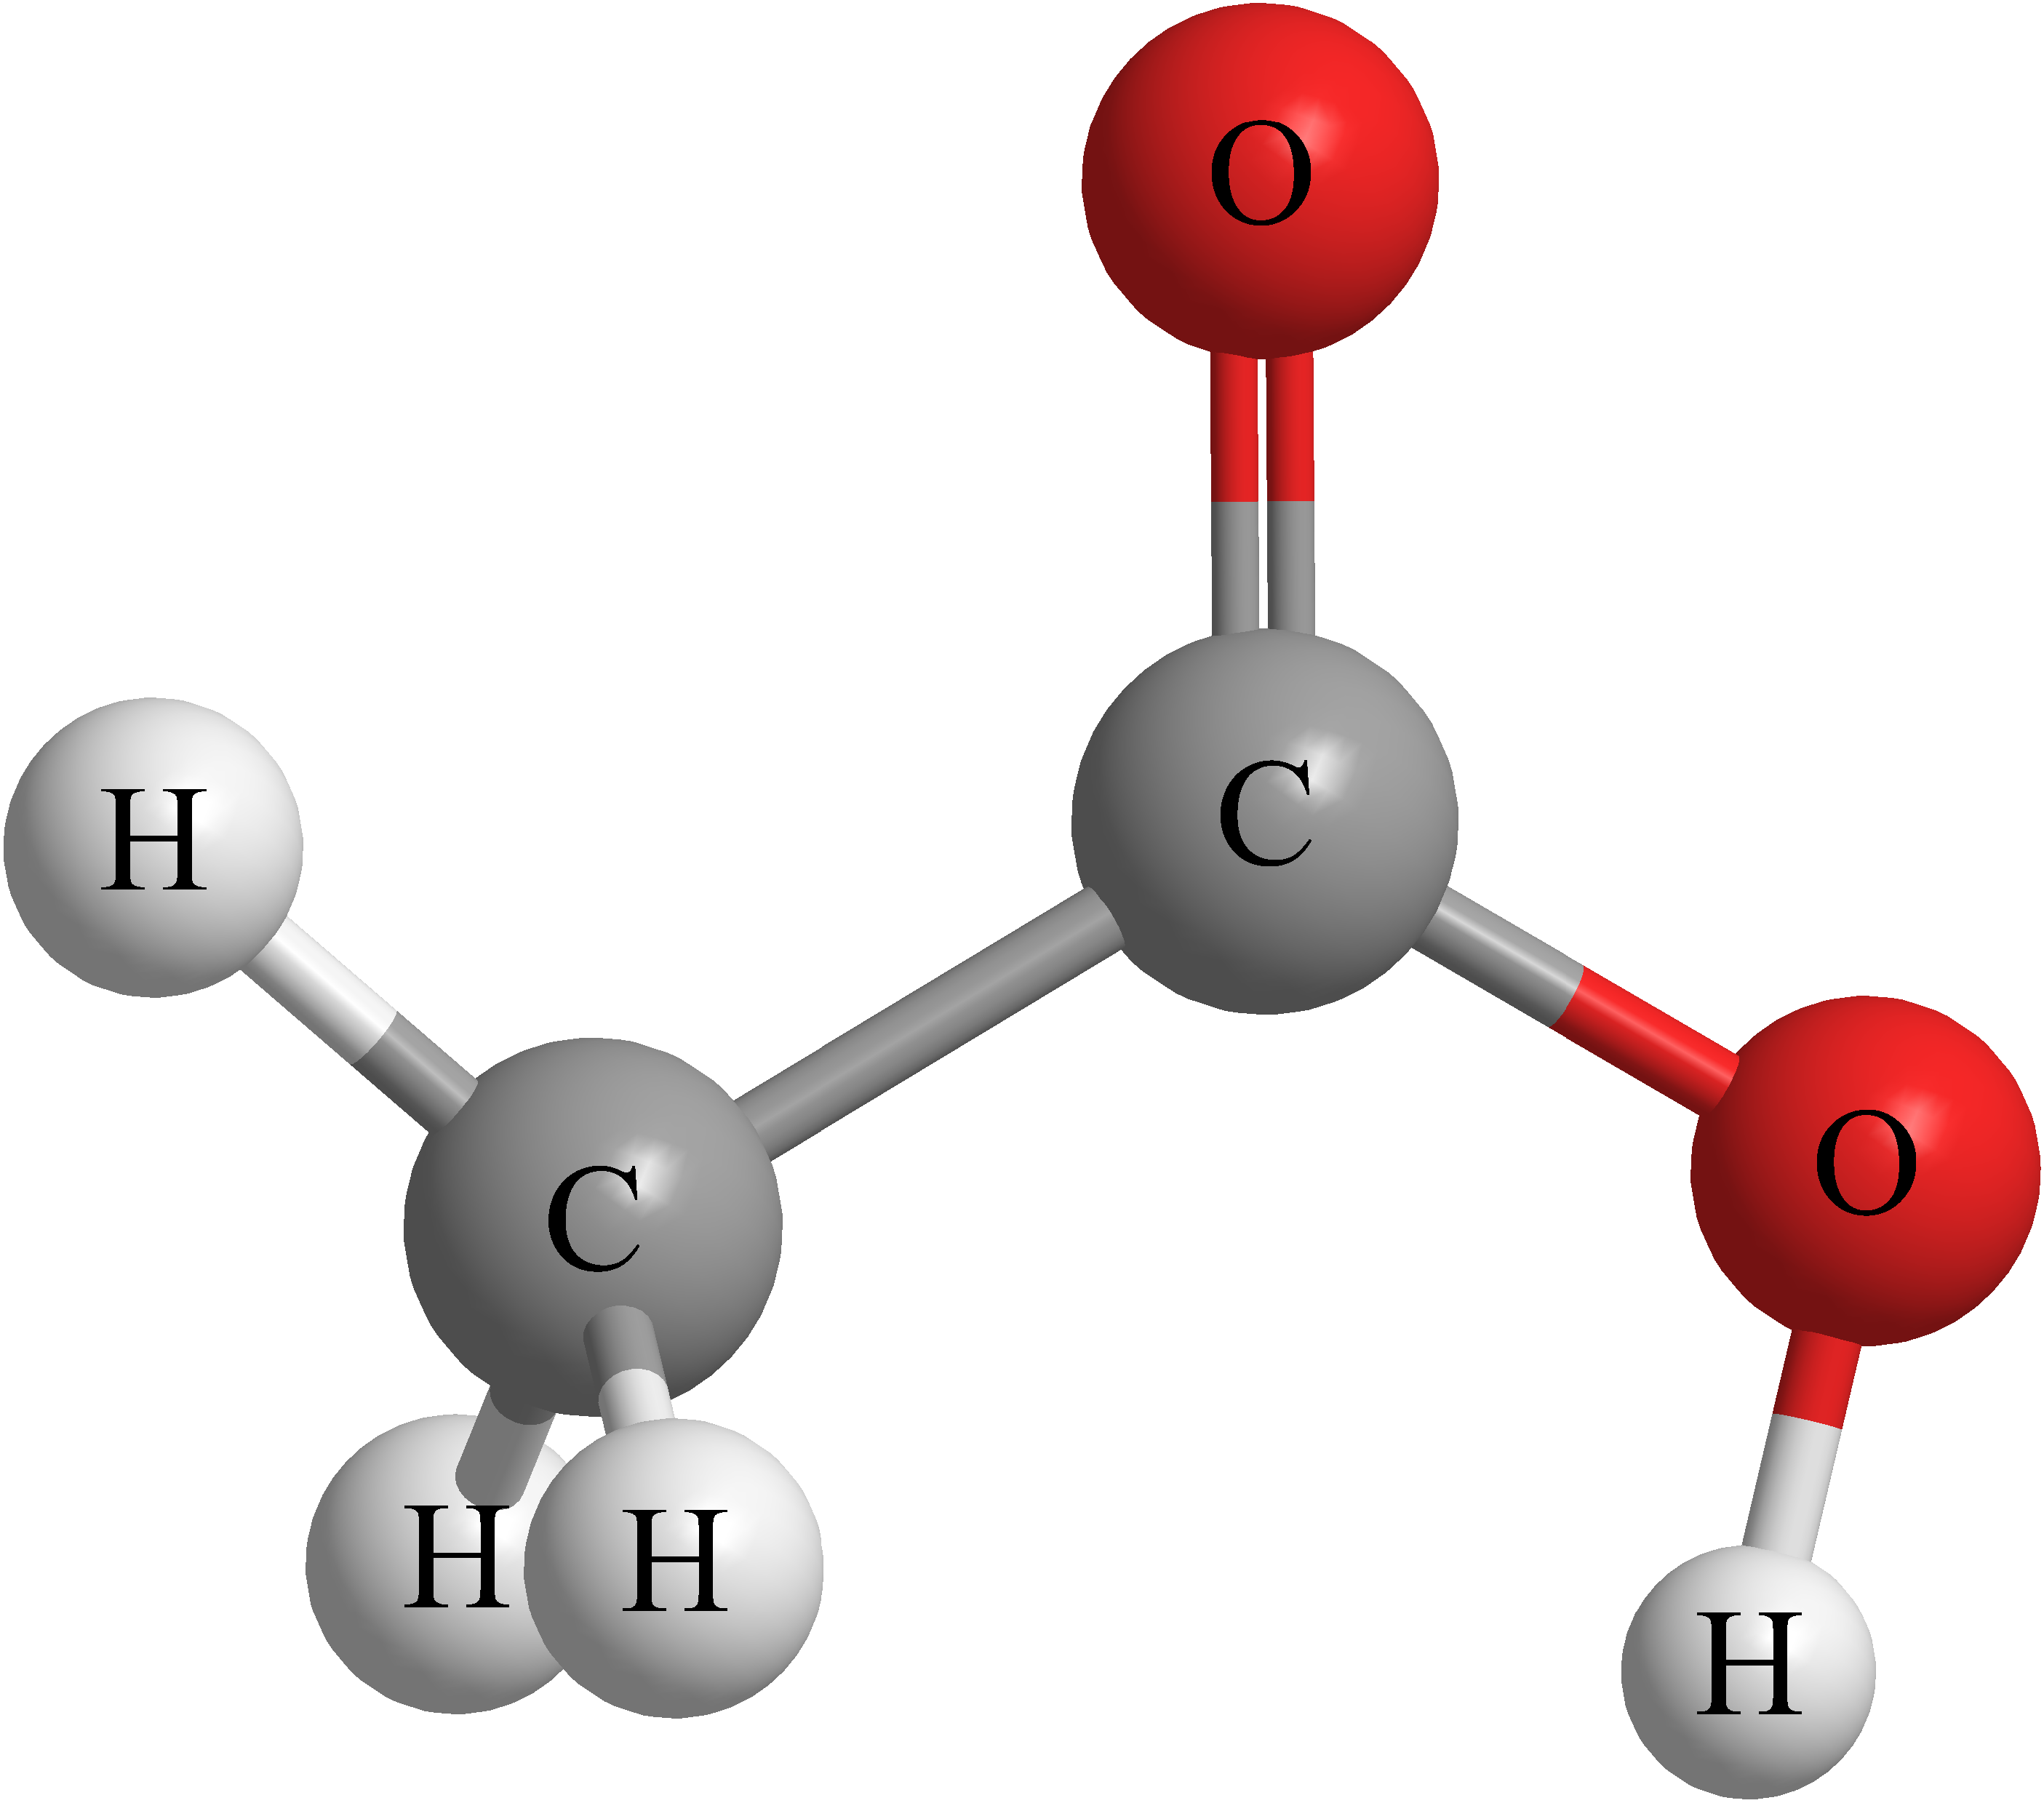
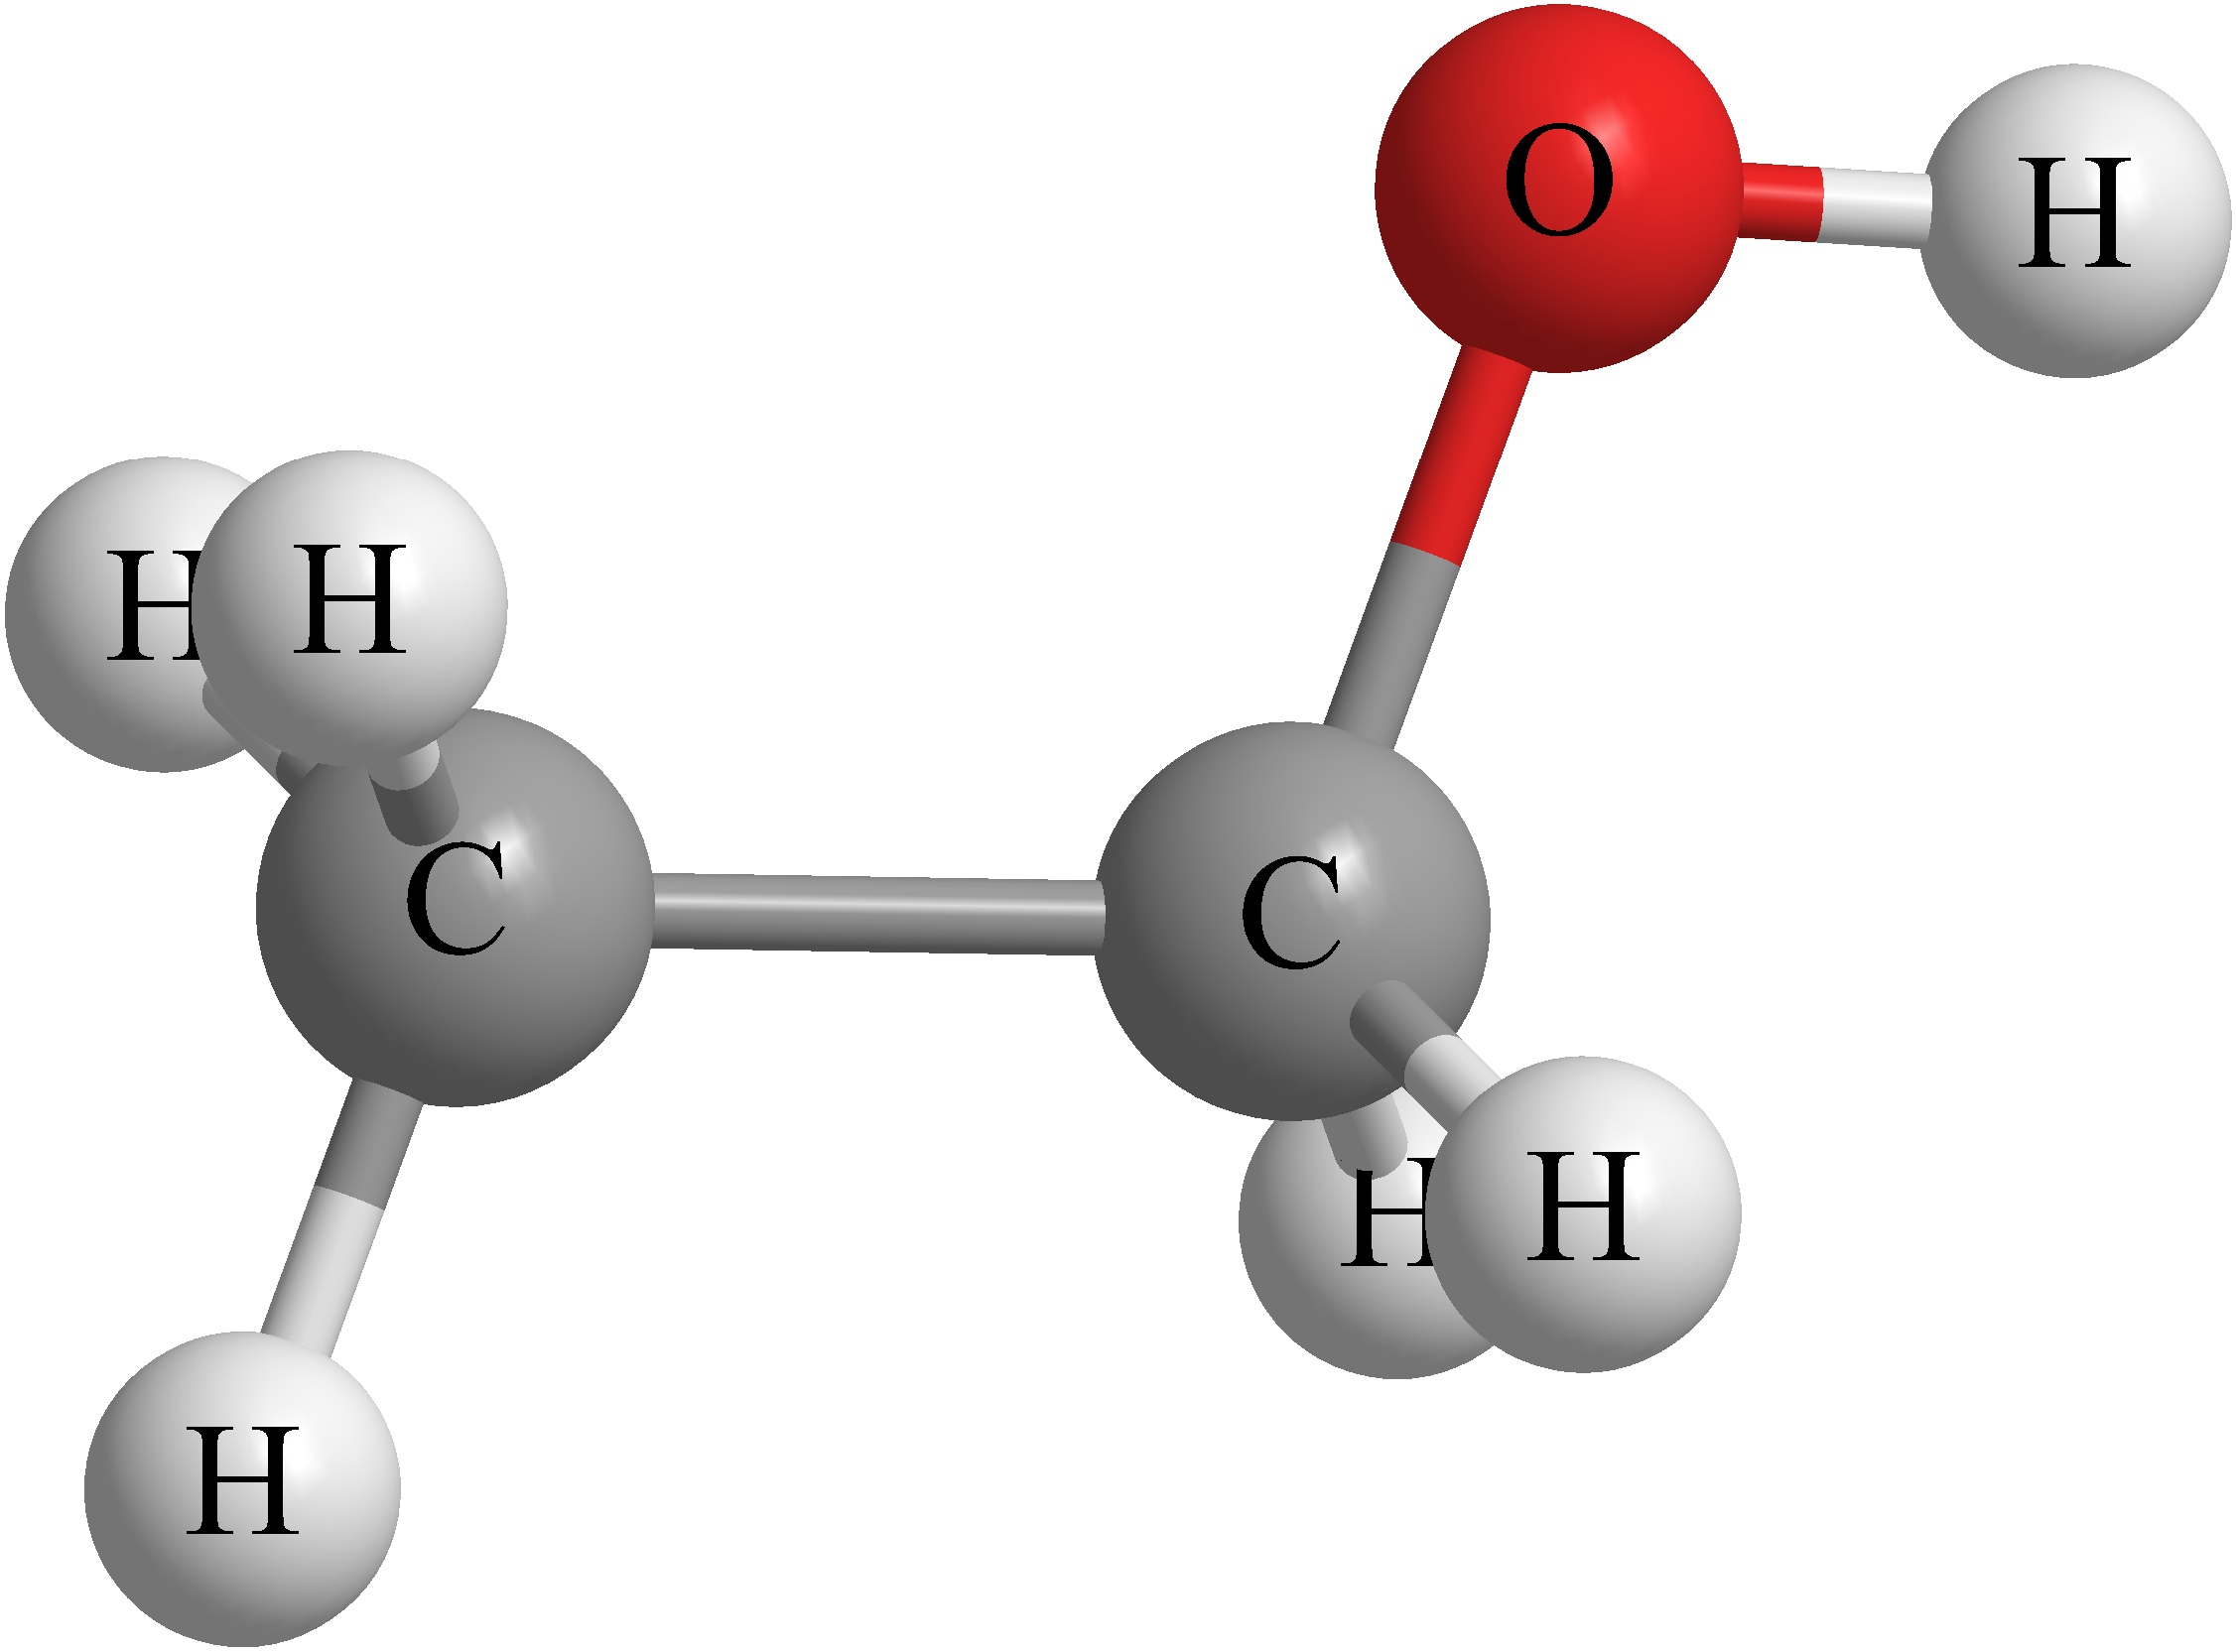
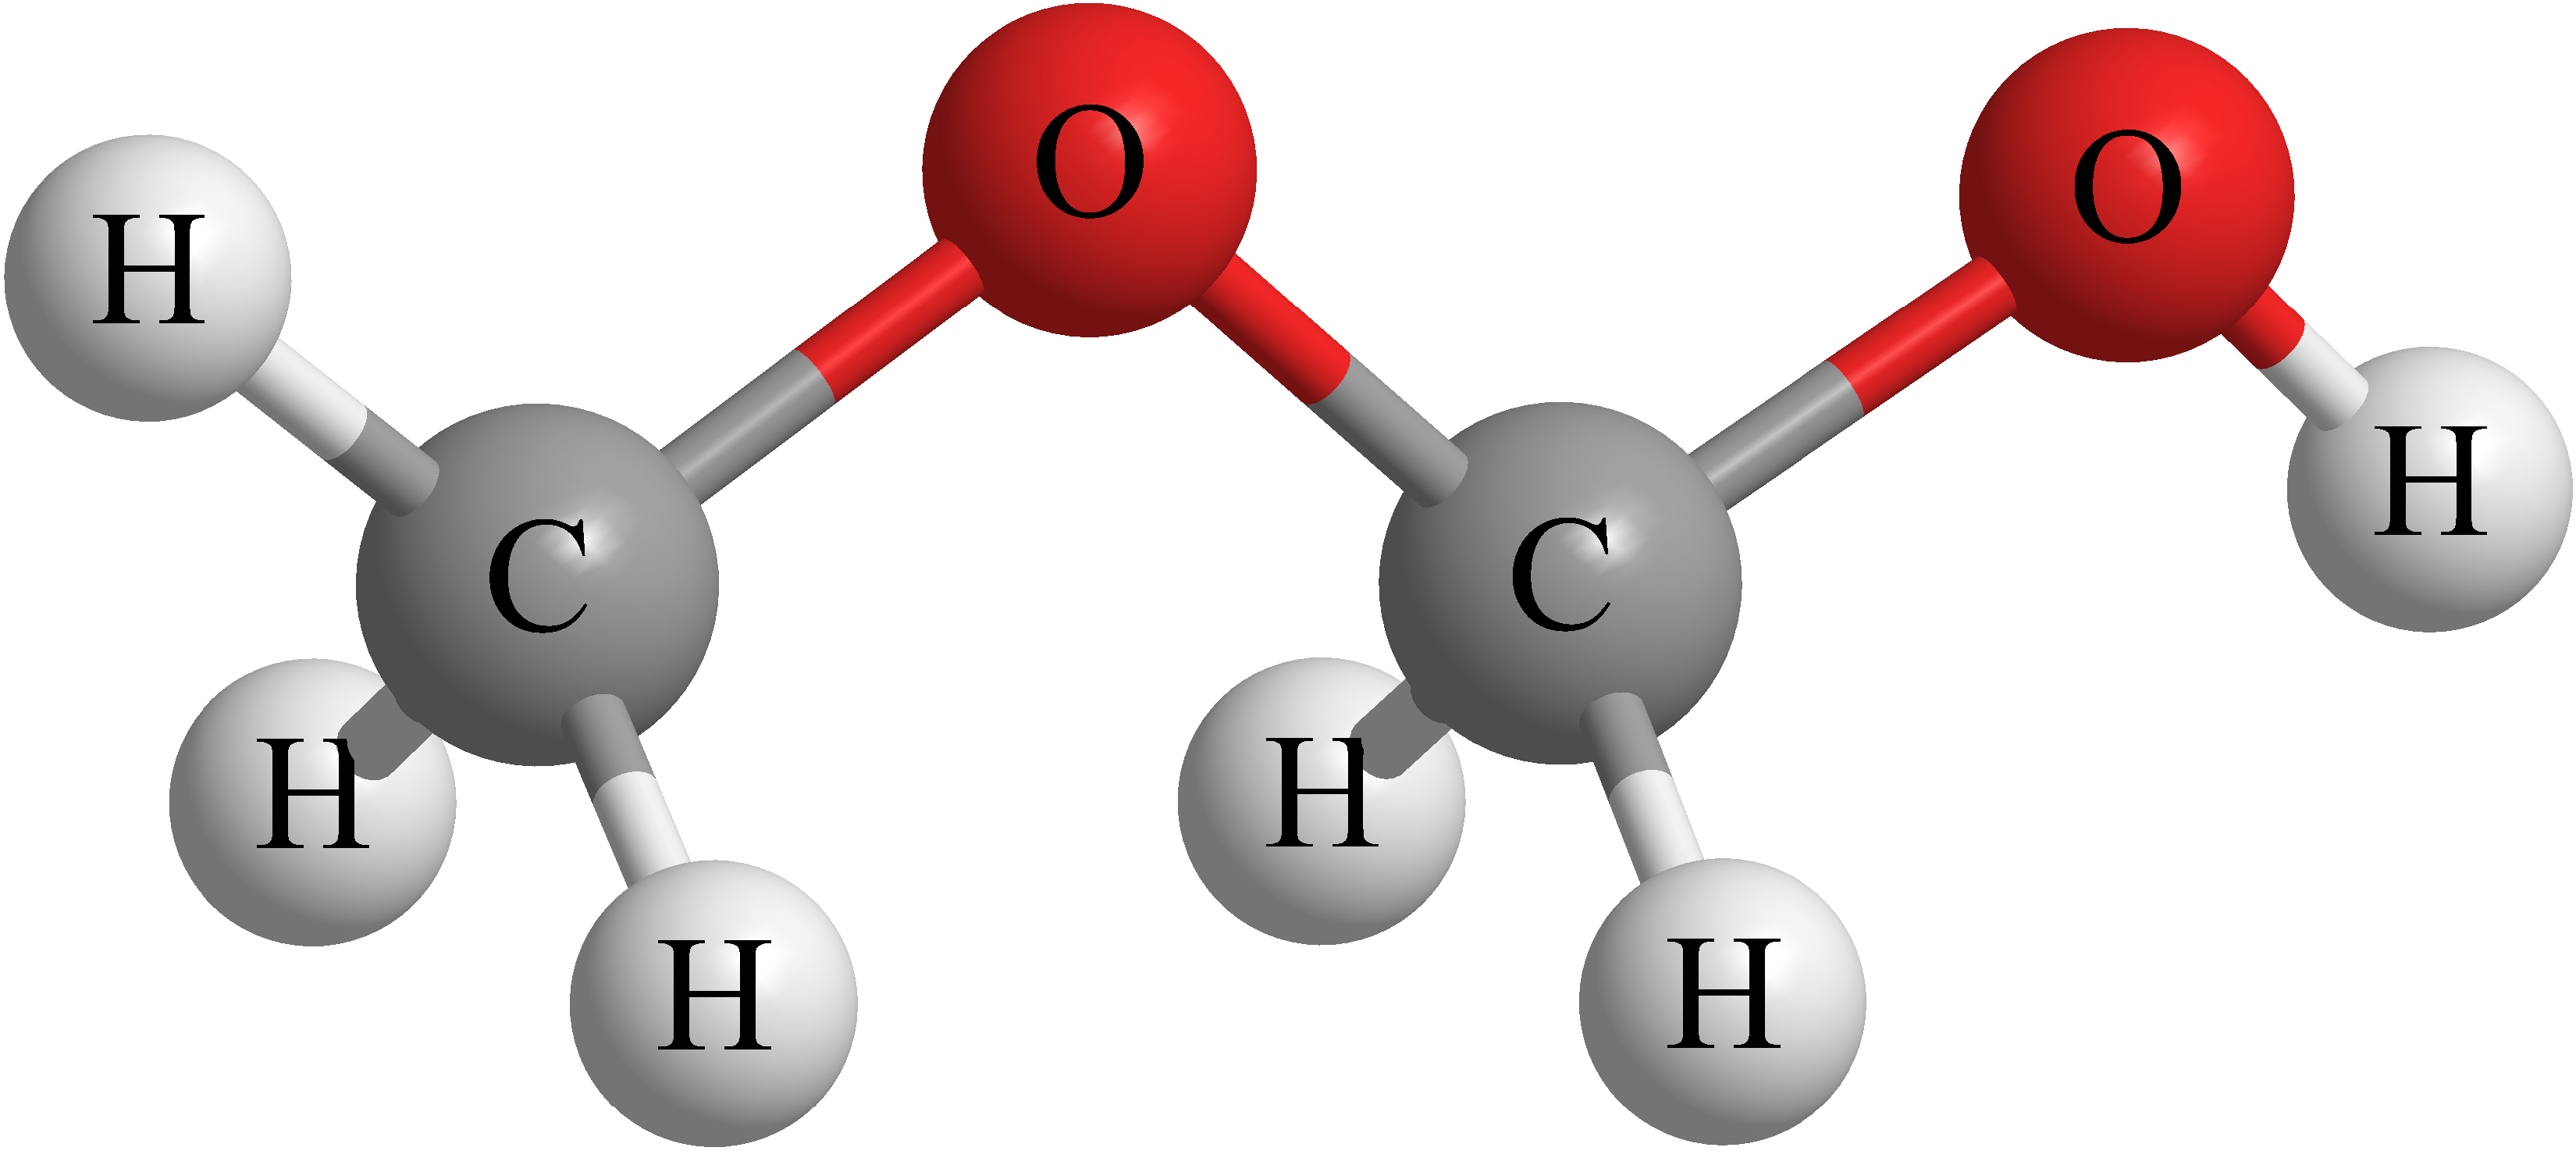
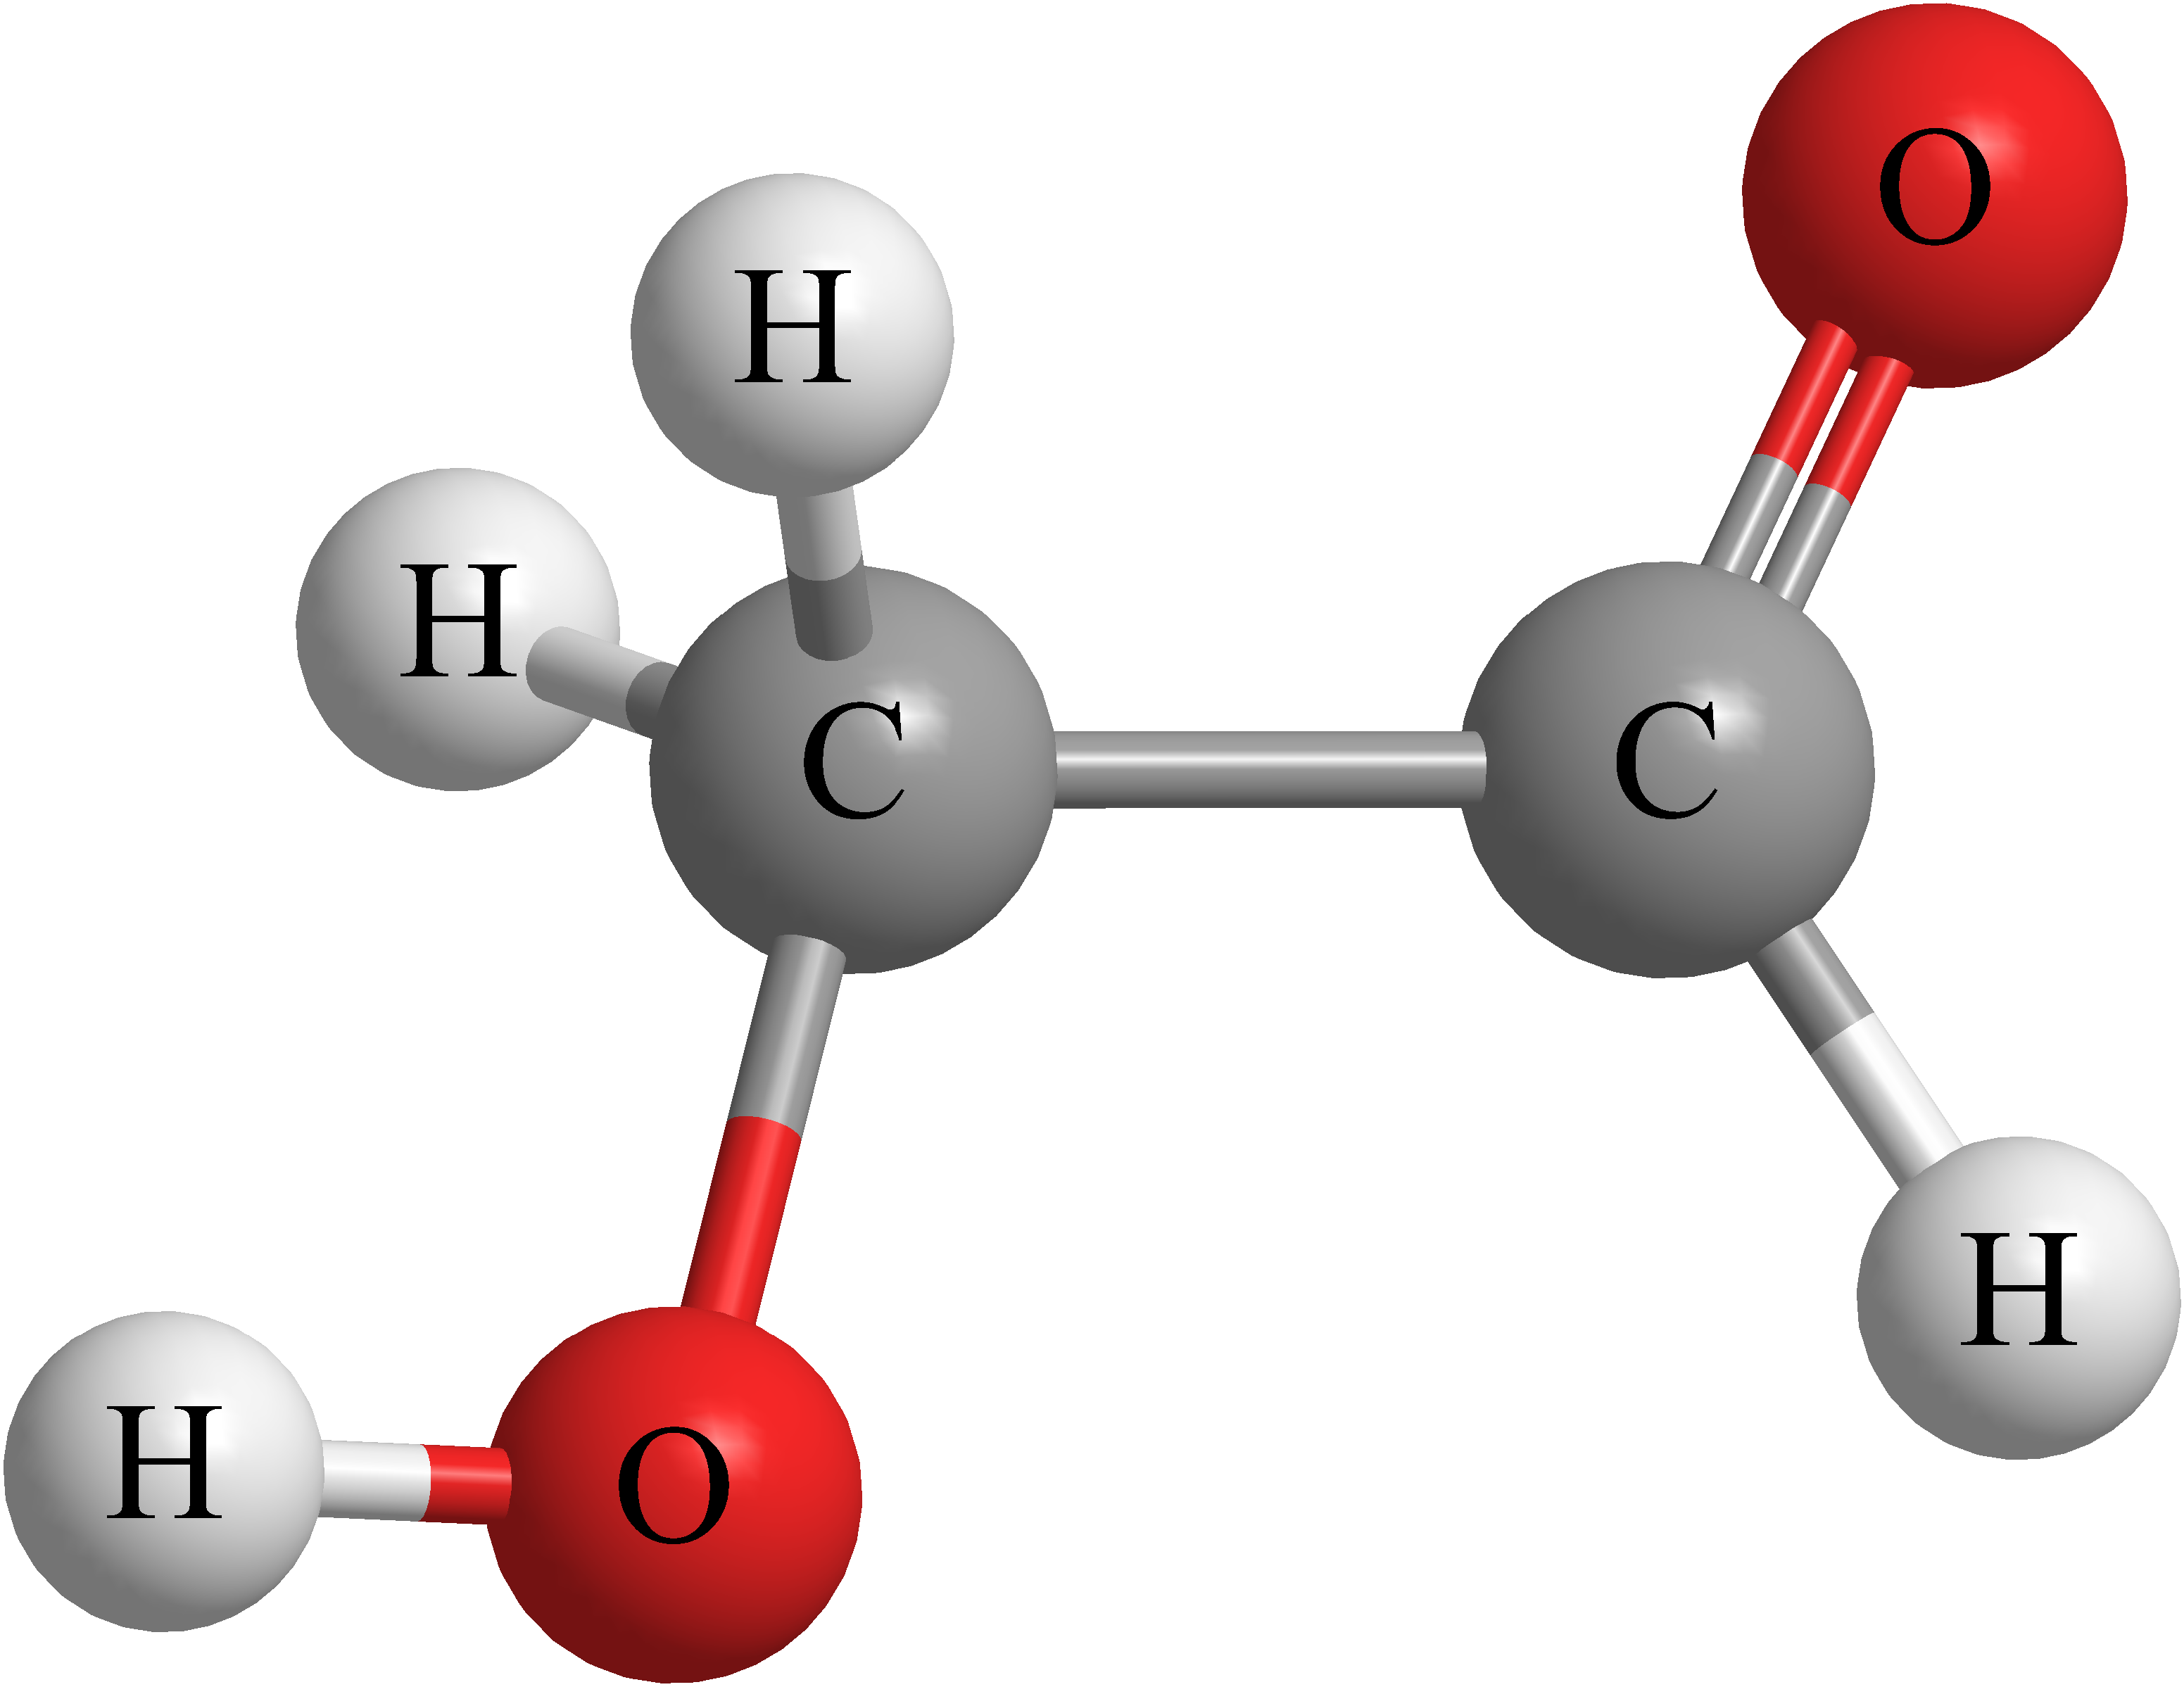
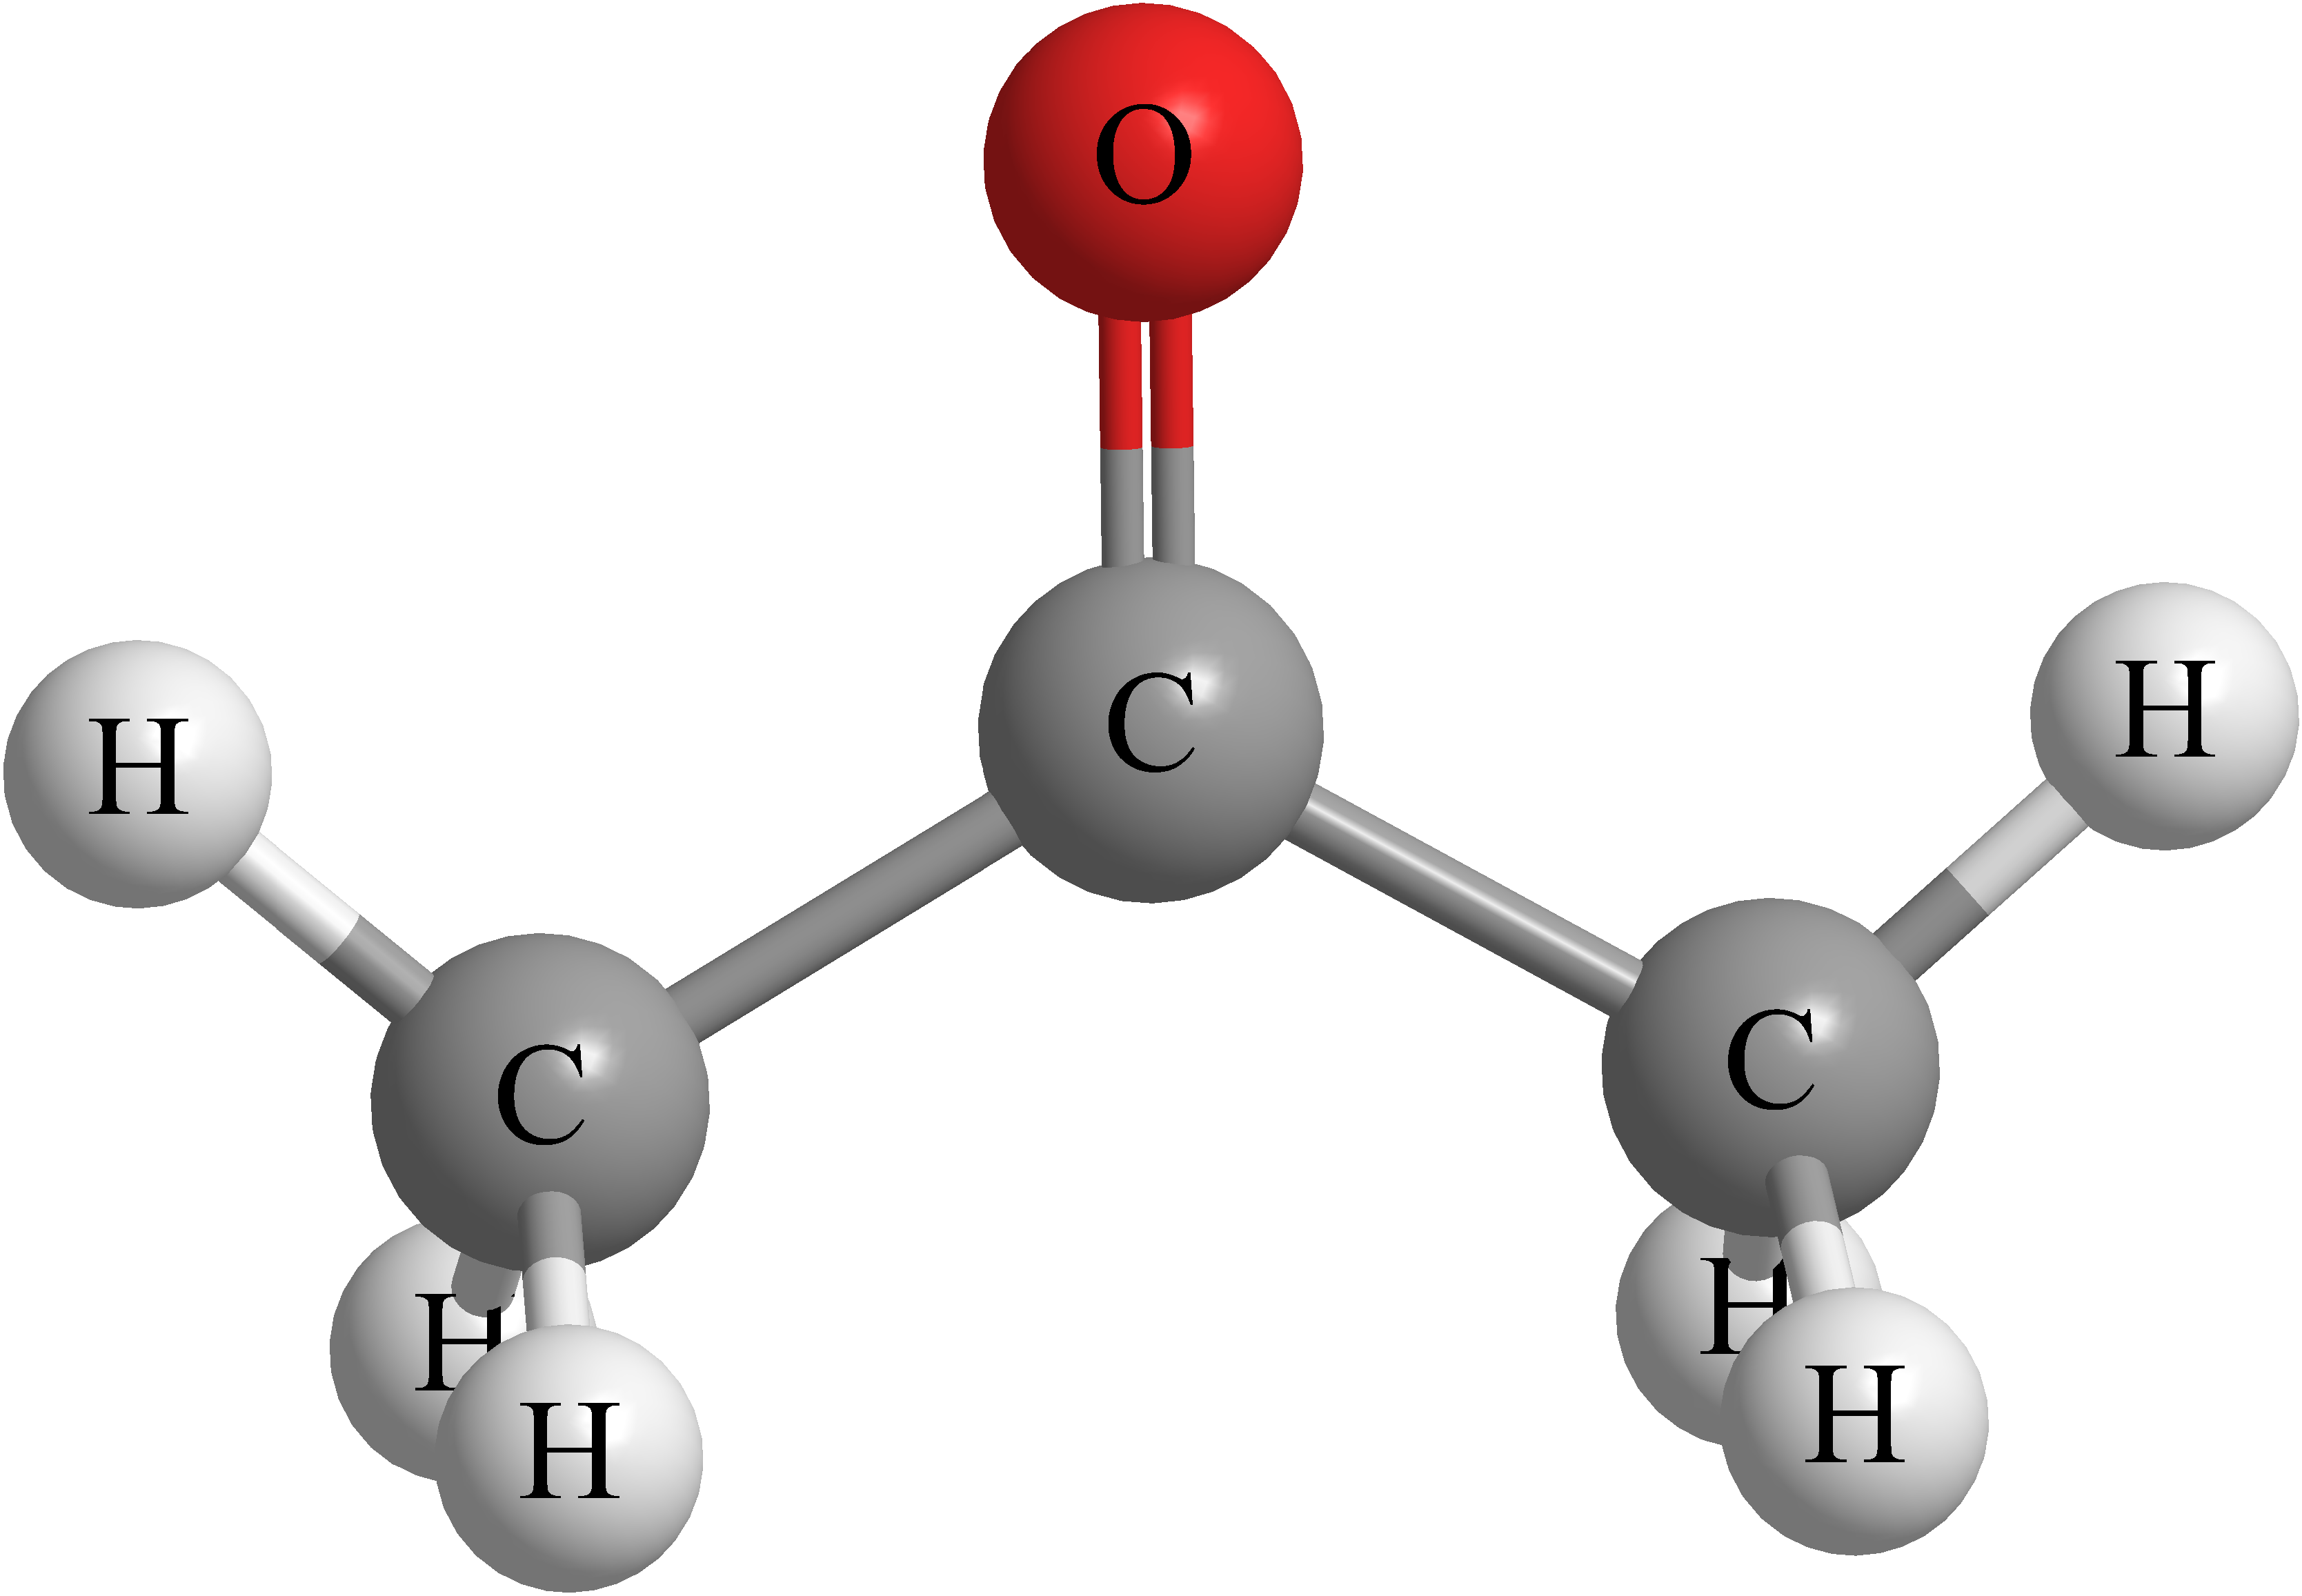
In this Letter we investigate the spatial distribution of O-bearing COMs and some related species detected in this source based on the ALMA SV data, including, for the first time, the largest and most complex O-bearing COMs detected to date in space (Sect. 3): 13CH3OH (methanol), HCOOCH3 (methyl formate), CH3OCH3 (dimethyl ether), CH2OCH2 (oxirane), CH3COOCH3 (methyl acetate), HCOOCH2CH3 (ethyl formate), CH3CH2OCH3 (ethyl methyl ether), HCOOH (formic acid), OHCH2CH2OH (ethylene glycol), CH3COOH (acetic acid), CH3CH2OH (ethanol), CH3OCH2OH (methoxymethanol), OHCH2CHO (glycolaldehyde), and CH3COCH3 (acetone). In addition, molecular abundances have been derived for all these species in different regions of Orion. Finally, we discuss the observed chemical differentiation in Sect. 4.
2 Observations
The ALMA Science Verification (SV) data111http://almascience.eso.org/almadata/sciver/OrionKLBand6/ were taken in January 2012 towards the IRc2 region in Orion. The observations were carried out with 16 antennas of 12 m in the frequency range from 213.715 GHz to 246.627 GHz (Band 6). The primary beam was 27′′. Spectral resolution was 0.488 MHz ( 0.64 km s-1 in the observed frequency range). The observations were centred on = 05h 35m 14.35s, = 05∘ 22′ 35.00′′. The CASA software222http://casa.nrao.edu was used for initial processing, and then the visibilities were exported to the GILDAS package333http://www.iram.fr/IRAMFR/GILDAS for further analysis. The line maps were cleaned using the HOGBOM algorithm (Högbom 1974). The synthesised beam ranged from 2.00′′ 1.48′′ with a position angle (PA) of 176∘ at 214.0 GHz to 1.75′′ 1.29′′ with a PA of 164∘ at 246.4 GHz. The brightness temperature to flux density conversion factor is 9 K for 1 Jy per beam. The continuum emission was subtracted in the maps by carefully selecting line-free channels.


3 Results
Several O-bearing COMs have been identified towards different Orion components. In this work we study the most complex ones together with some related species: alcohols, 13CH3OH, CH3CH2OH, OHCH2CH2OH, and CH3OCH2OH; ethers, CH3OCH3, CH2OCH2, and CH3CH2OCH3; ketones, CH3COCH3; aldehydes, OHCH2CHO (only tentatively detected); esters, HCOOCH3, HCOOCH2CH3, and CH3COOCH3; and carboxylic acids, HCOOH and CH3COOH. We have detected methoxymethanol for the first time in Orion (for laboratory spectroscopy of methoxymethanol see Motiyenko et al. 2018) and the second in interstellar medium (McGuire et al. 2017).
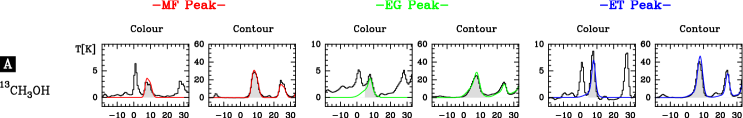
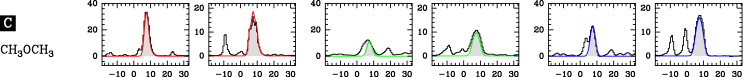
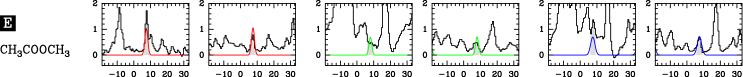
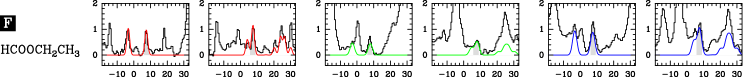
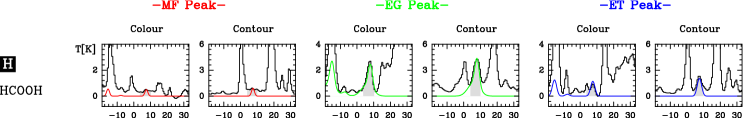
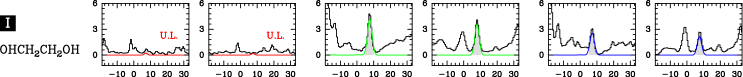
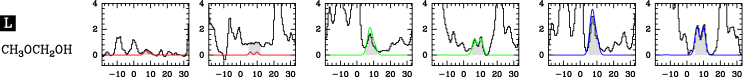
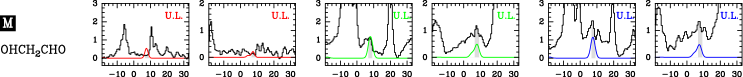
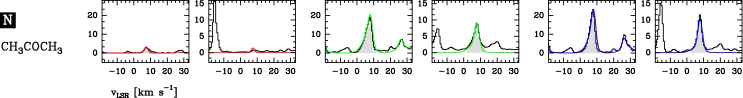
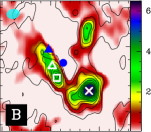
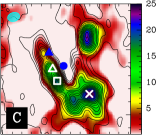
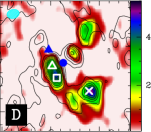
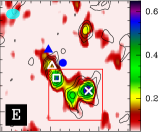
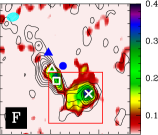
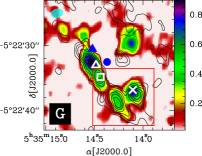
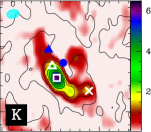
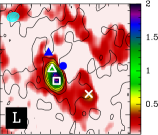
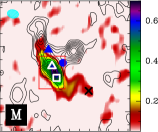
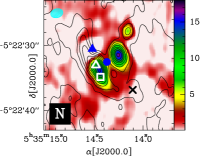
Owing to the high spatial resolution of the ALMA SV data that distinguishes between the contributions from the different cores of Orion, we constrained the spatial distributions of these species and their abundances. To perform the ALMA maps, we selected two transitions of each of these species that arise free of blending with other species in the Orion KL cores (see Table 1 and Fig. 3). When possible, the two selected transitions have large differences in the energy of the upper level state. Then, for each species, the spatial distribution of the integrated line emission of the two selected lines was overlapped by depicting it in different visual scales (colour and contours; see Fig. 1). Doing so, we addressed possible effects in the spatial distribution related to different excitation conditions and potential blendings of the lines with other species in the different components.
Moreover, to limit opacity effects in the emission distribution of the most abundant species, we mapped -type transitions of 13CH3OH and -type transitions of HCOOCH3 (those associated with the lowest dipole moment of each species). Despite the lack of short spacing data required for completion of the possible extended emission of some of these species (see e.g. 13CH3OH or HCOOH), we obtain an overview of the main cores that host the studied species.
We note the coincidence in the emission peaks between colour and contour scales for most of the species (see Fig. 1). Only for the less abundant species are there some regions which exhibit emission only in one of the depicted lines due to light blendings with other molecular species in a particular region of the cloud (see Table 1 and Fig. 3). In those cases (CH3COOCH3, HCOOCH2CH3, CH3CH2OCH3, and OHCH2CHO) we assumed only the overlapping areas (colour + contours) as the emitting regions for these species (emission confined inside red rectangles in Fig. 1).
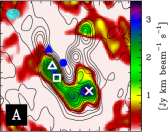
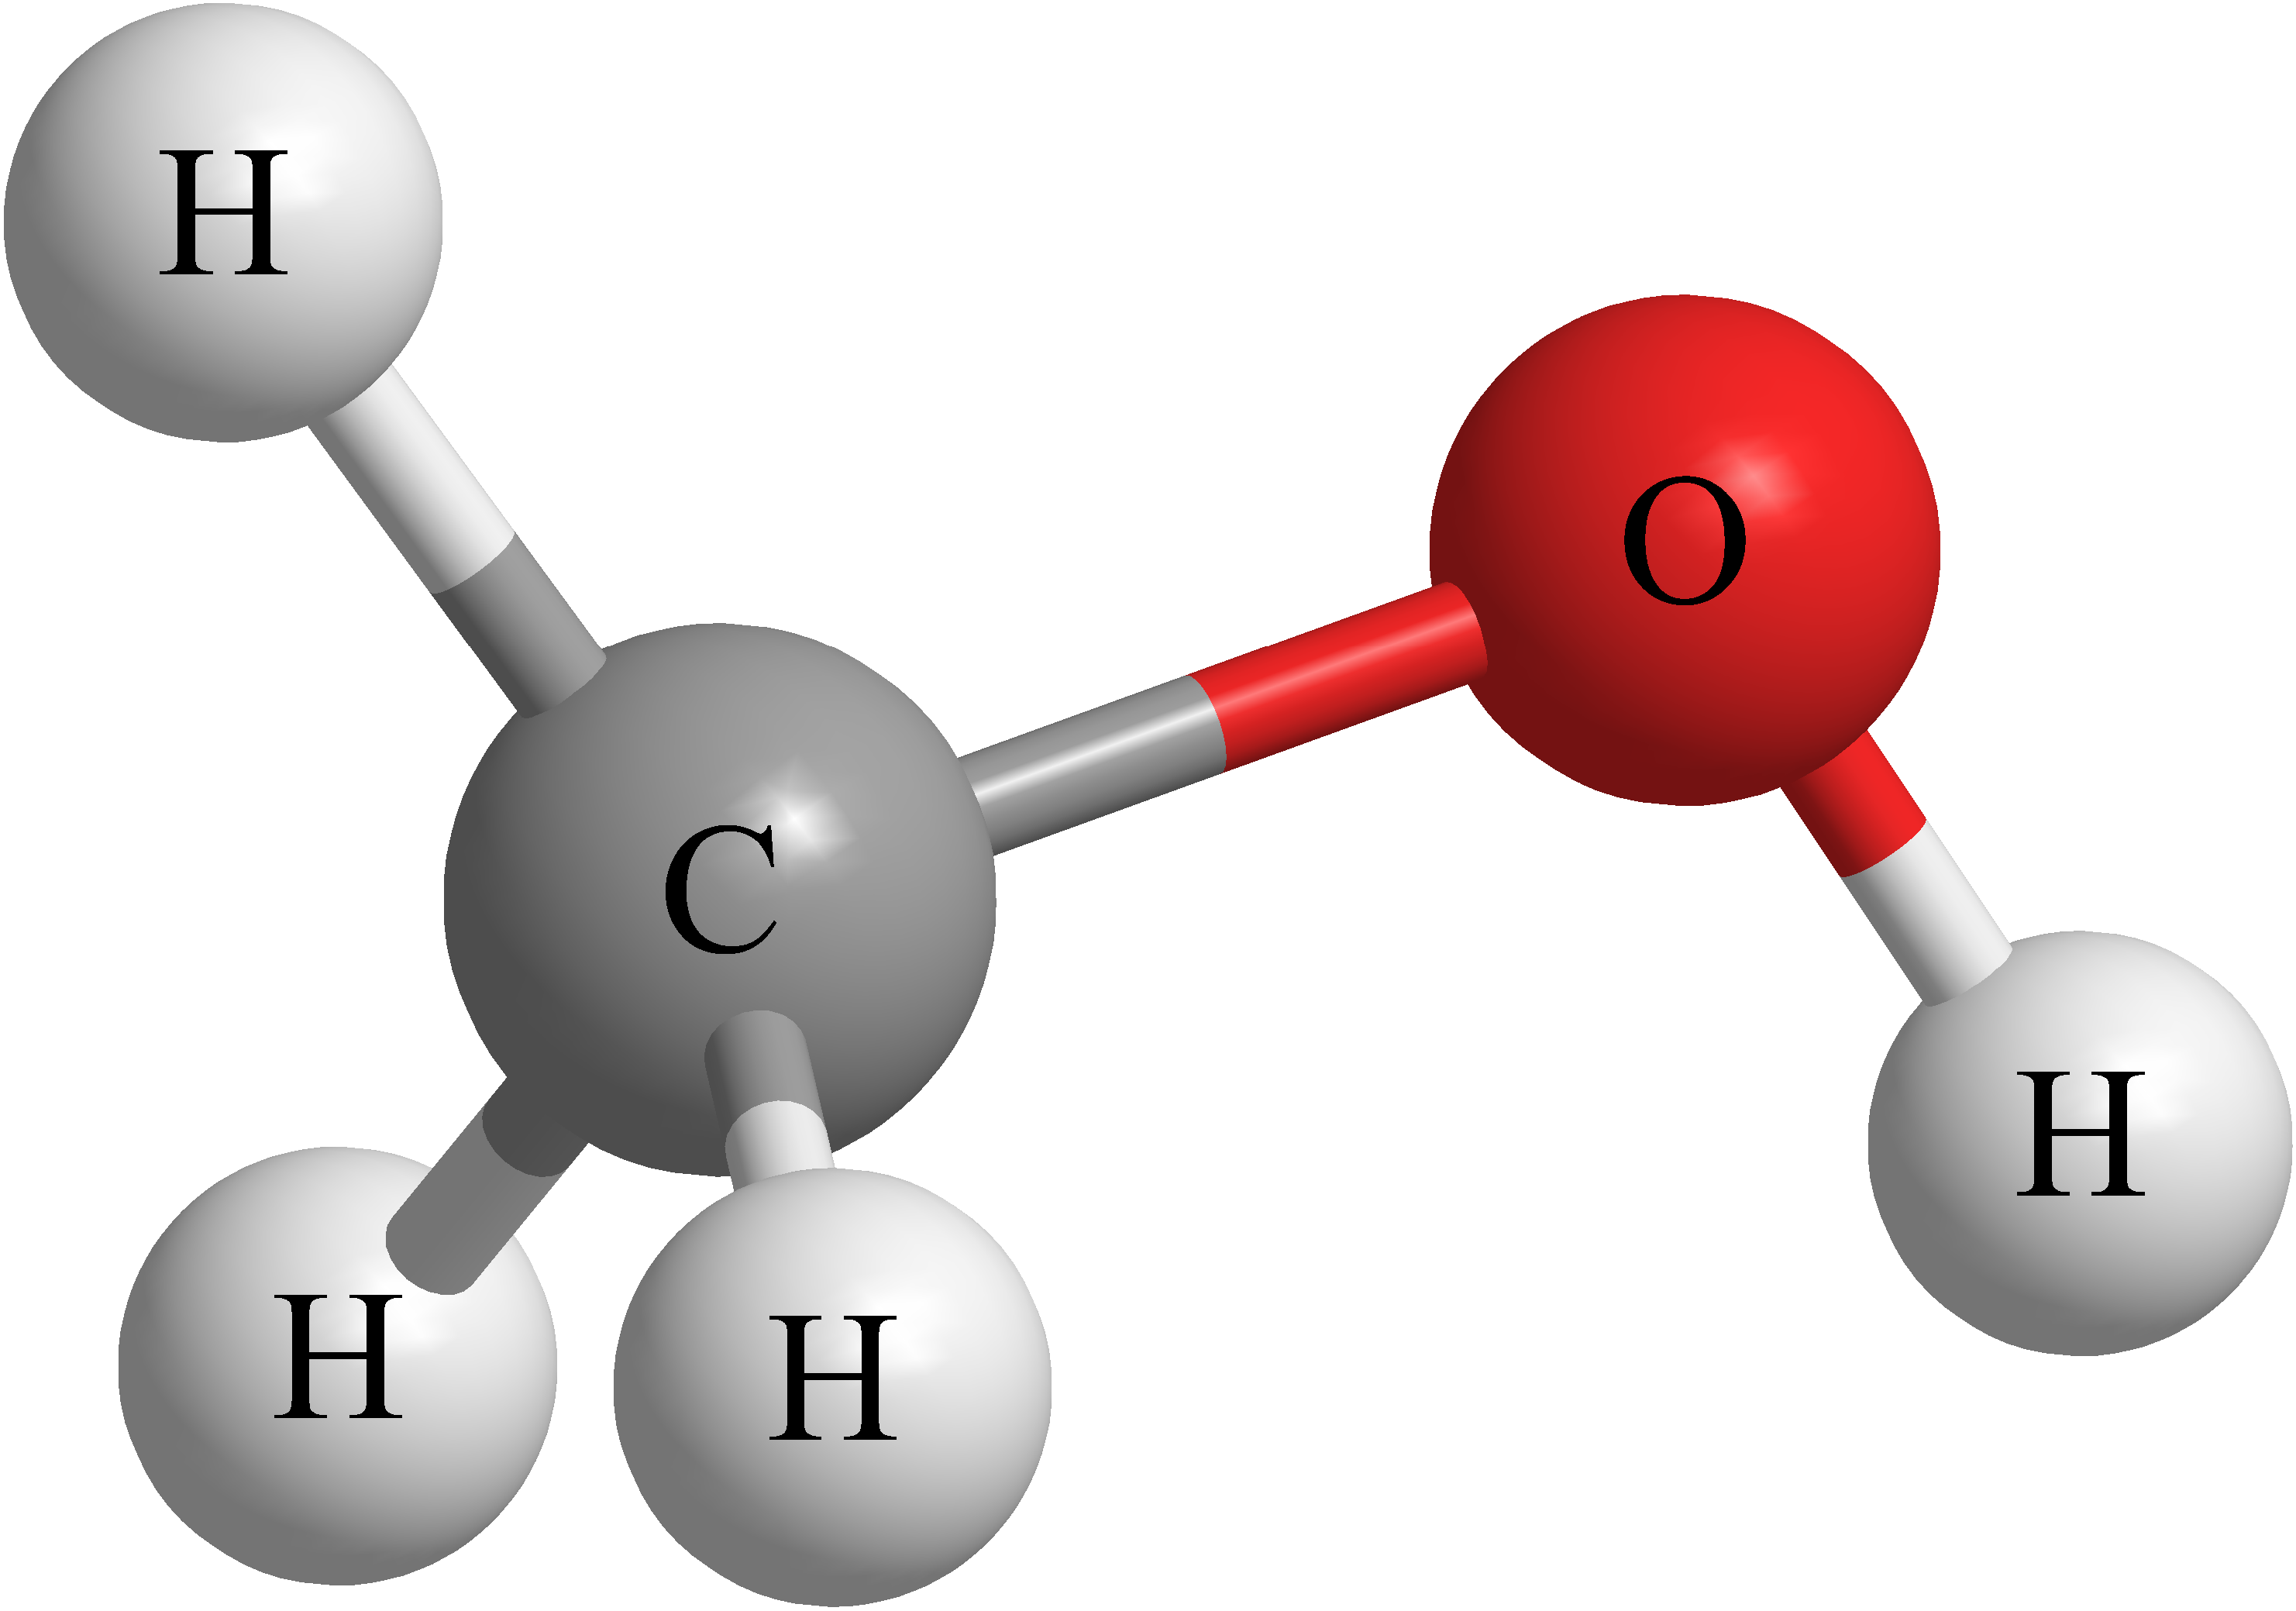
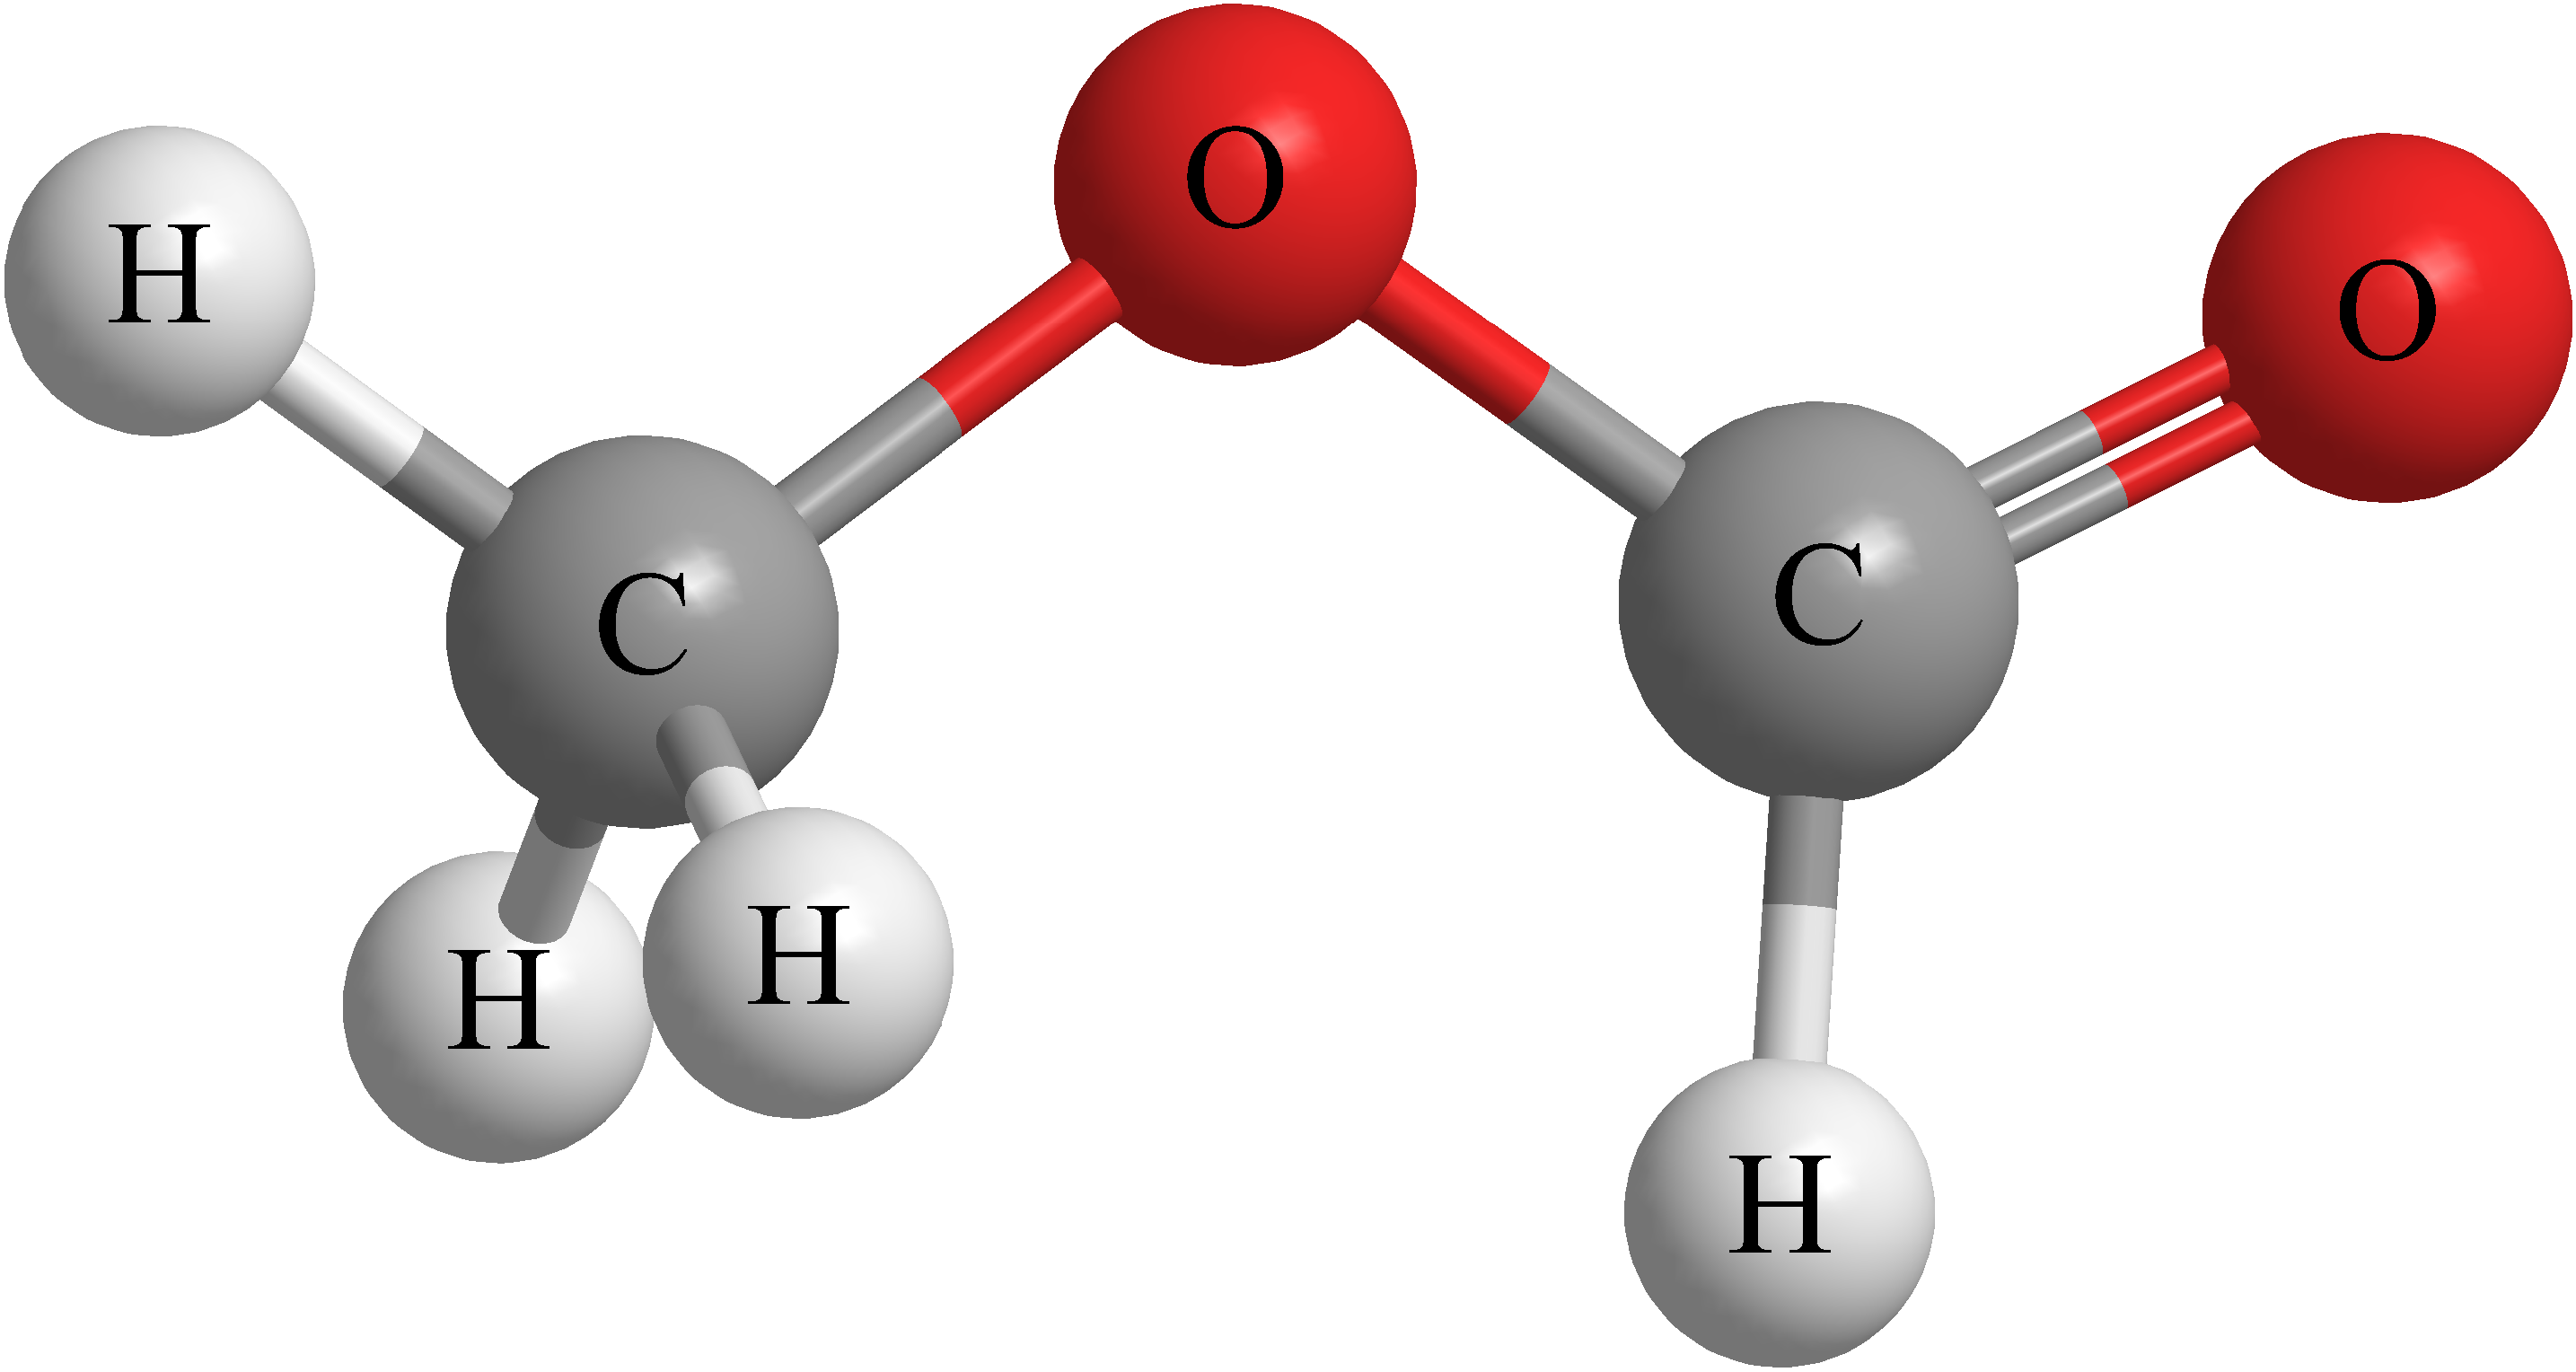
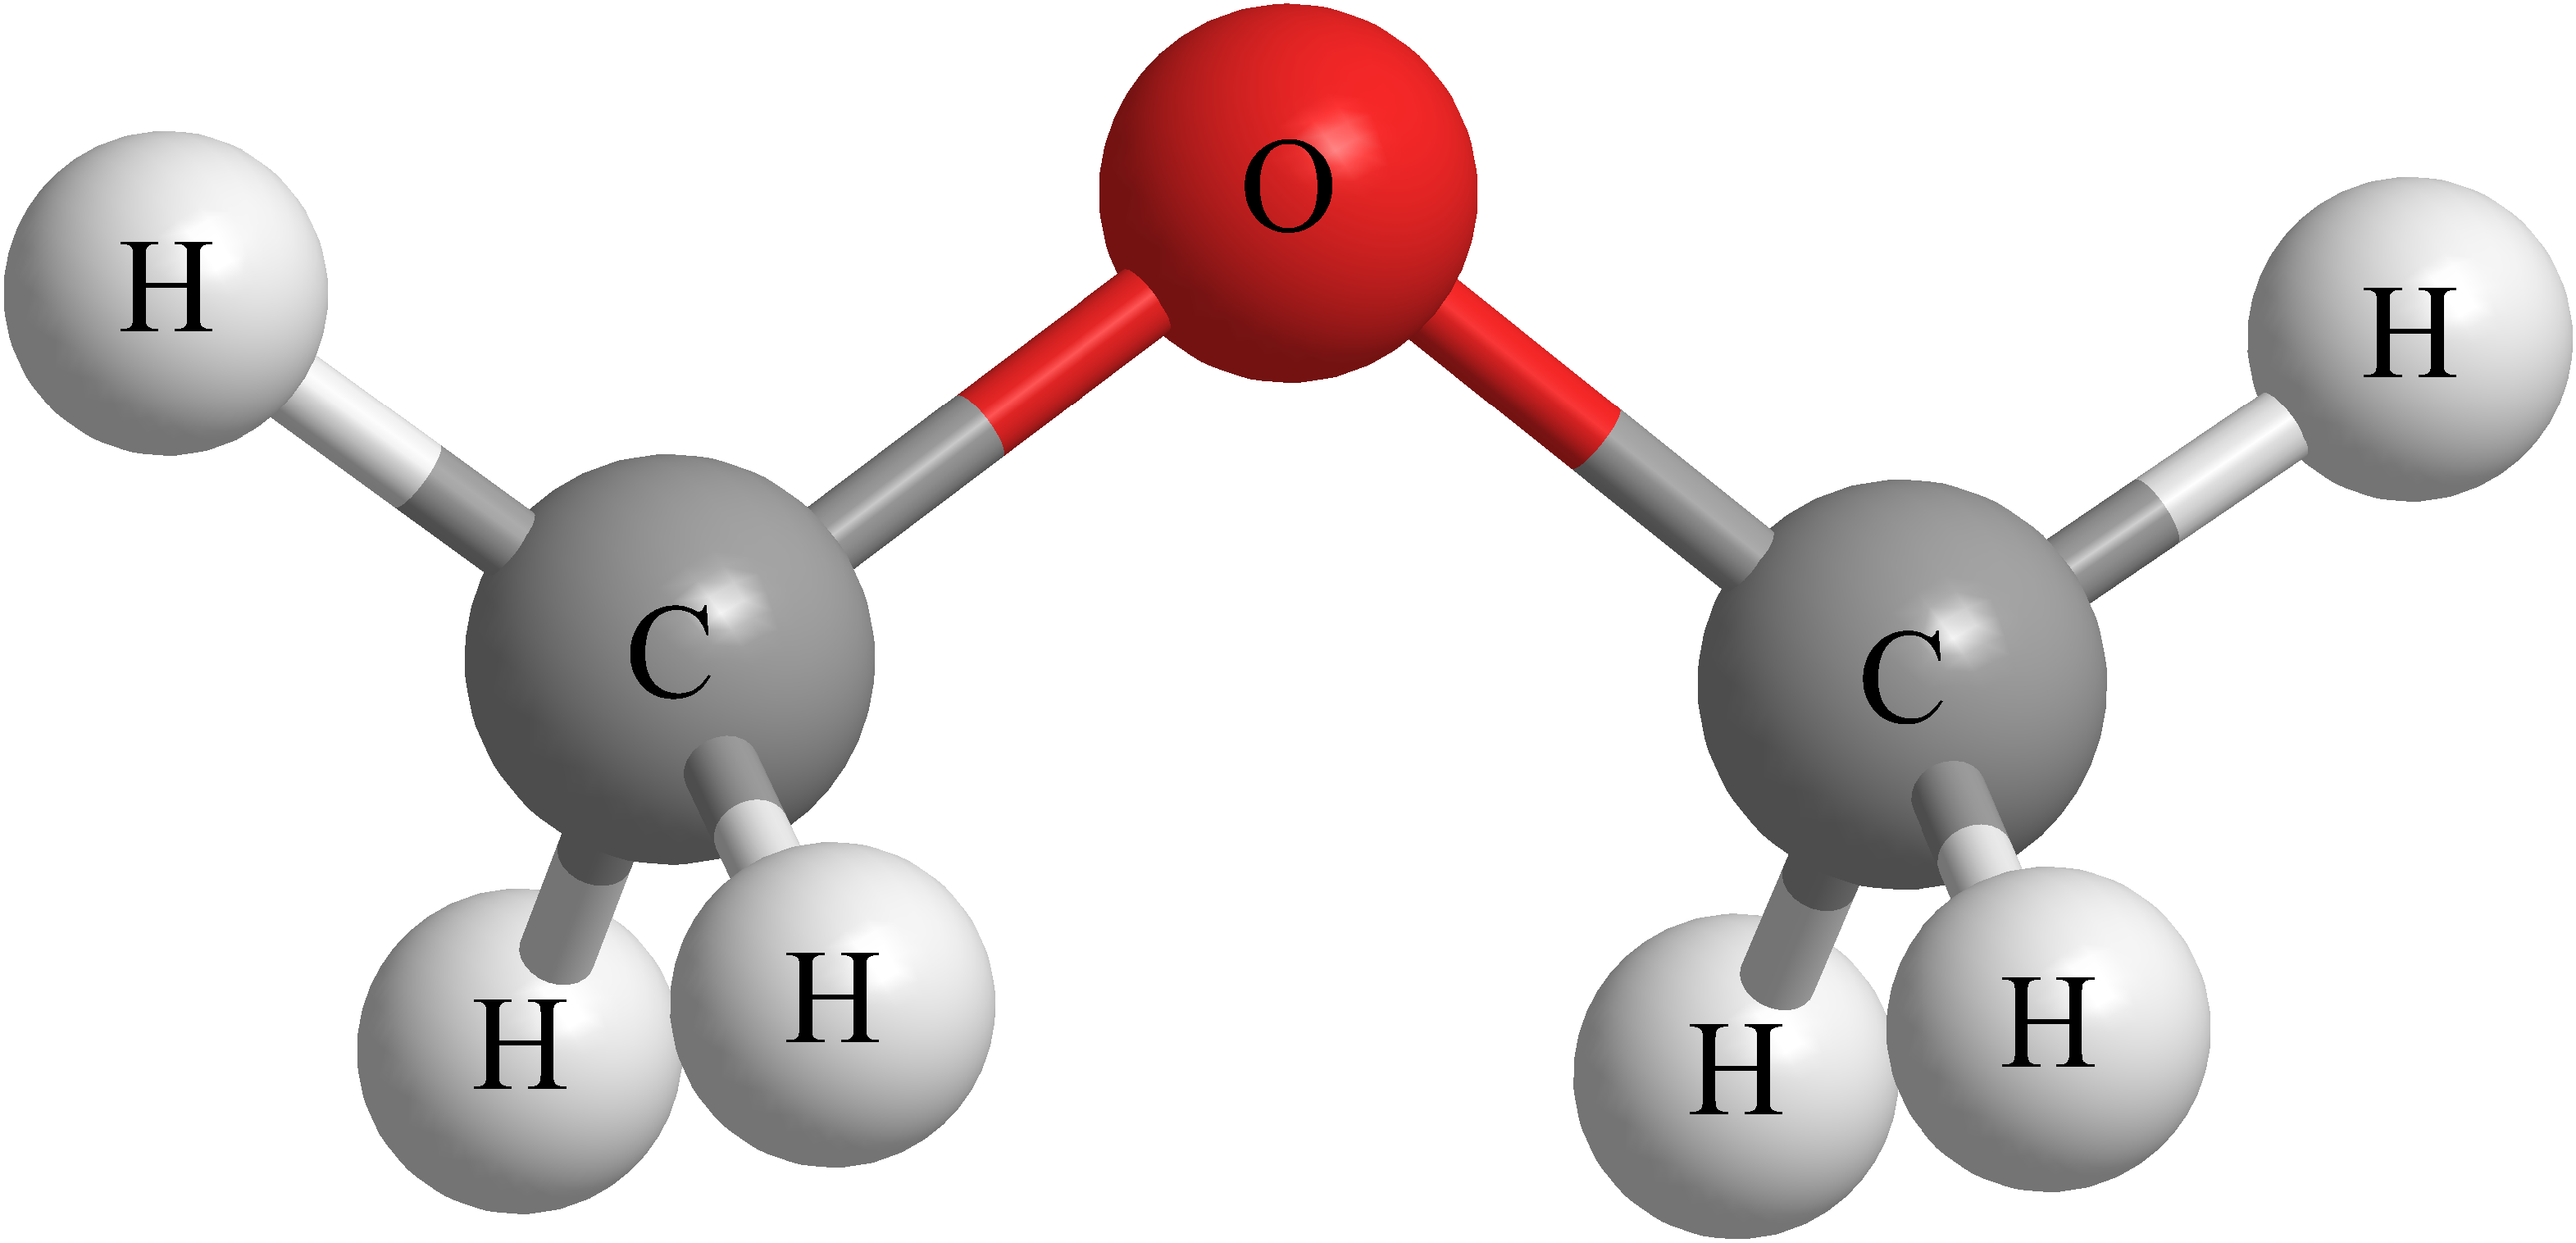
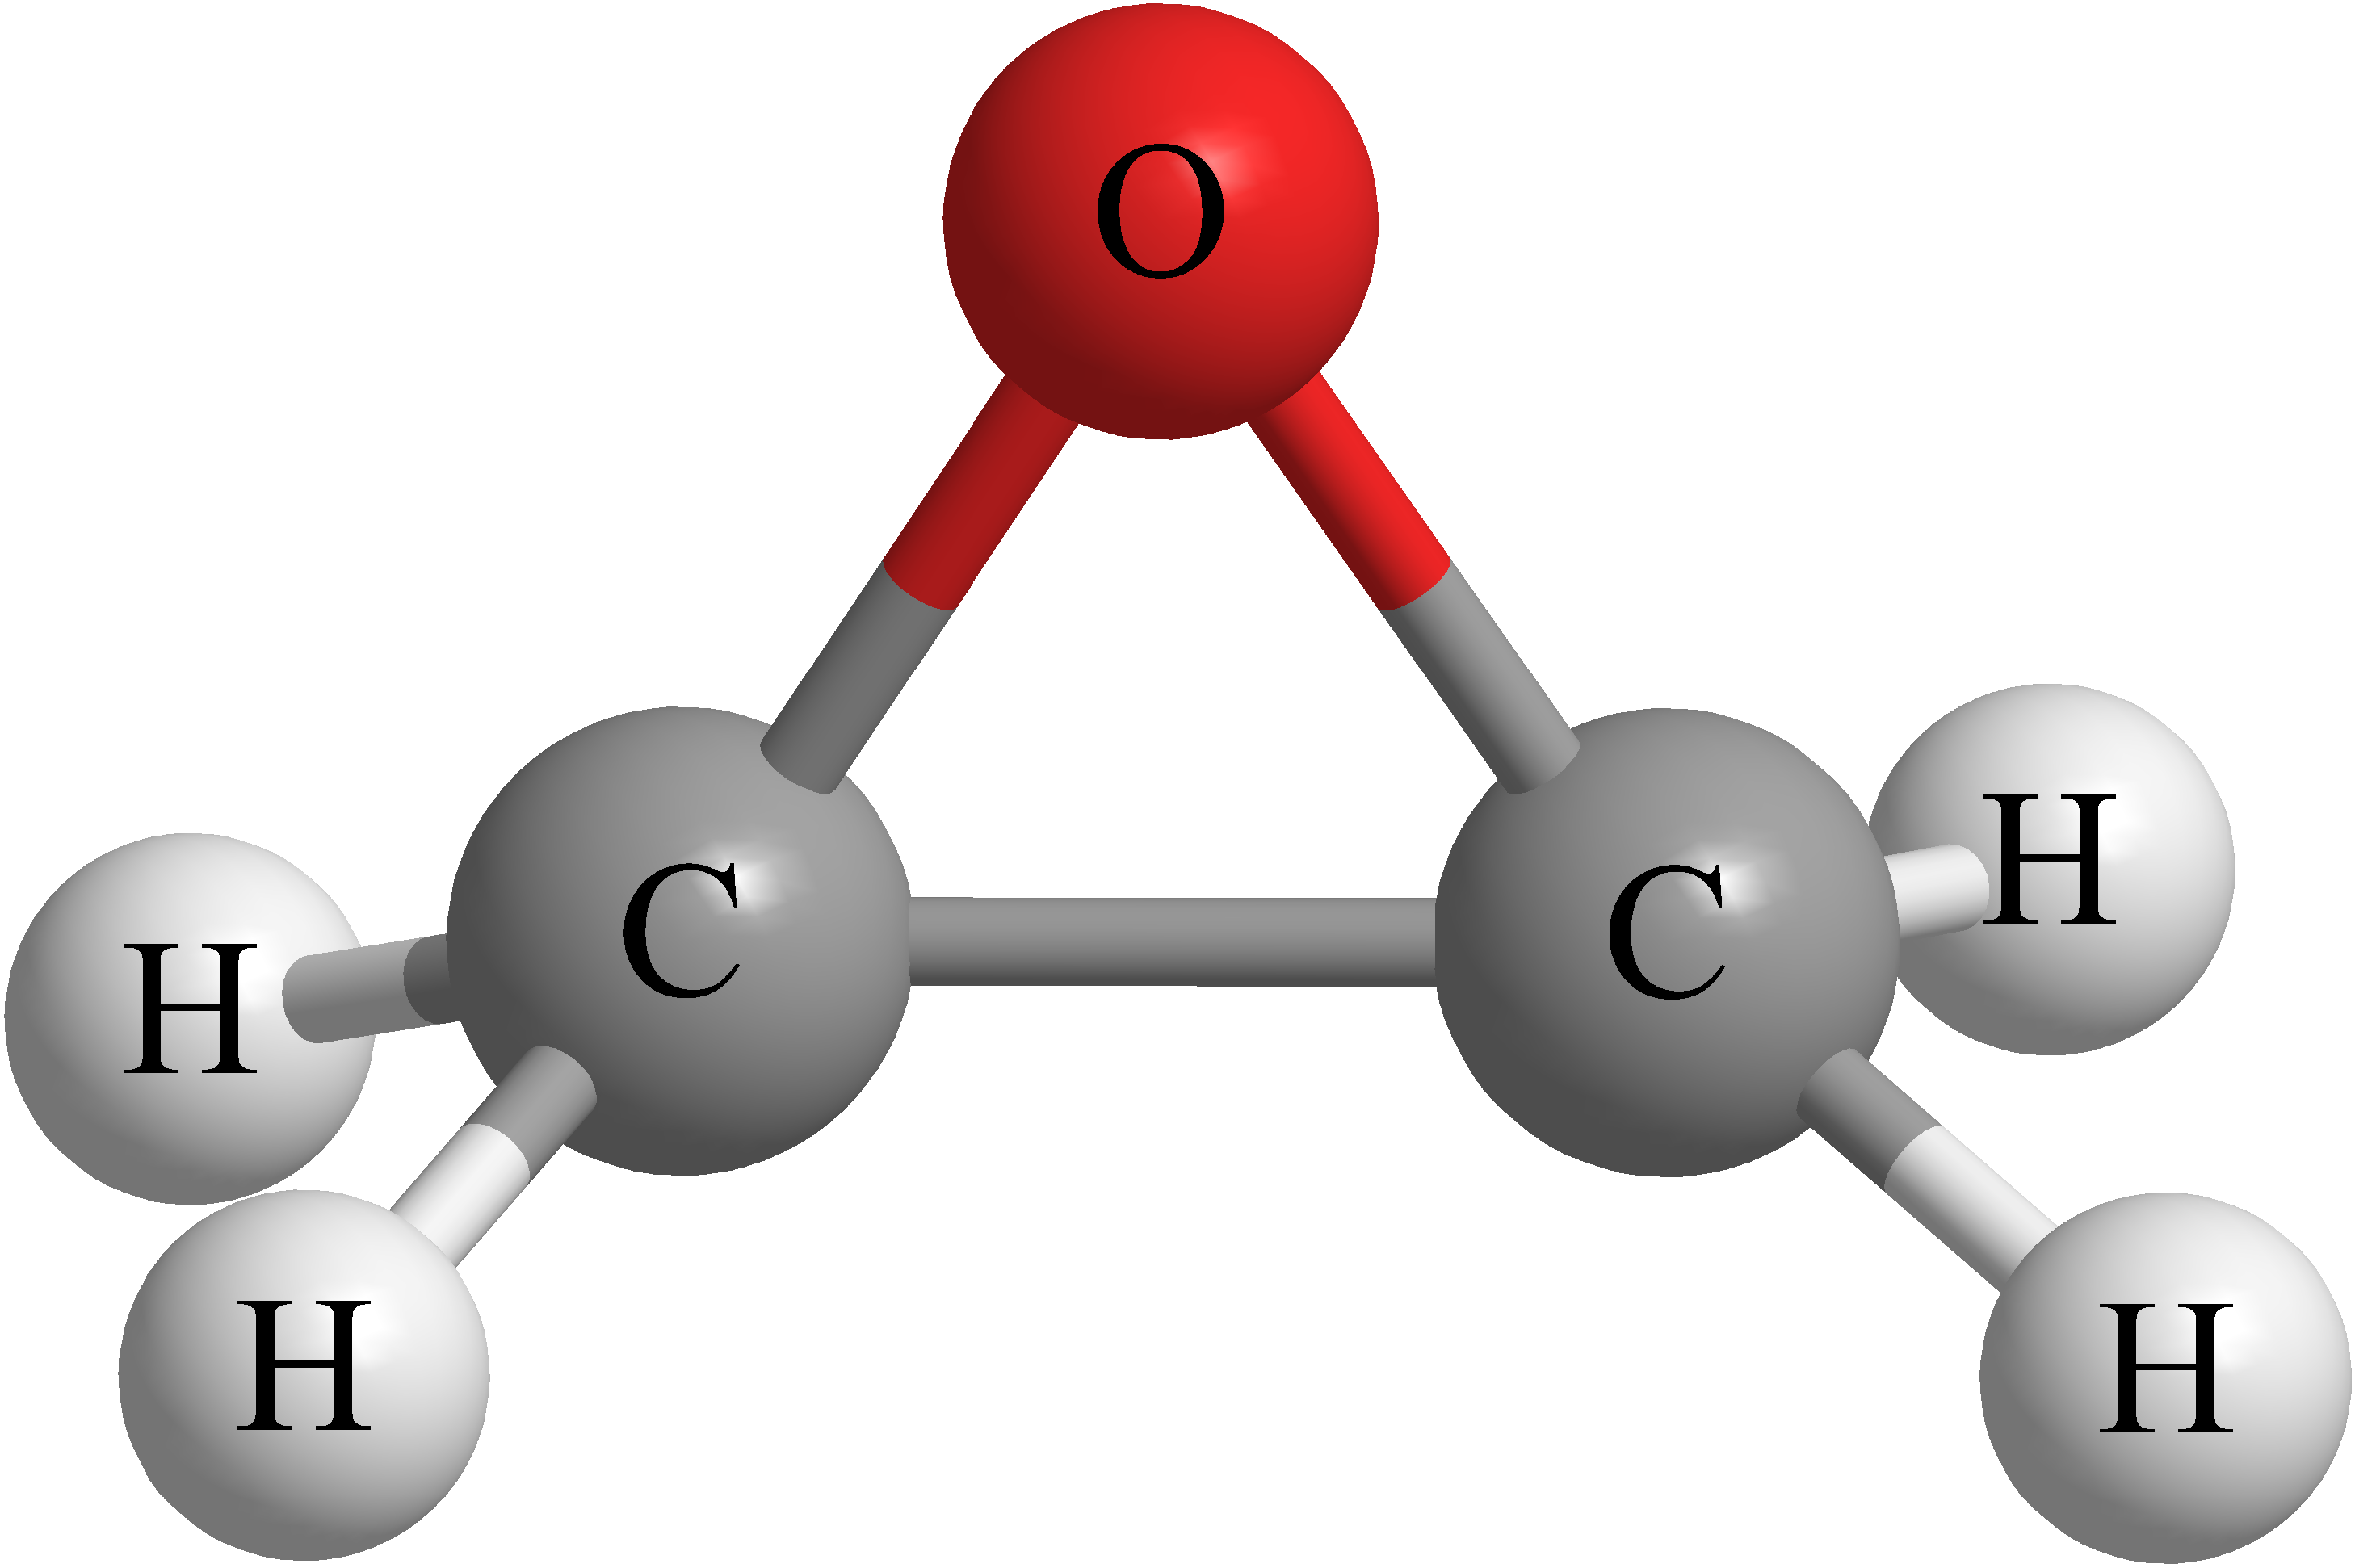
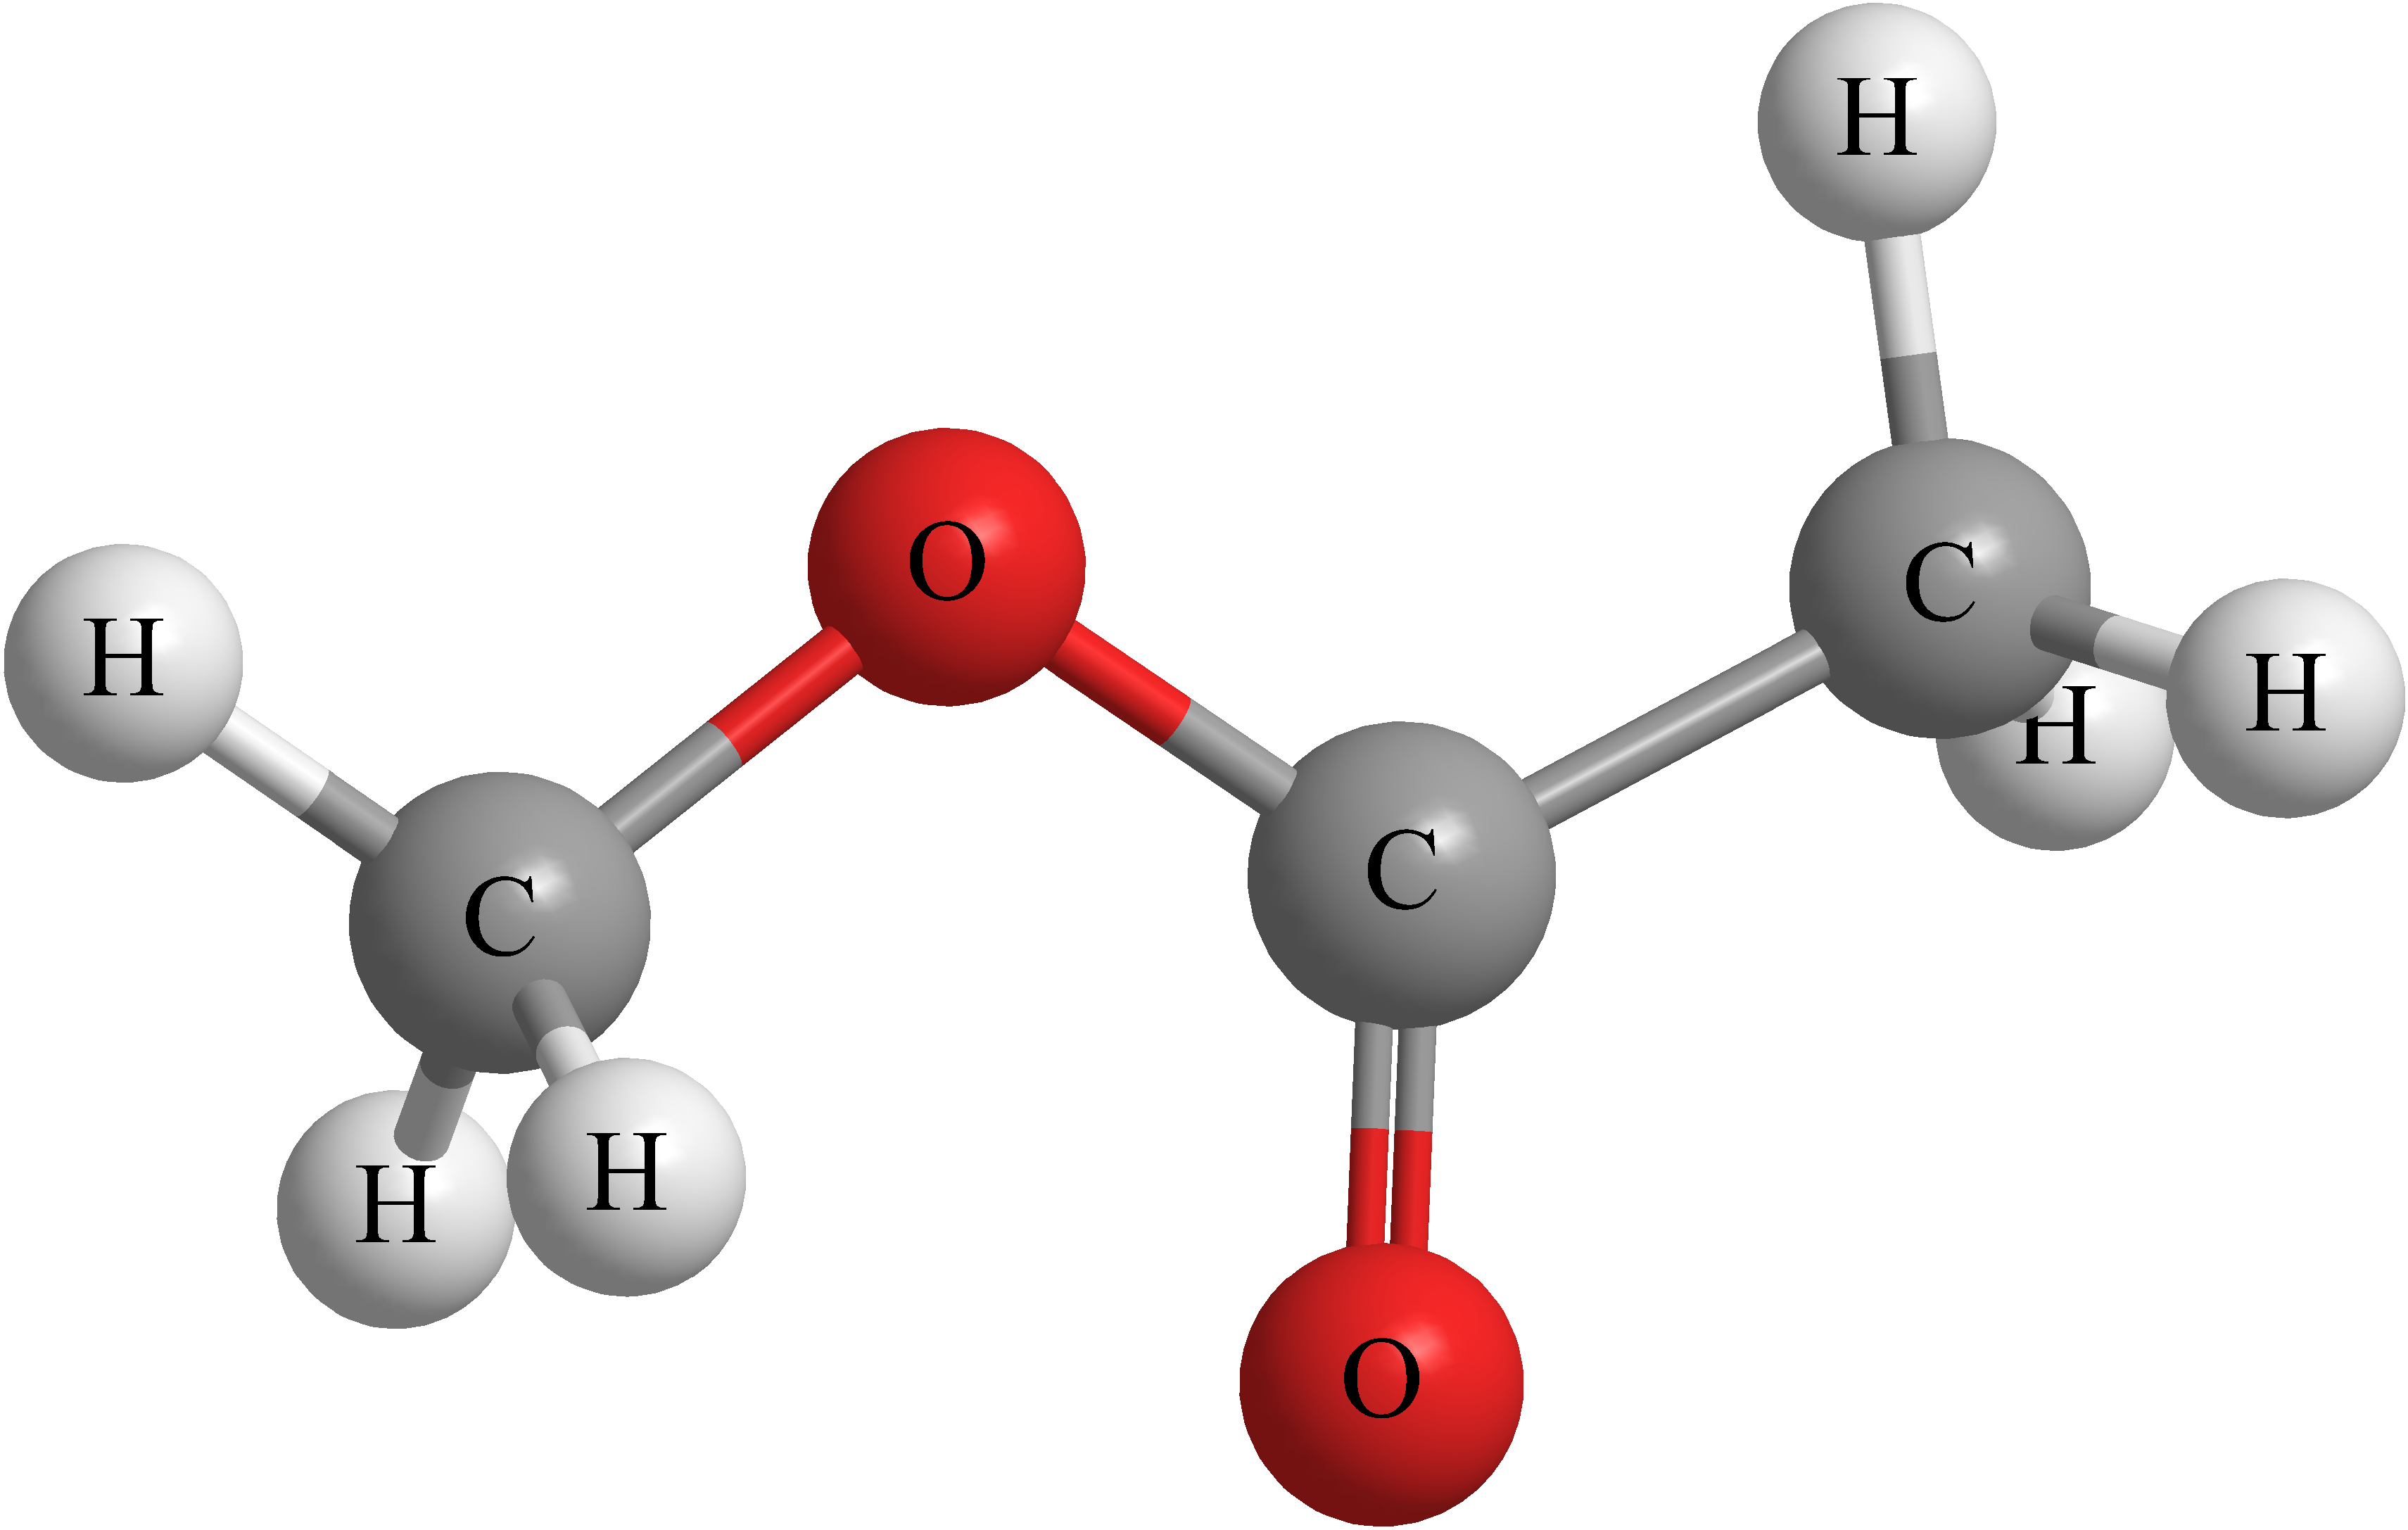
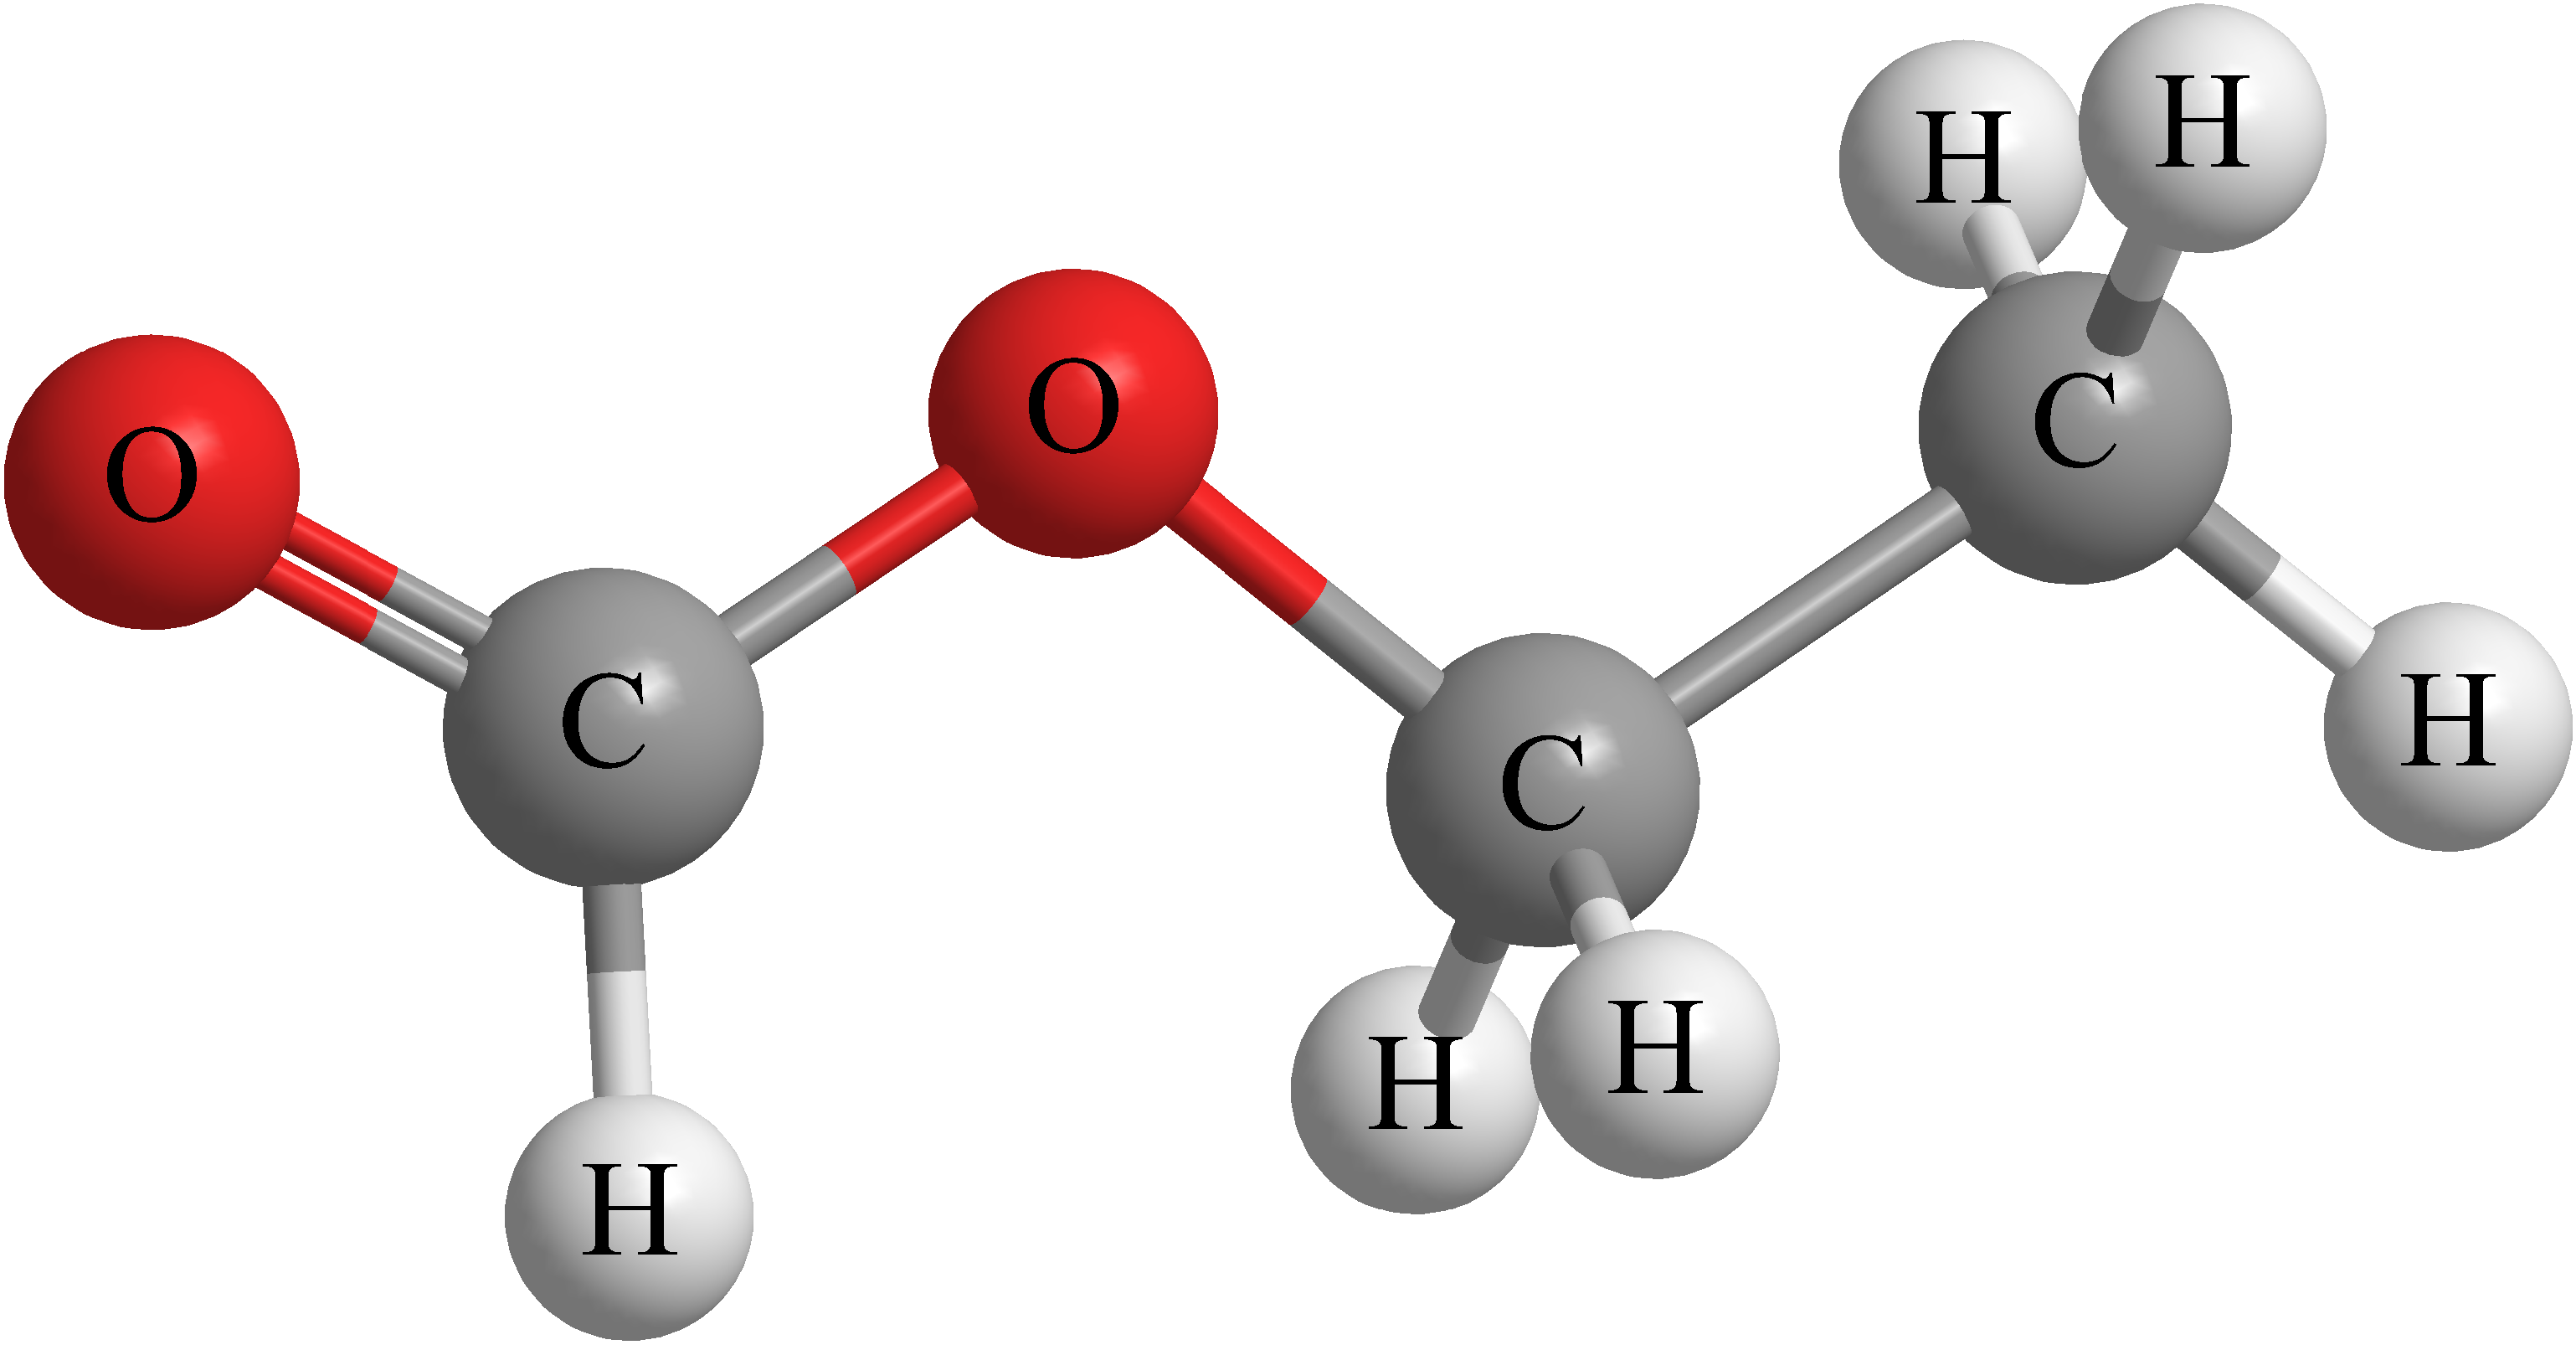
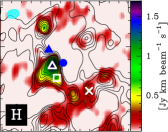
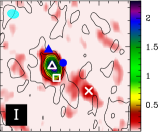
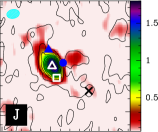
Figure 1 shows the ALMA maps together with the molecular structure of the corresponding species for all complex O-bearing molecules mentioned above. At first glance there is a clear differentiation in the spatial distribution of the species situated at the two different sides of Fig. 1: the molecules on the left (panels A–G) present the bulk of the emission at the position of the compact ridge (crosses), the emission of the species on the right (panels H-N) is characterised by a lack of a significant contribution towards this component. Moreover, the species on the right do not present a common emission peak towards their main emitting region (the hot core south). We distinguished two locations separated by about 1.6′′ for the main emission peaks in the hot core south: the maximum of formic acid (H), ethylene glycol (I), and acetic acid (J), in agreement with the position found in other works (Brouillet et al. 2015; Cernicharo et al. 2016; Favre et al. 2017; Pagani et al. 2017) for these species (unfilled triangles) and the maximum of ethanol (K) and methoxymethanol (L) (unfilled squares). In addition, we note that the species which present compact ridge emission (A–G) also exhibit emission in the hot core south showing a maximum in a position near the unfilled square (emission peak of ethanol and methoxymethanol). It is worth noting that a clump at the north-west appears in the emission of species A, B, C, D, and E, thus presenting the chemical fingerprints found for the compact ridge (see e.g. Favre et al. 2011a, Wu et al. 2014, and Hirota et al. 2015 for further discussion of this component). However, we cannot confirm emission from the less abundant species of this group (F and G) towards this component.
Owing to the observed spatial distributions of these species, we distinguish three emission peaks for further discussions (see Fig. 1): MF (methyl formate peak, cross symbol), EG (ethylene glycol peak, unfilled triangle), and ET (ethanol peak, unfilled square). Coordinates for these positions are shown in Table 2. Interestingly, these emission peaks coincide with three continuum sources found by Hirota et al. (2015) at 245 GHz and 339 GHz using subarcsecond resolution observations performed with the ALMA interferometer: HKKH 11 for the MF peak, HKKH 9 for the ET peak, whereas HKKH 8 is close to EG peak (see Fig. 4 and Table 3 of Hirota et al. 2015). In addition, Wright & Plambeck (2017) show that these continuum sources lie along the boundaries of the SiO outflow emission, being HKKH 8 (EG peak) the more embedded source in the SiO = 2 1 emission (see Fig. 1 of Wright & Plambeck 2017). Moreover, Brouillet et al. (2015) noted that one short CO jet identified by Zapata et al. (2009) overlaps the EG peak, which suggests that this component may also be located in the path of the high-velocity outflow.
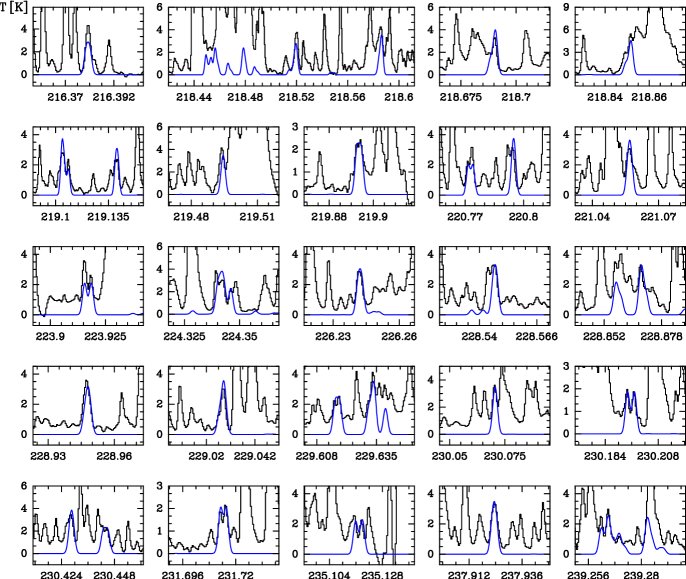
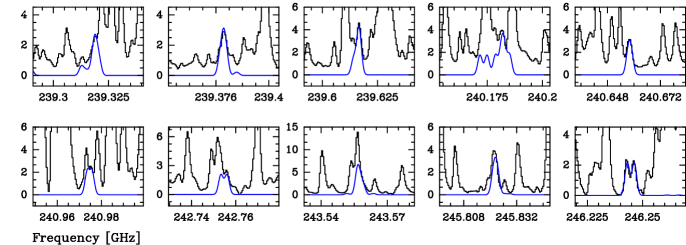
We used the MADEX444https://nanocosmos.iff.csic.es/?pageid=1619 radiative transfer code (Cernicharo 2012) to derive physical parameters and column densities for the studied species towards the MF, EG, and ET peaks (see Appendix B). Figure 3 shows the lines mapped in Fig. 1 (colour and contours) in the three selected positions (MF, EG, and ET peaks) together with the adopted integrated area for imaging the spatial distribution of these lines and the synthetic spectrum provided by MADEX. In addition, to ensure the first detection of methoxymethanol in Orion, Fig. 2 shows selected lines of CH3OCH2OH in the ET peak together with the model derived using MADEX according to the physical parameters given in Table 2.
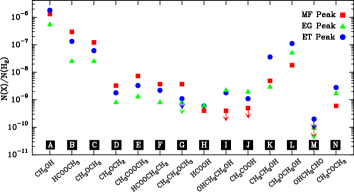
Molecular abundances for each species in the different positions were calculated using the derived column densities shown in Table 2. We adopted the (H2) values of 8.2 1023, 2.4 1024, and 1.8 1024 cm-2 derived by Hirota et al. (2015) in HKKH 11 (MF), HKKH 8 (EG), and HKKH 9 (ET), respectively, using a dust temperature of 100 K and a modified blackbody fitting of the spectral energy distribution (SED). Figure 2 shows the molecular abundances obtained for the studied species in the different positions. Interestingly, the derived values reproduce the same tendency observed in the maps. While species from A to G exhibit the lowest abundance towards the EG peak, the MF peak is the position where species from H to N present lower abundances.
4 Discussion
The clear spatial segregation of the studied O-bearing species allows us to infer some common evident molecular features for these molecules depending on whether they present significant emission in the compact ridge component or not. All molecules from B to G harbour an oxygen bound to two carbons by two single bonds (COC; an ether group), whereas all species from H to M show a hydroxyl group (OH) bound to a carbon atom (COH). This points to a principal common precursor for the formation (via dust and/or gas-phase reactions) of these species. According to this molecular structure, we propose methoxy (CH3O) and hydroxymethyl (CH2OH) radicals as the major drivers of the chemistry in the compact ridge and the hot core south, respectively. Nevertheless, studies on laboratory experiments on ices and surface and/or gas-phase chemical models could point in alternative directions. Paying attention to these studies, the chemical fingerprints found in this work, the positions of MF, EG, and ET peaks along Orion KL, and assuming similar initial conditions for the parent cloud, we could propose several scenarios for the chemical segregation found in this paper.
4.1 Surface and gas-phase chemistry
Our results show that COC-bearing species are present both at the hot core south and the compact ridge, but peak at the latter. Due to the recent explosive event (5001000 yr) in Orion, we could expect a young stage for the chemistry of this region. The simplest model to explain the rather strong correlation of these species is radical-radical reactions on grain surfaces (see Garrod et al. 2008). Then the relative abundances of the COC-bearing species may be fixed before this event and the absolute abundances could be enhanced after the explosion. Moreover, the hot core south could be more exposed to the effects of this event (i.e. higher temperature, particles, or shocks) giving rise to a surface chemistry which produces COH-containing molecules. In this case, the mobility enhancement of the CH2OH radical could be the crucial phenomenon.
Nonetheless, although we have assumed a young chemistry for this source, the enhancement of the COC-bearing species towards the compact ridge together with lack of COH-containing molecules in this component could point alternatively to an important role of gas-phase reactions in this component.
Laboratory experiments on ices and surface chemical models may suggest that both COC- and COH-containing molecules are released from grains to the gas phase during the warm-up timescales:
-
•
In laboratory experiments to quantify the production rates of COMs, Öberg et al. (2009) identified CO, CO2, CH4, HCO, H2CO, CH2OH, CH3CHO, CH3OCH3, CH3CH2OH, OHCH2CH2OH, and a mixture of complex CHO- and COOH-containing molecules (HCOOH, HCOOCH3, OHCH2CHO) after UV photolysis of CH3OH-rich ices. Nonetheless, they found a comparatively small formation of CH3O-containing molecules during warm-up of the irradiated ice.
Owing to the large CH3OH abundance found in the present work for all the studied components, we expect CH3OH-rich ices in our source. However, we note that other processes different from UV radiation which deposit energy to the dust grain (i.e. cosmic ray-grain interactions, grain-grain collisions, IR heating) could lead to different products.
-
•
Chemical models provided by Garrod et al. (2008) show that a wide array of complex species may be formed by reactions involving radicals on dust grains. The reaction of the mobile primary radicals HCO and CH3 with more strongly bound primary radicals CH3O and CH2OH results in the formation of HCOOCH3, CH3OCH3, OHCH2CHO, and CH3CH2OH (i.e. both COC- and COH-containing molecules) at temperatures between 30 and 40 K. For the most complex COC-bearing molecules, Belloche et al. (2009) proposed that HCOOCH2CH3 is primarily formed on grains by adding HCO or CH3 to functional-group radicals derived from HCOOCH3 and CH3CH2OH.
With regard to gas chemistry, several gas-phase mechanisms have been proposed to explain the high abundances of several COC-bearing molecules:
-
•
To produce HCOOCH3, Neill et al. (2012) proposed ion-molecule reactions in the gas phase that involve the reaction of CH3OH and HCOOH.
-
•
Furthermore, Balucani et al. (2015) proposed the non-thermal desorption of iced methanol in cold environments as the precursor of a series of gas-phase reactions, some of them being uncertain radiative association reactions, leading to the formation of CH3O, CH3OCH3, and HCOOCH3.
-
•
Taquet et al. (2016) explained the abundances of CH3OCH3, HCOOCH3, HCOOCH2CH3, and CH3CH2OCH3 found in several star-forming regions by means of ion-neutral gas-phase chemistry triggered by the evaporation of interstellar ices at temperatures higher than 100 K. The gas-phase chemical network used by these authors assumes CH3OH as the main precursor to form CH3OCH3 and HCOOCH3, and CH3CH2OH as the starting point to produce the most complex species (HCOOCH2CH3 and CH3CH2OCH3).
Thus, we could expect that reactions in the gas phase have led to decrease the abundances of COH-containing molecules (which emerge in the gas phase more likely by desorption from the ices) and enhance the abundance of COC-containing species. If we assume that the released species from the grain mantles are similar for both the compact ridge and the south hot core, the decreased abundance of CH3CH2OH in the former could reflect the formation of HCOOCH2CH3 and CH3CH2OCH3 via the mechanisms proposed by Taquet et al. (2016). This could point out to an advanced evolutionary stage for the compact ridge component.
As an example of the constraints brought by the spatial distribution of the species, it seems that of the two paths to form HCOOCH2CH3 proposed by Belloche et al. (2009), the one implying a role of HCOOCH3 is favoured in Orion KL. Namely the distribution of HCOOCH2CH3 resembles that of HCOOCH3, and not that of CH3CH2OH. Furthermore, HCOOCH3 could also be similarly the precursor of CH3COOCH3 on the grain surface through the COOCH3 radical.
4.2 Warm-up timescales and kinetic temperatures
On a smaller scale, the two different emission peaks found in the hot core south (EG and ET peaks) may reflect different warm-up timescales and/or different kinetic temperatures of the gas.
Garrod et al. (2008) also proposed that the formation of CH3OCH2OH and OHCH2CH2OH is dependent on the mobility of the CH3O and CH2OH radicals, respectively. CH2OH becomes mobile just as water and other species are beginning to desorb. The grain surface OHCH2CH2OH abundance rises dramatically at 110 K. At temperatures between 50 and 100 K, secondary radicals themselves may become mobile; high temperature mobility of the secondary radical CH3CO results in reactions with CH3 and OH to form CH3COCH3 and CH3COOH, respectively. The formation of these secondary radical products is most effective with long warm-up timescales. Therefore, in the ET peak CH3CH2OH and CH3OCH2OH are desorbed after reaction of primary radicals; instead, in the EG peak the low mobility of the CH2OH radical could lead to the desorption of OHCH2CH2OH at similar physical conditions of the CH3COOH desorption which is produced after reactions involving secondary radicals.
Interestingly, to explain the high abundance found for CH3OCH2OH in NGC 6334I, McGuire et al. (2017) suggest an important role of low-energy electrons (as a product of the interactions of high-energy radiation, such as cosmic rays, with matter) acting on methanol ices, as studied by Sullivan et al. (2016).
4.3 Desorption mechanisms
Different desorption mechanisms could favour the enhancement of different species in the gas phase. The core of the EG peak could be more likely affected by desorption mechanisms via non-thermal processes due to its embedded position in the SiO outflow. In this scenario, sputtering and grain collisions could favour the production of species which, in the mechanism proposed by Garrod et al. (2008), are produced when the dust grain reaches high temperatures and certain radicals (i.e. CH2OH and secondary radicals) become mobile. Then, OHCH2CH2OH and CH3COOH could be enhanced into the gas phase before the species that warm up at lower temperatures (i.e. HCOOCH3, CH3OCH3, OHCH2CHO, CH3CH2OH) reach high abundances. This also explains the spatial distribution of CH3COCH3 as produced by the interaction of a front shock with its surroundings. The lower diffusion barrier of the CH3 radical (compared to the OH radical) may also explain the differences found in the spatial distribution of CH3COOH and CH3COCH3.
4.4 Early stage of shock chemistry
The co-spatial emission of HCOOH, CH3COOH, and OHCH2CH2OH may indicate an early stage of shock chemistry. HCOOH may be easily liberated from grain surfaces (Garrod et al. 2008), but it could be processed into HCOOCH3 in regions where the timescales are sufficiently long for gas-phase reactions to occur (Neill et al. 2012). This also explains the decreased emission of HCOOH in the MF and ET peaks. In this scenario, the chemistry found in MF and ET peaks could reflect a prevailing role of gas-phase reactions that take place after sputtering (in a post-shock scenario) and/or thermal evaporation (by compression of the gas in a pre-shock scenario) of the grain mantles. In this respect, if the first generation of mantle molecules might include OH-bearing species, the first group of species (from B to G) will be characterised by radicals where the OH bond has been cut (not only CH3O, but CH3CO to form CH3COOCH3, and CH3CH2O to form HCOOCH2CH3 and CH3CH2OCH3).
To sum up, we found an evident difference between the molecular content of the compact ridge and the hot core south, which is reflected in the internal chemical structure of the detected species. This observed spatial differentiation between the most complex O-bearing species could provide an important constraint to future investigations regarding the chemistry of the interstellar medium. Chemical models will have to be adapted to these new results. Finally, to explain this chemical segregation issues such as the evolutionary stage of the different Orion KL components, the composition of the dust grains prior to the collapse phase, the molecules accreted onto the grains, desorption mechanisms in the different regions (thermal/chemical/sputtering/UV processes), and/or the surface and gas-phase chemistry should be addressed in a combined way.
Acknowledgements.
We would like to thank the anonymous referee for a helpful report that led to improvements in the paper. The authors thank R. Motiyenko, L. Margulès, and J.-C. Guillemin for their work on methoxymethanol, which was absolutely key to its detection in Orion KL. We thank the ERC for support under grant ERC-2013-Syg-610256- NANOCOSMOS. We also thank the Spanish MINECO for funding support under grants AYA2012-32032 and FIS2014-52172-C2, and the CONSOLIDER-Ingenio programme ASTROMOL CSD 2009-00038.References
- Allen et al. (2017) Allen, V., van der Tak, F. F. S., Sánchez-Monge, Á., Cesaroni, R., & Beltrán, M. T. 2017, A&A, 603, A133
- Bally et al. (2017) Bally, J., Ginsburg, A., Arce, H., et al. 2017, ApJ, 837, 60
- Balucani et al. (2015) Balucani, N., Ceccarelli, C., & Taquet, V. 2015, MNRAS, 449, L16
- Bell et al. (2014) Bell, T. A., Cernicharo, J., Viti, S., et al. 2014, A&A, 564, A114
- Belloche et al. (2009) Belloche, A., Garrod, R. T., Müller, H. S. P., et al. 2009, A&A, 499, 215
- Bergner et al. (2017) Bergner, J. B., Öberg, K. I., Garrod, R. T., & Graninger, D. M. 2017, ApJ, 841, 120
- Blake et al. (1987) Blake, G. A., Sutton, E. C., Masson, C. R., & Phillips, T. G. 1987, ApJ, 315, 621
- Brouillet et al. (2013) Brouillet, N., Despois, D., Baudry, A., et al. 2013, A&A, 550, A46
- Brouillet et al. (2015) Brouillet, N., Despois, D., Lu, X.-H., et al. 2015, A&A, 576, A129
- Cernicharo (2012) Cernicharo, J. 2012, in EAS Publications Series, Vol. 58, EAS Publications Series, ed. C. Stehlé, C. Joblin, & L. d’Hendecourt, 251–261
- Cernicharo et al. (2016) Cernicharo, J., Kisiel, Z., Tercero, B., et al. 2016, A&A, 587, L4
- Crockett et al. (2014) Crockett, N. R., Bergin, E. A., Neill, J. L., et al. 2014, ApJ, 787, 112
- Favre et al. (2011a) Favre, C., Despois, D., Brouillet, N., et al. 2011a, A&A, 532, A32
- Favre et al. (2017) Favre, C., Pagani, L., Goldsmith, P. F., et al. 2017, A&A, 604, L2
- Favre et al. (2011b) Favre, C., Wootten, H. A., Remijan, A. J., et al. 2011b, ApJ, 739, L12
- Fayolle et al. (2015) Fayolle, E. C., Öberg, K. I., Garrod, R. T., van Dishoeck, E. F., & Bisschop, S. E. 2015, A&A, 576, A45
- Feng et al. (2015) Feng, S., Beuther, H., Henning, T., et al. 2015, A&A, 581, A71
- Friedel & Widicus Weaver (2012) Friedel, D. N. & Widicus Weaver, S. L. 2012, ApJS, 201, 17
- Garrod et al. (2008) Garrod, R. T., Widicus Weaver, S. L., & Herbst, E. 2008, ApJ, 682, 283
- Genzel & Stutzki (1989) Genzel, R. & Stutzki, J. 1989, ARA&A, 27, 41
- Goicoechea et al. (2015) Goicoechea, J. R., Chavarría, L., Cernicharo, J., et al. 2015, ApJ, 799, 102
- Gómez et al. (2005) Gómez, L., Rodríguez, L. F., Loinard, L., et al. 2005, ApJ, 635, 1166
- Grossschedl et al. (2018) Grossschedl, J. E., Alves, J., Meingast, S., et al. 2018, ArXiv e-prints
- Herbst & van Dishoeck (2009) Herbst, E. & van Dishoeck, E. F. 2009, ARA&A, 47, 427
- Hirota et al. (2015) Hirota, T., Kim, M. K., Kurono, Y., & Honma, M. 2015, ApJ, 801, 82
- Högbom (1974) Högbom, J. A. 1974, A&AS, 15, 417
- Jiménez-Serra et al. (2016) Jiménez-Serra, I., Vasyunin, A. I., Caselli, P., et al. 2016, ApJ, 830, L6
- Kounkel et al. (2017) Kounkel, M., Hartmann, L., Loinard, L., et al. 2017, ApJ, 834, 142
- Luhman et al. (2017) Luhman, K. L., Robberto, M., Tan, J. C., et al. 2017, ApJ, 838, L3
- McGuire et al. (2017) McGuire, B. A., Shingledecker, C. N., Willis, E. R., et al. 2017, ApJ, 851, L46
- Menten et al. (2007) Menten, K. M., Reid, M. J., Forbrich, J., & Brunthaler, A. 2007, A&A, 474, 515
- Motiyenko et al. (2018) Motiyenko, R. A., Margulès, L., Despois, D., & Guillemin, J.-C. 2018, Physical Chemistry Chemical Physics (Incorporating Faraday Transactions), 20, 5509
- Neill et al. (2012) Neill, J. L., Muckle, M. T., Zaleski, D. P., et al. 2012, ApJ, 755, 153
- Neill et al. (2013) Neill, J. L., Wang, S., Bergin, E. A., et al. 2013, ApJ, 770, 142
- Öberg et al. (2013) Öberg, K. I., Boamah, M. D., Fayolle, E. C., et al. 2013, ApJ, 771, 95
- Öberg et al. (2009) Öberg, K. I., Garrod, R. T., van Dishoeck, E. F., & Linnartz, H. 2009, A&A, 504, 891
- O’Dell (2001) O’Dell, C. R. 2001, PASP, 113, 29
- Pagani et al. (2017) Pagani, L., Favre, C., Goldsmith, P. F., et al. 2017, A&A, 604, A32
- Peng et al. (2013) Peng, T.-C., Despois, D., Brouillet, N., et al. 2013, A&A, 554, A78
- Peng et al. (2012) Peng, T.-C., Despois, D., Brouillet, N., Parise, B., & Baudry, A. 2012, A&A, 543, A152
- Rodríguez et al. (2017) Rodríguez, L. F., Dzib, S. A., Loinard, L., et al. 2017, ApJ, 834, 140
- Schilke et al. (2001) Schilke, P., Benford, D. J., Hunter, T. R., Lis, D. C., & Phillips, T. G. 2001, ApJS, 132, 281
- Sullivan et al. (2016) Sullivan, K. K., Boamah, M. D., Shulenberger, K. E., et al. 2016, MNRAS, 460, 664
- Suzuki et al. (2018) Suzuki, T., Ohishi, M., Saito, M., et al. 2018, ApJS, 237, 3
- Taquet et al. (2016) Taquet, V., Wirström, E. S., & Charnley, S. B. 2016, ApJ, 821, 46
- Tercero et al. (2015) Tercero, B., Cernicharo, J., López, A., et al. 2015, A&A, 582, L1
- Tercero et al. (2010) Tercero, B., Cernicharo, J., Pardo, J. R., & Goicoechea, J. R. 2010, A&A, 517, A96
- Tercero et al. (2011) Tercero, B., Vincent, L., Cernicharo, J., Viti, S., & Marcelino, N. 2011, A&A, 528, A26
- Widicus Weaver & Friedel (2012) Widicus Weaver, S. L. & Friedel, D. N. 2012, ApJS, 201, 16
- Wright & Plambeck (2017) Wright, M. C. H. & Plambeck, R. L. 2017, ApJ, 843, 83
- Wu et al. (2014) Wu, Y., Liu, T., & Qin, S.-L. 2014, ApJ, 791, 123
- Zapata et al. (2011) Zapata, L. A., Loinard, L., Schmid-Burgk, J., et al. 2011, ApJ, 726, L12
- Zapata et al. (2009) Zapata, L. A., Schmid-Burgk, J., Ho, P. T. P., Rodríguez, L. F., & Menten, K. M. 2009, ApJ, 704, L45
Appendix A Table of rotational transitions
| Map | Molecule | Transition | Frequency | Scale | Notes | ||
| [MHz] | [K] | [s-1] | [Jy km beam-1 s-1] | ||||
| A | 13CH3OH | 84,4 93,7; A | 215722.475 | 162.3 | 9.1 10-6 | colour: 0.05 to 3.5 | |
| 5-2,4 4-2,3; E | 236062.000 | 52.1 | 3.8 10-5 | contour: 0.05 to 36 by 3.0 | |||
| 52,3 42,2; E | 236062.850 | 48.5 | 3.8 10-5 | ||||
| B | HCOOCH3 | 104,6 93,7; A | 221717.125 | 43.2 | 1.0 10-5 | colour: 0.05 to 6.5 | |
| 27-9,18 27-8,19; E | 222367.071 | 277.3 | 1.5 10-5 | contour: 0.05 to 3.6 by 0.3 | |||
| C | CH3OCH3 | 141,13 132,12; AA | 226346.051 | 98.9 | 3.3 10-5 | colour: 0.07 to 25 | a |
| 141,13 132,12; EE | 226346.927 | 98.9 | 3.3 10-5 | ||||
| 141,13 132,12; AE | 226347.803 | 98.9 | 3.3 10-5 | ||||
| 141,13 132,12; EA | 226347.804 | 98.9 | 3.3 10-5 | ||||
| 244,21 243,22; EA | 225202.460 | 296.4 | 4.7 10-5 | contour: 0.07 to 15 by 1.0 | |||
| 244,21 243,22; AE | 225202.460 | 296.4 | 4.7 10-5 | ||||
| 244,21 243,22; EE | 225203.946 | 296.4 | 4.7 10-5 | ||||
| 244,21 243,22; AA | 225205.431 | 296.4 | 4.7 10-5 | ||||
| D | CH2OCH2 | 72,6 61,5; ortho | 226072.102 | 47.0 | 1.7 10-4 | colour: 0.10 to 5.5 | b |
| 186,12 185,13; ortho | 234979.289 | 321.6 | 9.2 10-5 | contour: 0.05 to 1.7 by 0.15 | |||
| 187,12 186,13; para | 234979.462 | 319.9 | 9.2 10-5 | ||||
| E | CH3COOCH3 | 18-9,9 17-8,9; EA | 242955.602 | 86.3 | 1.0 10-4 | colour: 0.05 to 0.65 | c |
| 149,6 138,6; AE | 216462.024 | 63.0 | 9.2 10-5 | contour: 0.05 to 0.35 by 0.05 | |||
| F | HCOOCH2CH3 | 436,38 426,37; trans | 237566.732 | 275.9 | 2.6 10-4 | colour: 0.05 to 0.40 | d |
| 431,42 421,41; trans | 228399.191 | 247.0 | 2.3 10-4 | contour: 0.05 to 0.40 by 0.05 | e | ||
| G | CH3CH2OCH3 | 311,31 300,30; EE’ | 245274.088 | 188.8 | 9.5 10-5 | colour: 0.02 to 0.90 | f |
| 311,31 300,30; EE | 245274.088 | 188.8 | 9.5 10-5 | ||||
| 311,31 300,30; AE | 245274.098 | 188.8 | 4.8 10-5 | ||||
| 311,31 300,30; EA | 245274.211 | 188.8 | 4.8 10-5 | ||||
| 311,31 300,30; AA | 245274.221 | 188.8 | 4.8 10-5 | ||||
| 232,22 221,21; EE’ | 225494.508 | 111.0 | 3.4 10-5 | contour: 0.05 to 0.35 by 0.05 | g | ||
| 232,22 221,21; EE | 225494.508 | 111.0 | 3.4 10-5 | ||||
| 232,22 221,21; AE | 225494.625 | 111.0 | 1.7 10-5 | ||||
| 232,22 221,21; EA | 225495.848 | 111.0 | 1.7 10-5 | ||||
| 232,22 221,21; AA | 225495.965 | 111.0 | 1.7 10-5 | ||||
| H | HCOOH | 107,4 97,3 | 224911.799 | 215.0 | 6.5 10-5 | colour: 0.05 to 1.7 | |
| 107,3 97,2 | 224911.799 | 215.0 | 6.5 10-5 | ||||
| 108,2 98,1 | 224911.894 | 262.6 | 4.6 10-5 | ||||
| 108,3 98,2 | 224911.894 | 262.6 | 4.6 10-5 | ||||
| 100,10 90,9 | 220037.942 | 58.6 | 1.2 10-4 | contour: 0.05 to 3.2 by 0.20 | |||
| I | OHCH2CH2OH | 239,15 229,14; ag | 242947.990 | 176.1 | 3.0 10-4 | colour: 0.05 to 2.3 | h |
| 239,14 229,13; ag | 242948.591 | 176.1 | 3.0 10-4 | ||||
| 232,22 222,21; ag | 228752.776 | 132.8 | 2.9 10-4 | contour: 0.05 to 2.0 by 0.20 | i | ||
| J | CH3COOH | 200,20 190,19; E | 218010.014 | 112.1 | 1.7 10-4 | colour: 0.05 to 1.8 | j |
| 200,20 191,19; E | 218010.014 | 112.1 | 2.3 10-8 | ||||
| 201,20 190,19; E | 218010.014 | 118.8 | 2.3 10-8 | ||||
| 201,20 191,19; E | 218010.014 | 118.8 | 1.7 10-4 | ||||
| 220,22 211,21; E | 239305.851 | 134.6 | 4.4 10-5 | contour: 0.05 to 2.5 by 0.20 | |||
| 221,22 210,21; E | 239305.851 | 134.6 | 4.4 10-5 | ||||
| 220,22 210,21; E | 239305.851 | 134.6 | 1.8 10-4 | ||||
| 221,22 211,21; E | 239305.851 | 134.6 | 1.8 10-4 |
| Map | Molecule | Transition | Frequency | Scale | Notes | ||
| [MHz] | [K] | [s-1] | [Jy km beam-1 s-1] | ||||
| K | CH3CH2OH | 205,15 204,16; trans | 222217.285 | 208.3 | 6.5 10-5 | colour: 0.05 to 6.5 | k |
| 85,3 84,4; trans | 234984.238 | 61.6 | 5.8 10-5 | contour: 0.05 to 8.0 by 1.0 | |||
| L | CH3OCH2OH | 2210,12 2110,11 | 229025.777 | 184.0 | 3.9 10-6 | colour: 0.05 to 2.0 | |
| 2210,13 2110,12 | 229027.637 | 184.0 | 3.9 10-6 | ||||
| 2210,12 2110,11 | 229027.637 | 184.0 | 3.9 10-6 | ||||
| 2210,13 2110,12 | 229028.550 | 184.0 | 3.9 10-6 | ||||
| 234,19 224,18 | 246243.055 | 148.9 | 5.9 10-6 | contour: 0.05 to 1.8 by 0.20 | |||
| 234,19 224,18 | 246246.232 | 148.9 | 5.9 10-6 | ||||
| M | OHCH2CHO | 240,24 231,23 | 242957.815 | 148.3 | 4.2 10-4 | colour: 0.05 to 0.70 | l |
| 241,24 231,23 | 242957.904 | 148.3 | 5.6 10-6 | ||||
| 240,24 230,23 | 242957.983 | 148.3 | 5.6 10-6 | ||||
| 241,24 230,23 | 242958.072 | 148.3 | 4.2 10-4 | ||||
| 221,21 212,20 | 232286.154 | 134.5 | 3.1 10-4 | contour: 0.05 to 0.45 by 0.05 | m | ||
| N | CH3COCH3 | 221,21 212,20; EE | 229055.797 | 132.8 | 8.2 10-5 | colour: 0.07 to 18 | n |
| 221,21 211,20; EE | 229055.797 | 132.8 | 4.6 10-4 | ||||
| 222,21 212,20; EE | 229055.797 | 132.8 | 4.4 10-4 | ||||
| 222,21 211,20; EE | 229055.797 | 132.8 | 9.7 10-5 | ||||
| 202,18 193,17; AE | 218091.411 | 119.0 | 4.3 10-4 | contour: 0.07 to 9.0 by 1.0 | |||
| 203,18 192,17; AE | 218091.411 | 119.0 | 4.3 10-4 | ||||
| 202,18 193,17; EA | 218091.448 | 119.0 | 4.3 10-4 | ||||
| 203,18 192,17; EA | 218091.448 | 119.0 | 4.3 10-4 |
b) Cernicharo et al. (2016).
c) Partially blended with the red wing of a CH2DCN line (146,8 136,7 & 146,9 136,8) in the EG and ET peaks.
d) Tercero et al. (2015).
e) Blended with the red wing of a U line at 228408 MHz (assuming a of 7.5 km s-1) in the EG and ET peaks.
f) Tercero et al. (2015); partially blended with some emission from extreme velocities of 34SO2 (63,3 62,4) and SO2 (263,23 254,22) in the EG and ET peaks. Nevertheless, the emission at MF peak is not blended (see Fig. 3).
g) Blended with some emission from extreme velocities of SO18O (121,12 110,11), CH2DCN (138,5 128,4 & 138,6 128,5), and HCOOH (103,7 93,6) in the EG and ET peaks. Nevertheless, the emission at MF peak is not blended (see Fig. 3).
h) Cernicharo et al. (2016).
i) Brouillet et al. (2015).
j) Cernicharo et al. (2016).
k) Cernicharo et al. (2016).
l) Cernicharo et al. (2016); partially blended with the red wing of a CH2DCN line (146,8 136,7 & 146,9 136,8) in the EG and ET peaks.
m) Blended with some emission from extreme velocities of NH2CHO (112,10 102,9) in the EG and ET peaks.
n) Cernicharo et al. (2016).
Appendix B Determination of column densities
To model the emission of the studied species towards the MF, EG, and ET peaks, we extracted an averaged spectrum over 5 5 pixels (1′′1′′) around the emission peaks mentioned above, and using MADEX we calculated the synthetic spectrum between 213.7 GHz and 246.7 GHz for the different species and positions according to the physical parameters collected in Table 2. Owing to the lack of collisional rates for most of the studied species, we used the local thermodynamic equilibrium (LTE) approximation. Taking into account the physical conditions of the considered components of the cloud (see Table 2), we expect this approximation to work reasonably well.
For each spectral component and species, we assumed uniform physical conditions of the cloud: line width, radial velocity, and a source size slightly larger than the spatial resolution of these observations (3′′). Therefore, we left only the rotational temperature and the molecular column density as free parameters. However, as a first step, we relied on previous works (see e.g. Tercero et al. 2015; Cernicharo et al. 2016) to fix the rotational temperature at 150 K. Then we varied the column density to obtain an agreement in line intensity between model and observations better than 30% for all features of the studied species present in the frequency range of the ALMA SV data. Lines for which this condition was not fulfilled were revised searching for possible blendings with features from other molecular species. Finally, we adopted the model parameters if all spectral features that did not match with the synthetic spectrum were blended. We marked as the upper limit the column density results obtained with less than five unblended lines.
For certain species, some mismatches between model and data could not be explained due to line blending. We noted that lines which showed these discrepancies were high- and/or low-excitation lines. In these cases, we introduced a hotter (at 250 K) and/or colder (at 50 K) component to properly fit all unblended lines by varying the column densities of the different temperature components and following the criteria discussed above. The derived column density shown in Table 2 is the sum of the values obtained for the different temperature components.
In addition, for the most abundant species other components at different radial velocities have been included to reproduce the observed line profiles (see Table 2). We consider that these extra components come from adjacent parts of the region that partially overlap with the emission from the considered emission peaks.
| MF Peak(a) | EG Peak(b) | ET Peak(c) | ||||||||||
| = 05h 35m 14.102s, = 05∘ 22′ 36.84′′ | = 05h 35m 14.474s, = 05∘ 22′ 33.12′′ | = 05h 35m 14.440s, = 05∘ 22′ 34.74′′ | ||||||||||
| = 7.5 km s-1; = 2 km s-1; (H2)=8.21023 cm-2 | = 7.58.0 km s-1; = 3 km s-1; (H2)=2.41024 cm-2 | = 7.58.0 km s-1; = 3 km s-1; (H2)=1.81024 cm-2 | ||||||||||
| /(H2) | /(H2) | /(H2) | ||||||||||
| [K] | 1015 [cm-2] | 10-9 | [K] | 1015 [cm-2] | 10-9 | [K] | 1015 [cm-2] | 10-9 | ||||
| A. | CH3OH | 50 - 150 - 250 | 1080 | 1305 | 50 - 150 - 250 | 1260 | 540 | 50 - 150 - 250 | 3240 | 1800 | ||
| B. | HCOOCH3 | 50 - 150 - 250 | 240 | 293 | 150 | 60 | 25 | 50 - 150 - 250 | 240 | 133 | ||
| C. | CH3OCH3 | 50 - 150 - 250 | 100 | 122 | 150 - 250 | 60 | 25 | 50 - 150 - 250 | 110 | 61 | ||
| D. | CH2OCH2 | 150 | 2.7 | 3.3 | 150 | 2.0 | 0.8 | 150 | 3.3 | 1.8 | ||
| E. | CH3COOCH3 | 150 | 6.0 | 7.3 | 150 | 3.1 | 1.3 | 150 | 6.0 | 3.3 | ||
| F. | HCOOCH2CH3 | 150 | 3.0 | 3.7 | 150 | 2.0 | 0.8 | 150 | 4.0 | 2.2 | ||
| G. | CH3CH2OCH3 | 150 | 3.0 | 3.7 | 150 | 2.0 | 0.8 | 150 | 2.0 | 1.1 | ||
| H. | HCOOH | 150 | 0.3 | 0.4 | 150 | 1.5 | 0.6 | 150 | 1 | 0.6 | ||
| I. | OHCH2CH2OH | 150 | 0.3 | 0.4 | 150 | 5.3 | 2.2 | 150 | 3.2 | 1.8 | ||
| J. | CH3COOH | 150 | 0.4 | 0.5 | 150 | 4.5 | 1.9 | 150 | 2 | 1.1 | ||
| K. | CH3CH2OH | 50 - 150 - 250 | 4.0 | 4.9 | 50 - 150 - 250 | 7.0 | 2.9 | 50 - 150 - 250 | 64 | 36 | ||
| L. | CH3OCH2OH | 150 | 15 | 18 | 150 | 120 | 50 | 150 | 200 | 111 | ||
| M. | OHCH2CHO | 150 | 0.1 | 0.1 | 150 | 0.3 | 0.1 | 150 | 0.3 | 0.2 | ||
| N. | CH3COCH3 | 150 | 0.5 | 0.6 | 50 - 150 - 250 | 4.0 | 1.7 | 50 - 150 - 250 | 5.0 | 2.8 | ||
(a): Position in agreement with the MF1 peak of Favre et al. (2011a) and position A of Tercero et al. (2015).
(b): Position in agreement with the EG peak of Brouillet et al. (2015) and Favre et al. (2017).
(c): Position in agreement with the MF2 peak of Favre et al. (2011a) and position B of Tercero et al. (2015).
A: model for the -type lines (-type lines are optically thick); A + E states; 12C/13C = 45 (Tercero et al. 2010); another component has been included to properly fit the observed line profiles: MF peak: = 9.5 km s-1, = 3 km s-1, = 150 K, = 1.4 1018 cm-2; EG peak: = 6.0 km s-1, = 8 km s-1, = 150 K, = 1.8 1018 cm-2; ET peak: = 6.0 km s-1, = 8 km s-1, = 150 K, = 9.0 1017 cm-2.
B: model for the -type lines (-type lines are optically thick); A+E states; another component has been included to properly fit the observed line profiles: MF peak: = 9.0 km s-1, = 4 km s-1, = 150 K, = 1.0 1017 cm-2; EG peak: = 6.0 km s-1, = 8 km s-1, = 150 K, = 6.0 1016 cm-2.
C: AA + AE + EA + EE states; another component has been included to properly fit the observed line profiles: MF peak: = 9.0 km s-1, = 4 km s-1, = 150 K, = 3.0 1016 cm-2.
D: ortho + para symmetry.
E: AA + AE + EA + E3 + E4 states.
F: trans + gauche conformers.
G: AA + AE + EA + EE + EE’ states.
H: trans conformer.
I: (anti-gauche) + (gauche-gauche) conformers.
J: A + E states.
K: trans + gauche conformers; another component has been included to properly fit the observed line profiles: MF peak: = 9.0 km s-1, = 4 km s-1, = 150 K, = 1.5 1016 cm-2.
N: AA + AE + EA + EE states; another component has been included to properly fit the observed line profiles: EG peak: = 6.0 km s-1, = 8 km s-1, = 150 K, = 3.0 1015 cm-2; ET peak: = 6.0 km s-1, = 8 km s-1, = 150 K, = 2.0 1015 cm-2.
Appendix C Complementary Figures