Generalized Pearson correlation squares for capturing mixtures of bivariate linear dependences
Abstract
Motivated by the pressing needs for capturing complex but interpretable variable relationships in scientific research, here we generalize the squared Pearson correlation to capture a mixture of linear dependences between two real-valued random variables, with or without an index variable that specifies the line memberships. We construct generalized Pearson correlation squares by focusing on three aspects: the exchangeability of the two variables, the independence of parametric model assumptions, and the availability of population-level parameters. For the computation of the generalized Pearson correlation square from a sample without line-membership specification, we develop a -lines clustering algorithm, where , the number of lines, can be chosen in a data-adaptive way. With our defined population-level generalized Pearson correlation squares, we derive the asymptotic distributions of the sample-level statistics to enable efficient statistical inference. Simulation studies verify the theoretical results and compare the generalized Pearson correlation squares with other widely-used association measures in terms of power. Gene expression data analysis demonstrates the effectiveness of the generalized Pearson correlation squares in capturing interpretable gene-gene relationships missed by other measures. We implement the estimation and inference procedures in an R package gR2.
Keywords: Generalized Pearson correlation squares, dependence measures, Mixture of linear dependences, -lines clustering
1 Introduction
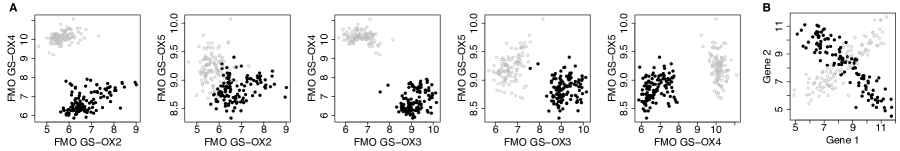
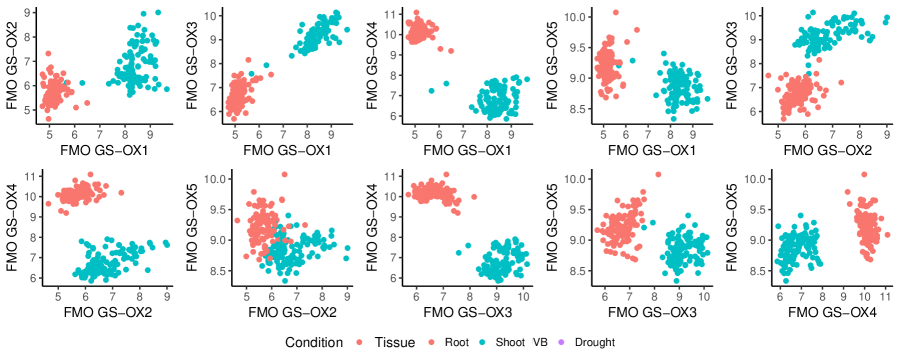
In scientific research, Pearson correlation and its rank-based variant Spearman correlation remain the most widely used association measures for describing the relationship between two scalar random variables. The reason underlying their popularity is two-fold: linear and monotone relationships111Monotone relationships becomes linear after values of each variable are transformed into ranks. are widespread in nature and interpretable to human experts. In many cases, though, the interesting relationship between two random variables often depends on another hidden categorical variable. Here is an example from gene expression data of Arabidopsis thaliana, a plant model organism, that many genes exhibit different linear dependences in root and shoot tissues (Li et al., 2008; Kim et al., 2012). Figure 1A shows pairwise gene expression levels of flavin-monooxygenase (FMO) genes to illustrate this phenomenon. For example, genes FMO GS-OX2 and FMO GS-OX5 show a positive correlation in shoots (black dots) but a negative correlation in roots (gray circles). In an idealistic and extreme scenario (Fig. 1B), suppose that two real-valued random variables and represent the expression levels of two genes. If and have a positive correlation in the shoot tissue but a negative correlation in the root tissue, and that the two tissues are expected to have equal representation in a study, then and would have a population-level Pearson correlation equal to zero. Real scenarios are usually not so extreme, but many of them exhibit a mixture relationship composed of two linear dependences with mixed signs (Li, 2002), or show the “Simpson’s Paradox,” (Simpson, 1951; Pearson et al., 1899; Yule, 1903; Blyth, 1972), where the overall correlation and the conditional correlations have opposite signs. Under such scenarios, Pearson correlation is a misleading measure, as it specifically looks for a single linear dependence. Moreover, these scenarios often lack an index variable (e.g., the shoot/root tissue type) that segregates observations into distinct linear relationships, and numerous variables pairs (e.g., gene pairs) need to be examined to discover unknown, but interesting and interpretable associations. Therefore, an association measure is in much demand to capture such relationships that are decomposable into a (possibly unknown) number of linear dependences, in a powerful and efficient way.
In the literature of scalar-valued association measures, also known as dependence measures, many measures have been developed to capture dependent relationships more general than linear dependence. The first type of measures aims to capture more general functional (i.e., one-to-one) relationships. For monotone relationships, the Spearman’s rank correlation (Spearman, 1904) and the Kendall’s (Kendall, 1938) are commonly used. For functional relationships more general than monotonicity, there are measures including the maximal correlation efficient (Hirschfeld, 1935; Gebelein, 1941; Rényi, 1959), measures based on nonparametric estimation of correlation curves (Bjerve and Doksum, 1993) or principal curves (Delicado and Smrekar, 2009), generalized measures of correlation that deals with asymmetrically explained variances and nonlinear relationships (Zheng et al., 2012), the statistic derived from a regularized likelihood ratio test for piecewise-linear relationships (Wang et al., 2017), and measures for detecting local monotone patterns using count statistics (Wang et al., 2014). The second type of measures aims to capture general dependence so that they only give zero values to independent random variable pairs. Examples include the maximal correlation coefficient, the Hoeffding’s (Hoeffding, 1948), the mutual information (Shannon et al., 1951; Kraskov et al., 2004; Cover and Thomas, 2012), kernel-based measures such as the Hilbert-Schmidt Independence Criterion (HSIC) (Gretton et al., 2005), the distance correlation (Székely et al., 2007, 2009), the maximal information coefficient (Reshef et al., 2011), and the Heller-Heller-Gorfine (HHG) association test statistic based on ranks of distances (Heller et al., 2012). Specifically, the following measures are not restricted to comparing real-valued random variables: the Hoeffding’s , the mutual information, the HSIC, the distance correlation, and the HHG test statistic, among which the first four measures have the range as opposed to having absolute values no greater than one.
The two types of measures both have relative advantages and limitations. Measures of the first type are generally interpretable but cannot capture non-functional (i.e., not one-to-one) relationships that are widespread in the real world. In contrast, measures of the second type, though being versatile and having desirable theoretic properties, do not convey a straightforward interpretation of their captured relationships to practitioners. As our motivating example has shown (Fig. 1), there are widespread relationships that are decomposable into a small number of linear dependences. Since linear dependence is the simplest and most interpretable relationship, a mixture of a small number of linear dependences is also interpretable and often of great interest in scientific research. For example, if researchers observe that one gene positively regulates a vital cancer gene in one cancer subtype but exhibits adverse regulatory effects in another subtype, different treatment strategies may be designed for the two cancer subtypes. However, capturing mixtures of linear dependences remains challenging: the first type of measures often miss them, and the second type of measures cannot distinguish them from other relationships that are less interpretable. Although mixtures of linear models/regressions have been of a broad interest in fields including statistics, economics, social sciences, and machine learning for over 40 years (Quandt and Ramsey, 1978; Murtaph and Raftery, 1984; De Veaux, 1989; Jacobs et al., 1991; Jones and McLachlan, 1992; Wedel and DeSarbo, 1994; Turner, 2000; Hawkins et al., 2001; Hurn et al., 2003; Leisch, 2008; Benaglia et al., 2009; Scharl et al., 2009), they did not propose an association measure to capture this particular type of non-functional relationships, and neither do they trivially lead to a reasonable association measure, as we will explain below.
In this work, we propose generalized Pearson correlation squares, for which the squared Pearson correlation is a special case, to capture a mixture of linear dependences. We consider two scenarios: the specified scenario where an index variable indicates the line membership of each observation, and the unspecified scenario that is more widespread in applications where no index variable is available. For a reasonable generalization, we make our new measures satisfy an essential property—the exchangeability between and —embraced by most existing association measures. We also desire our measures to have both population-level parameters and sample-level statistics, just as Pearson correlation, maximal correlation, and distance correlation do, so that statistical inference becomes feasible. To achieve these goals, our development has successfully addressed four critical questions.
-
•
First, under the unspecified scenario, can we directly use the existing work on mixtures of linear models/regressions? The answer is no because these models require a specification of which variable is the response and which is the predictor; in other words, they do not consider and symmetric. Except for the degenerate case where only one component exists, i.e., the linear model, these models do not lead to a measure exchangeable between and .
-
•
Second, still under the unspecified scenario, how to assign observations to lines to ensure the exchangeability of and ? A good assignment should be capable of handling general cases where observations from each line do not follow a specific distribution (required by model-based clustering) or have a spherical shape (required by -means clustering). To handle such cases, we propose a new -lines clustering algorithm in Section 2.3.
-
•
Third, how should we define population-level measures to enable proper inference? A critical point is that the specified and unspecified scenarios need different population-level measures; otherwise, it would be impossible to construct unbiased estimators for both scenarios without distributional assumptions. We will elaborate on this point in Section 3.
-
•
Fourth, when an index variable is available, should we always use it to specify line memberships? Surprisingly, the answer is no because the index variable may be uninformative or irrelevant to the segregation of lines. In that case, it is more informative to directly learn line memberships from data by clustering. We will demonstrate this point in a real data study in Section 5.1.
This paper is organized as follows. In Section 2, we define generalized Pearson correlation squares on the sample level, under the line-membership specified and unspecified scenarios. For the unspecified scenario, we develop a -lines clustering algorithm. In Section 3, we define the population-level generalized Pearson correlation squares and derive the asymptotic distributions of the corresponding sample-level measures to enable efficient statistical inference. In Section 4, we conduct simulation studies under various settings to verify the asymptotic distributions and evaluate the finite-sample statistical power of the proposed measures. In Section 5, we demonstrate the use of the generalized Pearson correlation squares in two real data studies, followed by discussions in Section 6. Supplementary Material includes all the proofs of lemmas and theorems, convergence properties of the -lines algorithm, more simulation results, real data description, and more figures.
2 Sample-level generalized Pearson correlation squares
The Pearson correlation coefficient is the most widely used similarity measure to describe the relationship between two random variables . The sample-level Pearson correlation coefficient is defined based on a sample from the joint distribution of , where and . Motivated by the fact that , the Pearson correlation square, is commonly used to describe the observed linear dependence in a bivariate sample, we develop generalized Pearson correlation squares to capture a mixture of linear dependences. We will construct the sample-level measures in this section and their population-level counterparts in the next section.
We define the line-membership specified scenario as the case where we also observe an index random variable that specifies the linear dependence between and , and is the number of linear dependences. In parallel, we define the line-membership unspecified scenario as the case where no index variable is available. In the special case of , we have . There may exist more than one index variable, and correspondingly there could be multiple specified scenarios. For example, in the Arabidopsis thaliana gene expression dataset (Table S1 in the Supplementary Material), there are four index variables (condition, treatment, replicate and tissue), leading to four different specified scenarios. As we will show in Section 5.1, only the specification by the tissue variable leads to a set of linear relationships that fit well to the data (Fig. 1 and Figs. S4–S6 in the Supplementary Material). Hence, a specified scenario should not be always preferred to the unspecified scenario when the goal is to capture an informative mixture of linear dependences.
2.1 Line-membership specified scenario
Under the line-membership specified scenario, we consider a sample , , from the joint distribution of .
Definition 2.1.
At the sample level, when observations have line memberships specified, the generalized Pearson correlation square is defined as
| (1) |
where the subindex stands for generalized, stands for specified, , and
with , , and .
The is a weighted sum of the ’s of all line components, i.e., . Variables and are exchangeable in the measure . Motivated by the above definition, we next define its counterpart under the more common scenario in which no index variable is observable.
2.2 Line-membership unspecified scenario
We consider a sample , , from the joint distribution of , which we refer to as the line-membership unspecified scenario. As line-membership information is unavailable, we will first assign each pair to a line. Towards that, we define the sample-level unspecified line centers as the lines that minimize the average squared perpendicular distance of data points to their closest line. We use a shorthand notation to denote the line . Because we wish and to be exchangeable in the new measure, a reasonable distance from to is the perpendicular distance :
| (2) |
Definition 2.2.
Let be a multiset of lines with possible repeats. We define the average within-cluster squared perpendicular distance as
| (3) |
where is the empirical measure by placing mass at each of . Then we define the multiset of sample-level unspecified line centers as
| (4) |
where the subindex stands for unspecified. We write each solution to (4) as , where is the -th line center.
To find , we propose the -lines clustering algorithm, which is related to and inspired by the well-known -means algorithm (Lloyd, 1982). The -means algorithm cannot account for within-cluster correlation structures but only identifies spherical clusters under a distance metric, e.g., the Euclidean distance. In contrast, the -lines algorithm finds clusters that exhibit strong within-cluster correlations; it is specifically designed for applications where two real-valued variables may have distinct correlations in different hidden clusters.
As an iterative procedure, the -lines clustering algorithm includes two alternating steps in each iteration. The recentering step uses the current cluster assignment (i.e., line membership) to update each cluster line center, which minimizes the within-cluster sum of squared perpendicular distances of data points to the line center. The assignment step updates the cluster assignment based on the current cluster line centers: assign every data point to its closest cluster line center in the perpendicular distance. The two steps alternate until the algorithm converges.
-lines clustering algorithm
| Assign random initial clusters , such that |
| The algorithm proceeds by alternating between two steps. In the -th iteration, |
| Recentering step: Calculate the cluster line centers based on the |
| cluster assignment by (5) |
| Assignment step: Update the cluster assignment for |
| Stop the iteration when the cluster assignment no longer changes |
| Output: Cluster assignment ; Sample-level unspecified line centers |
The recentering step updates each cluster center using the major axis regression, which minimizes the sum of squares of the perpendicular distance between each point and the regression line. It was shown that the major axis regression line is the first principal component of the sample covariance matrix of (Jolliffe, 1982; Smith, 2009). Given the cluster assignment in the -th iteration: , the updated -th cluster center is
| (5) |
where is the first principal component of the sample covariance matrix
with and .
Similar to the -means clustering algorithm, the -lines clustering algorithm is not guaranteed to find the global minimizer, . Empirically, we run the -lines clustering algorithm for times with random initializations and obtain multisets of unspecified line centers . Then we set .
Powered by the -lines algorithm, we introduce the sample surrogate indices , , based on which we then define the sample-level generalized Pearson correlation square for this line-membership unspecified scenario.
Definition 2.3.
Suppose that Algorithm 2.2 outputs unspecified line centers . Also suppose that the probability that is equally close to more than one line centers is zero. For each , we define its sample surrogate index
| (6) |
Definition 2.4.
At the sample level, when observations have line memberships unspecified, the generalized Pearson correlation square is defined as
| (7) |
where the subindex stands for generalized, stands for unspecified, , and
with , , and .
2.3 Data-driven choice of in the unspecified scenario
When users do not have prior knowledge about the value of , how to choose becomes an important question in practice. Some methods for choosing in -means clustering can be adapted. For example, the elbow method, though not being theoretically principled, is visually appealing to practitioners and widely used. It employs a scree plot whose horizontal axis displays a range of values, and whose vertical axis shows the average within-cluster sum of squared distances corresponding to each . For our -lines algorithm, it is reasonable to use a scree plot to show how , the average within-cluster squared perpendicular distance defined in (3), decreases as increases.
Alternatively, when it is reasonable to assume that follows a bivariate Gaussian distribution for all , one may use the Akaike information criterion (AIC) (Akaike, 1998) to choose . Specifically, AIC is defined as
| (8) | ||||
where the first term is because there are parameters for each component and the component proportions sum to ; in the second term, , , and
We will demonstrate the elbow method and the AIC method in Section 4.2.
3 Population-level generalized Pearson correlation squares and asymptotics
In this section, we will define the population-level generalized Pearson correlation squares and derive the asymptotic theory for the corresponding sample-level statistics. The foundation of our work is the population-level Pearson correlation coefficient: , where , , and denote the covariance between and , the variance of , and the variance of , respectively. We say that and are linearly dependent if .
3.1 Line-membership specified scenario
Under the line-membership specified scenario, we denote , . Conditional on , the population-level Pearson correlation between and is , if and ; otherwise, . In the special case of , is the population-level Pearson correlation square that indicates the population-level strength of a linear dependence. Motivated by this, we combine into one measure to indicate the overall strength of linear dependences.
Definition 3.1.
At the population level, when the line membership variable is specified, the generalized Pearson correlation square between and is defined as
| (9) |
which is a weighted sum of , i.e., the strengths of the linear dependences, with weights as . Note that the subindex stands for generalized, and stands for specified.
We use lines to represent the joint distribution of , based on the perpendicular distance defined in (2), the conditional means and , and the conditional covariance matrix
Definition 3.2.
The population-level specified line center of the -th component is
| (10) |
Let be the eigenvector associated with the largest eigenvalue of . Then is the line
where , , and .
3.2 Line-membership unspecified scenario
Under the line-membership unspecified scenario, we investigate a mixture of linear dependences between and without observing any index variable . Motivated by Definition 3.2, we define the population-level line centers for the unspecified scenario as the lines that minimize the expected squared perpendicular distance of to its closest line.
Definition 3.3.
We define the expected within-cluster squared perpendicular distance as
| (11) |
where is the joint probability measure of . Then we define a multiset of population-level unspecified line centers, , where is the -th line center, as
| (12) |
Provided that is uniquely determined, we define a random surrogate index as the index of the line center to which is closest.
Definition 3.4.
Suppose that the unspecified line centers at the population level are unique. Also, suppose that the probability that is equally close to multiple line centers is zero. We define a random surrogate index as
| (13) |
Motivated by , we define the population-level generalized Pearson correlation square for the line-membership unspecified scenario, based on .
Definition 3.5.
At the population level, when no line membership variable is specified (the “unspecified scenario”), the generalized Pearson correlation square between and is defined as
| (14) |
where the subindex stands for generalized, stands for unspecified, , and .
Remark 1.
Relations and distinctions between the specified and unspecified scenarios.
-
1.
, which is reasonable as does not have information about .
-
2.
. The proof is in the Supplementary Material.
-
3.
is not an estimator of ; rather, it is an estimator of . Our construction does not rely on a specific distributional assumption, e.g., bivariate Gaussian mixture model. This property makes the generalized Pearson correlation squares more flexible, just as the Pearson correlation that does not rely on any distributional assumptions either. If the goal were to use as an estimator of , a specific mixture model must be assumed. Then the -lines algorithm should be replaced by the Expectation-Maximization (EM) algorithm to decide the sample surrogate indices . When the EM algorithm converges to the global optimum and returns the maximum-likelihood estimates of mixture model parameters, the corresponding will be an asymptotically unbiased estimator of .
3.3 Asymptotic distributions of and
We first derive the asymptotics of , which is also a foundation for the asymptotics of .
Theorem 3.1.
Under the line-membership specified scenario, we define
Assume and for all . Then
| (15) |
Note that Theorem 3.1 does not rely on any distributional assumptions. When it is applied to the special case where follows a bivariate Gaussian distribution, we obtain a much simpler form of the first-order asymptotic distribution of .
corollary 3.2.
Under the special case where follows a bivariate Gaussian distribution for all , the asymptotic variance of in Theorem 3.1 is simplified and becomes
| (16) |
which only depends on and .
To derive an analog of Theorem 3.1 and Corollary 3.2 for the unspecified scenario, we need to show that each sample surrogate index , , converges in distribution to the random surrogate index . A sufficient condition is the strong consistency of the sample-level unspecified line centers to the population-level unspecified line centers .
Theorem 3.3.
Suppose that and that for each there is a unique multiset . Also assume that the globally optimal sample-level unspecified line centers is attained and unique. Then as , almost surely, and almost surely.
The first statement of Theorem 3.3 means that there exists an ordering of the elements in and such that as the sample size ,
| (17) |
Theorem 3.4.
Under the line-membership unspecified scenario, we define
where is the random surrogate index defined in (13). Assume and for all . Then
| (18) |
Applying Theorem 3.4 to the special case where follows a bivariate Gaussian distribution, we obtain a much simpler form of the first-order asymptotic distribution of .
corollary 3.5.
When follows a bivariate Gaussian distribution for all , the asymptotic variance of is simplified and becomes
| (19) |
which only depends on and .
Remark 2.
4 Numerical simulations
In this section, we perform simulation studies to numerically verify the theoretical results in Section 3 and to compare our generalized Pearson correlation squares with multiple existing association measures in terms of statistical power. We also demonstrate the effectiveness of our proposed approaches for choosing , the number of line components in the line-membership unspecified scenario.
4.1 Numerical verification of theoretical results
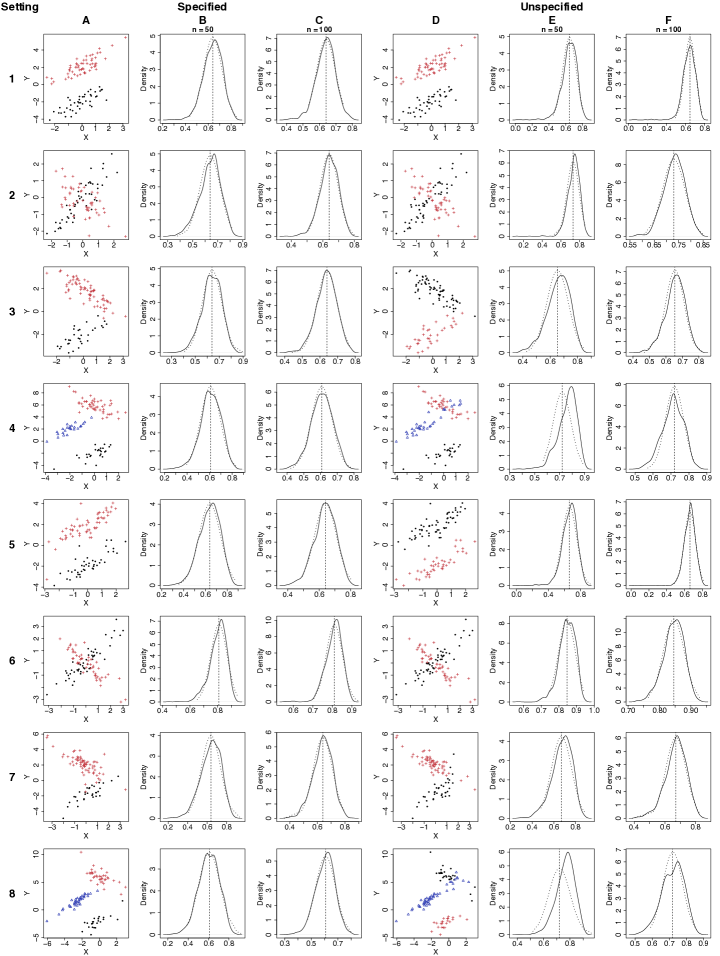
We first compare the asymptotic distributions in Section 3 with numerically simulated finite-sample distributions under eight settings (Table 1), where follows a bivariate Gaussian distribution under the first four settings and a bivariate distribution under the latter four settings. Under each setting, we generate samples with sizes or , calculate and on each sample, and compare the simulated finite-sample distributions of and to the corresponding asymptotic distributions. In the first four settings, the asymptotic distributions are from Corollaries 3.2 and 3.5 (the bivariate Gaussian results); in the latter four settings, the asymptotic distributions are from Theorems 3.1 and 3.4 (the general results). The comparison results (Fig. 2) show that the finite-sample distributions and the asymptotic results have good agreement, justifying the use of the asymptotic distributions for statistical inference of or on a finite sample.
| Setting | Population | Parameters | |
| 1 | |||
| , | |||
| 2 | Specified: | ||
| , | |||
| 3 | , | ||
| Unspecified: | , | ||
| , | |||
| 4 | , , | ||
| , , | |||
| , , | |||
| 5 | , | ||
| , | |||
| 6 | Specified: | , | |
| , | |||
| 7 | , , | ||
| Unspecified: | , | ||
| , | |||
| 8 | , , | ||
| , , | |||
| , , |
In practice, often needs to be found in a data-driven way under the line-membership unspecified scenario. To verify the behavior of when is chosen by the AIC in (8), we conduct another simulation study to compare ’s finite-sample distributions with the asymptotic distributions. The results (Fig. S1 in the Supplementary Material) show that when , the agreement between finite-sample distributions and asymptotic distributions is still reasonably good. This observation justifies the use of our asymptotic results in practice.
However, the asymptotic distributions in Section 3 involve unobservable parameters in the asymptotic variance terms. A classical solution is to plug-in estimates of these parameters. Another common inferential approach is to use the bootstrap, which is computationally more intensive, instead of the closed-form asymptotic distributions. Here we numerically verify whether the plug-in approach works reasonably well for statistical inference of and . Under each of the eight settings, we simulate two samples with sizes and , respectively. We then use each sample to construct a confidence interval (CI) of and as and , respectively. We construct the standard errors and in two ways: square roots of (a) the plug-in estimates of the asymptotic variances of and , or (b) the bootstrap estimates of and . We also calculate the true asymptotic variances of and based on true parameter values and use them to construct the theoretical CIs. The results (Fig. S2 in the Supplementary Material) show that the plug-in and bootstrap approaches construct similar CIs on the same sample. When increases from to , the CIs constructed by both approaches agree better with the theoretical CIs.
We also evaluate the coverage probabilities of the CIs constructed by the plug-in approach and compare them with those of the theoretical CIs. Table 2 summarizes the results. The theoretical CIs have coverage probabilities close to under all the eight settings, providing additional verification of the asymptotic distributions. Overall the plug-in confidence intervals have good coverage probabilities, which are increasingly closer to as increases. Their coverage probabilities are in general closer to under the first four bivariate Gaussians settings than under the last four bivariate settings. The reason is that mixtures of bivariate Gaussians are more concentrated on lines and better allow the -lines algorithm to find the sample-level unspecified line centers, thus reducing the unwanted variance due to failed algorithm convergence and making the plug-in variance estimate of more accurate. Comparing the line-membership specified and unspecified scenarios, the plug-in confidence intervals, as expected, have better coverage probabilities under the specified scenario that has less uncertainty. Table 2 also shows that the two plug-in options do not have obvious differences, suggesting that the first plug-in option (“P1”), which uses the asymptotic variances in the special bivariate Gaussian forms (Corollaries 3.2 and 3.5), is robust and can be used in practice for its simplicity.
| Setting | 95% CI Coverage Probability | ||||||
| Specified | Unspecified | ||||||
| Asymp. | P1 | P2 | Asymp. | P1 | P2 | ||
| 1 | |||||||
| 2 | |||||||
| 3 | |||||||
| 4 | |||||||
| 5 | |||||||
| 6 | |||||||
| 7 | |||||||
| 8 | |||||||
4.2 Use of scree plot and AIC to choose
Following Section 2.2, here we demonstrate the performance of the scree plot and the AIC in choosing under the eight simulation settings. For each setting, we simulate a sample of size and evaluate in (3) and in (8) on this sample for ranging from to . Figure 3 shows the results. For all the eight settings, the scree plots and the AIC both suggest the correct values. Even though Settings – violate the bivariate Gaussian assumption required by the AIC, the AIC results are still reasonable. In practice, users may use the scree plot together with the AIC to decide a reasonable choice of .

4.3 Power analysis
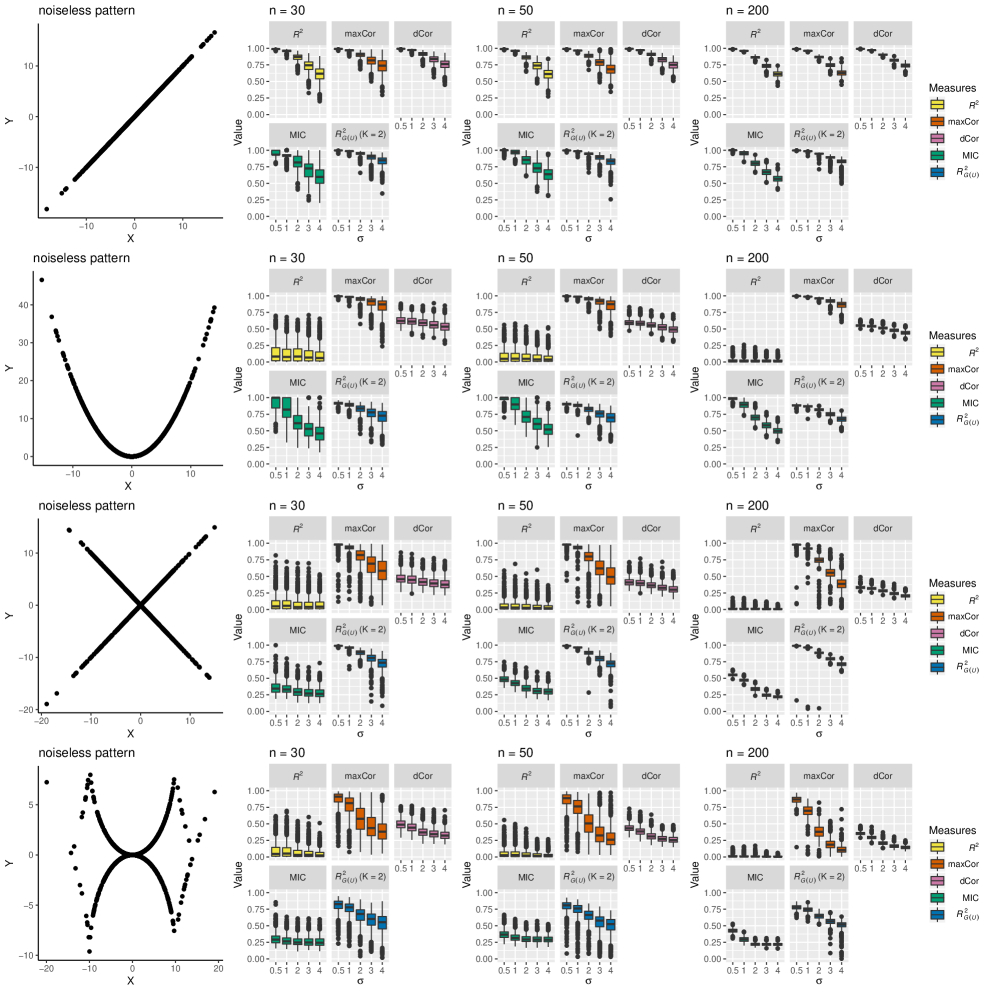
To confirm that is a powerful measure for capturing mixed linear dependences, we conduct a simulation study to compare with four existing association measures: the squared Pearson correlation (), the maximal correlation (maxCor) (Hirschfeld, 1935; Gebelein, 1941; Rényi, 1959) estimated by the alternating conditional expectation algorithm (Breiman and Friedman, 1985), the distance correlation (dCor) (Székely et al., 2007, 2009), and the maximal information coefficient (MIC) (Reshef et al., 2011) implemented in R package minerva (version 1.4.7). All five measures have values in . Our simulation procedure follows the study of Simon and Tibshirani (2014), where each relationship between two real-valued random variables and is composed of a marginal distribution of , a noiseless pattern (i.e., relationship) between and , and a random error from added to . The null hypothesis is that and are independent, while the alternative hypothesis is specified by the noiseless pattern and . Given a sample size , or , we simulate samples from the alternative hypothesis. On each of these alternative samples, we randomly permute the observations to create a null sample. Then for each we calculate the five association measures on the null samples and decide a rejection threshold for each measure as the quantile of its values, where is the significance level. Next, we calculate the five association measures on the alternative samples, compare each measure’s values to its rejection threshold, and estimate the measure’s power as the proportion of values above the threshold. Figure S3 in the Supplementary Material illustrates each measure’s empirical distribution across alternative samples at each and . All the measures exhibit decreasing variances as increases.
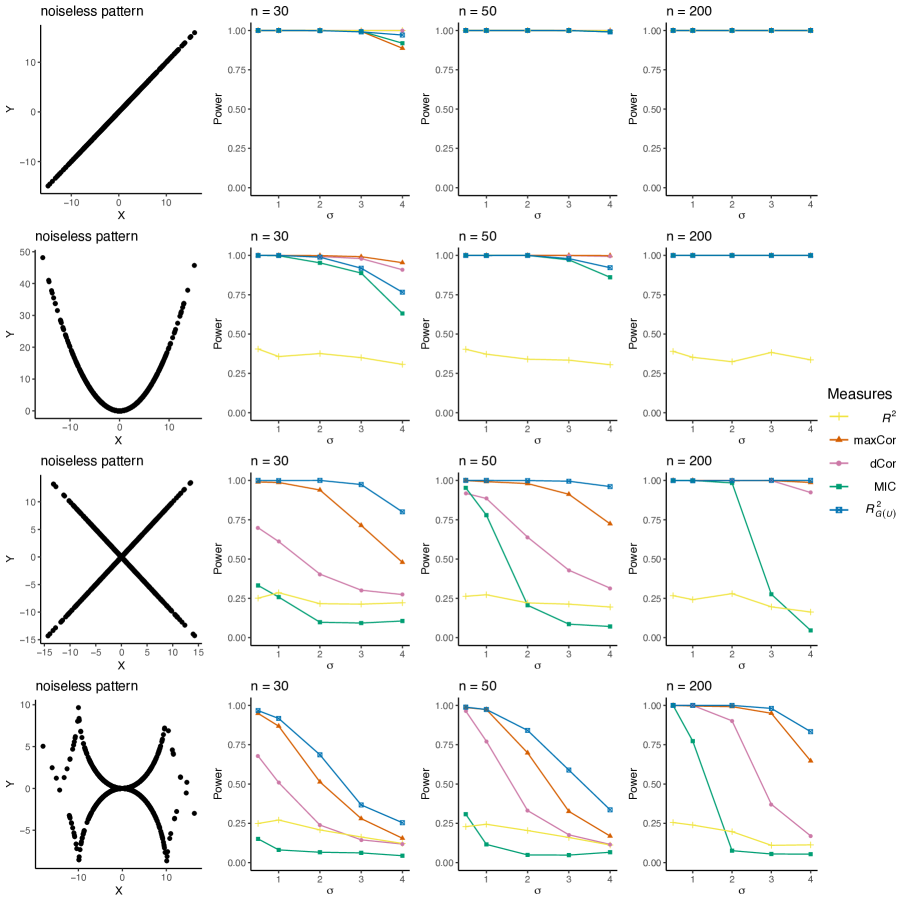
Figure 4 shows that is the most powerful measure when the pattern is a mixture of positive and negative linear dependences. When the pattern is a mixture of nonlinear relationships that can be approximated by a mixture of linear dependences, is still the most powerful. When the pattern is linear, is expectedly the most powerful, and the other four measures, including , also have the perfect power up to at . Under a parabola pattern, maxCor is most powerful, while has low power as expected. Since two intersecting lines can well approximate the parabola pattern, also has good power and is comparable to maxCor, dCor, and MIC, which all aim to capture general dependence. These results confirm the application potential of in capturing complex but interpretable relationships that can be approximated by mixtures of linear dependences.
5 Real data applications
5.1 Gene expression analysis in Arabidopsis thaliana
Back to our motivating example in Arabidopsis thaliana, we would like to use this gene expression data (Li et al., 2008) to demonstrate the use of our generalized Pearson correlation squares in capturing biologically meaningful gene-gene relationships. The glucosinolate (GSL) biosynthesis pathway has been well studied in Arabidopsis thaliana, and genes in this pathway have been experimentally identified (Kim et al., 2012). Since genes in the same pathway are functionally related, their pairwise gene expression relationships should be distinct from their relationships with other genes outside of the pathway. Hence, a powerful association measure should be able to distinguish the pairwise gene-gene relationships within the GSL pathway from the relationships of randomly paired GSL and non-GSL genes.
The data (Table S1 in the Supplementary Material) contain four index variables: “condition” (oxidation, wounding, UV-B light, and drought), “treatment” (yes and no), “replicate” (1 and 2), and “tissue” (root and shoot). We observe that only the “tissue” variable is a good indicator of linear dependences, as illustrated in Fig. 1 and Figs. S4–S6 in the Supplementary Material.
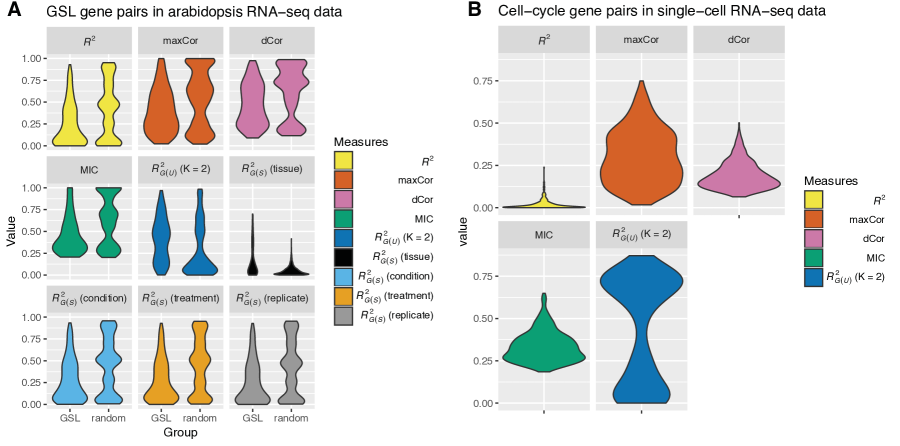
Figure 5A shows the values of , maxCor, dCor, MIC, and , all of which do not use index variables, as well as , which uses the index variable as “condition,” “treatment,” “replicate,” or “tissue.” All these measures were computed for GSL gene pairs and randomly paired GSL and non-GSL genes. Among these measures, only and show stronger relationships within the GSL pathway than in random gene pairs. These results demonstrate that is a useful and powerful measure when a good index variable is available; otherwise, is advantageous in capturing complex but interpretable gene-gene relationships without knowledge of index variables.
Besides, we verify the performance of our -lines clustering algorithm on this real dataset. For every GSL gene pair, we compare the two clusters identified by the algorithm with the two tissue types (root and shoot) using Fisher’s exact test. The results show that , , or of the gene pairs have -values under , , or , suggesting that the algorithm finds a reasonable separation of tissue types for most gene pairs.
5.2 Cell-cycle gene expression analysis on single-cell RNA sequencing data
In the second application, we study a single-cell RNA-sequencing dataset that includes gene expression levels in mouse cells, which span three cell-cycle stages: G1, G2M, and S (Buettner et al., 2015). Information on the data accession and preprocessing is available in the Supplementary Material. Our exploratory data analysis suggests that the cell stage is not a good index variable for linear dependences, so we do not include but apply , maxCor, dCor, MIC, and to study pairwise relationships among mouse cell-cycle genes.
We randomly select cell-cycle gene pairs, compute the five measures on each pair, and summarize the empirical distribution of each measure. In Fig. 5B, is the only measure that shows a two-mode distribution, revealing that certain cell-cycle gene pairs have strong relationships that are distinct from the rest. This result is biologically reasonable because some cell cycle genes are known to function together, while others do not. In contrast, has dominantly low values, indicating its low power in detecting complex gene-gene relationships from a mix of cells in multiple cell-cycle stages. The other three measures, maxCor, dCor, and MIC, though having overall larger values than , still do not show a clear division of cell-cycle gene pairs into the strongly related ones and others. Hence, from a scientific discovery perspective, reveals the most information among the five measures.
Although experimental validation is required to systematically verify the strongly related genes found by , as a preliminary study, here we search the literature to investigate the top gene pairs ranked by . For example, the gene pair Cdc25b–Lats2 has the highest value, and their physical interaction was previously reported (Mukai et al., 2015). Moreover, Lats2 appears in gene pairs, among which pairs are among the top pairs in values. This result is consistent with the fact that Lats2 is an essential regulator that interacts with many cell-cycle genes (Yabuta et al., 2007).
6 Discussions
The generalized Pearson correlation squares, for the first time to our knowledge, extend the classic and popular Pearson correlation to capturing heterogeneous linear relationships. This new suite of measures has broad potential use in scientific applications. In addition to gene expression analysis, statistical genetics, for example, is another important application domain. It was reported that across human subpopulations, a genotype might exhibit heterogeneous associations with a phenotype (Haiman et al., 2007; Wheeler et al., 2017). However, known subpopulations, e.g., race, gender, and geography, cannot explain some observed mixtures of associations. Hence, and the -lines algorithm will be useful.
A future direction is to extend the generalized Pearson correlation squares to be rank-based. This extension will make the measures robust to outliers and capable of capturing a mixture of monotone relationships.
Software
We have implemented the inference of the specified and unspecified generalized Pearson correlation squares, the -lines algorithm, as well as the choice of , in an R package gR2 available at GitHub: https://github.com/lijy03/gR2.
Supplementary Material for “Generalized Pearson correlation squares for capturing mixtures of bivariate linear dependences”
S1 Proofs
S1.1 Proof of Theorem 3.1
Proof.
We derive the asymptotic distribution of the sample-level specified generalized Pearson correlation square, , in this proof. For notation simplicity, we drop the subscript “” in and in in Section 3.1, and , , , and in Definition 2.1, following which we have
where
with and .
To derive the asymptotic distribution of , we need to first derive the joint asymptotic distribution of
To facilitate the rest of the proof, we define the following sample moments.
for . Then
| Similarly, | |||
Hence,
Given any , the function is
| (20) |
with Jacobian
where
To derive the joint asymptotic distribution of , we need the joint asymptotic distribution of
where
because .
For notation simplicity, we denote and , and thus can be expressed as
Hence, the joint asymptotic distribution of can be derived based on the central limit theorem.
The joint moments satisfy
and thus specifically,
By the central limit theorem, the joint asymptotic distribution of is
| (21) |
where
with
and
For , is the variance-covariance matrix of :
where
That is,
For , is the covariance matrix of and
:
where
That is,
Applying Cramér’s Theorem (Ferguson, 1996) to function (Equation (20)) and the joint asymptotic distribution of (Equation (21)), we have the joint asymptotic distribution of as
| (22) |
where
and
Evaluating the Jacobian of at , we have
with
Hence,
where for ,
and for ,
With the joint asymptotic distribution of , our final step is to derive the asymptotic distribution of .
Given any , we define a function as
Hence,
The gradient of is
Applying Cramér’s Theorem (Ferguson, 1996) to the joint asymptotic distribution of (Equation (22)), we have
Evaluating the gradient of at , we have
Hence,
For ,
For ,
Hence,
Therefore, the asymptotic distribution of is
which completes the proof. ∎
S1.2 Proof of Corollary 3.2
Proof.
Following the proof of Theorem 3.1, where we assume without loss of generality that
Then in this special case, with the same notations used in the proof of Theorem 3.1, we have
with the following moments
Hence,
Provided that
the joint asymptotic distribution of in (15) becomes (16), which completes the proof. ∎
S1.3 Proof of Theorem 3.3
The first statement of Theorem 3.3 means that there exists an ordering of the elements in and such that as the sample size ,
| (23) |
Theorem 3.3 only hinges on three conditions. The first condition
where is the norm in , holds for many common probability measures on . This is to ensure that is finite for every , , because for each , where or (without loss of generality, we assume and below),
| (24) |
where the first inequality holds by the definition of (2), because is a point on the line defined by . The second uniqueness condition on is needed for the inductive argument in the proof.
We first prove the following lemma.
Lemma S1.1.
Given two points and a line where with or , the following inequality holds.
| (25) |
where represents the norm.
Proof.
Leveraging Lemma S1.1 and the strong consistency result of the -means clustering (Pollard, 1981), we derive the strong consistency of the sample-level unspecified line centers found by the -lines clustering algorithm (Algorithm 2.2). A key technical challenge we need to tackle in this proof is the handling of two types of points, where the data type refers to the data points , and the center type corresponds to the lines , where or , , as cluster centers. In this proof, without loss of generality, we assume , , because we can always find a vertical shift of the data and the lines to satisfy this condition. To simplify the following discussion, we define a center point as an equivalent representation of a line , such that
| (31) |
so that , where the perpendicular distance is defined in Equation (2).
We define the distance between a data point and a center point not as the usual Euclidean distance but as
Note that is not a metric, and if and only if .
The result in Lemma S1.1 now translates to
| (32) |
For the rest of the proof, we denote the set of cluster centers using two equivalent representations:
-
1.
, where each cluster center is represented by a center point.
-
2.
, where each line , where or .
The one-to-one relationship between and follows from (31). Hence, there is a one-to-one correspondence between and , and we define
| (33) |
We define the set of center points to which the origin data point has a distance no greater than as
which is a closed ball of radius and centered at the origin in .
The first step consists of finding an so large that, when is large enough, at least one center point in (the alternative representation of defined in Equation (4)) is contained in the set . We will prove this in the following using a counterexample.
-
•
We find an so that the ball of radius and centered at the origin has a positive measure. For the purposes of this first step, it will suffice that be large enough to make
(34) (1st requirement on ) whose right hand side is equal to , which is finite by (S1.3). Define , a set with one center point. Then (34) becomes
(35) -
•
By the strong law of large numbers (SLLN),
(36) -
•
If, for infinitely many values of , no centers in were contained in ,
i.e., , then(37) where the first inequality holds because for any data point , which has a positive measure, the following holds by (32):
-
•
Hence by (35), (• ‣ S1.3) and (37),
(38) which implies that infinitely often, where is the set of one line corresponding to . This contradicts the definition of in (4) of Definition 2.2: for any set containing at most lines. Without loss of generality, we therefore assume that always contains at least one center point in . We denote one of such center points as .
If , the second step in this proof can be skipped; if , then we will show that, for large enough, the set contains all the center points in .
-
•
For the purposes of an inductive argument, we assume that the conclusions of the theorem are valid when applied to globally optimal clustering with centers. If were not eventually contained in , we could delete the center points in that are outside of to obtain a set of at most center points that would reduce below its minimum over all sets of centers, i.e., , which results in a contradiction.
-
•
To obtain such a contradiction, we need large enough to ensure that
(39) (2nd requirement on ) where is chosen to satisfy , which is positive by the uniqueness condition on and thus .
-
•
Suppose that contains at least one center point outside . Denote one of such center points as . What would be the effect on of deleting such center points in ? At worst, one of the centers that are known to lie in , e.g., , might have to accept into its own cluster all of the data points presently assigned to cluster centers outside . Denote one of these data points as . We argue that must have a Euclidean distance at least from the origin data point ; otherwise would have been closer to the cluster center than to . The reason is as follows. By (32),
If , then
That is, if were assigned to the cluster with center , then .
-
•
The extra contribution to due to deleting centers outside would therefore be at most
(40) -
•
The set obtained by deleting from all centers outside is a candidate for minimizing over sets of or fewer centers; it is therefore beaten by the optimal set . Thus
(41) by the inductive hypothesis. If along some subsequence of sample sizes, we therefore obtain
a contradiction.
We now know that, for large enough, it suffices to search for among the class of sets . For the final requirement on , we assume it is large enough to ensure that contains . Therefore, the function achieves its unique minimum on at . Under the topology induced by the Hausdorff metric, is compact (this follows from the compactness of ) and, as is proved in (Pollard, 1981), the map is continuous on . The function therefore enjoys an even stronger minimization property on : given any neighborhood of , there exists an , depending on , such that
The proof can now be completed by an appeal to a uniform SLLN:
This result is proved in (Pollard, 1981). We need to show that is eventually inside the neighborhood . It is enough to check that eventually. This follows from
and
and
Therefore, a.s. That is, a.s.
Similarly, for large enough,
S1.4 Proof of
Proof.
Denote by the index variable under the specified scenario and by the surrogate index variable under the unspecified scenario. Both . Given Definition 3.1 of and Definition 3.5 of , if we denote
then
| (42) |
Without loss of generality, we assume , for all .
Denote by and the first and second eigenvalues of the correlation matrix of , denoted by . An important property about the two eigenvalues is
where the second equation was proved in (Morrison, 1967). Hence
| (43) |
is equal to the variance of the projection of onto its second principal component, which is perpendicular to its first principal component, i.e., the line center defined in Definition 3.2 and denoted by here. Hence,
Denote by the set of population line centers corresponding to . Then
| (44) | ||||
where the second inequality and the last equality hold by Definition 3.3 of the unspecified population line centers and Definition 3.4 of .
S1.5 Proof of Theorem 3.4
Proof.
We derive the asymptotic distribution of the sample-level unspecified generalized Pearson correlation square, , in this proof. For notation simplicity, we drop the subscript “” in , , , , , and in Definition 2.4, following which we have
| (45) |
where
with and .
Similar to the proof of Theorem 3.1, to derive the asymptotic distribution of , we need to first derive the joint asymptotic distribution of
which depends on the joint asymptotic distribution of
where
.
To derive the joint asymptotic distribution of , we need to resolve the non i.i.d. nature of , which is due to fact that depends on the unspecified sample line centers and thus the whole sample . Given the unspecified population line centers defined in (12) in Definition 3.3, we define the (unobservable) realization of , defined in (13), based on the sample as
| (46) |
Because are i.i.d. and is fixed, we have as i.i.d. from the joint distribution of .
Define
where
.
Because of the i.i.d. nature of , following the proof of Theorem 3.1, we can derive the joint asymptotic distribution of , which we denote as
| (47) |
where has the same form as in (21), except that all the notations related to under the specified scenario are now related to under the current unspecified scenario.
Next we will derive the asymptotic distribution of based on (47). By Theorem 3.3, we have (23): a.s., . By the definitions of of (2.3), which is determined by and , and (46), which is determined by and , we have
| (48) |
Hence,
. That is,
| (49) |
Therefore, given (47) and (49) and by the Slutsky Theorem, we have the asymptotic distribution of as
| (50) |
Then given (50) and by applying Cramer’s Theorem (Ferguson, 1996), we can derive the joint asymptotic distribution of , which we denote as
| (51) |
where has the same form as in (22), except that all the notations related to under the specified scenario are now related to under the current unspecified scenario.
Applying Theorem 3.4 to the special case where follows a bivariate Gaussian distribution, we obtain a much simpler form of the first-order asymptotic distribution of .
S1.6 Proof of Corollary 3.5
S2 Convergence properties of the -lines algorithm
Motivated by Bottou and Bengio (1995), we study the convergence properties of our proposed -lines clustering algorithm (Algorithm 2.2). Below we show that the -lines algorithm can be related to a gradient descent algorithm and an expectation-maximization (EM) style algorithm.
S2.1 Relating -lines to a gradient descent algorithm
Given a sample , the -lines algorithm computes sample line centers , which minimize the loss function defined in (3), the average squared perpendicular distance between each data point and its closest sample line center. Denoting , minimizing is equivalent to minimizing
| (52) |
where is the index of the closest line center to the -th data point. Note that .
We can then derive a gradient descent algorithm based on for :
| (55) |
where is the learning rate is to be specified (Kohonen, 1989).
S2.2 Relating -lines to an EM algorithm
Although -lines does not fit in a probabilistic framework, its derivation is similar to that of the EM algorithm, except that the soft-thresholding of EM is changed to hard-thresholding.
The EM algorithm has the principle of introducing additional hidden variables to simplify the optimization problem. Since these hidden variables are unobservable, the maximization step (i.e., the M step) maximizes an auxiliary function calculated in the expectation step (i.e., the E step), which averages over the possible values of the hidden variables given the parameter estimates from the previous iteration. In our unspecified scenario, the hidden variables are the assignments of the data points to the sample line centers. Instead of considering the expectation of over the distribution on these hidden variables as in the EM algorithm, the -lines algorithm calculates the values of the hidden variables that maximize the negative loss given the parameter estimates from the previous iteration. That is, the “ function” to be maximized in the M step after () iterations becomes:
| (56) |
The next step is to find
| (57) |
The solution consists of calculated by (5), where represents the index set of data points that are closer to than other sample line centers in perpendicular distance. The -lines algorithm iterates by replacing by using the update equation (57) until convergence. Since is by definition the best assignment of the -th data point to the closet line center in , we have the following inequality:
Using this result, the identity , and the definition of in (57), we have the following inequality:
| (58) | ||||
Hence, each iteration decreases the loss function until , denoted by . Since the assignments are discrete, there is an open neighborhood of in which the assignments are constant. Based on their definitions, the functions and are equal in this neighborhood. Therefore, , the maximum of the function , is also a local minimum of the loss function .
We can further show that the M step of an EM algorithm under a bivariate Gaussian mixture model is the same as the M step of the -lines algorithm in (57). We assume that with mean vectors and covariance matrices , , and we denote . The hidden variables are . Suppose that in the -th iteration of the EM algorithm, the E step computes . The next M step would then update the value of as
| (61) |
where and .
If we modify the EM algorithm by replacing the E step in every iteration by that of the -lines algorithm, i.e., define
| (62) |
in a hard-thresholding way (assuming that every data point is closest to only one sample line center in perpendicular distance), the M step still updates as in (61). Then by (5), , where is the eigenvector corresponding to the largest eigenvalue of , minimizes the function . Hence, is the same solution as in (57).
Xu and Jordan showed in their 1994 classic paper that the EM algorithm approximate the Newton optimization algorithm in the case of a Gaussian mixture model (Xu and Jordan, 1996). In other words, the EM algorithm has fast convergence in this special case. Given the relevance of our -lines algorithm to the bivariate Gaussian EM algorithm, with the M step stays the same, we can say that our -lines algorithm is also approximately the Newton algorithm.
S3 More simulation results
Fig. S1 shows the comparison of finite sample distributions of , when is chosen by the AIC in (8), and the asymptotic distributions. The results show that the agreement between finite-sample distributions and asymptotic distributions deteriorates when is chosen by the AIC instead of being set to the true value in the data generative model. This is expected, as more uncertainty is introduced into the procedure when is unknown. However, we observe from Fig. S1 that, when , the agreement between finite-sample distributions and asymptotic distributions is still reasonably good. This observation further justifies the use of our asymptotic results in practice.
In our construction of confidence intervals of and , we construct the standard errors and in two ways: square roots of (1) the plug-in estimates of the asymptotic variances of and , or (2) the bootstrap estimates of and . In the first four settings as mixtures of bivariate Gaussians, we use the asymptotic variances from Corollaries 3.2 and 3.5, and we perform the parametric bootstrap to obtain the bootstrap estimates. In the latter four settings as mixtures of bivariate distributions, we compare the non-parametric bootstrap approach with two plug-in options: the first is to plug in the asymptotic variances of the special bivariate Gaussian forms in Corollaries 3.2 and 3.5, and the second is to plug in the asymptotic variances of the general forms in Theorems 3.1 and 3.4. Fig. S2 shows that the plug-in and bootstrap approaches construct similar CIs on the same sample. When increases from to , the CIs constructed by both approaches agree better with the theoretical CIs based on the true asymptotic variances, as expected. In addition, under Settings –, the two plug-in options result in similar CIs, suggesting that the simpler plug-in approach based on Corollaries 3.2 and 3.5 is robust.
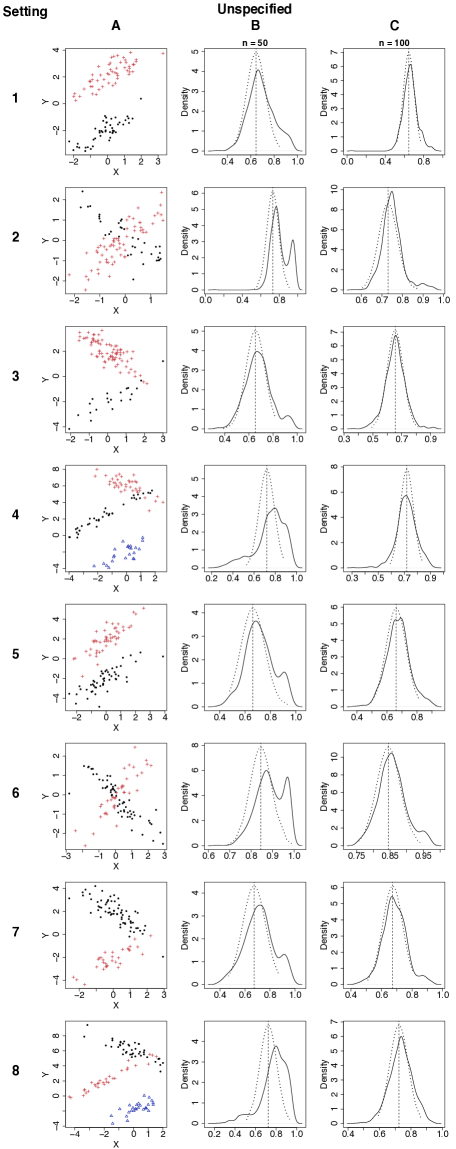
Comparison of the asymptotic distributions (theoretical results, same as those in Figure 2) and the finite-sample distributions of the sample-level unspecified generalized Pearson correlation square , when is chosen by the AIC (Equation (8)) in a data-driven way, under the eight simulation settings in Table 1. A: For each setting, a scatterplot shows a sample with under the unspecified scenario; different colors and symbols represent different values of inferred by the -lines algorithm (Algorithm 2.2). B-C: Finite-sample distributions of or (black solid curves) vs. the asymptotic distribution (black dotted curves) of in Corollary 3.5 (Settings –) or Theorem 3.4 (Settings –); the vertical dashed lines mark the values of .
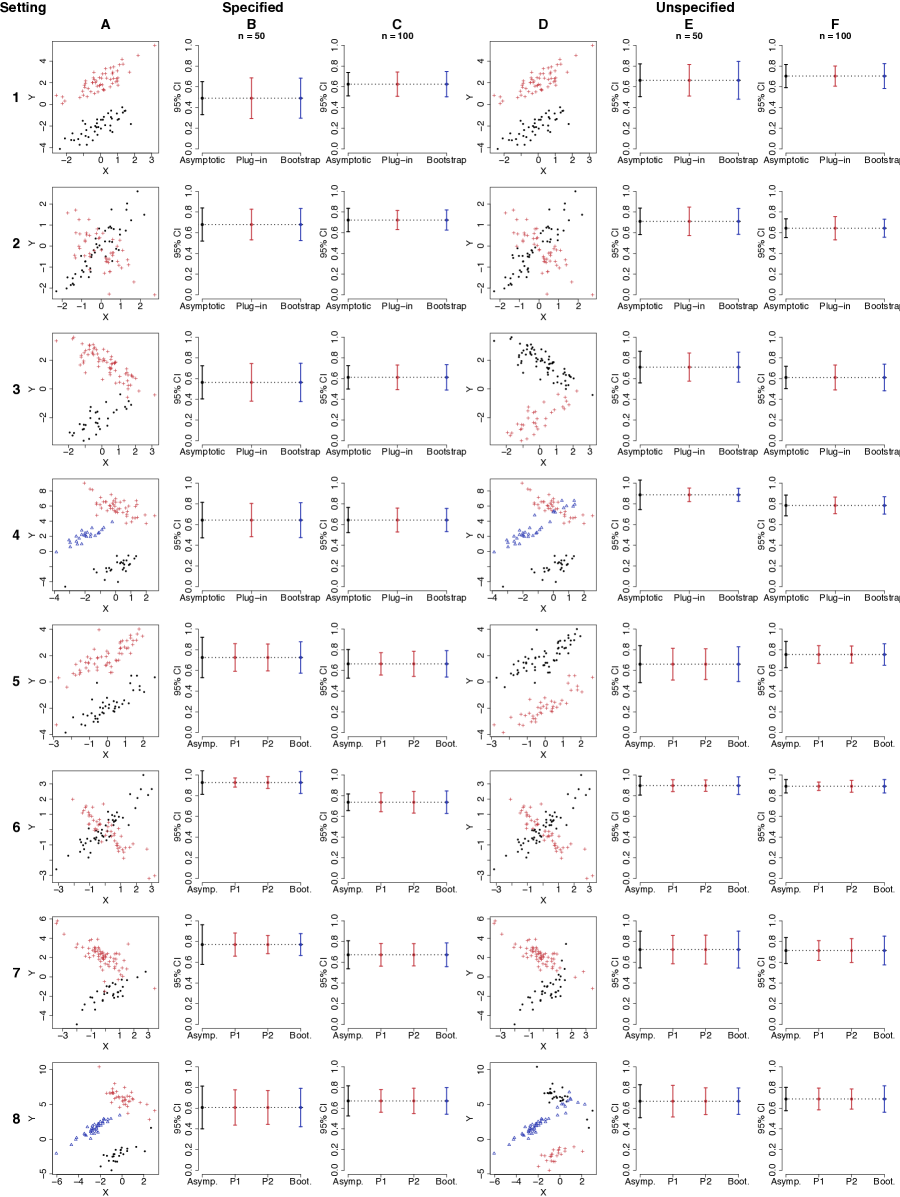
Comparison of the confidence intervals of and under the eight simulation settings (Table 1). A: For each setting, a scatterplot shows a sample with under the specified scenario; different colors and symbols represent different values of . B-C: Confidence intervals of based one sample ( or ) using one of the three distributions: (1) black: the asymptotic distribution using the true asymptotic variance of in Corollary 3.2 (Settings –) or Theorem 3.1 (Settings –), (2) red: the asymptotic distribution using the plug-in asymptotic variance of in Corollary 3.2 (Settings – and “P1” under Settings –) or Theorem 3.1 (“P2” under Settings –), (3) blue: the parametric (Settings –) or non-parametric (Settings –) bootstrap based on simulations. D: For each setting, a scatterplot shows a sample with under the unspecified scenario; different colors and symbols represent different values of inferred by the -lines algorithm (Algorithm 2.2). E-F: Confidence intervals of based one sample ( or ) using one of the three distributions: (1) black: the asymptotic distribution using the true asymptotic variance of in Corollary 3.5 (Settings –) or Theorem 3.4 (Settings –), (2) red: the asymptotic distribution using the plug-in asymptotic variance of in Corollary 3.5 (Settings – and “P1” under Settings –) or Theorem 3.4 (“P2” under Settings –), (3) blue: the parametric (Settings –) or non-parametric (Settings –) bootstrap based on simulations.
S4 Arabidopsis thaliana gene expression data
In the application of our generalized Pearson correlation squares to Arabidopsis thaliana gene expression analysis, we used four public microarray datasets from the AtGenExpress Consortium
summarized in Table S1.
| Dataset | Submission Number | Number of Genes | Sample Size |
|---|---|---|---|
| Oxidation | ME00340 | ||
| Wounding | ME00330 | ||
| UV-B light | ME00329 | ||
| Drought | ME00338 |
Figures S4-S6 shows pairwise scatterplots of the five FMO genes in Fig. 1A colored by each of the four index variables: condition (oxidation, wounding, UV-B light, and drought), treatment (yes and no), replicate ( and ), and tissue (root and shoot). It is clear that only the tissue variable serves as a good index variable for linear dependences.
The processed data and the analysis codes are provided in the “Supplementary Data and Codes” file available at https://tinyurl.com/y4ypx6v2


REFERENCES
- Akaike (1998) Akaike, H. (1998). Information theory and an extension of the maximum likelihood principle. In Selected papers of hirotugu akaike, pp. 199–213. Springer.
- Benaglia et al. (2009) Benaglia, T., D. Chauveau, D. Hunter, and D. Young (2009). mixtools: An r package for analyzing finite mixture models. Journal of Statistical Software 32(6), 1–29.
- Bjerve and Doksum (1993) Bjerve, S. and K. Doksum (1993). Correlation curves: measures of association as functions of covariate values. The Annals of Statistics, 890–902.
- Blyth (1972) Blyth, C. R. (1972). On simpson’s paradox and the sure-thing principle. Journal of the American Statistical Association 67(338), 364–366.
- Bottou and Bengio (1995) Bottou, L. and Y. Bengio (1995). Convergence properties of the k-means algorithms. In Advances in neural information processing systems, pp. 585–592.
- Breiman and Friedman (1985) Breiman, L. and J. H. Friedman (1985). Estimating optimal transformations for multiple regression and correlation. Journal of the American statistical Association 80(391), 580–598.
- Buettner et al. (2015) Buettner, F., K. N. Natarajan, F. P. Casale, V. Proserpio, A. Scialdone, F. J. Theis, S. A. Teichmann, J. C. Marioni, and O. Stegle (2015). Computational analysis of cell-to-cell heterogeneity in single-cell rna-sequencing data reveals hidden subpopulations of cells. Nature biotechnology 33(2), 155.
- Cover and Thomas (2012) Cover, T. M. and J. A. Thomas (2012). Elements of information theory. John Wiley & Sons.
- De Veaux (1989) De Veaux, R. D. (1989). Mixtures of linear regressions. Computational Statistics & Data Analysis 8(3), 227–245.
- Delicado and Smrekar (2009) Delicado, P. and M. Smrekar (2009). Measuring non-linear dependence for two random variables distributed along a curve. Statistics and Computing 19(3), 255.
- Ferguson (1996) Ferguson, T. S. (1996). A course in large sample theory. Chapman & Hall.
- Gebelein (1941) Gebelein, H. (1941). Das statistische problem der korrelation als variations-und eigenwertproblem und sein zusammenhang mit der ausgleichsrechnung. ZAMM-Journal of Applied Mathematics and Mechanics/Zeitschrift für Angewandte Mathematik und Mechanik 21(6), 364–379.
- Gretton et al. (2005) Gretton, A., O. Bousquet, A. Smola, and B. Schölkopf (2005). Measuring statistical dependence with hilbert-schmidt norms. In International conference on algorithmic learning theory, pp. 63–77. Springer.
- Haiman et al. (2007) Haiman, C. A., N. Patterson, M. L. Freedman, S. R. Myers, M. C. Pike, A. Waliszewska, J. Neubauer, A. Tandon, C. Schirmer, G. J. McDonald, et al. (2007). Multiple regions within 8q24 independently affect risk for prostate cancer. Nature genetics 39(5), 638.
- Hawkins et al. (2001) Hawkins, D. S., D. M. Allen, and A. J. Stromberg (2001). Determining the number of components in mixtures of linear models. Computational Statistics & Data Analysis 38(1), 15–48.
- Heller et al. (2012) Heller, R., Y. Heller, and M. Gorfine (2012). A consistent multivariate test of association based on ranks of distances. Biometrika 100(2), 503–510.
- Hirschfeld (1935) Hirschfeld, H. O. (1935). A connection between correlation and contingency. In Mathematical Proceedings of the Cambridge Philosophical Society, Volume 31, pp. 520–524. Cambridge University Press.
- Hoeffding (1948) Hoeffding, W. (1948). A non-parametric test of independence. The annals of mathematical statistics, 546–557.
- Hurn et al. (2003) Hurn, M., A. Justel, and C. P. Robert (2003). Estimating mixtures of regressions. Journal of computational and graphical statistics 12(1), 55–79.
- Jacobs et al. (1991) Jacobs, R. A., M. I. Jordan, S. J. Nowlan, and G. E. Hinton (1991). Adaptive mixtures of local experts. Neural computation 3(1), 79–87.
- Jolliffe (1982) Jolliffe, I. T. (1982). A note on the use of principal components in regression. Applied Statistics, 300–303.
- Jones and McLachlan (1992) Jones, P. and G. McLachlan (1992). Fitting finite mixture models in a regression context. Australian & New Zealand Journal of Statistics 34(2), 233–240.
- Kendall (1938) Kendall, M. G. (1938). A new measure of rank correlation. Biometrika 30(1/2), 81–93.
- Kim et al. (2012) Kim, K., K. Jiang, S. L. Teng, L. J. Feldman, and H. Huang (2012). Using biologically interrelated experiments to identify pathway genes in arabidopsis. Bioinformatics 28(6), 815–822.
- Kohonen (1989) Kohonen, T. (1989). Self-organization and associative memory, Volume 3rd edition. Springer-Verlag, Berlin.
- Kraskov et al. (2004) Kraskov, A., H. Stögbauer, and P. Grassberger (2004). Estimating mutual information. Physical review E 69(6), 066138.
- Leisch (2008) Leisch, F. (2008). Modelling background noise in finite mixtures of generalized linear regression models. In COMPSTAT 2008, pp. 385–396. Springer.
- Li et al. (2008) Li, J., B. G. Hansen, J. A. Ober, D. J. Kliebenstein, and B. A. Halkier (2008). Subclade of flavin-monooxygenases involved in aliphatic glucosinolate biosynthesis. Plant Physiology 148(3), 1721–1733.
- Li (2002) Li, K.-C. (2002). Genome-wide coexpression dynamics: theory and application. Proceedings of the National Academy of Sciences 99(26), 16875–16880.
- Lloyd (1982) Lloyd, S. (1982). Least squares quantization in pcm. IEEE transactions on information theory 28(2), 129–137.
- Morrison (1967) Morrison, D. F. (1967). Multivariate statistical methods. McGraw Hill, New York.
- Mukai et al. (2015) Mukai, S., N. Yabuta, K. Yoshida, A. Okamoto, D. Miura, Y. Furuta, T. Abe, and H. Nojima (2015). Lats1 suppresses centrosome overduplication by modulating the stability of cdc25b. Scientific reports 5, 16173.
- Murtaph and Raftery (1984) Murtaph, F. and A. Raftery (1984). Fitting straight lines to point patterns. Pattern recognition 17, 479–483.
- Pearson et al. (1899) Pearson, K., A. Lee, and L. Bramley-Moore (1899). Mathematical contributions to the theory of evolution. vi. genetic (reproductive) selection: Inheritance of fertility in man, and of fecundity in thoroughbred racehorses. Philosophical Transactions of the Royal Society of London. Series A, Containing Papers of a Mathematical or Physical Character 192, 257–330.
- Pollard (1981) Pollard, D. (1981). Strong consistency of -means clustering. The Annals of Statistics 9(1), 135–140.
- Quandt and Ramsey (1978) Quandt, R. E. and J. B. Ramsey (1978). Estimating mixtures of normal distributions and switching regressions. Journal of the American statistical Association 73(364), 730–738.
- Rényi (1959) Rényi, A. (1959). On measures of dependence. Acta mathematica hungarica 10(3-4), 441–451.
- Reshef et al. (2011) Reshef, D. N., Y. A. Reshef, H. K. Finucane, S. R. Grossman, G. McVean, P. J. Turnbaugh, E. S. Lander, M. Mitzenmacher, and P. C. Sabeti (2011). Detecting novel associations in large data sets. science 334(6062), 1518–1524.
- Scharl et al. (2009) Scharl, T., B. Grün, and F. Leisch (2009). Mixtures of regression models for time course gene expression data: evaluation of initialization and random effects. Bioinformatics 26(3), 370–377.
- Shannon et al. (1951) Shannon, C. E., W. Weaver, and A. W. Burks (1951). The mathematical theory of communication.
- Simon and Tibshirani (2014) Simon, N. and R. Tibshirani (2014). Comment on “detecting novel associations in large data sets” by reshef et al, science dec 16, 2011. arXiv preprint arXiv:1401.7645.
- Simpson (1951) Simpson, E. H. (1951). The interpretation of interaction in contingency tables. Journal of the Royal Statistical Society. Series B (Methodological), 238–241.
- Smith (2009) Smith, R. J. (2009). Use and misuse of the reduced major axis for line-fitting. American Journal of Physical Anthropology: The Official Publication of the American Association of Physical Anthropologists 140(3), 476–486.
- Spearman (1904) Spearman, C. (1904). The proof and measurement of association between two things. The American journal of psychology 15(1), 72–101.
- Székely et al. (2009) Székely, G. J., M. L. Rizzo, et al. (2009). Brownian distance covariance. The annals of applied statistics 3(4), 1236–1265.
- Székely et al. (2007) Székely, G. J., M. L. Rizzo, and N. K. Bakirov (2007). Measuring and testing dependence by correlation of distances. The annals of statistics, 2769–2794.
- Turner (2000) Turner, T. R. (2000). Estimating the propagation rate of a viral infection of potato plants via mixtures of regressions. Journal of the Royal Statistical Society: Series C (Applied Statistics) 49(3), 371–384.
- Wang et al. (2017) Wang, X., B. Jiang, and J. S. Liu (2017). Generalized r-squared for detecting dependence. Biometrika 104(1), 129–139.
- Wang et al. (2014) Wang, Y. R., M. S. Waterman, and H. Huang (2014). Gene coexpression measures in large heterogeneous samples using count statistics. Proceedings of the National Academy of Sciences 111(46), 16371–16376.
- Wedel and DeSarbo (1994) Wedel, M. and W. S. DeSarbo (1994). A review of recent developments in latent class regression models.
- Wheeler et al. (2017) Wheeler, E., A. Leong, C.-T. Liu, M.-F. Hivert, R. J. Strawbridge, C. Podmore, M. Li, J. Yao, X. Sim, J. Hong, et al. (2017). Impact of common genetic determinants of hemoglobin a1c on type 2 diabetes risk and diagnosis in ancestrally diverse populations: A transethnic genome-wide meta-analysis. PLoS medicine 14(9), e1002383.
- Xu and Jordan (1996) Xu, L. and M. I. Jordan (1996). On convergence properties of the em algorithm for gaussian mixtures. Neural computation 8(1), 129–151.
- Yabuta et al. (2007) Yabuta, N., N. Okada, A. Ito, T. Hosomi, S. Nishihara, Y. Sasayama, A. Fujimori, D. Okuzaki, H. Zhao, M. Ikawa, et al. (2007). Lats2 is an essential mitotic regulator required for the coordination of cell division. Journal of Biological Chemistry 282(26), 19259–19271.
- Yule (1903) Yule, G. U. (1903). Notes on the theory of association of attributes in statistics. Biometrika 2(2), 121–134.
- Zheng et al. (2012) Zheng, S., N.-Z. Shi, and Z. Zhang (2012). Generalized measures of correlation for asymmetry, nonlinearity, and beyond. Journal of the American Statistical Association 107(499), 1239–1252.