Thermal softening during high-temperature torsional deformation of aluminum bars
Abstract
A simple extension of the thermodynamic dislocation theory to non-uniform plastic deformations is proposed for an analysis of high-temperature torsion of aluminum bars. Employing a small set of physics-based parameters, which we expect to be approximately independent of strain rate and temperature, we are able to fit experimental torque-twist curves for five different twist rates and at one fixed ambient temperature. We find that thermal softening due to temperature rise is significant at high twist rates.
keywords:
torsion , bar , aluminum , dislocations , thermal softening1 Introduction
The aim of this paper is to explore use of the thermodynamic dislocation theory (Langer et al., 2010; Langer, 2015, 2016; Le et al., 2017, 2018b; Le, 2018; Le et al., 2018a; Le and Piao, 2018) in modelling high-temperature torsional deformation of aluminum bars. We analyze a set of torsion tests for an aluminum alloy 5252 reported by Zhou and Clode (1998). By making torque-twist measurements over a range of substantially different twist rates and at a fixed ambient temperature, these authors have experimentally discovered the thermal softening effect during torsional deformation of aluminum bars, especially at high twist rates. Our challenge is to predict this effect by using a realistic physics-based theory, and in addition, to obtain basic information about this material.
Our new ability to interpret data of the kind published in (Zhou and Clode, 1998) is due to the fact that the thermodynamic dislocation theory, in its latest versions (Langer, 2016; Le et al., 2017; Le, 2018; Le et al., 2018a), includes the non-uniform plastic deformations and the thermal softening. Earlier versions of the theory (Langer et al., 2010; Langer, 2015) were developed exclusively for uniform plastic deformations. Besides, based on data for highly conductive copper as shown in (Kocks and Mecking, 2003) or (Meyers et al., 1995), the thermal softening was completely ignored. Le and Piao (2018) have proposed a theory of twisted bars for both macro and micro sizes which shows that the density of excess dislocations is negligible for twisted bars of macro sizes with small to medium twist angles. For such bars a simple extension of the TDT is possible, which takes into account the spatial variation of state variables and ignores the excess dislocations, and was proposed by Le et al. (2018a). To include the thermal effect, we extend that simple version of TDT in this paper by adding the equation for the ordinary kinetic vibrational temperature at which the temperature rise is caused by the movement of dislocations. With the present theory and experimental data from (Zhou and Clode, 1998), the thermal softening effect during torsional deformations can now be systematically investigated.
The plan of this short communication is as follows. We start in Sec. 2 with a brief annotated summary of the proposed equations of motion. In Sec. 3 we discretize the obtained system of governing equations and develop the numerical method for its solution. The parameter identification based on the large scale least squares analysis is presented in Sec. 4. Sec. 5 shows the results of numerical simulations and the comparison with experiments. Finally, Sec. 6 concludes the paper.
2 Equations of motion
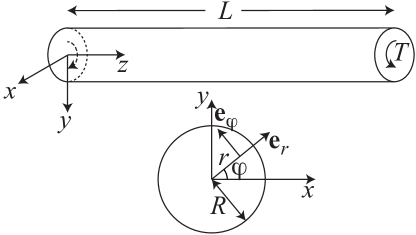
Suppose a single crystal bar with a circular cross section, of radius and length , is subjected to torsion (see the bar with its cross-section in Fig. 1). For this particular geometry of the bar it is natural to assume that the circumferential displacement is , with being the twist angle per unit length, while the displacement does not depend on . Thus, the total shear strain of the bar and the shear strain rate turn out to be non-uniform as they are linear functions of radius . Now, let this system be driven at a constant twist rate , where is a characteristic microscopic time scale. Since the system experiences a steady state torsional deformation, we can replace the time by the total twist angle (per unit length) so that .
To derive the equations of motion for this system we begin with Hooke’s law in rate form
| (1) |
with being the shear stress, the plastic distortion, and the shear modulus. Note that the shear modulus can depend on the ordinary temperature and thus on , yet the term containing on the right side of Eq. (1) is neglected as small. The central, dislocation-specific ingredient of TDT (Langer et al., 2010) is the thermally activated depinning formula for the plastic distortion rate, , as a function of the stress and the total dislocation density :
| (2) |
where
As argued in (Langer et al., 2010), Eq. (2) is an Orowan relation of the form in which the speed of the dislocations is given by the distance between them multiplied by the rate at which they are depinned from each other. That rate is approximated here by the activation terms and , in which the energy barrier (implicit in the scaling of ) is reduced by the stress dependent factor , where is the Taylor stress with being proportional to (see Section 3).
Replacing in Eq. (1) by , by , and the partial time derivative by , we arrive at
| (3) |
The equation of motion for the total dislocation density describes energy flow (Langer et al., 2010). In terms of the twist angle this equation reads:
| (4) |
with being the steady-state value of at given , a characteristic formation energy for dislocations, and denoting the average spacing between dislocations in the limit of infinite ( is a length of the order of tens of atomic spacings). The coefficient is an energy conversion factor that, according to arguments presented in (Langer et al., 2010), should be independent of both strain rate and temperature. The other quantity that appears in the prefactor in Eq. (4) is
| (5) |
The equation of motion for the effective disorder temperature is a statement of the first law of thermodynamics for the configurational subsystem (Langer et al., 2010):
| (6) |
Here, is the steady-state value of for strain rates appreciably smaller than inverse atomic relaxation times, i.e. much smaller than . The dimensionless factor is inversely proportional to the effective specific heat . Since the maximum strain rate (reached at the outer radius of the bar) for the small twist rate in our torsion test is small, we assume that is a constant.
The equation of motion for the ordinary temperature reads
| (7) |
Here, is a thermal energy conversion factor, with being the thermal heat capacity per unit mass, the mass density, and a dimensionless constant known as the Taylor-Quinney factor. Thus, the first term on the right-hand side of Eq. (7) represents the portion of plastic power dissipated into heat. As indicated here, will be found to be temperature dependent. is a thermal transport coefficient that controls how rapidly the system relaxes toward the ambient temperature , that is, . This coefficient turns out to be small for the situations reported here. Nevertheless it cannot be neglected, especially for small twist rates. In principle, after long enough times of steady deformation, systems must reach steady-state temperatures determined by the balance between heating and cooling terms in Eq. (7).
3 Discretization and method of solution
For the purpose of numerical integration of the system of equations (3)-(7) let us introduce the following dimensionless variables and quantities
| (8) |
The dimensionless variable changes from zero to . The dimensionless variable has the meaning of the maximum shear strain achieved at the outer radius. The calculation of the rescaled torque as function of is convenient for the later comparison with the experimental data from (Zhou and Clode, 1998). Then we rewrite Eq. (2) in the form
| (9) |
where
| (10) |
We set and assume that is independent of temperature and strain rate. Then
| (11) |
We define so that . Function in Eq. (5) becomes
| (12) |
The dimensionless steady-state quantities are
| (13) |
Using instead of as the dimensionless measure of plastic strain rate means that we are effectively rescaling by a factor . Since is a microscopic attempt frequency, of the order s-1, we take s.
In terms of the introduced quantities the governing equations read
| (14) | |||
| (15) | |||
| (16) | |||
| (17) |
where . To solve this system of differential equations subject to initial conditions numerically, we discretize the equations in the interval by dividing it into sub-intervals of equal length and writing the corresponding equations at nodes , . In this way, we reduce the four differential equations depending on to a system of ordinary differential equations at nodes that will be solved by Matlab-ode23s.
After finding the solution we can compute the torque as function of the twist angle according to
| (18) |
4 Parameter identification
In order to simulate the theoretical torque-twist curves, we need values for eight system-specific parameters and two initial conditions from each sample. These basic parameters include the following six: the activation temperature , the stress ratio , the steady-state scaled effective temperature , and the three dimensionless conversion factors , , and . In addition, we need a formula for the thermal conversion factor in Eq. (7) which is assumed to be a linear function of
| (19) |
The numbers and are the two remaining parameters to be determined from the data. We also need initial values of the scaled dislocation density and the effective disorder temperature ; all of which are determined by the sample preparation. Concerning the initial values of the shear stress and the ordinary temperature we assume that and , where K is the ambient temperature. The other parameters required for numerical simulations but known from the experiment are: the length mm and radius mm of the bars, and the length of Burgers’ vector Å. Since corresponds to the smallest admissible distance between dislocations in the state of maximum disorder in crystal, we take . Note that only affects the dislocation density, not the torque-twist curves. Finally, for the temperature dependent shear modulus we use a formula proposed by Varshni (1970)
| (20) |
where GPa, GPa, and K. (These values taken from (Chen et al., 1998) is actually for the aluminum alloy 5182, but since the chemical composition of the aluminum alloy 5252 is very close to that of 5182, we use the same parameters for our alloy.)
In earlier papers dealing with the uniform deformations (Langer et al., 2010; Langer, 2015), it was possible to begin evaluating the parameters by observing steady-state stresses at just a few strain rates and ambient temperatures . Knowing , and for three stress-strain curves, one could solve equation
| (21) |
which is the inverse of Eq. (2) for , , and , and check for consistency by looking at other steady-state situations. With that information, it was relatively easy to evaluate and by directly fitting the full stress-strain curves. This strategy does not work here because the stress state of twisted bars is non-uniform. Besides, the thermal effects are highly nontrivial. Examination of the experimental data provided in (Zhou and Clode, 1998) indicates that almost all of these samples are undergoing thermal softening at large twist angles; the torques are decreasing and the temperatures must be increasing. Even the curves that appear to have reached some kind of steady state have not, in fact, done so at their nominal ambient temperatures.
| (1/s) | 19.7 | 6.44 | 1.84 | 0.21 | 0.02 |
|---|---|---|---|---|---|
| 0.245 | 0.24 | 0.234 | 0.23 | 0.2235 |
To counter these difficulties, we have resorted to the large-scale least-squares analyses that we have developed in (Le et al., 2017; Le and Tran, 2017; Le et al., 2018a; Le and Piao, 2018). That is, we have solved the system of ordinary differential equations (ODEs) numerically, provided a set of material parameters and initial values is known. Based on this numerical solutions we then computed the sum of the squares of the differences between our theoretical torque-twist curves and a large set of selected experimental points, and minimized this sum in the space of the parameters. The ODEs were solved numerically using the Matlab-ode23s, while the finding of least squares was realized with the Matlab-globalsearch. To keep the calculation time manageable and simultaneously ensure the accuracy, we have chosen and the -step equal to . Our results appear to be robust against the experimental uncertainties. We have found that the torque-twist curves for five samples taken from (Zhou and Clode, 1998) can be fit with just a single set of system parameters. These are: K, . So far as we can tell, our values of and are consistent with values of the Taylor-Quinney factor of the order of unity or less, at least in the range K (melting temperature). The identified initial values of dislocation densities and disorder temperatures for five samples are shown in Table 1, where the first row indicates the twist rates at which the samples are twisted. To obtain the actual initial dislocation densities, we must divide by , resulting in the order between and dislocations per square meter.
5 Numerical simulations
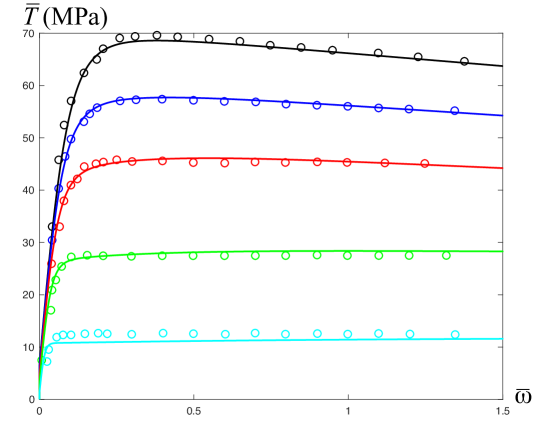
With the identified parameters we can now simulate the torque-twist curves for bars made of aluminum alloy 5252 undergoing torsional deformations at five different twist rates s, s, s, s, and s, and for ambient temperature K. In oder to compare with the experimental curves we use the rescaled torque and twist angle (or effective strain) defined as followed (Zhou and Clode, 1998)
| (22) |
The result is presented in Fig. 2. In this figure, the circles represent the selected experimental points in (Zhou and Clode, 1998) while the solid curves are our theoretical simulation. One can see that even the initial yielding transition appears to be described accurately by this theory. There is only one visible discrepancy: for the smallest twist rate s the torques are slightly above those predicted by the theory. Nothing about this result leads us to believe that there are relevant physical ingredients missing in the theory.
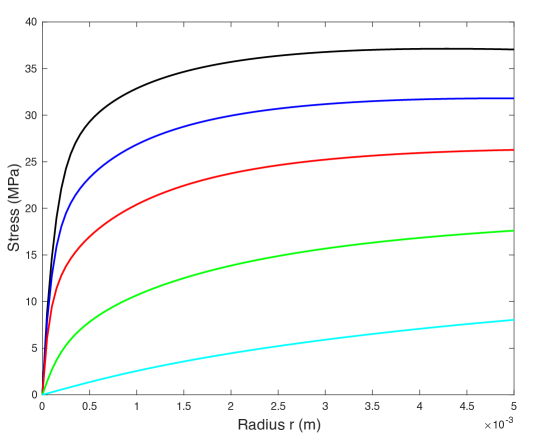
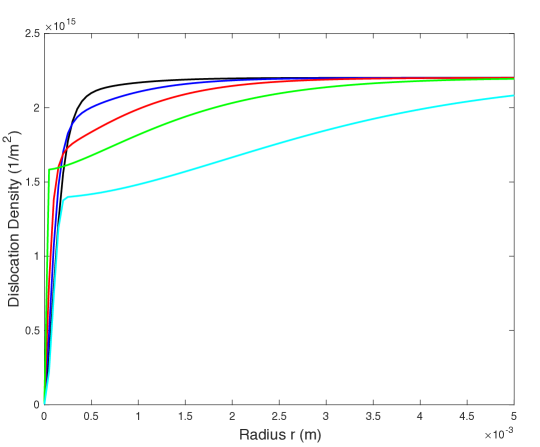
The results of numerical simulations for other quantities are shown in Figs. 3-5. We plot in Fig. 3 the shear stress distribution at the maximal twist angle . In a small elastic zone near the center of the cross-section, the stress depends linearly on . In the plastic zone, the stress does not remain constant, but increases with increasing and reaches a maximum at , as opposed to the similar distribution obtained by the phenomenological theory of ideal plasticity. This exhibits the hardening behavior due to the entanglement of dislocations. Fig. 4 presents the distributions of density of dislocations at the maximal twist angle . The density of dislocations is an increasing function of but quickly achieves a nearly constant value in the outer ring , especially for the high twist rates.
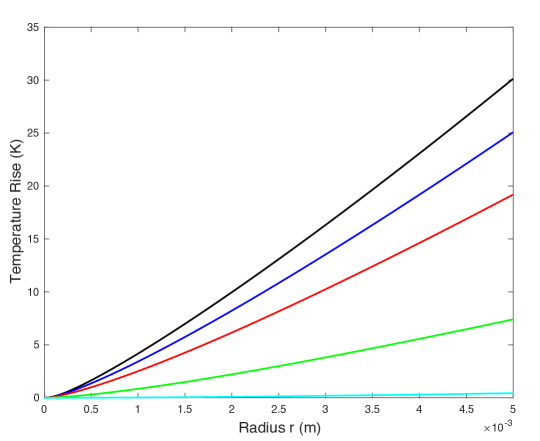
Finally, we present in Fig. 5 the distribution of the temperature rise at the maximal twist angle . The temperature rise is a monotonously increasing function of the radius and achieves the maximum at . We see that the higher the twist rate, the higher is the temperature rise. At the highest twist rate s the temperature rise at the outer radius is about 30 K. Our theory predicts that the larger temperature increases occur at the higher twist rates because the plastic power is larger there. This is confirmed by the calculations of the temperature distribution based on the finite element method provided in (Zhou and Clode, 1998).
6 Conclusion
Overall, these results seem to us to be quite satisfactory. Note that we are now using thermodynamic dislocation theory not only to verify its validity, but also as a tool to discover the properties of structural materials. Thus, at the beginning of this investigation, we did not know that thermal softening would play such an important role for the bars subjected to torsional deformations. One of the main reasons for the success of this theory - as emphasized here and in earlier papers - is the extreme sensitivity of the plastic strain rate to small temperature or stress changes. This allows the yielding transition, work hardening, and thermal softening to be correctly captured, as can be seen in the torque-twist curves. The proposed theory can serve as a useful guide for future experimental investigation of the sensitivity of torque-twist curves to twist rate and ambient temperature. In particular, it would be very interesting to perform torsion tests with extremely high twist rates when the samples are bonded to Kolsky bars (cf. (Marchand and Duffy, 1988)). In this case, our theory would predict the runaway instability and shear band formation due to the thermal softening.
Acknowledgments
Y. Piao acknowledges financial support from the Chinese Government Scholarship Program. K.C. Le is grateful to J.S. Langer for helpful discussions.
References
- Chen et al. (1998) Chen, S. R., Stout, M. G., Kocks, U. F., MacEwen, S. R., and Beaudoin, A. J. (1998). Constitutive modeling of a 5182 aluminum as a function of strain rate and temperature. Technical report, Los Alamos National Lab., NM (United States).
- Kocks and Mecking (2003) Kocks, U. F. and Mecking, H. (2003). Physics and phenomenology of strain hardening: the FCC case. Progress in Materials Science, 48(3):171–273.
- Langer (2015) Langer, J. S. (2015). Statistical thermodynamics of strain hardening in polycrystalline solids. Physical Review E, 92(3):032125.
- Langer (2016) Langer, J. S. (2016). Thermal effects in dislocation theory. Physical Review E, 94(6):063004.
- Langer et al. (2010) Langer, J. S., Bouchbinder, E., and Lookman, T. (2010). Thermodynamic theory of dislocation-mediated plasticity. Acta Materialia, 58(10):3718–3732.
- Le (2018) Le, K. C. (2018). Thermodynamic dislocation theory for non-uniform plastic deformations. Journal of the Mechanics and Physics of Solids, 111:157–169.
- Le and Piao (2018) Le, K. C. and Piao, Y. (2018). Thermodynamic dislocation theory: Size effect in torsion. International Journal of Plasticity, DOI: 10.1016/j.ijplas.2018.11.009.
- Le et al. (2018a) Le, K. C., Piao, Y., and Tran, T. M. (2018a). Thermodynamic dislocation theory: torsion of bars. arXiv preprint arXiv:1806.04304.
- Le and Tran (2017) Le, K. C. and Tran, T. M. (2017). Dislocation mediated plastic flow in aluminum: comparison between theory and experiment. International Journal of Engineering Science, 119:50–54.
- Le et al. (2017) Le, K. C., Tran, T. M., and Langer, J. S. (2017). Thermodynamic dislocation theory of high-temperature deformation in aluminum and steel. Physical Review E, 96:013004.
- Le et al. (2018b) Le, K. C., Tran, T. M., and Langer, J. S. (2018b). Thermodynamic dislocation theory of adiabatic shear banding in steel. Scripta Materialia, 149:62–65.
- Marchand and Duffy (1988) Marchand, A. and Duffy, J. (1988). An experimental study of the formation process of adiabatic shear bands in a structural steel. Journal of the Mechanics and Physics of Solids, 36(3):251–283.
- Meyers et al. (1995) Meyers, M. A., Andrade, U. R., and Chokshi, A. H. (1995). The effect of grain size on the high-strain, high-strain-rate behavior of copper. Metallurgical and Materials Transactions A, 26(11):2881–2893.
- Varshni (1970) Varshni, Y. P. (1970). Temperature dependence of the elastic constants. Physical Review B, 2(10):3952.
- Zhou and Clode (1998) Zhou, M. and Clode, M. (1998). A finite element analysis for the least temperature rise in a hot torsion test specimen. Finite Elements in Analysis and Design, 31(1):1–14.