Recurrent Deep Divergence-based Clustering for simultaneous feature learning and clustering of variable length time series
Abstract
The task of clustering unlabeled time series and sequences entails a particular set of challenges, namely to adequately model temporal relations and variable sequence lengths. If these challenges are not properly handled, the resulting clusters might be of suboptimal quality. As a key solution, we present a joint clustering and feature learning framework for time series based on deep learning. For a given set of time series, we train a recurrent network to represent, or embed, each time series in a vector space such that a divergence-based clustering loss function can discover the underlying cluster structure in an end-to-end manner. Unlike previous approaches, our model inherently handles multivariate time series of variable lengths and does not require specification of a distance-measure in the input space. On a diverse set of benchmark datasets we illustrate that our proposed Recurrent Deep Divergence-based Clustering approach outperforms, or performs comparable to, previous approaches.
1 Introduction
The vast amounts of complex data that need to be categorized in an unsupervised manner, makes clustering [1, 2] one of the key areas in machine learning and of growing importance. In many cases it is unrealistic, or even infeasible, to label individual data points for supervised learning.
The majority of classical clustering algorithms requires the data to reside in a vector space equipped with some distance function or similarity measure. However, for complex datatypes, such as images or sequences, this requirement is not necessarily met. Much research in the machine learning field has therefore been invested in the development of feature extraction techniques for such datatypes. These produce vectorial representations embedded in a space with a suitable distance measure. Such methods are often computationally complicated procedures that may not be robust across different domains and data types. Post computation, the features can be clustered using e.g. -means [3], Hierarchical Clustering [4], or Spectral Clustering [5]. However, there is no guarantee that the extracted features are well suited for the selected clustering algorithm, which causes the quality of the resulting clusters to depend heavily on the representation.
Supervised deep learning has seen tremendous recent developments for end-to-end representation learning [6], wherein the data representation is obtained as an integral part of the optimization of the neural network classifier [7, 8]. The translation of these achievements to the unsupervised case of clustering, has been hailed as a main next goal in machine learning [9]. Several works have been proposed along these lines over the last couple of years, nevertheless such research is still in its infancy.
Deep Embedded Clustering (DEC [10] and IDEC [11]), the Deep Clustering Network (DCN) [12], and the Categorical GAN (CatGAN) [13], are some examples of novel unsupervised deep learning architectures. In these models the raw input signal is processed by a deep neural network, producing a vectorial representation. Based on this representation, the subsequent parts of the model then computes the cluster membership prediction. In DEC, for example, a set of inputs are processed by a Multilayer Perceptron (MLP) to produce a corresponding set of hidden representations. The hidden representations are then softly assigned to a set of centroids, based on Euclidean distance in the space of hidden representations. The joint optimization of MLP-parameters and centroids then allows the feature generating MLP to adapt based on the clustering of the hidden representations. The MLP is pre-trained as a stacked autoencoder to ensure that the hidden representations preserve some of the structure present in the input space.
Another recent architecture that incorporates similar ideas, is Deep Divergence-based Clustering (DDC) [14]. DDC was originally designed for image clustering, and therefore uses a convolutional neural network (CNN) for feature extraction. Cluster assignments are obtained by a clustering module based on information theoretic quantities computed using the representations produced by the CNN. Moreover, DDC does not require autoencoder initialization, and can therefore be trained from start to finish without modifications to the architecture.
On the other hand, when it comes to the virtually omnipresent domain of sequential data, none of the aforementioned end-to-end clustering methods are directly applicable. Learning to Cluster (L2C) [15] is a model designed for deep learning-based sequence clustering, but requires pairwise weakly labeled observations during training, and is therefore not fully unsupervised.
In this paper we propose a novel end-to-end architecture for joint representation learning and clustering of sequential data. Our model aims to address some of the challenges that arise when modeling sequential data, namely variable sequence length, multivariate elements, and complex temporal dependencies. We do this by integrating a recurrent neural network within an architecture building on the DDC framework, which we refer to as Recurrent Deep Divergence-based Clustering (RDDC).
By this, we leverage the power of DDC which has proven to perform well on image clustering without relying on extra model components for initialization.
The rest of the paper is structured as follows; Section 2 introduces the different components of our model and how they interact. In Section 3 we provide some experimental results, as well as a qualitative analysis for one of the experimental cases. Finally, we make some concluding remarks in Section 4.
2 Method
A conceptual overview of the RDDC architecture is provided in Fig. 1. Suppose we have input sequences to cluster. First, these are processed by the RNN, which is two-layer bidirectional Gated Recurrent Unit [8]. The final hidden states of the RNN are concatenated and passed on to a Batch Normalization transformation [16] producing the intermediate variables . Subsequently, they are transformed by the first fully connected layer to obtain the hidden representations . Finally, the hidden representations are passed through the fully connected output layer with a softmax activation function, to produce the (soft) cluster membership vectors .
2.1 Loss function
The model is trained end-to-end using a loss function which is designed with three key properties in mind: (i) Cluster separability and compactness. (ii) Cluster orthogonality in the observation space. (iii) Closeness of cluster memberships to a simplex corner.
The DDC loss function consists of three terms. The first term tackles the separability and compactness property outlined above. Consider the multiple-pdf generalization of the Cauchy-Schwartz (CS) divergence [17]:
| (1) |
where is the number of distributions, and denotes the expectation of when has distribution . If we let each represent a cluster, a large divergence would lead to well separated and compact clusters. Maximizing (1) is equivalent to minimizing the argument of the logarithm, which gives the loss term
| (2) |
Using the kernel density estimator [18] with a Gaussian kernel to estimate gives
| (3) |
where , . The vectors denote the columns of the hard cluster assignment matrix . During optimization, we relax the hard membership constraint to make the loss-function differentiable. Thus, we can form by stacking the soft cluster assignment vectors row-wise.
The second term in the loss function is designed such that the clusters are orthogonal in the -dimensional observation-space. This accounts to the matrix having orthogonal columns, which motivates the loss
where denotes the sum of the strictly upper triangular elements of its argument. Note that this term differs from the term , which was originally used for DDC [14]. In contrast to the original loss term, our formulation does not introduce a regularizing effect to the computation of cluster membership vectors. In our experiments, we found that model performance improved when said regularization effect was removed.
The final term in the loss function is constructed such that the cluster membership vectors lie close to a corner of the simplex defined by the softmax activation function. Let , where is the -th cartesian basis vector of (-th corner of the simplex). Then, the last loss term is
| (4) |
which is very similar to (3), but have now been replaced with , which denote the columns of . If we consider as the soft assignment of cluster membership vector to simplex corner , we can interpret in the same way as : The distributions of cluster assignment vectors should be compactly centered around distinct simplex corners.
The total loss function is a linear combination of the three loss terms:
where and are hyperparameters.
3 Experiments
3.1 Experiment setup
To quantitatively evaluate the performance of our model on sequential data, we use four different datasets. These were selected as each of them represents a distinct, but commonly observed, sequence-generating process. The variation in sequence length and dimensionality across the datasets should provide broad insight into the capabilities of the model. The datasets are:
-
•
Character Trajectories (CT) [19]. The sequences form trajectories of handwritten characters. A subset consisting of the characters was chosen for evaluation.
-
•
Twenty Newsgroups (TN) [19, 20]. This dataset contains news articles from different categories. Following the example of [21, 22] we choose a subset of the data containing articles from distinct domains. The subset consists of articles from alt.atheism, comp.graphics and misc.forsale, with lengths between and words. The articles were converted to -dimensional sequences using a Skipgram-Word2Vec model [23].
-
•
Speech Commands (SC) [24]: Each time series is a raw sound recording of a single spoken English word. For evaluation, a subset consisting of the words were used.
Prior to being analyzed by the network, the data was preprocessed in the following manner: (i) Crop to remove leading and trailing periods of low activity in the recording. (ii) Normalize such that each recording has zero mean and unit variance. (iii) Compute short-time log-frequency filter banks [1], using bins, a window length of ms, and a window overlap of ms.
-
•
Arabic Digits (AD) [19]: The sequences consists of mel-frequency cepstrum coefficients obtained from recordings of spoken Arabic digits. For this dataset, all ten digits were used.
The datasets were divided into training, validation and test sets, each set receiving , and of the samples, respectively. The training set was used for training, the validation set for hyperparameter tuning/model selection, and the test set for performance evaluation.
The model we use for testing is a two-layer bidirectional GRU with 32 units in each layer, followed by the two fully connected layers. The first fully connected layer has units for the Character Trajectories dataset and units for the Speech Commands, Twenty Newsgroups and Arabic Digits datasets. In our experience, the model was not particularly sensitive to the number of RNN or fully connected units. The number of units in the output layer is the same as the number of clusters in the dataset.
We compare our model to the following benchmark methods, which represent both classical clustering approaches, as well as more recent deep learning-based clustering approaches: (i) -means [3]. (ii) Ward-linkage Hierarchical Clustering [4]. (iii) Spectral Clustering [5]. (iv) DEC with the configuration specified by the authors [10]. (v) DDC with just the last two fully connected layers [14]. As these methods all require vectorial inputs of fixed length, they are implemented using each of the following vectorization methods:
-
•
Zero padding: Each time series is augmented with zero-vectors such that its length matches the longest length in the dataset.
-
•
Cropping: All timesteps recorded after the shortest sequence-length in the dataset are discarded.
-
•
Time averaging: The vector average along the time axis is computed for each sequence.
Finally, for the zero-padded and cropped sequences, we concatenate the remaining observations for each timestep, producing one vector for each sequence.
Our model is implemented in TensorFlow and trained on stochastic mini-batches of size , using the Adam optimizer [25]. Each DDC/RDDC model was trained for epochs from different initializations on each data set. The model resulting in the lowest value of the loss function was then selected for further evaluation. The kernel width, was set to of the median pairwise distance between the hidden representations , within each batch, following [26]. The median was computed during each forward pass and treated as fixed during the backward passes. After each training run, the unsupervised clustering accuracy on the test set was computed as where and is the true label and the predicted cluster label of the -th sequence, respectively. The maximum runs over bijective cluster-to-class maps, effectively finding the "best" cluster-to-class assignment in terms of classification accuracy. We also compute the normalized mutual information, defined as where is the mutual information between the predicted cluster assignments and the true labels, and denotes the entropy of its argument.
3.2 Quantitative results
| CT | TN | SC | AD | |||||
| Model | ||||||||
| -m (Zero) | 1.0 | 1.0 | 0.38 | 0.01 | 0.51 | 0.0 | 0.71 | 0.6 |
| -m (Crop) | 1.0 | 1.0 | 0.56 | 0.35 | 0.54 | 0.0 | 0.51 | 0.48 |
| -m (Avg.) | 0.87 | 0.79 | 0.96 | 0.88 | 0.58 | 0.03 | – | – |
| HC (Zero) | 1.0 | 1.0 | 0.42 | 0.07 | 0.5 | 0.0 | 0.78 | 0.75 |
| HC (Crop) | 1.0 | 1.0 | 0.78 | 0.45 | 0.5 | 0.0 | 0.52 | 0.56 |
| HC (Avg.) | 0.87 | 0.84 | 0.78 | 0.53 | 0.57 | 0.04 | – | – |
| SC (Zero) | 0.40 | 0.33 | 0.3 | 0.0 | 0.50 | 0.03 | 0.66 | 0.61 |
| SC (Crop) | 0.41 | 0.32 | 0.36 | 0.04 | 0.51 | 0.01 | 0.47 | 0.45 |
| SC (Avg.) | 0.69 | 0.67 | 0.95 | 0.8 | 0.51 | 0.01 | – | – |
| DEC (Zero) | 1.0 | 1.0 | 0.37 | 0.01 | 0.51 | 0.0 | 0.66 | 0.67 |
| DEC (Crop) | 1.0 | 1.0 | 0.6 | 0.31 | 0.53 | 0.0 | 0.51 | 0.47 |
| DEC (Avg.) | 0.54 | 0.66 | 0.96 | 0.85 | 0.52 | 0.0 | – | – |
| DDC (Zero) | 0.98 | 0.96 | 0.41 | 0.02 | 0.54 | 0.0 | 0.61 | 0.59 |
| DDC (Crop) | 1.0 | 1.0 | 0.49 | 0.26 | 0.54 | 0.0 | 0.43 | 0.43 |
| DDC (Avg.) | 0.73 | 0.68 | 0.9 | 0.69 | 0.59 | 0.03 | – | – |
| RDDC | 1.0 | 1.0 | 0.88 | 0.69 | 0.74 | 0.19 | 0.80 | 0.77 |
The results of the experiments are listed in Tab. 1. These show a large spread in performance between the different benchmark methods and between the different vectorization techniques. The highest performing vectorization technique also seems to be data-dependent, potentially making the choice difficult, especially if it has to be done in an unsupervised manner. On the Speech Commands dataset, all of the benchmark methods more or less fail, which indicates that they are unable to correctly model the temporal dependence in the data.
Recall that for the Twenty Newsgroups dataset, the Skipgram model already takes some of the temporal dependence into account by embedding nearby words close to each other. We conjecture that this is the cause for the increase in performance for the vector-based models, compared to the RNN-based model. The performance gap is especially visible for the time averaged vector representations.
3.3 Qualitative analysis
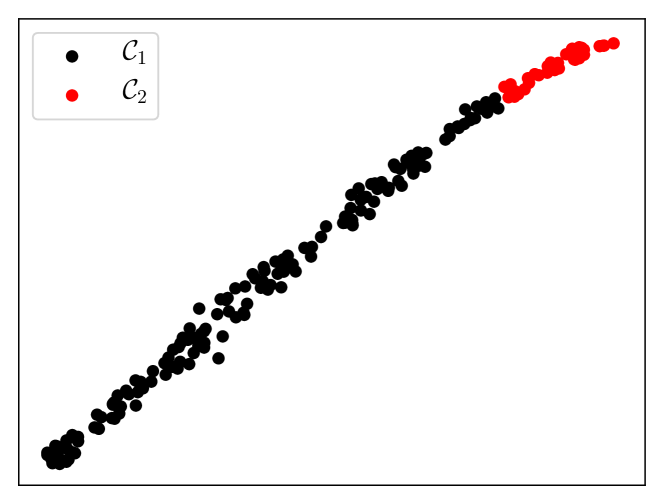
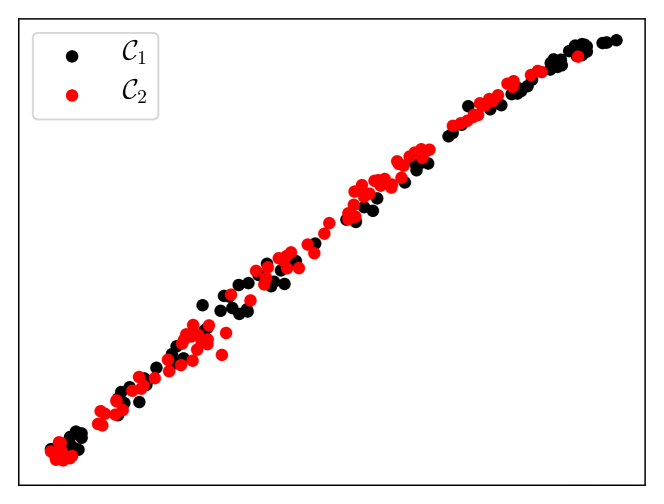
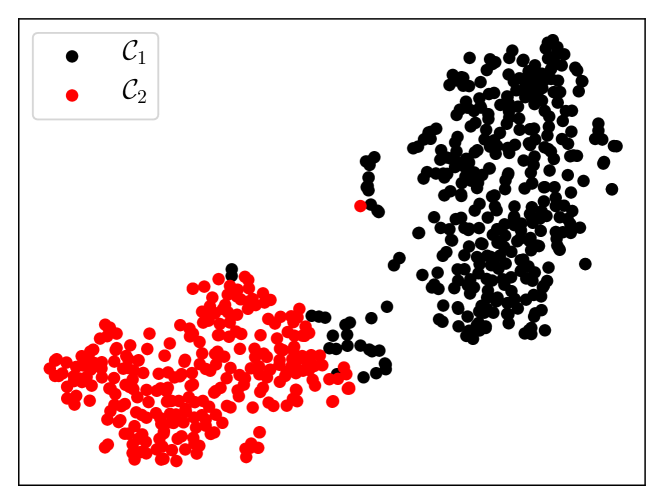
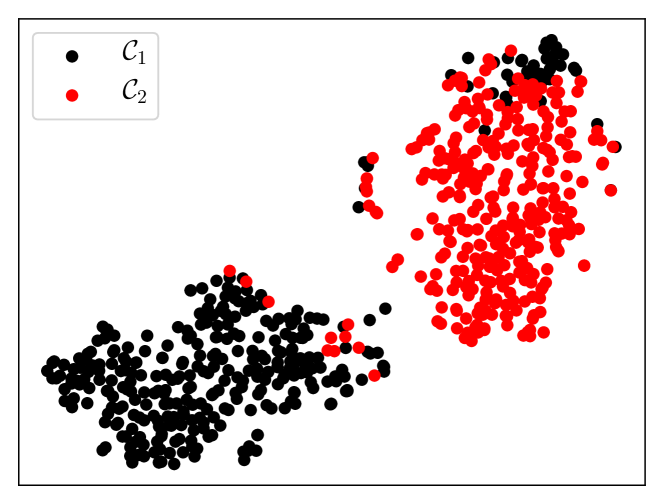
To further evaluate the validity of our results, we project the time-averaged Speech Commands data down to two dimensions using -SNE [27] (Fig. 2). The points in Fig. 2(a) indicate that the length of the sequences is a neighborhood determining feature. If we now consider the plot in Fig. 2(c), we see that -means has learned to group sequences almost solely based on their lengths. In the event that sequence length was a reliable predictor for the class membership, this would be acceptable. However, this is not the case, as can be seen in Fig. 2(b). Shifting our focus to the predictions of RDDC (Fig. 2(d)), we see that RDDC instead learns features which are not directly related to the sequence lengths, making its predictions more accurate with respect to the ground truth labels.
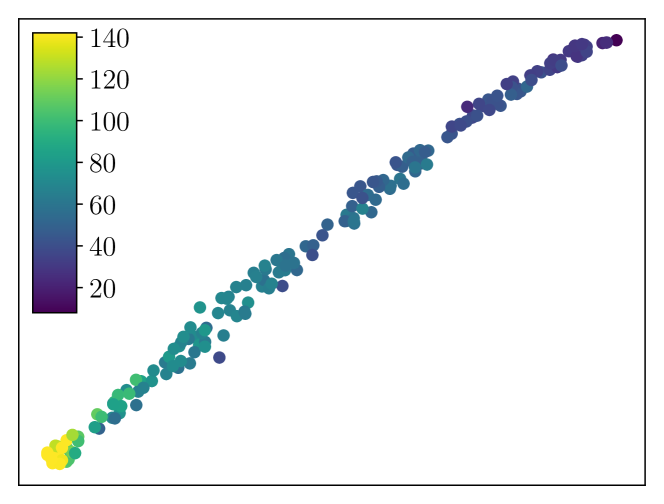
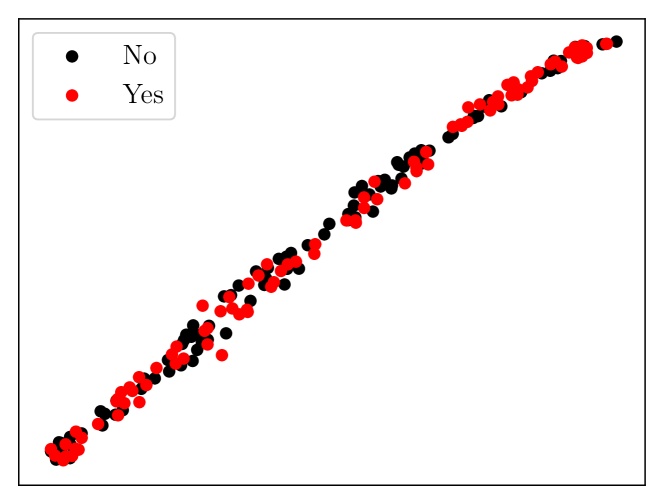
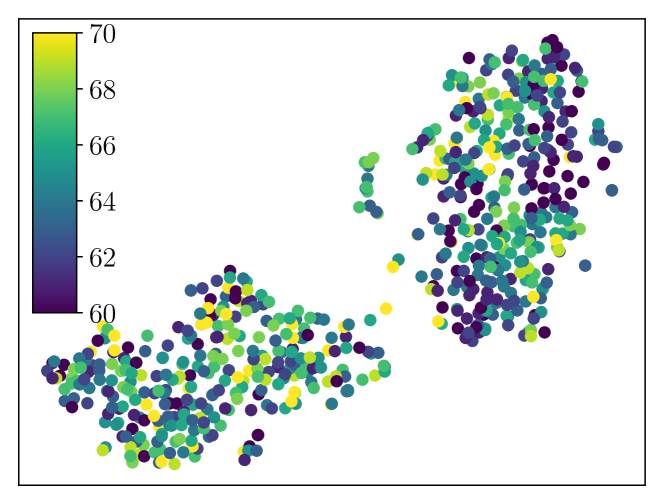

To eliminate the sequence length dependency, we remove all sequences shorter than timesteps and longer than timesteps. For -SNE and -means, the remaining sequences are then cropped to timesteps, producing sequences of equal length. Fig. 3 shows the -SNE representations of these sequences. From Fig. 3(a), it is indeed apparent that the sequence length dependency has been greatly reduced by considering sequences of approximately same length. Moreover, the -SNE representation now shows two separate clusters, which correspond to the ground truth labels (Fig. 2(b)).
Running -means on only the sequences with similar lengths resulted in much improved predictions (Fig. 3(c)), which was expected, due to the reduced influence of the sequence lengths. The RDDC predictions on the other hand, were obtained from the model trained on the full dataset. This further indicates that, for these sequences, RDDC trained on the full model has learned to separate the "Yes" and "No" recordings.
4 Conclusion
In this paper, we addressed the task of time series clustering. Our model uses a recurrent neural network as a feature extractor and a divergence-based clustering loss function in order to find underlying structure as well as optimize the feature extraction. Our approach is able to effectively cluster time series of different length and multivariate data with complex temporal dependencies, outperforming previous approaches that do not exploit the temporal dependencies in the data.
References
- [1] Sergios Theodoridis and Konstantinos Koutroumbas, Pattern recognition, Elsevier Acad. Press, Amsterdam, 4. ed edition, 2009, OCLC: 550588366.
- [2] Shai Shalev-Shwartz and Shai Ben-David, Understanding machine learning: from theory to algorithms, Cambridge University Press, New York, NY, USA, 2014.
- [3] J. MacQueen, “Some methods for classification and analysis of multivariate observations,” 1967, The Regents of the University of California.
- [4] Joe H. Ward Jr, “Hierarchical Grouping to Optimize an Objective Function,” Journal of the American Statistical Association, vol. 58, no. 301, pp. 236–244, Mar. 1963.
- [5] Jianbo Shi and J. Malik, “Normalized cuts and image segmentation,” IEEE Transactions on Pattern Analysis and Machine Intelligence, vol. 22, no. 8, pp. 888–905, Aug. 2000.
- [6] Y. Bengio, A. Courville, and P. Vincent, “Representation Learning: A Review and New Perspectives,” IEEE Transactions on Pattern Analysis and Machine Intelligence, vol. 35, no. 8, pp. 1798–1828, Aug. 2013.
- [7] Alex Krizhevsky, Ilya Sutskever, and Geoffrey E Hinton, “ImageNet Classification with Deep Convolutional Neural Networks,” in Advances in Neural Information Processing Systems 25, 2012, pp. 1097–1105.
- [8] Kyunghyun Cho, Bart van Merrienboer, Caglar Gulcehre, Dzmitry Bahdanau, Fethi Bougares, Holger Schwenk, and Yoshua Bengio, “Learning Phrase Representations using RNN Encoder-Decoder for Statistical Machine Translation,” arXiv:1406.1078 [cs, stat], June 2014, arXiv: 1406.1078.
- [9] Yann LeCun, Yoshua Bengio, and Geoffrey Hinton, “Deep learning,” Nature, vol. 521, no. 7553, pp. 436–444, May 2015.
- [10] Junyuan Xie, Ross Girshick, and Ali Farhadi, “Unsupervised Deep Embedding for Clustering Analysis,” in Proceedings of The 33rd International Conference on Machine Learning, June 2016, vol. 48 of Proceedings of Machine Learning Research, pp. 478–487.
- [11] Xifeng Guo, Long Gao, Xinwang Liu, and Jianping Yin, “Improved Deep Embedded Clustering with Local Structure Preservation,” in Proceedings of the Twenty-Sixth International Joint Conference on Artificial Intelligence, 2017, pp. 1753–1759.
- [12] Bo Yang, Xiao Fu, Nicholas D. Sidiropoulos, and Mingyi Hong, “Towards K-means-friendly Spaces: Simultaneous Deep Learning and Clustering,” in Proceedings of the 34th International Conference on Machine Learning, Aug. 2017, vol. 70 of Proceedings of Machine Learning Research, pp. 3861–3870.
- [13] Jost Tobias Springenberg, “Unsupervised and Semi-supervised Learning with Categorical Generative Adversarial Networks,” arXiv:1511.06390 [cs, stat], Nov. 2015, arXiv: 1511.06390.
- [14] Michael Kampffmeyer, Sigurd Løkse, F. M. Bianchi, L. Livi, A. Salberg, and R. Jenssen, “Deep divergence-based clustering,” in 2017 IEEE 27th International Workshop on Machine Learning for Signal Processing, Sept. 2017, pp. 1–6.
- [15] Benjamin Bruno Meier, Ismail Elezi, Mohammadreza Amirian, Oliver Dürr, and Thilo Stadelmann, “Learning Neural Models for End-to-End Clustering,” in Artificial Neural Networks in Pattern Recognition, Lecture notes in computer science, pp. 126–138. Springer International Publishing, 2018.
- [16] Sergey Ioffe and Christian Szegedy, “Batch Normalization: Accelerating Deep Network Training by Reducing Internal Covariate Shift,” arXiv:1502.03167 [cs], Feb. 2015, arXiv: 1502.03167.
- [17] Robert Jenssen, Jose C. Principe, Deniz Erdogmus, and Torbjørn Eltoft, “The Cauchy–Schwarz divergence and Parzen windowing: Connections to graph theory and Mercer kernels,” Journal of the Franklin Institute, vol. 343, no. 6, pp. 614–629, Sept. 2006.
- [18] Emanuel Parzen, “On Estimation of a Probability Density Function and Mode,” The Annals of Mathematical Statistics, vol. 33, no. 3, pp. 1065–1076, Sept. 1962.
- [19] Dua Dheeru and Efi Karra Taniskidou, UCI Machine Learning Repository, University of California, Irvine, School of Information and Computer Sciences, 2017.
- [20] Ana Cardoso-Cachopo, Improving Methods for Single-label Text Categorization, 2007, Published: PdD Thesis, Instituto Superior Tecnico, Universidade Tecnica de Lisboa.
- [21] Guan Yu, Ruizhang Huang, and Zhaojun Wang, “Document clustering via dirichlet process mixture model with feature selection,” in Proceedings of the 16th ACM SIGKDD international conference on Knowledge discovery and data mining - KDD ’10. 2010, p. 763, ACM Press.
- [22] Sun Kim and W John Wilbur, “Thematic clustering of text documents using an EM-based approach,” Journal of Biomedical Semantics, vol. 3, no. Suppl 3, pp. S6, Oct. 2012.
- [23] Tomas Mikolov, Kai Chen, Greg Corrado, and Jeffrey Dean, “Efficient Estimation of Word Representations in Vector Space,” arXiv:1301.3781 [cs], Jan. 2013, arXiv: 1301.3781.
- [24] Pete Warden, “Speech Commands: A public dataset for single-word speech recognition.,” 2017.
- [25] Diederik P. Kingma and Jimmy Ba, “Adam: A Method for Stochastic Optimization,” arXiv:1412.6980 [cs], Dec. 2014, arXiv: 1412.6980.
- [26] R. Jenssen, “Kernel Entropy Component Analysis,” IEEE Transactions on Pattern Analysis and Machine Intelligence, vol. 32, no. 5, pp. 847–860, May 2010.
- [27] Laurens van der Maaten and Geoffrey Hinton, “Visualizing Data using t-SNE,” Journal of Machine Learning Research, vol. 9, pp. 2579–2605, 2008.