The Little Dippers: Transits of Star-grazing Exocomets?
Abstract
We describe EPIC 205718330 and EPIC 235240266, two systems identified in the K2 data whose light curves contain episodic drops in brightness with shapes and durations similar to those of the young “dipper" stars, yet shallower by 1–2 orders of magnitude. These “little dippers" have diverse profile shapes with durations of 0.5–1.0 days and depths of 0.1–1.0% in flux; however, unlike most of the young dipper stars, these do not exhibit any detectable infrared excess indicative of protoplanetary disks, and our ground-based follow-up spectra lack any signatures of youth while indicating these objects as kinematically old. After ruling out instrumental and/or data processing artifacts as sources of the dimming events, we investigate possible astrophysical mechanisms based on the light curve and stellar properties. We argue that the little dippers are consistent with transits of star-grazing exocomets, and speculate that they are signposts of massive non-transiting exoplanets driving the close-approach orbits.
keywords:
stars: variables: general – comets: general – planetary systems – minor planets, asteroids: general – stars: individual: (EPIC 205718330 and EPIC 235240266)1 Introduction
The space-based Kepler mission (Borucki, 2016) and its K2 successor (Howell et al., 2014) have provided ultra-precise time-series photometry for hundreds of thousands of nearby stars. Light curves from these missions have been used to identify thousands of close-in transiting exoplanets (Batalha et al., 2013; Crossfield et al., 2016; Mann et al., 2017) and also study other types of circumstellar material around young stellar objects (e.g., Ansdell et al., 2016b; Stauffer et al., 2017; Cody & Hillenbrand, 2018), main-sequence stars (e.g., Boyajian et al., 2016; Rappaport et al., 2018), and even white dwarfs (e.g., Vanderburg et al., 2015).
In particular, the so-called “dipper” stars are young ( Myr), K/M-type pre-main sequence stars that exhibit deep (10%) and moderate-duration (0.5–2.0 day) drops in brightness with diverse time profiles (e.g., see Figure 4 in Ansdell et al., 2016b) that can appear quasi-periodically or aperiodically (e.g., see Figure 3 in Ansdell et al., 2016b) as well as episodically (e.g., Scaringi et al., 2016). Although the first known dippers (e.g., AA Tau; Bouvier et al., 1999) were discovered from the ground, and later with the CoRoT and Spitzer space missions (Alencar et al., 2010; Morales-Calderón et al., 2011; Cody et al., 2014), K2’s survey of nearby star-forming regions has greatly expanded studies of these objects (Ansdell et al., 2016b, a; Scaringi et al., 2016; Bodman et al., 2017; Hedges et al., 2018; Cody & Hillenbrand, 2018). The dipper phenomenon is thought to be due to transits of circumstellar dust, likely related to primordial circumstellar disks, as these objects nearly all have clear infrared excesses and often exhibit line emission related to accretion (Ansdell et al., 2016b). Moreover, simultaneous optical and near-infrared time-series photometry has shown that the dips can be shallower at longer wavelengths, consistent with extinction by optically thin dust (Morales-Calderón et al., 2011; Cody et al., 2014; Schneider et al., 2018).
The unprecedented precision of Kepler has also enabled detection of very shallow (%) flux dips in the light curves of two F2V main-sequence stars, KIC 3542116 and KIC 11084727 (Rappaport et al., 2018). These dimming events occur aperiodically and have shapes characteristic of trailing dust tails (i.e, asymmetric shapes with steep ingresses and slower egresses; Lecavelier Des Etangs et al., 1999), thus have been explained in terms of transits of remnant circumstellar planetesimals, namely “exocomets" (Rappaport et al., 2018). KIC 3542116 exhibited six 0.05–0.1% dips in its Kepler light curve, each lasting 0.5–1.0 days, while KIC 1108472 had a single similarly shaped transit. Rappaport et al. (2018) did not report any detectable infrared excess or other signatures of stellar youth for KIC 3542116 and KIC 11084727. Similarly, the F3 V/IV star KIC 8462852 (Boyajian’s star; Boyajian et al., 2016) lacks detectable infrared excess or signatures of youth, yet exhibits both shallow (1%) and deep (20%) flux drops with irregular shapes and typical durations of a few days. A variety of mechanisms have been invoked to explain KIC 8462852’s dimming events, such as collisions of large bodies, a family of exocomet fragments, and a dusty debris ring (Boyajian et al., 2016; Katz, 2017; Wyatt et al., 2018). Regardless of the mechanism, the dips are likely caused by dusty material, as multi-band photometric monitoring from the ground has shown that the dips have a wavelength dependence consistent with extinction by optically thin sub-m dust (Bodman et al., 2018).
Here we present two systems, EPIC 205718330 and EPIC 235240266, which also do not exhibit any detectable infrared excesses or other signatures of youth, yet show very shallow (0.1–1%) episodic dips in their K2 light curves that last 0.5–1.0 days. What sets these apart from the aforementioned exocomet systems is that most of the observed dips do not have the typical profiles of trailing dust tails; rather, the dip profiles have a variety of shapes (symmetric, leading-tail, complex) remarkably similar to those seen in the young dipper systems, but an order of magnitude shallower. In this work, we analyze the K2 light curves and follow-up observations of these two “little dippers." In Section 2, we present the available data for EPIC 205718330 and EPIC 235240266, including their K2 light curves and all-sky survey photometry, as well as our follow-up spectra and adaptive optics imaging. The stellar and dip properties of the little dippers are derived from these data in Section 3. We discuss possible mechanisms for the dimming events in Section 4 and summarize our work in Section 5.
2 Data
2.1 K2 Light Curves
EPIC 205718330 and EPIC 235240266 were discovered during a visual re-survey of K2 lightcurves, focused on finding dipper stars that were outside of the constraints used in the original survey (e.g., requiring at least five 10% flux dips in the 80-day K2 campaign; Ansdell et al., 2016b) while also including data from newly released K2 campaigns (up until Campaign 17). The search was conducted using LcTools,111https://sites.google.com/a/lctools.net/lctools/ a free and publicly available software program that provides a set of applications for efficiently building and visually inspecting large numbers of light curves (Kipping et al., 2015). For more details on the LcTools package and the visual survey methodology, see Rappaport et al. (2018). EPIC 205718330 and EPIC 235240266 were identified as distinct objects in the K2 dataset based on their dipper-like profiles but very shallow transit depths.
2.1.1 EPIC 205718330
EPIC 205718330 was observed during K2 Campaign 2 (K2/C2). The 77.5-day K2/C2 light curve, shown in Figure 2, was extracted using the K2 Self Field Flattening (K2SFF) technique described in Vanderburg & Johnson (2014) and Vanderburg et al. (2016). K2SFF extracts light curves from Kepler Target Pixel Files (TPFs) using fixed photometric apertures, correcting for spacecraft motion by correlating observed flux variability with spacecraft pointing. This correction is needed because quasi-periodic thruster firings that account for spacecraft pointing drift can introduce artificial systematics into the K2 light curves as differing amounts of target flux are lost or contaminated within the fixed photometric aperture.
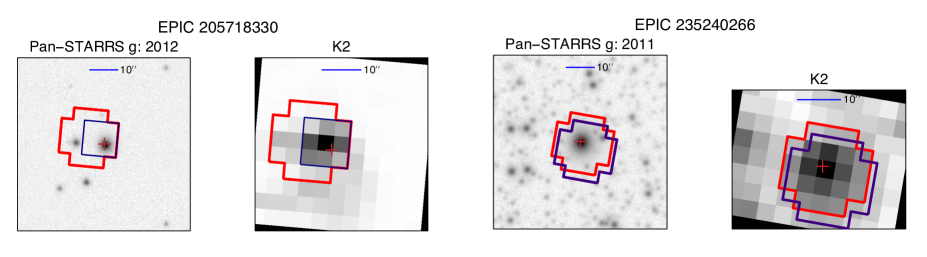
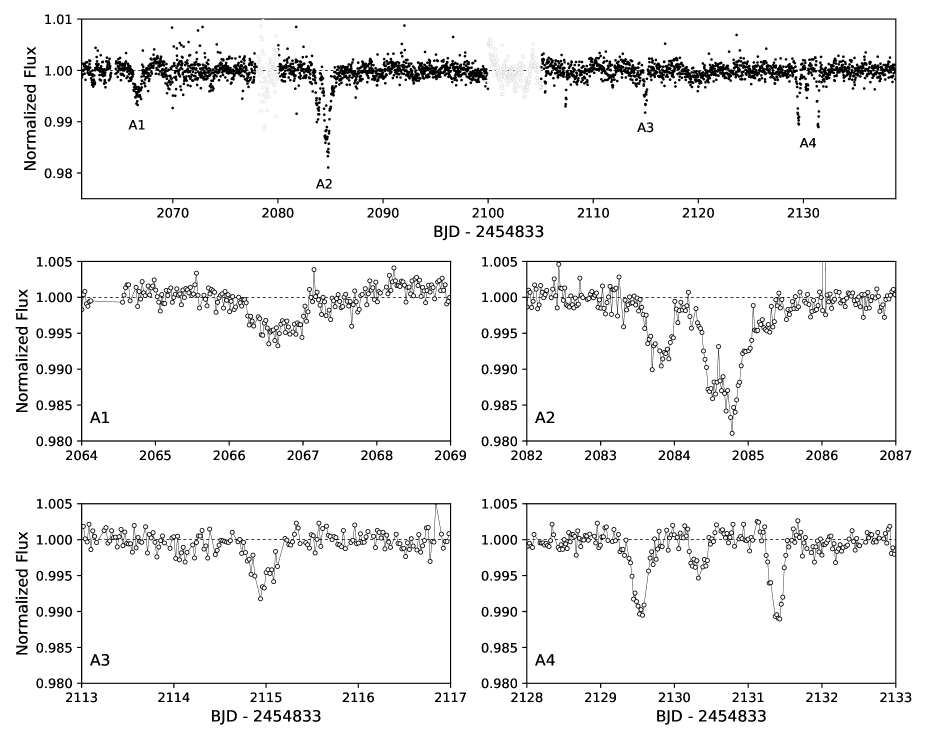
Although the K2SFF light curves are made publicly available via the Mikulski Archive for Space Telescope (MAST),222https://archive.stsci.edu/prepds/k2sff/ we improved upon the default K2SFF output by performing the systematics correction on the full K2 light curve, rather than splitting the time series into two segments; this eliminated a jump midway through the default K2SFF light curve. As shown in Figure 1, we extracted the light curve using a large aperture to improve photometric precision, however one consequence was the inclusion of two contaminating stars; we confirmed that the dipping events were associated with EPIC 205718330 by re-extracting the light curve using a smaller aperture that excluded these other stars, but also some flux from EPIC 205718330. The normalized light curve shown in Figure 2 has been corrected for dilution due to the two contaminant stars by subtracting their fractional flux; for this, we used the Gaia Data Release 2 (DR2; Gaia Collaboration et al., 2018) -band magnitudes, which are similar to Kepler magnitudes (the dilution correction was ultimately negligible). To normalize the light curve, we divide by a fitted cubic spline with uniform knots every three days constructed using the LSQUnivariateSpline interpolation in SciPy. When fitting the spline, we excluded sections of the light curve containing the dips as well as two regions of increased scatter that are likely not due to astrophysical phenomenon associated with the target star (these are grayed out in Figure 2). We then interpolated the fitted spline over the excluded regions and applied the correction to the entire light curve.
2.1.2 EPIC 235240266
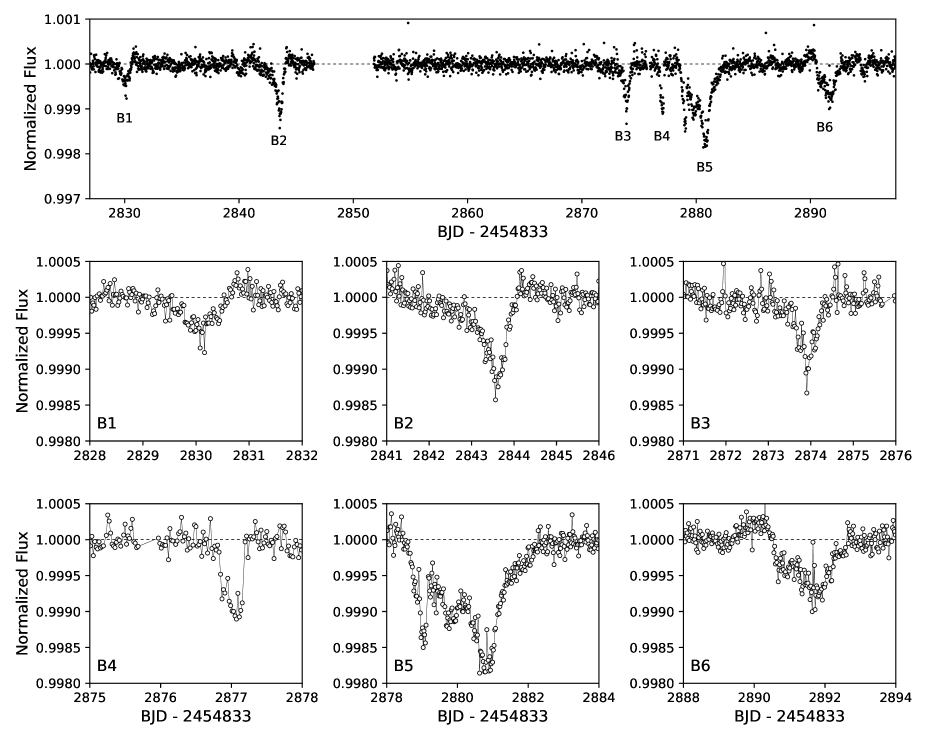
EPIC 235240266 was targeted during K2 Campaign 11 (K2/C11). K2/C11 was separated into two operational segments due to an error in the initial roll-angle used to minimize solar torque on the spacecraft. An excess roll motion identified at the beginning of K2/C11 indicated that targets would eventually move out of their set apertures. Therefore a roll offset was applied 23 days into K2/C11, requiring new target aperture definitions, shown in Figure 1. The two light curve segments are identified separately in the MAST archive as C111 and C112. We downloaded the default K2SFF light curves, however due to the break in operations during K2/C11, there remained a jump in the data between the two segments as well as upward “hooks” at the beginning of each segment due to thermal settling of the spacecraft. Thus we removed the first two days of each segment before normalizing with fitted cubic splines with uniform knots every 1.5 and 1.0 days for the first and second segments, respectively. We note that the dilution corrections for the much fainter contaminant stars in the photometric aperture were negligible. Figure 3 shows the full 70.5-day K2/C11 light curve.
2.1.3 Validation Checks of K2 Light Curves
We conducted validation checks to rule out common false-positive dip signals seen in K2 data. First, we re-ran the K2SFF de-trending using a range of parameters to assess the robustness of the dips. Although the dips can be made slightly shallower or deeper depending on the chosen de-trending parameters, the changes were always less than a factor of two for reasonable values, and no combination of de-trending parameters could completely erase any of the dips. Thus we are confident that the dips are not a bi-product of the K2SFF de-trending process. Second, we checked for time-variable background noise (“rolling bands") and contamination from nearby (5 arcmin) bright stars that could explain the dips. No time-variable background signals were seen around the targets and no similar dimming events were found in nearby stars on the same CCD module during the dips. Third, we tested for “CCD crosstalk" that occurs when bright stars cause signals at the same pixel coordinates on other channels within the same module due to the coupled CCD readout. For both targets, we inspected all downloaded stars within a given radius on each channel in the module, but found no correlations between the dips and variability in nearby stars. To check against sources not downloaded individually, we inspected the full-frame images (FFIs) for nearby bright stars: only EPIC 235240266 had a nearby saturated star on a different channel, however our target is outside of the halo and away from the bleed column, thus unlikely to be affected by crosstalk. Although EPIC 235240266 could still be on a diffraction spike, there is no evidence of crosstalk on neighboring individually downloaded stars.
2.2 Literature Data
Literature data come from all-sky photometric surveys and Gaia DR2. Table 1 gives the precise coordinates (, ), proper motions (, ), and distances () from Gaia DR2. Table 2 gives the available photometry: optical photometry is from the AAVSO Photometric All Sky Survey (APASS; Henden et al., 2016) and Gaia DR2; near-infrared photometry is from the Deep Near Infrared Survey of the Southern Sky (DENIS; DENIS Consortium, 2005) and Two Micron All-Sky Survey (2MASS; Skrutskie et al., 2006); mid-infrared photometry is from the Wide-field Infrared Survey Explorer (WISE; Wright et al., 2010). The 2MASS designations for EPIC 205718330 and EPIC 235240266 are 2MASS 16333538-1530414 and 2MASS 17241057-2332318, respectively.
| Parameter | 205718330 | 235240266 | Units |
| Gaia | |||
| 16:33:35.3702 | 17:24:10.5454 | ||
| :30:42.420 | :32:32.636 | ||
| mas/yr | |||
| mas/yr | |||
| pc | |||
| Photometry + Parallax | |||
| 4810 | 6120 | K | |
| 1.84 | 1.60 | mag | |
| log | 4.57 | 4.10 | |
| 0.13 | 0.04 | ||
| 0.76 | 1.64 | ||
| 0.78 | 1.20 | ||
| X-Shooter Spectra | |||
| K | |||
| km s-1 | |||
| RV | km s-1 | ||
| SNIFS + SpeX Spectra | |||
| 4900 | 5700 | K | |
| 2.1 | 1.4 | mag | |
| log | 4.0 | 3.5 | |
| Band | EPIC 205718330 | EPIC 235240266 |
|---|---|---|
| Johnson | ||
| Johnson | ||
| Sloan | ||
| Sloan | ||
| Sloan | ||
| 2MASS | ||
| 2MASS | ||
| 2MASS | ||
| WISE 1 | ||
| WISE 2 | ||
| WISE 3 | ||
| WISE 4 |
2.3 Follow-up Observations
2.3.1 Spectroscopy
We acquired spectra with the wide-band, intermediate-resolution X-Shooter spectrograph (Vernet et al., 2011) mounted on the 8.2 m European Southern Observatory (ESO) Very Large Telescope (VLT) at Cerro Paranal in Chile during UT 2018 May 20–21. VLT/X-Shooter simultaneously covers wavelengths from about 300 to 2500 nm divided into UVB (300–550 nm), VIS (500–1050 nm), and NIR (1000–2500 nm) arms. The slit widths differ for each arm: we used narrow slits (0.1′′, 0.4′′, 0.4′′) to obtain finer spectral resolution (, 18400, 11600) in addition to wide slits (5.0′′, 5.0′′, 5.0′′) that do not suffer from flux losses for absolute flux calibration. Data reduction was performed with the ESO X-Shooter pipeline (Modigliani et al., 2010) version 2.9.3, which includes flat fielding, bias subtraction, order extraction and combination, rectification, wavelength calibration, flux calibration using standard stars observed in the same night, and final extraction of the spectrum.
We also obtained optical spectra using the moderate-resolution Super-Nova Integral Field Spectrograph (SNIFS; Aldering et al., 2002; Lantz et al., 2004) at the University of Hawaii 2.2 m telescope atop Maunakea during UT 2018 May 18–19. SNIFS covers wavelengths from 3200 to 9700 Å and does not suffer from wavelength-dependent slit losses that can be difficult to accurately correct. Our SNIFS spectra have resolutions of and signal-to-noise ratios of per resolution element at 6500 Å. Details of our SNIFS observations, data reduction, and extraction can be found in Mann et al. (2012) and Lépine et al. (2013).
We acquired moderate-resolution near-infrared spectra using the upgraded SpeX spectrograph (Spex; Rayner et al., 2003) on the 3.2 m NASA Infrared Telescope Facility (IRTF) atop Maunakea on UT 2018 April 24. Our SpeX spectra were taken in the short cross-dispersed (SXD) mode using the 0.3′′15′′ slit, covering 0.7 to 2.5 m at with in band. Basic reduction (bias subtraction, flat fielding, extraction, etc.) was carried out with SpeXTool (Cushing et al., 2004). Flux calibration and telluric line removal were then performed using A0V standards with Xtellcor (Vacca et al., 2003). See Mann et al. (2013) for details on the observations, data reduction, and spectrum extraction.
2.3.2 AO Imaging
Adaptive optics (AO) imaging for EPIC 205718330 was acquired using the Infrared Camera and Spectrograph (IRCS; Kobayashi et al., 2000) with AO88 (Hayano et al., 2010) on the Subaru Telescope atop Maunakea on UT 2018 June 14. We performed imaging in fine-sampling mode using a five-point dither pattern with a total integration of 37.5 s. Weather conditions were good and natural seeing was in near-infrared bands. We reduced the raw IRCS data using the procedures of Hirano et al. (2016), which include dark subtraction, flat fielding, and distortion correction of the individual frames, which were then aligned and median combined to form the final image. For EPIC 235240266, we used the Near InfraRed imaging Camera (NIRC2) on the Keck II 10 m telescope atop Maunakea with natural guide star AO (NGS-AO; Wizinowich et al., 2000; van Dam et al., 2004) on UT 2018 April 29. Seeing conditions were poor and only partial corrections were obtained in most images: the best resolution was . Eight sets of 100.5 integrations were obtained through the filter with the narrow camera.
2.3.3 Long-baseline Light Curves
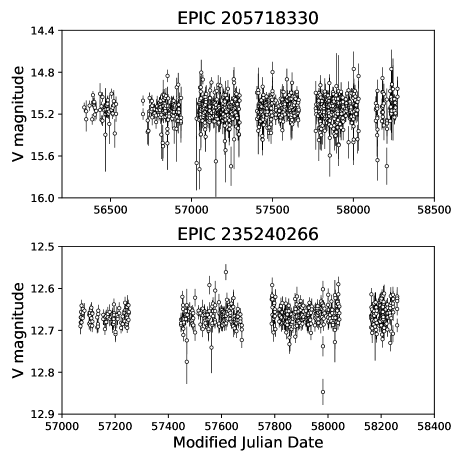
To assess long-term (yrs) variability, we obtained photometry from the All-Sky Automated Survey for SuperNovae (ASAS-SN; Shappee et al., 2014; Kochanek et al., 2017). ASAS-SN images the sky every two days down to from CTIO in Chile and Haleakala in Hawaii, both hosted by the Las Cumbres Observatory Global Telescope Network (LCOGT; Brown et al., 2013). Each site has four 14 cm lenses, each with a 2k2k CCD camera. The field of view is 4.54.5 deg, the pixel scale is 8′′, and the FWHM of the PSF is 15′′. The -band magnitudes for each source were extracted from the images using aperture photometry with zero-points calibrated using the APASS catalog (Levine, 2017). EPIC 205718330 was observed 1000 times from UT 2013 Feb 14 to 2018 June 3 with a median per-point error of 0.06 mags, while EPIC 235240266 was observed 600 times from UT 2015 February 16 to 2018 May 22 with a median per-point error of 0.02 mags. The ASAS-SN light curves for both stars are shown in Figure 4.
3 Analysis
3.1 Stellar Properties
3.1.1 Photometrically derived properties
We fit the Gaia parallax in Table 1 and the observed photometry in Table 2 (except for the Gaia magnitudes) to the MESA Isochrones & Stellar Tracks (MIST; Dotter, 2016) model grid using the isochrones Python package (Morton, 2015). isochrones is a tool for inferring model-based physical properties given photometric or spectroscopic observations of a star. The package performs 3D linear interpolations in mass–metallicity–age parameter space across a given stellar model grid and then uses nested sampling to capture the potentially multi-modal posterior distributions of the stellar physical parameters (e.g., in the case of evolved stars along the subgiant branch). For more details on the fitting method and applications to other systems, see Montet et al. (2015) and Morton et al. (2016). The best-fit results are shown in Table 1; typical errors were a few percent, although these are likely underestimated. Nevertheless, the results indicate that EPIC 205718330 and EPIC 235240266 have stellar effective temperatures () of 5000 K and 6000 K, corresponding to main sequence mid-K and late-F dwarf stars, respectively. They also both have metallicities ([Fe/H]) consistent with solar and moderate extinctions (), as expected for their locations. We note that EPIC 235240266 has a surface gravity of , indicating it may be ascending the sub-giant branch, which is also suggested by its magnitude and Gaia distance.
3.1.2 Spectroscopically Derived Properties
We used our intermediate-resolution X-Shooter spectra (Section 2.3.1) to derive the stellar properties of EPIC 205718330 and EPIC 235240266 given in Table 1. For this, we utilized ROTFIT (Frasca et al., 2017), which fits BT-SETTL synthetic stellar photosphere templates (Allard et al., 2011) to several segments of continuum-normalized X-Shooter spectra in order to derive atmospheric parameters ( and ) as well as projected rotational velocity () by minimization. We assumed solar metallicity and zero veiling (note that because ROTFIT does not fit the continuum shape, assumptions of extinction do not affect the results). For EPIC 205718330 the best-fit model had K and , while for EPIC 235240266 the best-fit model had K and —all roughly consistent with the values derived from photometry and Gaia parallax (Section 3.1.1). We also find low values of km s-1 for EPIC 205718330 and km s-1 for EPIC 235240266 (as shown in Frasca et al. 2017, the resolution and sampling of X-Shooter spectra do not allow constraints on lower than 6 or 8 km s-1, depending on the slit width). ROTFIT also measures the heliocentric radial velocity (RV) by means of a Gaussian fit to the cross-correlation function between the target and synthetic spectrum, where the heliocentric correction is calculated by the X-Shooter pipeline; we found RV km s-1 for EPIC 205718330 and RV km s-1 for EPIC 235240266.
Additionally, we used our moderate-resolution visible SNIFS spectra and near-infrared SpeX spectra (Section 2.3.1) to check these stellar properties while varying [Fe/H] and . We prepared a single flux-calibrated spectrum for each target by splicing their SNIFS and SpeX spectra together, slightly distorting the spectra to achieve minimum agreement between synthetic magnitudes generated from the observed spectra using the profiles determined in Mann & von Braun (2015) and the actual APASS and 2MASS photometry. We then compared these flux-calibrated spectra to a grid of model atmosphere spectra generated by the PHOENIX code (Husser et al., 2013), with steps of 100 K in , 0.5 in , and 0.5 in [Fe/H]. For each comparison model spectrum the best-fit was calculated, adopting the Cardelli et al. (1989) extinction model. These stellar properties are given in Table 1; we do not give uncertainties due to strong degeneracies between and . For EPIC 205718330, the best-fit model had K, , , and —all roughly consistent with the values derived from the photometry and Gaia parallax (Section 3.1.1; unsurprising since the spectra are flux-calibrated with photometry) as well as our X-Shooter spectra (see above). The expected total extinction along this line of sight is (Schlegel et al., 1998; Schlafly & Finkbeiner, 2011), which could be consistent with our best-fit value if most of this total extinction is due to the foreground Upper Scorpius cloud. For EPIC 235240266, the best fit model had K, , , and ; this is again broadly consistent with the photometry and Gaia parallax as well as our X-Shooter spectra, and are allowed by the expected total extinction along this line of sight of .
Stellar properties based on photometry and the overall spectral energy distribution (SED) shape are subject to systematic errors produced by interstellar reddening, if is not independently determined, and to a lesser extent by the covariance between , , and [Fe/H]. This is particularly problematic for EPIC 235240266, as its photometry and parallax is consistent either with an F-type dwarf that is more reddened, or a K-type subgiant that is less reddened. These degeneracies have less impact on analyses based on spectra that resolve individual lines. In particular, the narrowness of strong lines in the X-shooter spectrum of EPIC 235240266 suggest lower , but final adjudication will probably require a higher-quality spectrum than what is currently available.
3.2 Signatures of Youth
3.2.1 Infrared Excess
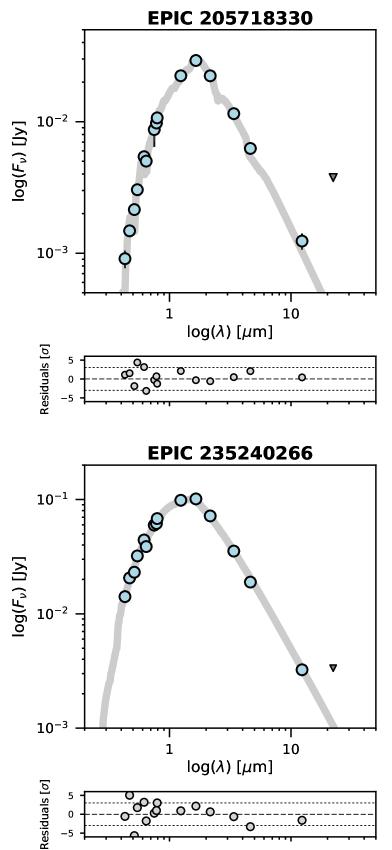
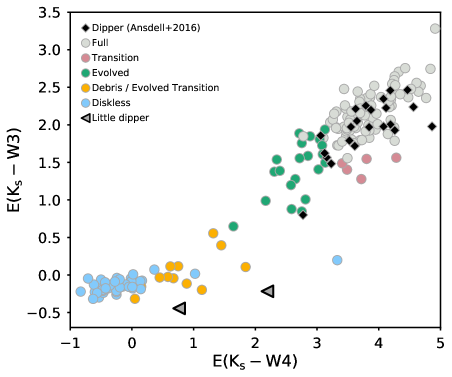
We used the observed photometry in Table 2 to construct SEDs, which we compared to synthetic photometry derived from PHOENIX stellar atmosphere models to constrain the levels of any infrared excess above the stellar photosphere that could be indicative of dusty circumstellar disks. We found the best-fit stellar model by minimizing the differences between the observed and synthetic photometry while varying , , , and [M/H]. The SEDs and best-fit models are shown in Figure 5, which illustrate a lack of detectable infrared excess for both targets. The corresponding limits on the fractional luminosity for disks approximated as blackbodies with temperatures of 300 K are and for EPIC 205718330 and EPIC 235240266, respectively (limits at all other temperatures are higher). These modest limits are insufficient to rule out possible debris disks, which commonly have , especially at ages older than 100 Myr (Wyatt, 2008). However, we can use these limits on infrared excess to clearly rule out primordial circumstellar disks, which sets these systems apart from the young dipper stars, as illustrated in Figure 6. Additionally, the long-baseline light curves from ASAS-SN (Figure 4; Section 2.3.3) do not exhibit any long-term dimming that could indicate the presence of circumstellar material in the outer disk (e.g., Rodriguez et al., 2017).
3.2.2 Spectroscopic Accretion Signatures
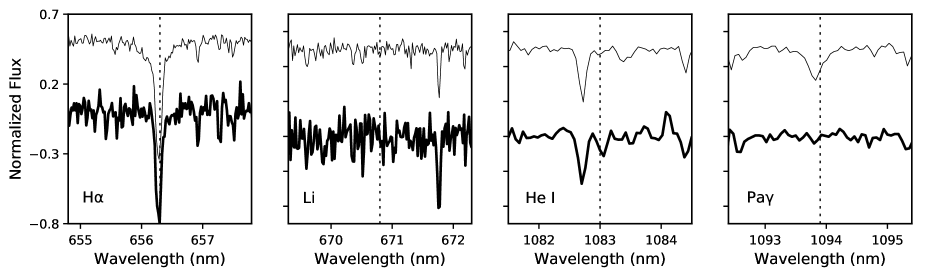
Young objects hosting circumstellar disks exhibit spectral accretion signatures that are produced by shocked gas free-falling onto the star along magnetic field lines as well as disk winds that can be emitted via a variety of mechanisms. We therefore searched our X-Shooter spectra for optical and near-infrared magnetospheric accretion signatures, namely H (6563 Å), Pa (1.094 m), Pa (1.280 m), and Br (2.166 m) emission from H I. These emission lines are routinely observed with X-Shooter in accreting young stars (e.g., Alcalá et al., 2014, 2017). We also searched for the He I (1.083 m) line, which is particularly sensitive to inner disk flows; the line can exhibit red-shifted absorption due to in-falling gas and/or blue-shifted absorption due to inner disk winds, both of which can be shifted on the order of hundreds of km s-1 (e.g., Edwards et al., 2006).
As shown in Figure 7, neither EPIC 205718330 nor EPIC 235240266 show red- or blue-shifted He I absorption and neither source shows H, Pa, Pa, or Br emission. Rather, all lines are seen in absorption at the expected line position or simply not detected. This behavior is notably different than what is seen for the young dipper stars, which often show these spectroscopic signatures of youth (Ansdell et al., 2016b), albeit more weakly than strongly accreting classical T Tauri stars (e.g., Edwards et al., 2006).
3.2.3 Lithium Absorption
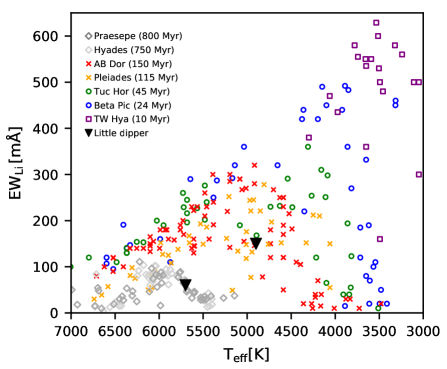
Another spectroscopic indicator of youth for low-mass stars is Li I (6708.0 Å) absorption. This is because low-mass stars have convective outer envelopes, which transport Li I in their photospheres down into their hotter stellar cores where the element is destroyed. This process is rapid ( Myr) for mid-to-late M dwarfs with fully convective envelopes, but is slower for early-M and K dwarfs, as illustrated in Figure 8.
X-Shooter is routinely used to detect Li I absorption in young stars (e.g., Manara et al., 2017). As shown in Figure 7, our X-Shooter spectra show no signs of significant Li I absorption for either target: we find equivalent widths of EW for EPIC 205718330 and EW Å for EPIC 235240266. Uncertainties were determined using a Monte Carlo method: we used the standard deviation of the continuum regions around the expected line position to add Gaussian-distributed noise to the observed spectrum, then repeated the EWLi measurement 100 times, taking the mean and standard deviation as our final EWLi values and uncertainties, respectively.
The lack of Li absorption allows us to place lower limits on stellar ages. Figure 8 compares our 3 upper limits on EWLi for both stars to the EWLi values for members of young clusters of various ages as a function of . The EWLi values come from: Cummings et al. (2017) for the Hyades and Praesepe; Bouvier et al. (2018) for the Pleiades; and da Silva et al. (2009) for all other regions. The rough ages given in Figure 8 are taken from Gagné et al. (2018). From Figure 8, we can constrain the age of EPIC 235240266 to Myr. Due to the larger uncertainties for EPIC 205718330, we can only constrain its age to Myr. Note that these limits assume solar metallicity; for metal poor stars, the limits on age could be older.
3.2.4 Kinematics
The strong constraints on parallax and proper motion from Gaia DR2 (Section 2.2; Table 1), combined with the RVs from our X-Shooter spectra (Section 3.1.2), can be used to determine whether EPIC 205718330 or EPIC 235240266 are associated with any young stellar populations that are still sufficiently bound to occupy distinct regions in both physical and kinematic space. In particular, young disk stars are known to cluster in a distinct “box" of galactic space motion (; calculated with respect to the Sun, where is positive toward the Galactic center) defined by , , and km s-1 (Leggett, 1992).
For EPIC 205718330, we calculated Galactic space motions of , , and km s-1. These values put it outside of the young disk parameter range due to the and space motion components. Indeed, although its proper motion of mas yr-1 and mas yr-1 is consistent with the spectroscopically confirmed cool members of the 10 Myr old Upper Sco association (e.g., see Figure 3 in Bouy & Martín, 2009), its distance of 240 pc puts it well beyond that of the region (145 pc; de Zeeuw et al., 1999). Moreover, its RV of km s-1 is below the typical values for Upper Sco members, which have a median value and 1 velocity dispersion of km s-1 for F2–K9 stars and km s-1 for M0–M8 stars (Dahm et al., 2012). For EPIC 235240266, we calculated Galactic space motions of , , and km s-1. This again puts it outside of the young disk parameter range due to its and space motion components.
3.3 Nearby Sources or Companions
Our AO imaging of EPIC 205718330 (Section 2.3.2) did not show any nearby bright companions within 5′′. Our detection thresholds have contrast ratios of mags at separations of ′′ or –6 mags at 5. The latter corresponds to spectral types of M8.0, assuming the stellar parameters in Table 1 and using Table 5 in Pecaut & Mamajek (2013), thus we can rule out any companions down through late-M types outside of 05.
Our AO imaging of EPIC 235240266 (Section 2.3.2) revealed a second source with mags at 1 with a position angle of roughly 300 degrees. Based on statistical source counts and past experience (Gaidos et al., 2016) this is very likely a background star; moreover, the Gaia proper motion for this source is much smaller ( mas yr-1, mas yr-1) than that of EPIC 235240266, and the Gaia parallax puts the source at 2 kpc. There is no other indication of stellar multiplicity down to separations of 1 with contrasts of mags, which corresponds to spectral types of M5.5, again assuming the stellar parameters in Table 1 and using Table 5 in Pecaut & Mamajek (2013). Thus we can rule out companions down through mid-M types outside of 01.
3.4 Dip Properties
3.4.1 EPIC 205718330
Figure 2 shows the four major dimming events (A1–A4) observed during K2/C2 for EPIC 205718330. A1 and A3 are single dipping events, while A2 and A4 appear to be clusters of multiple dips. The dips are generally symmetric in shape given the low signal-to-noise of the data due to the faintness of the star (although one of the dips in A2 is asymmetric, it may be a blend of at least two dips). The individual dip durations are typically –1.0 days and span depths of –1.5%. The gradients of the dips range from 0.01–0.07 day-1, or just a few percent of the stellar flux per day.
3.4.2 EPIC 235240266
Figure 3 shows the six major dimming events (B1–B6) observed in the K2/C11 lightcurve of EPIC 235240266. Similar to EPIC 205718330, the individual dip durations last –1.0 days. However, the depths are much shallower at %, resulting in much smaller gradients that range from 0.0006–0.004 day-1. The structures of the dips in the light curve of EPIC 235240266 are also more complicated than those of EPIC 205718330. In particular, some of the dips (B1, B2, B6) are accompanied by potential pre- or post-brightening events; this is likely not an artifact of the flattening process, as we can reproduce the brightening events using different normalization techniques (e.g., fitted splines, running medians). Moreover, rather than being symmetric, the dips are asymmetric—specifically, the egresses are significantly steeper (by factors of 1.5–2.5) than the ingresses for all but the last dipping event.
4 DISCUSSION
4.1 Ruling out Planets
The dip shapes seen in Figures 2 and 3 are clearly different from those seen for planetary transits, which have a distinct flat-bottomed shape. Additionally, the dip properties described in Section 3.4 can be used to rule out planet transits. For EPIC 205718330, the transit depths are –1.5%, which correspond to planet radii of –7 when simply assuming and neglecting limb darkening. However, the transit durations are –1.0 days, which would require that such planets have orbital semi-major axes of AU—assuming that the transit duration goes as , where is the orbital period and is the impact parameter. Similar arguments can be applied to rule out planetary transits for EPIC 235240266, which had much smaller dip depths (0.1%) corresponding to planet radii of , but similarly long transit durations of –1.0 days.
4.2 Gravitationally-bound planetesimal clouds?
The dimming events associated with the little dippers could instead be due to occultations of the star by clumps of dusty circumstellar material. This mechanism has been invoked to explain some of the much deeper dimming events associated with the aperiodic young dipper stars that are not significantly accreting and host evolved primordial disks (Ansdell et al., 2016b). Indeed, optically thin debris disks containing such objects would go undetected by the currently available observations of these sources (Section 3.2.1).
To put constraints on the possible sizes and orbital distances of such objects, we followed Ansdell et al. (2016b) and Boyajian et al. (2016) to consider clumps of circumstellar material much less massive than their host star and on circular orbits:
| (1) |
where is the semi-major axis of the clump orbit in AU, is the clump radius in solar radii, is the dip duration in days, and and are the stellar mass and radius, respectively, in solar units. The correlation between and from Equation 1 is illustrated in Figure 9 for a star of and with dip durations of and 1.0 days, comparable to EPIC 205718330.
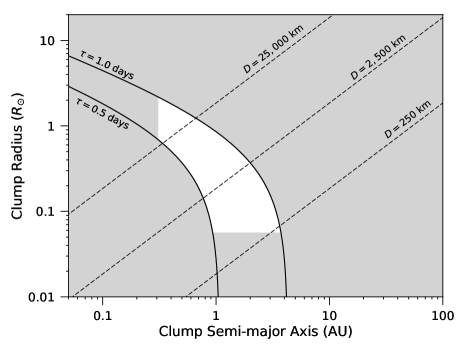
We can place lower limits on due to the aperiodicity of the dimming events, which implies that the clumps have orbital periods longer than the 80-day K2 observing campaigns; inputting this limit into Kepler’s third law gives AU. We can also place lower limits on from the minimum observed dip depth () since the smallest corresponding would be set by an optically thick clump (e.g., see Equation 5 in Ansdell et al., 2016b); using % (e.g., for EPIC 205718330) implies that . These limits are shown by the gray regions in Figure 9.
The clumps must be gravitationally bound in order to be stable against orbital shear (e.g., Kenyon & Bromley, 2005) and internal velocity dispersion (e.g., Jackson & Wyatt, 2012). Thus we could assume they are gravitationally bound within the Hill spheres of planetesimals or planet-sized objects, where the Hill sphere is defined as and is the fraction out to which orbits are stable. Figure 9 shows the Hill spheres of objects of various diameters, assuming bulk densities of 3 g cm-3 and using (i.e., an average between that expected from retrograde and prograde orbits; Rieder & Kenworthy, 2016). Given these constraints, the Hill spheres of objects with diameters –25,000 km (i.e., spanning large-asteroid to super-Earth sizes) can produce the observed dips.
One limiting factor is the required number of such objects that would need to be orbiting at a given semi-major axis for us to observe 4–6 unique transits during the 80-day K2 campaigns. As in Ansdell et al. (2016b), we can estimate the total number of clumps that would pass through our line of sight, assuming they are evenly distributed along the orbit, and correcting for the fact that the line-of-sight only intercepts of the disk for edge-on inclinations, where is the scale height of the disk and assuming (the median for debris disks; Hughes et al., 2018). This gives the total number of clumps in the disk as:
| (2) |
where is in AU, and and are in solar units. This equation predicts a few hundred objects at 1 AU, again assuming a host star of and . Given the constraints shown in Figure 9, these objects may have a range of diameters. Predictions for smaller orbital radii give smaller required numbers, but correspond to much larger objects. Even the smallest objects would correspond to some of the largest asteroids in our Solar System, though survival of such planetesimal disks could be stable over Gyr timescales (e.g., Heng & Tremaine, 2010). Note that this number of required objects no longer holds if the observed objects are clustered in one part of the orbit, and future monitoring of these systems will test this assumption.
Nevertheless, the modest WISE limits on infrared excess do not clearly rule out the possibility of such a population of objects existing. For EPIC 205718330, 1% of the starlight is blocked by orbiting clumps 5% of the time (see Figure 2), giving an average dimming of 0.05%. This average dimming corresponds to the expected dust fractional luminosity for a spherical cloud of clumps surrounding a star, or for a family of clumps along an orbit when corrected by the factor (Wyatt et al., 2018). The WISE limits predict % for EPIC 205718330 (Section 3.2.1), thus are clearly insufficient to rule out even a spherical cloud of clumps. For EPIC 235240266, the dips appear to block 0.1% of the starlight 10% of the time (see Figure 3), implying an average dimming of 0.01%, which is still below but more comparable to the WISE limits of %. Thus for EPIC 235240266 the WISE limits cannot rule out a family of clumps along an orbit and perhaps also a spherical cloud of clumps around the star.
4.3 Star-grazing Exocomets?
Alternatively, the dipping events seen in the light curves of EPIC 205718330 and EPIC 235240266 could be produced by transits of comets, or fragments of a comet, undergoing very close approaches to the star. Thousands of “Sun-grazing" and “Sun-skirting" comets in our own Solar System have been detected by the Solar and Heliospheric Observatory (SOHO) Large Angle Spectrometric Coronagraph (LASCO; Brueckner et al., 1995), and many appear to belong to discrete comet families (Jones et al., 2018).
Rappaport et al. (2018) identified several dips in the Kepler light curve of a main-sequence F2V-type star and explained them by occulting exocomets. These dips have distinctive asymmetric “talon” shapes that represent transits of trailing dust tails (Lecavelier Des Etangs et al., 1999) as well as, in one case, a pre-transit brightening possibly due to forward scattering by dust in the trailing tail (e.g., DeVore et al., 2016). Comparable transit shapes and brightening events have also been seen in the Kepler and K2 light curves of the “disintegrating planets" (see review in van Lieshout & Rappaport, 2017), which have exhibited evidence for both leading and trailing dust tails (e.g., Sanchis-Ojeda et al., 2015).
Similar shapes and effects are seen in the light curves of the little dippers. Not only are the dips of similar duration (1 day) and depth (0.1%), but also the egresses of EPIC 235240266’s dips are significantly steeper than the ingresses (Section 3.4.2), suggestive of leading dust tails. Moreover, there is at least one potential pre-transit brightening event (B6 of EPIC 235240266), indicative of forward scattering by dust. The lack of these features in the light curve of EPIC 205718330 does not rule out the exocomet scenario, as such distinctive shapes are not necessarily observed for some cases of orbit, star, and dust properties (Lecavelier Des Etangs, 1999).
Consider a single cometary body of radius on a near-parabolic orbit with periastron distance around a star with mass . At time relative to the epoch of periastron, the body will have a true anomaly such that:
| (3) |
From Equation 3, the rate of change of true anomaly is:
| (4) |
and thus the rate of change of distance from the star when using Equation 4 is:
| (5) |
Assuming mass-loss from the comet is driven by evaporation of a dark, ice-rich surface with a specific latent heat of vaporization and containing a fraction of spherical dust grains of radius and density , the cross-sectional surface area of dust () produced per unit time is:
| (6) |
Re-expressing Equation 6 as the surface area ejected per unit distance from the star, and using Equation 5, we have:
| (7) |
The and dependencies in Equation 7 show that dust production will strongly peak at periastron. Since the probability of a transiting geometry scales as , these objects are also most likely to significantly obscure the host star near periastron. Moreover, since the flux contributed to the emission in some infrared band-pass will also increase with temperature around periastron, essentially all of the contribution to excess infrared flux is from dust ejected around periastron, assuming the body survives the passage.
We now assume that, during the transit (near periastron), the stellar wind imparts a component to the dust velocity towards the observer, and that the transverse velocity remains approximately the Keplerian value. Thus the total cross-sectional area of dust is the production rate (Equation 6) multiplied by the transit duration , where is the transit velocity at periastron. The maximum dip depth (if the dispersion normal to the orbital plane is small compared to the stellar radius) is therefore:
| (8) |
For a 50-50 water ice-dust composition, and is half that of water ice, thus we estimate from Equation 8:
| (9) |
Hence for a periastron distance of AU (Sun-grazing Kreutz-family comets exhibit a maximum in brightness at this distance; Knight et al., 2010) around a main-sequence K dwarf star with , , and (i.e., similar to EPIC 205718330), the required comet radius to produce 1% dips with 1 m grains is about 50 km. While perhaps common in very young planetary systems, objects of such size would not be expected to be common among older stars. On the other hand, tidally or thermally induced disruption of a 10 km size body into 100 m fragments, analogous to that occurring for Sun-grazing and Sun-skirting comets, would produce the required surface area. The potential clustering of the observed dipping events supports this scenario, although this disruption must happen very near periastron to explain the discrete appearance of the dips. The total mass of dust involved to produce the dips for the above case is in fact what would be expected for a 10-km radius comet.
Likewise, we can approximate the infrared flux as that coming from dust expelled over the time of periastron approach as emission (e.g., blackbody) with corresponding equilibrium temperature at periastron. Since within , we can approximate this close-approach time using Equation 3 as:
| (10) |
| (11) |
The infrared excess as a fraction of the stellar photosphere emission is then:
| (12) |
Even for very hot (1000 K), large ( m) dust grains that emit efficiently, the expected 4.6 m excess is %. This is similar in magnitude to the errors in the WISE photometry (Table 2), and the infrared signature of a single such object would have gone undetected. Moreover, the epoch of WISE observations is not the same as K2 and the time scale for the dust to be produced and blown away from the star is very short compared to the elapsed time between the two sets of observations.
Additionally, the differences in the depths and durations of the dipping events for EPIC 205718330 and EPIC 235240266 are consistent with objects disintegrating at a common stellar irradiance. The depths of the dips for EPIC 205718330 are 1% while those for EPIC 235240266 are 0.1%; the ratio of these dip depths is consistent with the square of the ratio of their stellar radii, which is at least 5. Moreover, the dips for EPIC 235240266 last roughly 1 day while those for EPIC 205718330 are roughly 0.5 days, consistent with the approximation that the difference in duration for a comet disintegrating at a certain irradiance will scale as where thus . In other words, the dipping events seen in EPIC 205718330 and EPIC 235240266 are consistent with similar objects disintegrating at an irradiance corresponding to distances at which Sun-grazing comets are observed to break up. At least some Sun-grazing and Sun-skirting comets are believed to have evolved onto their close-approaching orbits via a Kozai resonance interaction with the Sun and Jupiter (Jones et al., 2018). Thus it is reasonable to speculate that, if these little dippers are indeed star-grazing exocomets, they indicate the existence of a massive exoplanet that does not transit but might be revealed by long-term radial velocity monitoring.
5 CONCLUSION
We presented two systems, EPIC 205718330 and EPIC 235240266, which based on a visual survey of the K2 dataset appear to represent a class of objects that are rare—either intrinsically or due to the limited sensitivity and time baseline of K2 observations. The light curves of these stars contain episodic drops in flux with profile shapes and durations similar to those of the young “dipper" stars (i.e., a mixture of symmetric and asymmetric dips lasting 0.5–1.0 days), yet with depths 1–2 orders of magnitude shallower (i.e., 0.1–1.0% in flux). We conducted ground-based follow-up of these “little dippers" to derive their stellar parameters and place constraints on the possible mechanisms causing the dimming events.
We first vetted the K2 data of EPIC 205718330 and EPIC 235240266 for instrumental and/or data processing artifacts that could be causing the dimming events. We tested different parameters for K2SFF de-trending, ruled out contamination from “rolling bands" and nearby bright stars, and checked for evidence of CCD “cross-talk." Based on these tests, we concluded that the dipping events were both astrophysical and associated with the target sources.
Our follow-up observations and analysis showed that these stars are clearly not young. Their lack of detectable infrared emission in excess of the stellar photosphere precludes protoplanetary disks, though cannot rule out debris disks due to the limited WISE photometric precision. The lack of Li I absorption also puts limits on their age of Myr and Myr for EPIC 205718330 and EPIC 235240266, respectively. Finally, their galactic space motions are inconsistent with the typical values for young disk stars, signaling that they are kinematically old. Follow-up spectra indicate that EPIC 205718330 and EPIC 235240266 are likely early-K and late-F type dwarfs, respectively, though EPIC 235240266 could be a K-type subgiant.
Given these constraints, we explored two mechanisms for explaining the dimming events: dust-enshrouded remnants of planet formation and star-grazing exocomets. We argued that these little dippers are consistent with transits of star-grazing exocomets due to: (1) the shape and depth of the dipping events being consistent with a disrupted comet-sized object transiting while at a periastron distance very similar to those of Sun-grazing comets seen in our own Solar System, and (2) the differences in the depths and durations of the dipping events for EPIC 205718330 and EPIC 235240266 being consistent with similar objects disintegrating at a common stellar irradiance. We speculated that this could indicate the existence of massive non-transiting exoplanets driving the close-approach orbits.
One question is why we do not see more of these exocomet-related events in the Kepler and K2 datasets. Rappaport et al. (2018) suggested that the rarity of the exocomets in the Kepler dataset could be due to our current photometric precision being only sufficient to detect the largest (and rarest) exocomets with the transit method; smaller exocomet systems, perhaps more typical around the older Kepler stars, could still exist but go undetected. However, one might then expect that larger exocomet bodies would be more common in the younger (10–100 Myr) systems surveyed by K2. It is therefore possible that such large exocomets are inherently rare, even in young systems. Another possibility is that, if these really are star-grazing exocomets driven by massive perturbing outer planets, then the low occurrence of gas giants seen in the exoplanet population, combined with the low probability of observing transits of objects on highly eccentric orbits, could explain the rarity of the little dippers. Additional exocomet-like systems could be found by the recently launched Transiting Exoplanet Survey Satellite (TESS; Ricker et al., 2015); building up a larger sample and identifying common properties or trends will be important for understanding these objects.
Acknowledgements
MA acknowledges support from the Center for Integrative Planetary Science at the University of California at Berkeley as well as grants NSF AST-1518332, NASA NNX15AC89G and NNX15AD95G/NEXSS. CFM is supported by an ESO Fellowship. GMK is supported by the Royal Society as a Royal Society University Research Fellow. AV’s work was performed under contract with the California Institute of Technology/Jet Propulsion Laboratory funded by NASA through the Sagan Fellowship Program executed by the NASA Exoplanet Science Institute. This work is based on observations collected at the European Organisation for Astronomical Research in the Southern Hemisphere under ESO programme 0101.C-0866. This work has made use of data from the European Space Agency (ESA) mission Gaia (https://www.cosmos.esa.int/gaia), processed by the Gaia Data Processing and Analysis Consortium (DPAC, https://www.cosmos.esa.int/web/gaia/dpac/consortium). Funding for the DPAC has been provided by national institutions, in particular the institutions participating in the Gaia Multilateral Agreement. We made use of the following Python packages: Astropy (Astropy Collaboration et al., 2013), a community-developed core Python package for Astronomy, and Matplotlib (Hunter, 2007), a plotting package used to construct the figures in this paper. This work benefited from NASA’s Nexus for Exoplanet System Science (NExSS) research coordination network sponsored by NASA’s Science Mission Directorate. We are grateful to Tae-Soo Pyo and Akihiko Fukui for their support with IRCS observations and data reduction. This work was supported by JSPS KAKENHI Grant Number JP16K17660. TJ and DL acknowledge developer Allan R. Schmitt for making his lightcurve examining software LcTools freely available.
References
- Alcalá et al. (2014) Alcalá J. M., et al., 2014, A&A, 561, A2
- Alcalá et al. (2017) Alcalá J. M., et al., 2017, A&A, 600, A20
- Aldering et al. (2002) Aldering G., et al., 2002, in Tyson J. A., Wolff S., eds, Proc. SPIEVol. 4836, Survey and Other Telescope Technologies and Discoveries. pp 61–72, doi:10.1117/12.458107
- Alencar et al. (2010) Alencar S. H. P., et al., 2010, A&A, 519, A88
- Allard et al. (2011) Allard F., Homeier D., Freytag B., 2011, in Johns-Krull C., Browning M. K., West A. A., eds, Astronomical Society of the Pacific Conference Series Vol. 448, 16th Cambridge Workshop on Cool Stars, Stellar Systems, and the Sun. p. 91 (arXiv:1011.5405)
- Ansdell et al. (2016a) Ansdell M., Gaidos E., Williams J. P., Kennedy G., Wyatt M. C., LaCourse D. M., Jacobs T. L., Mann A. W., 2016a, MNRAS, 462, L101
- Ansdell et al. (2016b) Ansdell M., et al., 2016b, ApJ, 816, 69
- Astropy Collaboration et al. (2013) Astropy Collaboration et al., 2013, A&A, 558, A33
- Batalha et al. (2013) Batalha N. M., et al., 2013, ApJS, 204, 24
- Bodman et al. (2017) Bodman E. H. L., et al., 2017, MNRAS, 470, 202
- Bodman et al. (2018) Bodman E., Wright J., Boyajian T., Ellis T., 2018, preprint, (arXiv:1806.08842)
- Borucki (2016) Borucki W. J., 2016, Reports on Progress in Physics, 79, 036901
- Bouvier et al. (1999) Bouvier J., et al., 1999, A&A, 349, 619
- Bouvier et al. (2018) Bouvier J., et al., 2018, A&A, 613, A63
- Bouy & Martín (2009) Bouy H., Martín E. L., 2009, A&A, 504, 981
- Boyajian et al. (2016) Boyajian T. S., et al., 2016, MNRAS, 457, 3988
- Brown et al. (2013) Brown T. M., et al., 2013, PASP, 125, 1031
- Brueckner et al. (1995) Brueckner G. E., et al., 1995, Sol. Phys., 162, 357
- Cardelli et al. (1989) Cardelli J. A., Clayton G. C., Mathis J. S., 1989, ApJ, 345, 245
- Cody & Hillenbrand (2018) Cody A. M., Hillenbrand L. A., 2018, preprint, (arXiv:1802.06409)
- Cody et al. (2014) Cody A. M., et al., 2014, AJ, 147, 82
- Crossfield et al. (2016) Crossfield I. J. M., et al., 2016, ApJS, 226, 7
- Cummings et al. (2017) Cummings J. D., Deliyannis C. P., Maderak R. M., Steinhauer A., 2017, AJ, 153, 128
- Cushing et al. (2004) Cushing M. C., Vacca W. D., Rayner J. T., 2004, PASP, 116, 362
- DENIS Consortium (2005) DENIS Consortium 2005, VizieR Online Data Catalog, 2263
- Dahm et al. (2012) Dahm S. E., Slesnick C. L., White R. J., 2012, ApJ, 745, 56
- DeVore et al. (2016) DeVore J., Rappaport S., Sanchis-Ojeda R., Hoffman K., Rowe J., 2016, MNRAS, 461, 2453
- Dotter (2016) Dotter A., 2016, ApJS, 222, 8
- Edwards et al. (2006) Edwards S., Fischer W., Hillenbrand L., Kwan J., 2006, ApJ, 646, 319
- Frasca et al. (2017) Frasca A., Biazzo K., Alcalá J. M., Manara C. F., Stelzer B., Covino E., Antoniucci S., 2017, A&A, 602, A33
- Gagné et al. (2018) Gagné J., et al., 2018, ApJ, 856, 23
- Gaia Collaboration et al. (2018) Gaia Collaboration Brown A. G. A., Vallenari A., Prusti T., de Bruijne J. H. J., Babusiaux C., Bailer-Jones C. A. L., 2018, preprint, (arXiv:1804.09365)
- Gaidos et al. (2016) Gaidos E., Mann A. W., Kraus A. L., Ireland M., 2016, MNRAS, 457, 2877
- Hayano et al. (2010) Hayano Y., et al., 2010, in Adaptive Optics Systems II. p. 77360N, doi:10.1117/12.857567
- Hedges et al. (2018) Hedges C., Hodgkin S., Kennedy G., 2018, MNRAS, 476, 2968
- Henden et al. (2016) Henden A. A., Templeton M., Terrell D., Smith T. C., Levine S., Welch D., 2016, VizieR Online Data Catalog, 2336
- Heng & Tremaine (2010) Heng K., Tremaine S., 2010, MNRAS, 401, 867
- Hirano et al. (2016) Hirano T., et al., 2016, ApJ, 820, 41
- Howell et al. (2014) Howell S. B., et al., 2014, PASP, 126, 398
- Hughes et al. (2018) Hughes A. M., Duchene G., Matthews B., 2018, preprint, (arXiv:1802.04313)
- Hunter (2007) Hunter J. D., 2007, Computing In Science & Engineering, 9, 90
- Husser et al. (2013) Husser T.-O., Wende-von Berg S., Dreizler S., Homeier D., Reiners A., Barman T., Hauschildt P. H., 2013, A&A, 553, A6
- Jackson & Wyatt (2012) Jackson A. P., Wyatt M. C., 2012, MNRAS, 425, 657
- Jones et al. (2018) Jones G. H., et al., 2018, Space Sci. Rev., 214, 20
- Katz (2017) Katz J. I., 2017, MNRAS, 471, 3680
- Kenyon & Bromley (2005) Kenyon S. J., Bromley B. C., 2005, AJ, 130, 269
- Kipping et al. (2015) Kipping D. M., Schmitt A. R., Huang X., Torres G., Nesvorný D., Buchhave L. A., Hartman J., Bakos G. Á., 2015, ApJ, 813, 14
- Knight et al. (2010) Knight M. M., A’Hearn M. F., Biesecker D. A., Faury G., Hamilton D. P., Lamy P., Llebaria A., 2010, AJ, 139, 926
- Kobayashi et al. (2000) Kobayashi N., et al., 2000, in Iye M., Moorwood A. F., eds, Proc. SPIEVol. 4008, Optical and IR Telescope Instrumentation and Detectors. pp 1056–1066, doi:10.1117/12.395423
- Kochanek et al. (2017) Kochanek C. S., et al., 2017, PASP, 129, 104502
- Lantz et al. (2004) Lantz B., et al., 2004, in Mazuray L., Rogers P. J., Wartmann R., eds, Proc. SPIEVol. 5249, Optical Design and Engineering. pp 146–155, doi:10.1117/12.512493
- Lecavelier Des Etangs (1999) Lecavelier Des Etangs A., 1999, A&AS, 140, 15
- Lecavelier Des Etangs et al. (1999) Lecavelier Des Etangs A., Vidal-Madjar A., Ferlet R., 1999, A&A, 343, 916
- Leggett (1992) Leggett S. K., 1992, ApJS, 82, 351
- Lépine et al. (2013) Lépine S., Hilton E. J., Mann A. W., Wilde M., Rojas-Ayala B., Cruz K. L., Gaidos E., 2013, AJ, 145, 102
- Levine (2017) Levine S., 2017, Journal of the American Association of Variable Star Observers (JAAVSO), 45, 127
- Luhman & Mamajek (2012) Luhman K. L., Mamajek E. E., 2012, ApJ, 758, 31
- Manara et al. (2017) Manara C. F., Frasca A., Alcalá J. M., Natta A., Stelzer B., Testi L., 2017, A&A, 605, A86
- Mann & von Braun (2015) Mann A. W., von Braun K., 2015, PASP, 127, 102
- Mann et al. (2012) Mann A. W., Gaidos E., Lépine S., Hilton E. J., 2012, ApJ, 753, 90
- Mann et al. (2013) Mann A. W., Gaidos E., Ansdell M., 2013, ApJ, 779, 188
- Mann et al. (2017) Mann A. W., et al., 2017, AJ, 153, 64
- Modigliani et al. (2010) Modigliani A., et al., 2010, in Observatory Operations: Strategies, Processes, and Systems III. p. 773728, doi:10.1117/12.857211
- Montet et al. (2015) Montet B. T., et al., 2015, ApJ, 809, 25
- Morales-Calderón et al. (2011) Morales-Calderón M., et al., 2011, ApJ, 733, 50
- Morton (2015) Morton T. D., 2015, isochrones: Stellar model grid package, Astrophysics Source Code Library (ascl:1503.010)
- Morton et al. (2016) Morton T. D., Bryson S. T., Coughlin J. L., Rowe J. F., Ravichandran G., Petigura E. A., Haas M. R., Batalha N. M., 2016, ApJ, 822, 86
- Pecaut & Mamajek (2013) Pecaut M. J., Mamajek E. E., 2013, ApJS, 208, 9
- Rappaport et al. (2018) Rappaport S., et al., 2018, MNRAS, 474, 1453
- Rayner et al. (2003) Rayner J. T., Toomey D. W., Onaka P. M., Denault A. J., Stahlberger W. E., Vacca W. D., Cushing M. C., Wang S., 2003, PASP, 115, 362
- Ricker et al. (2015) Ricker G. R., et al., 2015, Journal of Astronomical Telescopes, Instruments, and Systems, 1, 014003
- Rieder & Kenworthy (2016) Rieder S., Kenworthy M. A., 2016, A&A, 596, A9
- Rodriguez et al. (2017) Rodriguez J. E., et al., 2017, ApJ, 836, 209
- Sanchis-Ojeda et al. (2015) Sanchis-Ojeda R., et al., 2015, ApJ, 812, 112
- Scaringi et al. (2016) Scaringi S., et al., 2016, MNRAS, 463, 2265
- Schlafly & Finkbeiner (2011) Schlafly E. F., Finkbeiner D. P., 2011, ApJ, 737, 103
- Schlegel et al. (1998) Schlegel D. J., Finkbeiner D. P., Davis M., 1998, ApJ, 500, 525
- Schneider et al. (2018) Schneider P. C., Manara C. F., Facchini S., Günther H. M., Herczeg G. J., Fedele D., Teixeira P. S., 2018, A&A, 614, A108
- Shappee et al. (2014) Shappee B. J., et al., 2014, ApJ, 788, 48
- Skrutskie et al. (2006) Skrutskie M. F., et al., 2006, AJ, 131, 1163
- Stauffer et al. (2017) Stauffer J., et al., 2017, AJ, 153, 152
- Vacca et al. (2003) Vacca W. D., Cushing M. C., Rayner J. T., 2003, PASP, 115, 389
- Vanderburg & Johnson (2014) Vanderburg A., Johnson J. A., 2014, PASP, 126, 948
- Vanderburg et al. (2015) Vanderburg A., et al., 2015, Nature, 526, 546
- Vanderburg et al. (2016) Vanderburg A., et al., 2016, ApJS, 222, 14
- Vernet et al. (2011) Vernet J., et al., 2011, A&A, 536, A105
- Wizinowich et al. (2000) Wizinowich P., et al., 2000, PASP, 112, 315
- Wright et al. (2010) Wright E. L., et al., 2010, AJ, 140, 1868
- Wyatt (2008) Wyatt M. C., 2008, ARA&A, 46, 339
- Wyatt et al. (2018) Wyatt M. C., van Lieshout R., Kennedy G. M., Boyajian T. S., 2018, MNRAS, 473, 5286
- da Silva et al. (2009) da Silva L., Torres C. A. O., de La Reza R., Quast G. R., Melo C. H. F., Sterzik M. F., 2009, A&A, 508, 833
- de Zeeuw et al. (1999) de Zeeuw P. T., Hoogerwerf R., de Bruijne J. H. J., Brown A. G. A., Blaauw A., 1999, AJ, 117, 354
- van Dam et al. (2004) van Dam M. A., Le Mignant D., Macintosh B. A., 2004, Appl. Opt., 43, 5458
- van Lieshout & Rappaport (2017) van Lieshout R., Rappaport S., 2017, Disintegrating Rocky Exoplanets. Springer International Publishing, p. 15, doi:10.1007/978-3-319-30648-3_15-2