Evidence of Particle Acceleration in the Superbubble 30 Doradus C with NuSTAR
Abstract
We present evidence of diffuse, non-thermal X-ray emission from the superbubble 30 Doradus C (30 Dor C) using hard X-ray images and spectra from NuSTAR observations. For this analysis, we utilize data from a 200 ks targeted observation of 30 Dor C as well as 2.8 Ms of serendipitous off-axis observations from the monitoring of nearby SN 1987A. The complete shell of 30 Dor C is detected up to 20 keV, and the young supernova remnant MCSNR J05366913 in the southeast of 30 Dor C is not detected above 8 keV. Additionally, six point sources identified in previous Chandra and XMM-Newton investigations have hard X-ray emission coincident with their locations. Joint spectral fits to the NuSTAR and XMM-Newton spectra across the 30 Dor C shell confirm the non-thermal nature of the diffuse emission. Given the best-fit rolloff frequencies of the X-ray spectra, we find maximum electron energies of TeV (assuming a B-field strength of 4G), suggesting 30 Dor C is accelerating particles. Particles are either accelerated via diffusive shock acceleration at locations where the shocks have not stalled behind the H shell, or cosmic-rays are accelerated through repeated acceleration of low-energy particles via turbulence and magnetohydrodynamic waves in the bubble’s interior.
1 Introduction
OB associations typically have tens of massive stars, and the collective effect of their fast stellar winds and supernovae (SNe) create superbubbles (SBs; e.g., Mac Low & McCray 1988; Oey 1996; Yadav et al. 2017). SBs are large (100 pc) shell-like structures that sweep up material from the surrounding interstellar medium (ISM), producing tenuous cavities filled with hot (106 K), shock-heated gas (e.g., Castor et al. 1975; Weaver et al. 1977; Chu & Mac Low 1990; Rogers & Pittard 2014). Due to the low densities within these bubbles ( cm-3), shock waves travel large distances before substantial deceleration, and thus the timescale of efficient particle acceleration is longer than in the case of individual/isolated supernova remnants (SNRs). Since SBs also have large energy reservoirs, SBs are plausible candidates for sites of cosmic-ray acceleration (e.g., Bykov & Fleishman 1992; Parizot et al. 2004; Butt & Bykov 2008; Ferrand & Marcowith 2010; Bykov 2014).
Observational evidence of particle acceleration in SBs is growing. GeV gamma-rays have been detected by the Fermi Gamma-ray Space Telescope toward some SBs (e.g., Abdo et al. 2010), and possible detection of non-thermal X-rays from SBs have been reported from multiple sources (e.g., 30 Doradus C: Bamba et al. 2004; N51D: Cooper et al. 2004; N11: Maddox et al. 2009; IC 131: Tüllmann et al. 2009; see also the recent review by Kavanagh 2020). However, in some cases, follow-up work failed to find diffuse non-thermal X-rays in these sources, suggesting that the previous findings may be due to inadequate background subtraction or unresolved point sources (e.g., Yamaguchi et al. 2010). Consequently, the detection of diffuse, non-thermal X-rays in SBs remains controversial, and additional observational constraints are necessary to elucidate the role of SBs in the particle acceleration process.
In this paper, we present hard (3 keV) X-ray images and spectra from NuSTAR observations of the superbubble 30 Doradus C (hereafter, 30 Dor C) in the Large Magellanic Cloud (LMC). 30 Dor C is a 95 pc across SB (Dunne et al., 2001) powered by the OB star association LH 90 (Lucke & Hodge, 1970), with 26 O stars and 7 Wolf-Rayet (WR) stars with ages of 3–7 Myr (Testor et al., 1993).
30 Dor C was first detected in X-rays by the Einstein Observatory (Long et al., 1981), and ROSAT observations resolved the shell-like structure (Dunne et al., 2001). XMM-Newton observed 30 Dor C as its first light image in January 2000 (Dennerl et al., 2001), revealing hard X-ray emission up to 5 keV. Subsequently, Bamba et al. (2004) searched for synchrotron emission in archival Chandra and XMM-Newton data and found that the southeast of 30 Dor C has enhanced thermal and line emission, while the emission from the rest of the shell likely arises from non-thermal processes. The spectra in the latter locations were adequately fit by a synchrotron model of an exponentially cut off power-law distribution of electrons (Reynolds, 1998). Yamaguchi et al. (2009) confirmed the Bamba et al. (2004) results using Suzaku data, and Kavanagh et al. (2015) revisited the XMM-Newton data and presented evidence for a young SNR, MCSNR J05366913, in the southeast of 30 Dor C based on enhanced abundances of intermediate-mass elements there. Babazaki et al. (2018) considered the XMM-Newton data and found that all locations in 30 Dor C have non-thermal X-ray emission, consistent with the previous results of Bamba et al. (2004) and Kavanagh et al. (2015). Sano et al. (2017) demonstrated that non-thermal X-rays were particularly enhanced in the western shell of 30 Dor C where they detected several molecular clouds; these authors interpreted the result as evidence that magnetic-field amplification resulted from shock-cloud interaction there.
The High Energy Stereoscopic System (HESS) detection of 30 Dor C in TeV gamma-rays is additional evidence of particle acceleration (H.E.S.S. Collaboration et al., 2015). Recently, Kavanagh et al. (2019) exploited new Chandra observations of 30 Dor C to estimate the B-field in the post-shock region using radial profiles around the synchrotron-dominated shell. They found that the filament widths indicated a G, which is consistent with a leptonic origin of the TeV emission. Kavanagh et al. (2019) also showed an anti-correlation between the H and X-ray synchrotron emission in 30 Dor C, as has been observed in several SNRs (e.g., RCW 86: Yamaguchi et al. 2016). They measured an expansion velocity of the H shell as 100 km s-1, yet shock velocities of 1000 km s-1 are necessary to produce the observed X-ray synchrotron emission (Bell, 2004). They interpreted this result as evidence that the non-thermal X-rays originate from locations where the shock continues to expand rapidly in the gaps of the H shell, while the shock has slowed elsewhere when it encountered that shell.
NuSTAR, the first satellite to focus hard X-rays at energies 3–79 keV (Harrison et al., 2013), has observed 30 Dor C serendipitously fifteen times during its extensive monitoring of SN 1987A 5′ away (Boggs et al., 2015). Additionally, we obtained two targeted observations of 30 Dor C totaling 203 ks in late 2015 as part of the guest observer program. The primary scientific objective of our work was to detect and localize hard X-rays from 30 Dor C and to characterize particle acceleration properties using spectroscopic analysis.
The paper is organized as follows. In Section 2, we outline the NuSTAR observations and data of 30 Dor C as well as complementary X-ray data from XMM-Newton and Chandra. In Section 3, we present the results, including the hard X-ray images of 30 Dor C (in Section 3.1) as well as spatially-resolved spectral modeling of the shell (in Section 3.2). In Section 4, we discuss the implications regarding SBs and their particle acceleration processes, and in Section 5, we summarize our conclusions.
| # | ObsID | Exposure | UT Start Date | Off-Axis AnglebbOff-axis angle from the aimpoint to position of 30 Dor C in the Simbad database (Wenger et al., 2000), taken from Filipovic et al. (1995). |
|---|---|---|---|---|
| 1 | 40001014002 | 68 ks | 2012-09-07 | 3.4′ |
| 2 | 40001014003 | 136 ks | 2012-09-08 | 1.9′ |
| 3 | 40001014004 | 199 ks | 2012-09-11 | 2.4′ |
| 4 | 40001014006 | 54 ks | 2012-10-20 | 3.5′ |
| 5 | 40001014007 | 200 ks | 2012-10-21 | 4.0′ |
| 6 | 40001014009 | 28 ks | 2012-12-12 | 5.3′ |
| 7 | 40001014010 | 186 ks | 2012-12-12 | 3.1′ |
| 8 | 40001014012 | 19 ks | 2013-06-28 | 3.1′ |
| 9 | 40001014013 | 473 ks | 2013-06-29 | 3.7′ |
| 10 | 40001014015 | 97 ks | 2014-04-21 | 4.2′ |
| 11 | 40001014016 | 432 ks | 2014-04-22 | 5.4′ |
| 12 | 40001014018 | 200 ks | 2014-06-15 | 4.4′ |
| 13 | 40001014020 | 275 ks | 2014-06-19 | 4.0′ |
| 14 | 40001014022 | 48 ks | 2014-08-01 | 2.4′ |
| 15 | 40001014023 | 427 ks | 2014-08-01 | 2.9′ |
| 16aaObservations #16 and #17 are the targeted observations of 30 Dor C. | 40101015002 | 167 ks | 2015-09-03 | 1.3′ |
| 17aaObservations #16 and #17 are the targeted observations of 30 Dor C. | 40101015004 | 26 ks | 2015-10-18 | 0.4′ |
2 Observations and Data Analysis
2.1 NuSTAR Data
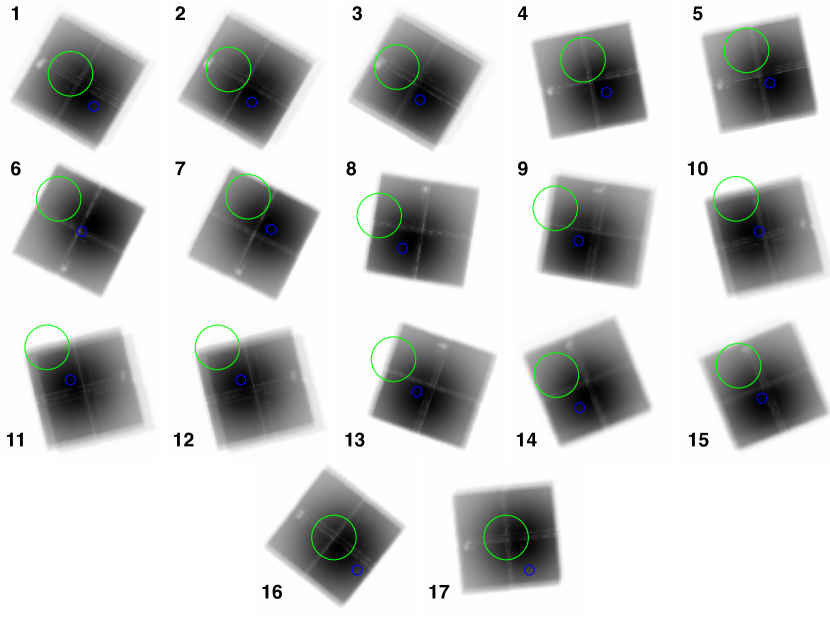
As mentioned above, 30 Dor C has been observed by NuSTAR seventeen times: two targeted observations in September and October 2015 as well as fifteen observations during monitoring of SN 1987A. Details of the seventeen observations are outlined in Table 1, and Figure 1 shows the positions on the detectors of the 30 Dor C shell and SN 1987A in each observation.
We reduced the data using the NuSTAR Data Analysis Software (NuSTARDAS) Version 1.8.0 and NuSTAR CALDB Version 20170817. We performed the standard pipeline data processing with nupipeline, with the saamode=STRICT to identify the South Atlantic Anomaly (SAA) passages. Using the resulting cleaned event files, we produced images of different energy bands using the FTOOL xselect and generated associated exposure maps using nuexpomap with vignetting correction at 10 keV. As 30 Dor C is an extended source, we opted to model the background and produce synthetic, energy-dependent background images for background subtraction. We followed the procedure outlined by Wik et al. (2014) to estimate background components and their spatial distribution. Subsequently, we combined the vignetting- and exposure-corrected FPMA and FPMB images from all epochs using ximage.
The combined images were deconvolved by the on-axis NuSTAR point-spread function (PSF) using the max_likelihood AstroLib IDL routine111See https://github.com/wlandsman/IDLAstro. The script employs Lucy-Richardson deconvolution, an iterative procedure to derive the maximum likelihood solution. We set the maximum number of iterations to 20, as more iterations did not lead to any significant changes in the resulting images. We note that this routine assumes that the data can be characterized by a Poisson distribution, but background subtraction causes the images not to follow strictly a Poisson distribution. Thus, the deconvolved images are presented for qualitative purposes only, and we do not use them for any quantitative results.
We performed a spatially-resolved spectroscopic analysis by extracting and modeling spectra from several locations in 30 Dor C. Using the nuproducts FTOOL, we extracted source spectra and produced ancillary response files (ARFs) and redistribution matrix files (RMFs) from each observation and both the A and B modules (17 ObsIDs 2 modules 34 spectra per region). We employed the nuskybgd routines222https://github.com/NuSTAR/nuskybgd (presented in detail in Wik et al. 2014) to simulate associated background spectra.
The FPMB data had substantial stray-light contamination to the north and southwest of 30 Dor C from three sources within 5∘ of the object: LMC X–1 (0.629∘ away), 2MASX J050524426734358 (3.252∘ away), and IGR J050077047 (3.39∘ away). Thus, the area available for background regions was limited to the east and northwest in the FPMB data, while annuli around 30 Dor C could be employed as background regions for the FPMA data. Consequently, the background subtraction in the FPMA data is more reliable as it samples and adequately accounts for the spatial variation of the background across the source.
2.2 XMM-Newton Data
To supplement the NuSTAR data, we also downloaded eleven 30 Dor C observations from the XMM-Newton Science Archive. Ten of these observations from 2000–2012 were presented in Kavanagh et al. (2015), and the eleventh observation (ObsID 0743790101) was obtained after the submission of that work. We employed the XMM-Newton Science Analysis System (SAS) Version 15.0.0 and up-to-date calibration files to reduce and analyze this data. All event files were filtered to remove flagged events and periods of high background or photon flare contamination, as identified based on count-rate histograms of the 10 keV band. The effective exposure times of the MOS1, MOS2, and pn detectors in the ObsID 0743790101 observation was 77.2 ks, 77.3 ks, and 66.6 ks, respectively. Thus, the net exposures, when combined with the observations analyzed in Kavanagh et al. (2015), were 633 ks for MOS1, 692 ks for MOS2, and 487 ks for the pn detector.
XMM-Newton spectra were extracted using the SAS command evselect on the cleaned, vignetting-corrected event files from the three EPIC cameras. For each region, we produced ARFs and RMFs using the tasks arfgen and rmfgen, and each spectrum was grouped to a minimum of 25 counts per bin. Given that the XMM-Newton observations spanned 12 years, we opted not to combine the spectra and instead fit the spectra simultaneously.
Given that 30 Dor C is an extended object and that the background of XMM-Newton varies across the detectors, we opted to model the background rather than subtract it in our spatially-resolved spectroscopic analysis. We extracted background spectra from a circular, 0.85′ radius region northwest of 30 Dor C, and we modeled the instrumental and astrophysical X-ray background (AXB) contributions similarly to Maggi et al. (2016) who analyzed XMM-Newton observations of 51 LMC SNRs. The former components account for the particle-induced background and the soft-proton contamination (see Appendix A of Maggi et al. 2016), and the latter reflect the emission from the Local Hot Bubble, the Galactic halo, and unresolved background active galactic nuclei (AGN; Snowden et al. 2008). We included these best-fit background components in our models of each XMM-Newton spectrum from 30 Dor C to assess accurately the emission from the source regions.
2.3 Chandra Data
To aid in the identification of point sources, we analyzed the available Chandra data on 30 Dor C to localize the regions of bright NuSTAR emission. Chandra’s Advanced CCD Imaging Spectrometer (ACIS) has imaged SN 1987A repeatedly, and several of those programs included serendipitous coverage of 30 Dor C. Using the Chandra archive, we identified nine archival ACIS observations with partial coverage of 30 Dor C (ObsIDs 1044, 1967, 2831, 2832, 3829, 3830, 4614, 17904, 19925). In addition, 30 Dor C was observed in December 2018 (ObsIDs 20339, 21949, 22006; PI: Lopez) for 91 ks and will be presented in detail in future work. We have reprocessed all of the archival and new observations and produced composite, exposure-corrected image of the broad-band (0.5–7.0 keV) using the flux_image command in the Chandra Interactive Analysis of Obserations (ciao) software Version 4.7.
3 Results
3.1 Images
3.1.1 Diffuse Emission
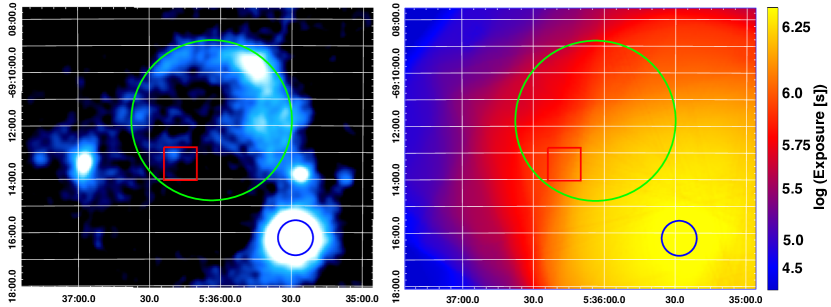
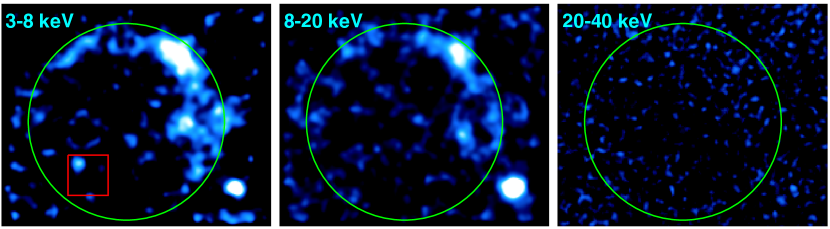
Figure 2 shows the background-subtracted keV image of 30 Dor C and the nearby sources, including SN 1987A, and Figure 3 presents the deconvolved, background-subtracted NuSTAR images of the 30 Dor C shell in several energy bands. To produce these images, we have merged the eight NuSTAR observations (observations labeled #1–5, 14, 16–17 in Figure 1) that cover the full extent of the 30 Dor C shell. NuSTAR detects the entire rim of 30 Dor C studied previously in X-rays with Chandra, XMM-Newton, and Suzaku. The brightest emission is in the northwest, where the non-thermal X-rays are detected up to 20 keV. No emission from any region of 30 Dor C is detected with significance above 20 keV. In the southeast, we find hard X-rays up to 8 keV where Kavanagh et al. (2015) identified a young SNR dubbed MCSNR J05366913, based on enhanced abundances of intermediate-mass elements there.
| Source | CXO GSGaaIdentifications from the Chandra ACIS GSG Point-Like X-ray Source Catalog (Wang et al., 2016). For the point sources and , the identifications are from Bamba et al. (2004). | 3XMMbbIdentifications from the 3XMM DR6 version of the XMM-Newton Serendipitous Source Catalog (Rosen et al., 2016). Point sources and do not have a coincident detection reported in any XMM-Newton catalogs. | ccAbsorption-corrected X-ray flux in the 0.3–8.0 keV band from Chandra, as reported by Wang et al. (2016) for , , , and . They assumed Galactic absorption only and fit the spectrum with a power-law of index = 1.7. Absorption-corrected fluxes for sources and have been computed for the 0.3–8.0 keV band using the spectral fit results reported in Table 2 of Bamba et al. (2004). | ddX-ray luminosity assuming the object is in the LMC at a distance of 50 kpc (Pietrzyński et al., 2019). Note that Sources and may be AGN, so their distances may be much larger and luminosities much greater. | Likely |
|---|---|---|---|---|---|
| (erg cm-2 s-1) | (erg s-1) | Associations | |||
| J053525.7691347 | J053525.9691348 | 8.2510-15 | 3.841033 | Unknown | |
| J053542.4691152 | J053542.6691153 | 3.1710-14 | 9.721033 | Massive Star | |
| J053542.9691206 | – | 1.0310-14 | 5.101033 | AGN | |
| J053657.1691328 | J053657.2691329 | 4.7910-13 | 1.741035 | X-ray Binary | |
| J053633.3691140 | – | 2.7510-14 | 8.231033 | AGN | |
| J053620.7691303 | – | 1.1410-14 | 3.411033 | AGN or Stellar Remnant |
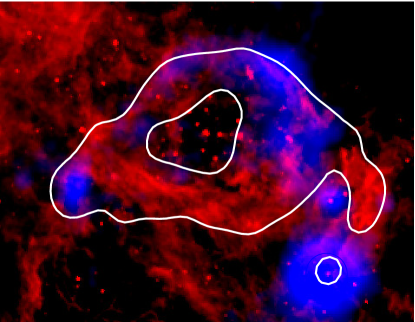
In Figure 4, we compare the keV background-subtracted NuSTAR image (in blue) with the 1.4 GHz radio morphology (in white contours; from Hughes et al. 2007) and the H emission (in red; from Smith & MCELS Team 1998). The complete shell of 30 Dor C is evident in the radio and had been reported at 843 MHz, 1.38 GHz, and 5.5 GHz frequencies previously by Mills et al. (1984), Kavanagh et al. (2015), and Kavanagh et al. (2019), respectively. The radio coincidence with the hard X-rays is consistent with a synchrotron origin of the NuSTAR-detected emission. The H image also shows a shell morphology, with a relatively narrow rim in the northwest, where 30 Dor C is bright in hard X-rays. Mathewson et al. (1985) and Kavanagh et al. (2015) found that the radio spectral index is flatter in the western part of 30 Dor C (with ), consistent with thermal radio emission and possibly due to contamination from a foreground molecular cloud. The eastern side has a steeper spectral index (with ) that these authors interpret as evidence of non-thermal radio emission there.
3.1.2 Point Sources
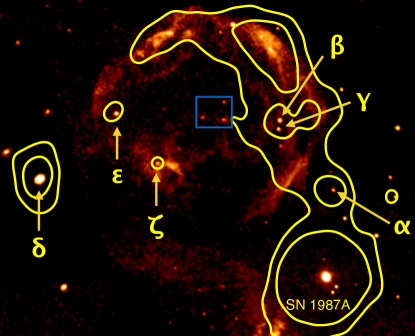
Multiple point sources are also apparent in the NuSTAR images. To aid in the identification of counterparts, we compared the NuSTAR keV morphology to the broad-band ( keV), exposure-corrected Chandra image of 30 Dor C, as shown in Figure 5. Six locations (marked , , , , , and in Figure 5) of bright NuSTAR emission coincide with point sources that are evident in the Chandra image. Four of these point sources (, , , and ) have been identified in X-ray catalogs (Evans et al., 2010; Rosen et al., 2016; Wang et al., 2016), and their names, fluxes, and luminosities (assuming the objects are in the LMC) are given in Table 2. Two additional Chandra point sources ( and ) are detected by NuSTAR that are not in Chandra or XMM-Newton catalogs, but Bamba et al. (2004) identified and characterized these objects in their study of 30 Dor C (CXOU J053633.3691140 and CXOU J3620.7691303, respectively, in their Table 2). We include properties of these sources in Table 2 as measured by Bamba et al. (2004). Unfortunately, count statistics were not sufficient to model the NuSTAR spectra from these sources, and we discuss their likely associations based on Chandra and multiwavelength data below (as listed in Table 2).
Source has no known counterparts at other wavelengths besides the Chandra point source. The closest point source listed in the Simbad astronomical database (Wenger et al., 2000) is a blue supergiant star (CPD–69 400) 9.4′′ away, much greater than the 0.5′′ point-spread function of Chandra, indicating that the soft X-rays originate from a different source. We note that Source is located at the center of an evacuated cavity in the H image (see Figure 4), suggesting that the hard X-ray emission may be associated with another massive star or diffuse gas that was shock-heated by stellar winds.
Source was studied by Bamba et al. (2004) who extracted Chandra X-ray spectra and showed that the data were best-fit by a collisional equilibrium thermal plasma model (specifically an absorbed mekal component with abundances of 0.3 solar). Based on its location and spectral properties, Bamba et al. (2004) concluded that Source is associated with Brey 58, a O3If∗/WN6 star (Massey et al., 2000; Neugent et al., 2012).
Another point source, , is 15′′ south of Source . Bamba et al. (2004) stated that no optical or infrared counterpart is coincident with , and they suggested it is a background AGN or X-ray binary based on its hard spectra.
Lin et al. (2012) classified Source as a candidate compact-object binary based on its hardness ratio and its X-ray-to-infrared flux ratio in the 2XMMi-DR3 catalog (where the object is identified as 2XMM J053657.1691328: Watson et al. 2009).
Source has no known counterparts at optical or infrared wavelengths, and it is not in any X-ray catalogs, although it is detected in both the Chandra and the XMM-Newton images (see Figure 7). Bamba et al. (2004) extracted Chandra spectra from Source and found the data to be best-fit by a power-law with a spectral index of =1.8 and concluded it is most likely a background AGN.
Source also has no known counterparts at optical or infrared wavelengths, and it is located on the periphery of SNR J05366913. Bamba et al. (2004) found Source to have a relatively hard spectrum, best-fit by a power-law with a spectral index . Based on these results, Bamba et al. (2004) suggest Source may be a background AGN or stellar remnant (e.g., a neutron star or black hole). The latter explanation is intriguing given Source ’s proximity to the young SNR. However, the velocity necessary for the object to travel from the SNR center to its current location333We assumed the position of Source as RA = 05h36m20.477s, Dec=69d13m02.70s, and we employed the SNR center of RA=05h36m17.0s, Dec=69d13m28.0s reported by Kavanagh et al. (2015). would be 1500–3400 km s-1 (for ages of 2.2–4.9 kyr), greater than velocities reported for the known pulsar population (Faucher-Giguère & Kaspi, 2006).
Three central point sources evident in the Chandra image (in the blue box in Figure 5) are not clearly detected in the NuSTAR observations (though some diffuse emission is detected in the west of this region). These sources (going clockwise) are associated with the WR star Brey 57 and massive star clusters identified by Lortet & Testor (1984) as and . The latter two sources were detected and analyzed by Bamba et al. 2004 (their sources #4 and 3, respectively) and found to have X-ray luminosities (in the 0.5–9 keV band) of erg s-1. Thus, these sources are fainter than those detected with NuSTAR and listed in Table 2.
3.2 Spectroscopy
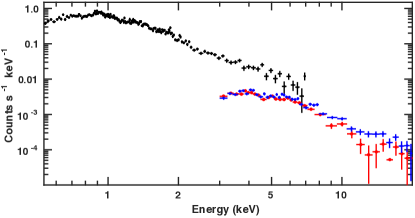
Figure 6 shows the background-subtracted XMM-Newton EPIC-pn and NuSTAR spectra from the entirety of 30 Dor C (including point sources and MCSNR J05366913). Spectra were extracted from the NuSTAR pointings that fully imaged 30 Dor C (those labeled #1–5, #14, #16–17 in Figure 1), and the data from each FPMA and FPMB observation were combined to produce one NuSTAR spectrum for each module. 30 Dor C was detected up to 20 keV, and the background dominates 20 keV.
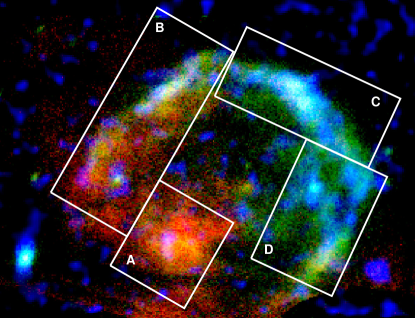
We also extracted XMM-Newton and NuSTAR spectra from three regions of 30 Dor C’s shell as well as one region enclosing the MCSNR J05366913; Figure 7 denotes these locations. In order to facilitate comparison to previous X-ray studies of 30 Dor C (specifically, Bamba et al. 2004; Yamaguchi et al. 2009; Kavanagh et al. 2015), we selected similar regions as those works.
We do not detect X-rays above 8 keV from MCSNR J05366913 with NuSTAR. Thus, we did not analyze the spectra from Region A further as the region has already been investigated with Chandra and XMM-Newton, and we cannot set any additional constraints with the NuSTAR data. Kavanagh et al. (2015) fit the XMM-Newton spectra from the SNR and showed that it was best described by a model with two thermal plasmas representing the contributions of ejecta and shock-heated ISM. They found enhanced abundances of intermediate-mass elements that suggested a core-collapse origin, and they estimated an age of 2.2–4.9 kyr for the SNR.
For the three other regions, we fit the XMM-Newton and NuSTAR spectra jointly over the 0.5–8.0 keV and 3–20 keV range, respectively, with an absorbed srcut model and adding an optically-thin thermal plasma (apec) component to test if it improved the fits. As discussed in Section 2.2, in the case of the XMM-Newton data, we modeled the background using the models of Maggi et al. (2016). For the source apec components, we froze the abundance to 0.5, representative of the LMC ISM (Russell & Dopita, 1992)444We note that adopting a vapec component with the individual elemental abundances of Maggi et al. (2016) yielded the same fit results as the apec models.. We fit the data from all instruments jointly by including a multiplicative factor (with the XSPEC component const) for each dataset that is allowed to vary while all other model parameters were required to be the same. We had two source absorption components: one to account for the Galactic absorption (with the XSPEC model phabs, assuming cross-sections from Verner et al. 1996 and the solar abundances of Wilms et al. 2000 to be consistent with Kavanagh et al. 2015), and another for the LMC’s intrinsic absorption (with the XSPEC model vphabs and adopting the LMC ISM abundances of Maggi et al. 2016)555We also performed the fits using the XSPEC absorption model tbabs, and the fit results were the same as with phabs..
The srcut model describes the source spectrum as the synchrotron emission from a power-law energy distribution of electrons with an exponential cutoff at energy (Reynolds & Keohane, 1999). This model falls off considerably more slowly than an exponential (roughly as ) where the rolloff frequency is the characteristic or critical synchrotron frequency of electrons with energy ( in the notation of Pacholczyk 1970). The rolloff photon energy is thus related to by
| (1) |
where is the magnetic field strength. In XSPEC, the srcut model has three parameters: the rolloff frequency , the mean radio-to-X-ray spectral index , and the 1 GHz radio flux density . To limit the free parameters in the fit, we estimated of each region by measuring the 1.4 GHz flux density at those locations in the Hughes et al. (2007) survey of the LMC with the Australia Telescope Compact Array (ATCA) and the Parkes Telescope (see the white contours in Figure 4). We assume a radio spectral index of to derive of each region, and the values are listed in Table 3. The radio spectral index of is an intermediate value between the radio spectral index of adopted by Bamba et al. (2004) and the best-fit spectral index of found by Kavanagh et al. (2015) in the northeastern part of 30 Dor C. However, the radio spectrum is actually concave, and may flatten at higher frequencies (Reynolds & Ellison, 1992). We have likely overestimated the flux density at 1 GHz arising from synchrotron radiation given that free-free emission also contributes at these wavelengths.
| Region | normbbNormalization of the apec component, defined as norm , where is the distance to the source in cm, and are the electron and hydrogen densities in cm-3, respectively, and is the volume. | /d.o.f. | ccTotal unabsorbed flux in the 0.5–20 keV band. | ddUnabsorbed flux from the srcut component in the 0.5–20 keV band. | ||||
|---|---|---|---|---|---|---|---|---|
| ( cm-2) | (keV) | () | ( Hz) | (Jy) | ( erg cm-2 s-1) | ( erg cm-2 s-1) | ||
| B | 0.90.1 | 0.860.01 | 8.8 | 4.0 | 0.66 | 12842/9643 | 1.9 | 1.50.5 |
| C | 8.0 | – | – | 3.2 | 0.43 | 9971/9297 | 1.90.3 | 1.90.3 |
| D | 2.40.1 | 0.86 | 7.2 | 8.4 | 0.72 | 12250/10112 | 1.80.4 | 1.60.4 |
| Region | normbbNormalization of the apec component, defined as norm , where is the distance to the source in cm, and are the electron and hydrogen densities in cm-3, respectively, and is the volume. | normPLccNormalization of the power-law component, in units of photons keV-1 cm-2 s-1 at 1 keV. | /d.o.f. | ddTotal unabsorbed flux in the 0.5–20 keV band. | eeUnabsorbed flux from the power-law component in the 0.5–20 keV band. | |||
|---|---|---|---|---|---|---|---|---|
| ( cm-2) | (keV) | () | () | ( erg cm-2 s-1) | ( erg cm-2 s-1) | |||
| B | 1.40.1 | 0.860.01 | 0.2ffDenotes parameters that are not constrained in the model, so no 90% confidence range is given. | 2.260.03 | 2.3ffDenotes parameters that are not constrained in the model, so no 90% confidence range is given. | 12819/9701 | 2.00.7 | 1.60.6 |
| C | 10.30.5 | – | – | 2.390.03 | 6.3ffDenotes parameters that are not constrained in the model, so no 90% confidence range is given. | 10036/9295 | 2.20.2 | 2.20.2 |
| D | 2.80.1 | 0.860.01 | 9.2ffDenotes parameters that are not constrained in the model, so no 90% confidence range is given. | 2.120.02 | 25ffDenotes parameters that are not constrained in the model, so no 90% confidence range is given. | 12410/10110 | 1.90.3 | 1.7 |
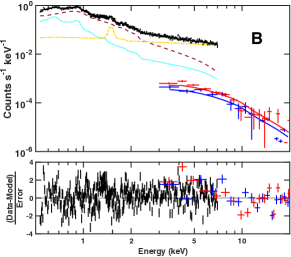
Figure 8 shows the spectra and best fits from each of the three 30 Dor C shell regions. Table 3 lists the results, including , , and the degrees of freedom (d.o.f.). Regions B, C, and D were inadequately fit by a single thermal component, producing /d.o.f. 3 in all cases. Region C was best fit with a single srcut component, with Hz and /d.o.f. = 9971/9297. We fit Regions B and D initially with a single srcut component, and we noted large residuals below 1 keV, though the fits were statistically acceptable, with /d.o.f.=12842/9643 for Region B and /d.o.f.=12250/10112 for Region D. The addition of an apec component to these models improved the fits, as listed in Table 3. If we instead adopted or in our analysis, the best-fit values of decreased or increased by 60%, respectively. However, fits with and yielded the same relative contribution of the non-thermal to thermal components in the 0.5–20 keV band in Regions B and D (82% and 90%, respectively).
Past X-ray studies of 30 Dor C have found differing results on the relative contribution of the thermal and non-thermal emission across the shell. Generally, previous investigations (Bamba et al., 2004; Yamaguchi et al., 2009; Kavanagh et al., 2015; Babazaki et al., 2018) agree that Region C only requires a single non-thermal component to adequately fit the X-ray spectra there. Additionally, all of these works except Bamba et al. (2004) found that Region B necessitates a thermal plasma component (in addition to the non-thermal component) to account for the residuals at soft X-ray energies. However, the estimates of the temperature of that thermal plasma in Region B differ: e.g., 0.2 keV (Babazaki et al., 2018), 0.3 keV (Kavanagh et al., 2015), 0.7 keV (Yamaguchi et al., 2009), and 0.860.01 keV in this work. Finally, our result that Region D requires a thermal component has not been found in prior studies that analyzed the X-ray spectra there (Bamba et al., 2004; Kavanagh et al., 2015; Babazaki et al., 2018). The disparate results likely arise from authors using slightly different spectral extraction regions as well as different XSPEC components to describe the non-thermal (i.e., srcut versus powerlaw) and the thermal (e.g., apec versus vapec, with variable abundances for intermediate-mass elements) contributions.
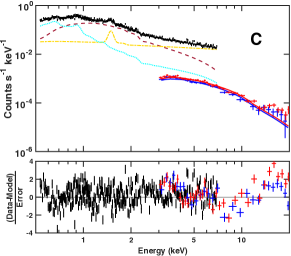
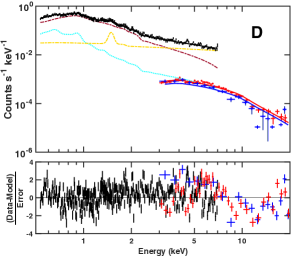
We also attempted to fit the source spectra with a power-law rather than the srcut component to account for the non-thermal emission. The results are listed in Table 4. In all regions, the power-law model was as successful as the srcut model in fitting the data. In past X-ray work on 30 Dor C, Yamaguchi et al. (2009) statistically favored the srcut models over a simple power-law in our Region C, whereas Bamba et al. (2004) and Kavanagh et al. (2015) reported that they could not distinguish between these two models statistically.
4 Discussion
We have shown that the complete shell of 30 Dor C emits hard, non-thermal X-rays. We fit XMM-Newton and NuSTAR spectra at three locations around the shell, and a power-law or a srcut component was comparably successful at modeling these data. Given the best-fit Hz of the srcut components, we can estimate the maximum energy of the accelerated electrons using Equation 1. Assuming the total B-field strength of G666This value is consistent with the values of G found by Kavanagh et al. (2019) as well as the ISM LMC B-field strength of G from Gaensler et al. (2005) and assuming a compression ratio of 4., we find TeV. If we instead adopt the 90% confidence limit of 40 G found by Kavanagh et al. (2019), we get TeV. These values are comparable to those found in young SNRs (e.g., Reynolds & Keohane 1999; Lopez et al. 2015).
Our estimates of are also roughly consistent with the TeV detection of 30 Dor C with HESS up to 20 TeV (H.E.S.S. Collaboration et al., 2015). The TeV spectrum was best-fit by a power-law with photon index of , yielding a total erg s-1 in the TeV band. Although it is unclear whether the emission was produced by a hadronic or leptonic cosmic-ray population (Kavanagh et al. 2019 argue for a leptonic origin based on the -field strength), the signal was localized to a central/northwest region of 30 Dor C where the massive stars associated with LH 90 are located (see Figure 1 of H.E.S.S. Collaboration et al. 2015), including part of our Region C.
In the context of SNRs, relativistic electrons are thought to be accelerated by diffusive shock acceleration (DSA; Bell 2004), and shocks of velocities 1,000 km s-1 are necessary for particles to reach TeV energies. In the case of 30 Dor C, the expansion velocity of the H shell is only 100 km s-1 (Dunne et al., 2001; Kavanagh et al., 2019), though the H shell velocity does not reflect the shock responsible for the synchrotron emission. Kavanagh et al. (2019) suggested that the shocks are stalled in regions where it encountered the H shell, and it expands at faster velocities through gaps in the shell elsewhere. This explanation is consistent with the anti-correlation of the H and X-ray they found in the northeast and northwest (and that is evident when comparing the H with the NuSTAR emission in Figure 4).
Generally, particle acceleration in 30 Dor C and other SBs is distinct from DSA in a single, isolated SNR. For example, Parizot et al. (2004) reviewed the collective effects of particle acceleration following numerous SNe and highlighted the differences from the isolated SN case. They showed that massive stars in OB associations are close enough that their winds interact, generating strong turbulence and magnetohydrodynamic (MHD) waves. They demonstrated that several mechanisms (e.g., wind-wind interactions, shock-cloud interactions, shock distortions) maintain turbulence and magnetic inhomogeneities in the SB interior, facilitating efficient turbulent acceleration. Finally, they found that SBs can yield particles with energies up to 1017 eV through repeated acceleration. Bykov (2001) showed that % of a SB’s turbulent energy can be transferred to low-energy, non-thermal particles to accelerate them, and Butt & Bykov (2008) suggested that up to one-third of the energy injected by stellar winds and SNe can go into accelerating cosmic rays.
Ferrand & Marcowith (2010) used semi-analytical models of particle acceleration (both DSA and stochastic reacceleration) inside SBs to investigate the shape of the resulting cosmic-ray spectra and their temporal evolution. The spectra depend on star cluster and SB parameters (e.g., number of stars , the external scale of turbulence , the size of the acceleration region , and the B-field strength), and Ferrand & Marcowith (2010) quantified the spectral hardness using the dimensionless parameter , which is roughly the ratio of the stochastic reacceleration time to the escape time. Low implies that reacceleration is faster than escape, leading to hard spectra, whereas high means that escape is faster than reacceleration, resulting in softer spectra where particles escape quickly after being accelerated by SN shocks.
Ferrand & Marcowith (2010) estimated for a sample of Milky Way and LMC star clusters and found a range, with 102–106 assuming G and a turbulence index of or = 10-3–100 for G and a turbulence index of . For comparison, we find that LH 90 (the central star cluster of 30 Dor C) has = 104 or = 10-1 in these two cases, respectively, where we have adopted (Testor et al., 1993), pc (the separation of the 33 stars in LH 90 given the star cluster radius of 29 pc), pc (the radius of the 30 Dor C shell; Dunne et al. 2001), and an ambient density of cm-3. Thus, it appears that 30 Dor C is generally consistent with the other sources considered by Ferrand & Marcowith (2010).
We consider whether the energy injection from the stellar population and SNe in 30 Dor C can account for the observed non-thermal luminosity of erg s-1 (the sum of Regions B, C, and D) following a similar calculation from Kavanagh et al. (2015). LH 90, the star cluster powering 30 Dor C, has 26 O-stars and 7 WR stars (Testor et al., 1993). Smith & Wang (2004) estimated the wind luminosity from the O-stars is erg s-1, and Kavanagh et al. (2015) calculated a luminosity of 5 erg s-1 from the 7 WR stars. Assuming the WR lifetimes are years (Leitherer et al., 1997) and averaging over the age of the superbubble (4 Myr), the combined luminosity from the O- and WR stars over a 4-Myr timescale is erg s-1. If SNe have also occurred in the region (Smith & Wang, 2004), then SNe have contributed erg s-1 as well, adopting the standard 1051 erg of kinetic energy per explosion. Thus, the total energy input from the stellar population and SNe is erg s-1. Assuming an efficiency of 15% for the transfer of the SB’s turbulent energy to non-thermal particles (from Figure 1 of Bykov 2001 for an age of 4 Myr), erg s-1 would be available to power synchrotron emission. Given that this value is an order of magnitude above , it seems that the non-thermal particles have sufficient energy to account for the observed flux.
5 Conclusions
We have presented evidence of particle acceleration in the superbubble 30 Dor C using hard X-ray images and spectra from targeted and serendipitous NuSTAR and XMM-Newton observations. The complete shell of the SB is detected up to 20 keV, and the young SNR MCSNR J05366913 is detected up to 8 keV. Additionally, hard X-ray emission is evident at locations of six point sources previously identified with Chandra and XMM-Newton, and we discussed the possible associations of these objects with massive star clusters, AGN, and stellar remnants. We extracted NuSTAR and XMM-Newton spectra at three locations around the 30 Dor C shell and modeled them using a non-thermal (srcut or power-law) component, adding a thermal (apec or vpshock) component as needed. All three regions have predominantly non-thermal emission, and two regions (the east and west side of the SB) have some thermal emission as well. From the srcut models, we find best-fit rolloff frequencies of Hz, which correspond to maximum electron energies of TeV.
In addition to diffusive shock acceleration from individual SNR shocks, superbubbles may re-accelerate low-energy particles via turbulence and MHD waves, transferring tens of percent of the SB’s turbulent energy to those particles. We show that the mechanical energy from the stellar population and previous SN explosions in the bubble’s interior is sufficient to account for the observed non-thermal flux.
References
- Abdo et al. (2010) Abdo, A. A., Ackermann, M., Ajello, M., et al. 2010, A&A, 512, A7, doi: 10.1051/0004-6361/200913474
- Ambrocio-Cruz et al. (2016) Ambrocio-Cruz, P., Le Coarer, E., Rosado, M., et al. 2016, MNRAS, 457, 2048, doi: 10.1093/mnras/stw054
- Arnaud (1996) Arnaud, K. A. 1996, Astronomical Society of the Pacific Conference Series, Vol. 101, XSPEC: The First Ten Years, ed. G. H. Jacoby & J. Barnes, 17
- Babazaki et al. (2018) Babazaki, Y., Mitsuishi, I., Matsumoto, H., et al. 2018, ArXiv e-prints. https://arxiv.org/abs/1807.11050
- Bamba et al. (2004) Bamba, A., Ueno, M., Nakajima, H., & Koyama, K. 2004, ApJ, 602, 257, doi: 10.1086/380957
- Bell (2004) Bell, A. R. 2004, MNRAS, 353, 550, doi: 10.1111/j.1365-2966.2004.08097.x
- Blackburn (1995) Blackburn, J. K. 1995, Astronomical Society of the Pacific Conference Series, Vol. 77, FTOOLS: A FITS Data Processing and Analysis Software Package, ed. R. A. Shaw, H. E. Payne, & J. J. E. Hayes, 367
- Boggs et al. (2015) Boggs, S. E., Harrison, F. A., Miyasaka, H., et al. 2015, Science, 348, 670, doi: 10.1126/science.aaa2259
- Butt & Bykov (2008) Butt, Y. M., & Bykov, A. M. 2008, ApJ, 677, L21, doi: 10.1086/587875
- Bykov (2001) Bykov, A. M. 2001, Space Sci. Rev., 99, 317
- Bykov (2014) —. 2014, A&A Rev., 22, 77, doi: 10.1007/s00159-014-0077-8
- Bykov & Fleishman (1992) Bykov, A. M., & Fleishman, G. D. 1992, MNRAS, 255, 269, doi: 10.1093/mnras/255.2.269
- Castor et al. (1975) Castor, J., McCray, R., & Weaver, R. 1975, ApJ, 200, L107, doi: 10.1086/181908
- Chu & Mac Low (1990) Chu, Y.-H., & Mac Low, M.-M. 1990, ApJ, 365, 510, doi: 10.1086/169505
- Cooper et al. (2004) Cooper, R. L., Guerrero, M. A., Chu, Y.-H., Chen, C.-H. R., & Dunne, B. C. 2004, ApJ, 605, 751, doi: 10.1086/382501
- Dennerl et al. (2001) Dennerl, K., Haberl, F., Aschenbach, B., et al. 2001, A&A, 365, L202, doi: 10.1051/0004-6361:20000049
- Dunne et al. (2001) Dunne, B. C., Points, S. D., & Chu, Y.-H. 2001, ApJS, 136, 119, doi: 10.1086/321794
- Evans et al. (2010) Evans, I. N., Primini, F. A., Glotfelty, K. J., et al. 2010, ApJS, 189, 37, doi: 10.1088/0067-0049/189/1/37
- Faucher-Giguère & Kaspi (2006) Faucher-Giguère, C.-A., & Kaspi, V. M. 2006, ApJ, 643, 332, doi: 10.1086/501516
- Ferrand & Marcowith (2010) Ferrand, G., & Marcowith, A. 2010, A&A, 510, A101, doi: 10.1051/0004-6361/200913520
- Filipovic et al. (1995) Filipovic, M. D., Haynes, R. F., White, G. L., et al. 1995, A&AS, 111, 311
- Fruscione et al. (2006) Fruscione, A., McDowell, J. C., Allen, G. E., et al. 2006, Society of Photo-Optical Instrumentation Engineers (SPIE) Conference Series, Vol. 6270, CIAO: Chandra’s data analysis system, 62701V
- Gabriel et al. (2004) Gabriel, C., Denby, M., Fyfe, D. J., et al. 2004, Astronomical Society of the Pacific Conference Series, Vol. 314, The XMM-Newton SAS - Distributed Development and Maintenance of a Large Science Analysis System: A Critical Analysis, ed. F. Ochsenbein, M. G. Allen, & D. Egret, 759
- Gaensler et al. (2005) Gaensler, B. M., Haverkorn, M., Staveley-Smith, L., et al. 2005, Science, 307, 1610, doi: 10.1126/science.1108832
- Grefenstette et al. (2015) Grefenstette, B. W., Reynolds, S. P., Harrison, F. A., et al. 2015, ApJ, 802, 15, doi: 10.1088/0004-637X/802/1/15
- Harrison et al. (2013) Harrison, F. A., Craig, W. W., Christensen, F. E., et al. 2013, ApJ, 770, 103, doi: 10.1088/0004-637X/770/2/103
- H.E.S.S. Collaboration et al. (2015) H.E.S.S. Collaboration, Abramowski, A., Aharonian, F., et al. 2015, Science, 347, 406, doi: 10.1126/science.1261313
- Hughes et al. (2007) Hughes, A., Staveley-Smith, L., Kim, S., Wolleben, M., & Filipović, M. 2007, MNRAS, 382, 543, doi: 10.1111/j.1365-2966.2007.12466.x
- Kavanagh (2020) Kavanagh, P. J. 2020, Ap&SS, 365, 6, doi: 10.1007/s10509-019-3719-5
- Kavanagh et al. (2015) Kavanagh, P. J., Sasaki, M., Bozzetto, L. M., et al. 2015, A&A, 573, A73, doi: 10.1051/0004-6361/201424354
- Kavanagh et al. (2019) Kavanagh, P. J., Vink, J., Sasaki, M., et al. 2019, A&A, 621, A138, doi: 10.1051/0004-6361/201833659
- Leitherer et al. (1997) Leitherer, C., Chapman, J. M., & Koribalski, B. 1997, ApJ, 481, 898, doi: 10.1086/304096
- Lin et al. (2012) Lin, D., Webb, N. A., & Barret, D. 2012, ApJ, 756, 27, doi: 10.1088/0004-637X/756/1/27
- Long et al. (1981) Long, K. S., Helfand, D. J., & Grabelsky, D. A. 1981, ApJ, 248, 925, doi: 10.1086/159222
- Lopez et al. (2015) Lopez, L. A., Grefenstette, B. W., Reynolds, S. P., et al. 2015, ApJ, 814, 132, doi: 10.1088/0004-637X/814/2/132
- Lortet & Testor (1984) Lortet, M. C., & Testor, G. 1984, A&A, 139, 330
- Lucke & Hodge (1970) Lucke, P. B., & Hodge, P. W. 1970, AJ, 75, 171, doi: 10.1086/110959
- Mac Low & McCray (1988) Mac Low, M.-M., & McCray, R. 1988, ApJ, 324, 776, doi: 10.1086/165936
- Maddox et al. (2009) Maddox, L. A., Williams, R. M., Dunne, B. C., & Chu, Y.-H. 2009, ApJ, 699, 911, doi: 10.1088/0004-637X/699/1/911
- Maggi et al. (2016) Maggi, P., Haberl, F., Kavanagh, P. J., et al. 2016, A&A, 585, A162, doi: 10.1051/0004-6361/201526932
- Massey et al. (2000) Massey, P., Waterhouse, E., & DeGioia-Eastwood, K. 2000, AJ, 119, 2214, doi: 10.1086/301345
- Mathewson et al. (1985) Mathewson, D. S., Ford, V. L., Tuohy, I. R., et al. 1985, ApJS, 58, 197, doi: 10.1086/191037
- Mills et al. (1984) Mills, B. Y., Turtle, A. J., Little, A. G., & Durdin, J. M. 1984, Australian Journal of Physics, 37, 321, doi: 10.1071/PH840321
- Muno et al. (2006) Muno, M. P., Law, C., Clark, J. S., et al. 2006, ApJ, 650, 203, doi: 10.1086/507175
- Neugent et al. (2012) Neugent, K. F., Massey, P., & Morrell, N. 2012, AJ, 144, 162, doi: 10.1088/0004-6256/144/6/162
- Oey (1996) Oey, M. S. 1996, ApJ, 467, 666, doi: 10.1086/177642
- Pacholczyk (1970) Pacholczyk, A. G. 1970, Radio astrophysics. Nonthermal processes in galactic and extragalactic sources
- Parizot et al. (2004) Parizot, E., Marcowith, A., van der Swaluw, E., Bykov, A. M., & Tatischeff, V. 2004, A&A, 424, 747, doi: 10.1051/0004-6361:20041269
- Pietrzyński et al. (2013) Pietrzyński, G., Graczyk, D., Gieren, W., et al. 2013, Nature, 495, 76, doi: 10.1038/nature11878
- Pietrzyński et al. (2019) Pietrzyński, G., Graczyk, D., Gallenne, A., et al. 2019, Nature, 567, 200, doi: 10.1038/s41586-019-0999-4
- Reynolds (1998) Reynolds, S. P. 1998, ApJ, 493, 375, doi: 10.1086/305103
- Reynolds & Ellison (1992) Reynolds, S. P., & Ellison, D. C. 1992, ApJ, 399, L75, doi: 10.1086/186610
- Reynolds & Keohane (1999) Reynolds, S. P., & Keohane, J. W. 1999, ApJ, 525, 368, doi: 10.1086/307880
- Rodríguez-González et al. (2011) Rodríguez-González, A., Velázquez, P. F., Rosado, M., et al. 2011, ApJ, 733, 34, doi: 10.1088/0004-637X/733/1/34
- Rogers & Pittard (2014) Rogers, H., & Pittard, J. M. 2014, MNRAS, 441, 964, doi: 10.1093/mnras/stu625
- Rosen et al. (2016) Rosen, S. R., Webb, N. A., Watson, M. G., et al. 2016, A&A, 590, A1, doi: 10.1051/0004-6361/201526416
- Russell & Dopita (1992) Russell, S. C., & Dopita, M. A. 1992, ApJ, 384, 508, doi: 10.1086/170893
- Sano et al. (2017) Sano, H., Yamane, Y., Voisin, F., et al. 2017, ApJ, 843, 61, doi: 10.3847/1538-4357/aa73e0
- Smith & Wang (2004) Smith, D. A., & Wang, Q. D. 2004, ApJ, 611, 881, doi: 10.1086/422181
- Smith & MCELS Team (1998) Smith, R. C., & MCELS Team. 1998, PASA, 15, 163, doi: 10.1071/AS98163
- Snowden et al. (2008) Snowden, S. L., Mushotzky, R. F., Kuntz, K. D., & Davis, D. S. 2008, A&A, 478, 615, doi: 10.1051/0004-6361:20077930
- Testor et al. (1993) Testor, G., Schild, H., & Lortet, M. C. 1993, A&A, 280, 426
- Tüllmann et al. (2009) Tüllmann, R., Long, K. S., Pannuti, T. G., et al. 2009, ApJ, 707, 1361, doi: 10.1088/0004-637X/707/2/1361
- Verner et al. (1996) Verner, D. A., Ferland, G. J., Korista, K. T., & Yakovlev, D. G. 1996, ApJ, 465, 487, doi: 10.1086/177435
- Wang et al. (2016) Wang, S., Liu, J., Qiu, Y., et al. 2016, ApJS, 224, 40, doi: 10.3847/0067-0049/224/2/40
- Watson et al. (2009) Watson, M. G., Schröder, A. C., Fyfe, D., et al. 2009, A&A, 493, 339, doi: 10.1051/0004-6361:200810534
- Weaver et al. (1977) Weaver, R., McCray, R., Castor, J., Shapiro, P., & Moore, R. 1977, ApJ, 218, 377, doi: 10.1086/155692
- Wenger et al. (2000) Wenger, M., Ochsenbein, F., Egret, D., et al. 2000, A&AS, 143, 9, doi: 10.1051/aas:2000332
- Wik et al. (2014) Wik, D. R., Hornstrup, A., Molendi, S., et al. 2014, ApJ, 792, 48, doi: 10.1088/0004-637X/792/1/48
- Wilms et al. (2000) Wilms, J., Allen, A., & McCray, R. 2000, ApJ, 542, 914, doi: 10.1086/317016
- Yadav et al. (2017) Yadav, N., Mukherjee, D., Sharma, P., & Nath, B. B. 2017, MNRAS, 465, 1720, doi: 10.1093/mnras/stw2522
- Yamaguchi et al. (2009) Yamaguchi, H., Bamba, A., & Koyama, K. 2009, PASJ, 61, S175, doi: 10.1093/pasj/61.sp1.S175
- Yamaguchi et al. (2016) Yamaguchi, H., Katsuda, S., Castro, D., et al. 2016, ApJ, 820, L3, doi: 10.3847/2041-8205/820/1/L3
- Yamaguchi et al. (2010) Yamaguchi, H., Sawada, M., & Bamba, A. 2010, ApJ, 715, 412, doi: 10.1088/0004-637X/715/1/412