Gas density perturbations induced by forming planet(s) in the AS 209 protoplanetary disk as seen with ALMA
Abstract
The formation of planets occurs within protoplanetary disks surrounding young stars, resulting in perturbation of the gas and dust surface densities. Here, we report the first evidence of spatially resolved gas surface density () perturbation towards the AS 209 protoplanetary disk from the optically thin C18O () emission. The observations were carried out at 1.3 mm with ALMA at a spatial resolution of about 0.3 0.2 (corresponding to 38 25 au). The C18O emission shows a compact (60 au), centrally peaked emission and an outer ring peaking at 140 au, consistent with that observed in the continuum emission and, its azimuthally averaged radial intensity profile presents a deficit that is spatially coincident with the previously reported dust map. This deficit can only be reproduced with our physico-thermochemical disk model by lowering by nearly an order of magnitude in the dust gaps. Another salient result is that contrary to C18O, the DCO+ () emission peaks between the two dust gaps. We infer that the best scenario to explain our observations (C18O deficit and DCO+ enhancement) is a gas perturbation due to forming-planet(s), that is commensurate with previous continuum observations of the source along with hydrodynamical simulations. Our findings confirm that the previously observed dust gaps are very likely due to perturbation of the gas surface density that is induced by a planet of at least 0.2 MJupiter in formation. Finally, our observations also show the potential of using CO isotopologues to probe the presence of saturn mass planet(s).
1 Introduction
| Molecule | Transition | Frequency | Eup | S2 | Synthesized beam | rms | Integrated FluxaaMeasured disk-averaged over 200 au line integrated intensity. | |
|---|---|---|---|---|---|---|---|---|
| (MHz) | (K) | (D2) | ( ) | PA () | (mJy beam-1) | (K km s-1) | ||
| CO | (2–1) | 230538.0 | 16.6 | 0.02 | 0.25 0.21 | 75.85 | 3.5 | 27.1 |
| 13CO | (2–1) bbHyperfine splitting. | 220398.7 | 15.9 | 0.05 | 0.25 0.21 | 73.43 | 3.5 | 8.5 2.6 |
| C18O | (2–1) | 219560.4 | 15.8 | 0.02 | 0.26 0.22 | 72.41 | 2.7 | 3.4 2.1 |
| DCO+ | (3–2) bbHyperfine splitting. | 216112.6 | 20.7 | 142 | 0.26 0.21 | 73.87 | 2.6 | 2.6 2.0 |
Formation of planets occurs within the gaseous and dusty interior of protoplanetary disks during the early phase of star formation. Although it remains difficult to directly detect planets in formation, the effect of the planet–disk interaction makes the indirect detection possible via the means of observations of the dust and molecular content of protoplanetary disks. Indeed, while forming, a planet will open gap(s) within the disk leading to a localised deficit in dust and gas (e.g., Papaloizou & Lin, 1984; Paardekooper & Mellema, 2004; Dürmann & Kley, 2015; Dong et al., 2015, 2017; Rosotti et al., 2016; Bae et al., 2017, 2018). This will result into dust and molecular gaps and rings. In that light, thanks to the high resolution and sensitivity of the Atacama Large Millimeter/submillimeter Array (ALMA) and the Spectro-Polarimetric High-contrast Exoplanet (SPHERE) facility, such structures have been observed in continuum emission (e.g., ALMA Partnership et al., 2015; Isella et al., 2016; Andrews et al., 2016; Zhang et al., 2016; Loomis et al., 2017; van Boekel et al., 2017; Fedele et al., 2017, 2018; Muro-Arena et al., 2018).
Using ALMA observations, Teague et al. (2017) has reported oscillatory features in CS emission towards TW Hya and Harsono et al. (2018) have reported a deficit of CO isotopologue emission within the 15 au of the disk surrounding TMC1A. Those deficits might be due to grains size and growth propoperties but also to planet(s) in formation.
Recently, using ALMA observation of CO, Teague et al. (2018a) and Pinte et al. (2018), claimed the first kinematic evidences of embedded forming-planet(s) in the protoplanetary disk surrounding the Herbig Ae star HD163296. Interestingly enough, hydrodynamical models predict that not only the kinematics but also the bulk of the emission of CO isotopologues can be used as an indirect probe of the planet-disk interaction (e.g., Ober et al., 2015; Facchini et al., 2018); which induces a gap in the gas at the planet location.
In this paper, we investigate gas perturbations caused by a forming-planet in the disk surrounding the T Tauri star AS 209 (Andrews et al., 2009; Huang et al., 2016, 2017; Fedele et al., 2018; Teague et al., 2018b), which is located at 126 pc from the Sun (Gaia Collaboration et al., 2016). For this purpose, we follow up the observations by Fedele et al. (2018, hereafter, Paper I), in which the authors inferred that the observed rings and gaps of the 1.3 mm continuum emission are likely due to the formation of planets; this hypothesis is commensurate with hydrodynamical simulations (for further details, see Paper I). In this study, we only focus on the emission lines of CO and its isotopologues 13CO and C18O along with that of DCO+. In Section 2, we briefly present the observations and the methodology used for combining ALMA observations performed during different Cycles. Results and modelling are presented in Sections 3 and 4, respectively; and discussed in Section 5.
2 Observations and data reduction
The observations of the CO (21), 13CO (21), C18O (21) and DCO+ (32) lines (see spectroscopic parameters in Table 1) were performed with ALMA towards AS 209 with 38 antennas on 2016 September 22 and 41 antennas on 2016 September 26 (project ID ALMA2015.1.00486.S, PI: D. Fedele) towards the following phase-tracking center (=16, = 1402). The observations cover the frequency range 211–275 GHz in band 6. For further details, see Paper I.
To optimize the -coverage together with the sensitivity, we have combined our data with the ones observed by Huang et al. (2016) with ALMA during its Cycle 2 (project ID ALMA2013.1.00226.S, PI: D. K. Öberg). The latter were taken in relatively unstable conditions for the phase, and were shifted with respect to our observations. Therefore, the datasets were first individually self-calibrated before being merged, allowing us to properly shift the Cycle 2 observations (via the use of a ”false” model point) at the same coordinate position as our data.
We use the Common Astronomy Software Applications (CASA, McMullin et al., 2007) software version 4.7.2 for data reduction, selfcalibration, continuum subtraction, and the version 5.1.1 for deconvolution and imaging. To improve the signal-to-noise ratio, we use a natural cleaning. The resulting synthesized beams for each molecule are given in Table 1 and the spectral resolution is 0.2 km s-1.

3 Results and analysis
3.1 Emission maps and velocity structure
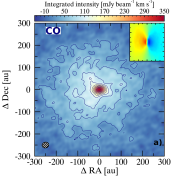
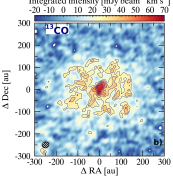
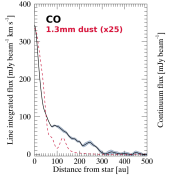
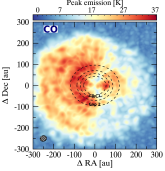
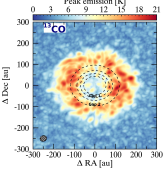
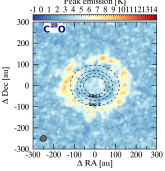
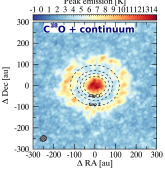
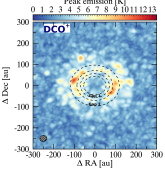
The CO, 13CO, C18O and DCO+ integrated emission maps over the line profile and the CO velocity map (that is consistent with Keplerian rotation) are displayed in Figure 1. The CO emission extends beyond that of 1.3 mm dust continuum (i.e. r200 au), as previously observed by Huang et al. (2016). The asymmetry seen in the CO emission map is due to the fact that part of the emission is absorbed by the cloud (see Öberg et al., 2011).
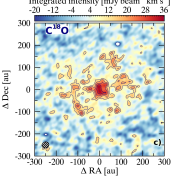
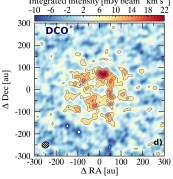
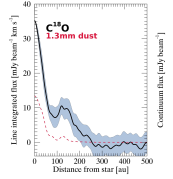
One notable feature shown in Figure 1 is that the spatial distribution of both the CO and 13CO emission is centrally peaked while that of C18O and DCO+ emission present rings. Indeed, C18O displays both a centrally bright emission inside the inner 50 au of the disk and an outer ring located at au just after the outer continuum gap reported in Paper I. Regarding the DCO+ emission, two rings are observed: the first one located between the two dust continuum gaps (i.e., 66 au 95 au) and the second one lying after the outer continuum gap at au.
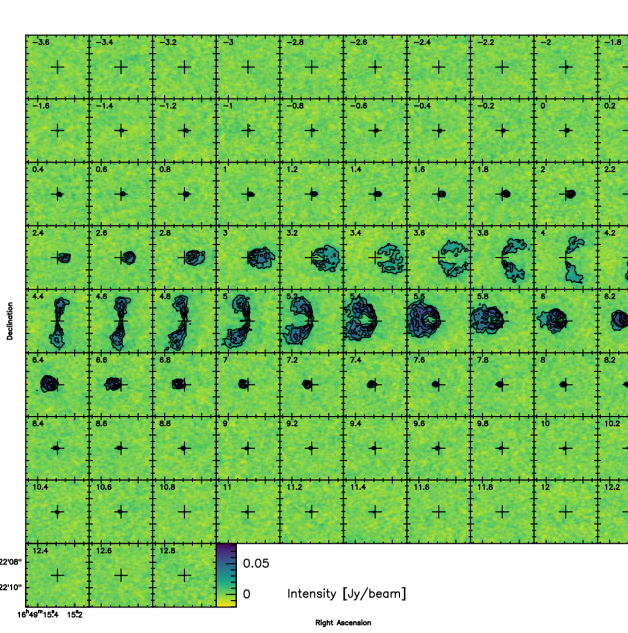
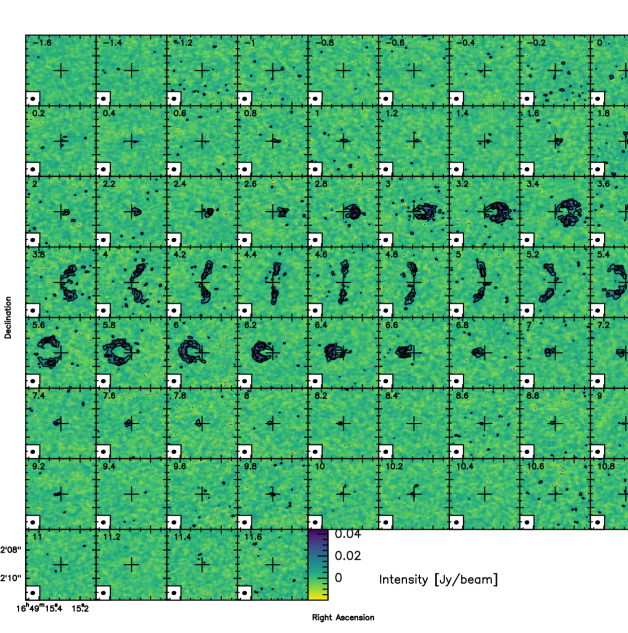
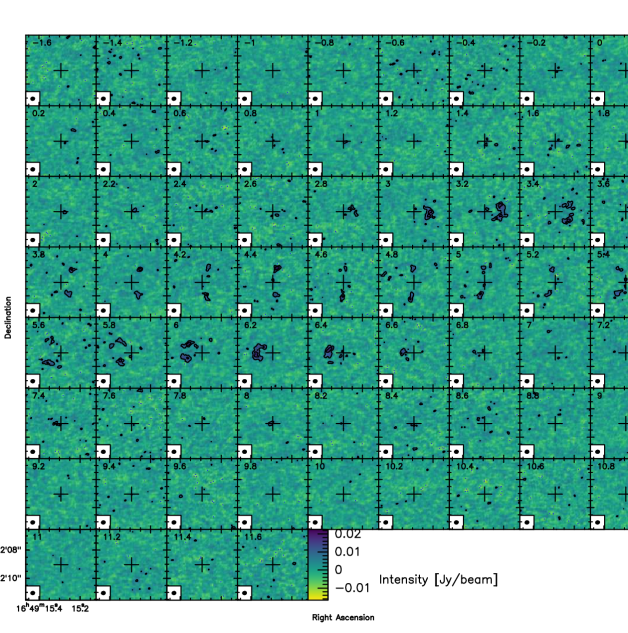
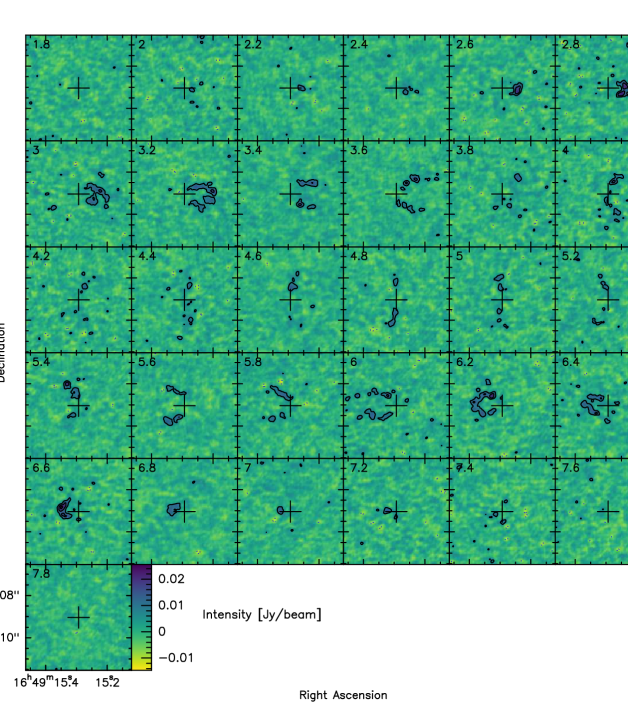
Figures 8 to 11, in Appendix, display the CO, 13CO, C18O and DCO+ channel emission maps, respectively. The fainter lines, associated with C18O and DCO+, are detected with at least a peak to noise ratio 6 in several channels (i.e. more than 10 channels). The pattern of the CO, 13CO, C18O and DCO+ emission is consistent with gas in Keplerian rotation motion.
3.2 Spectra
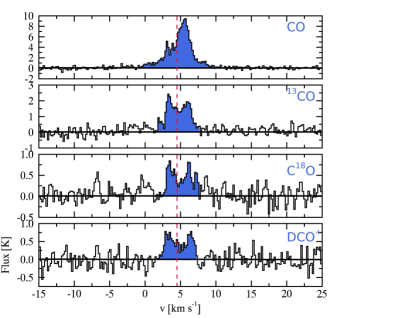
Figure 2 displays the spatially integrated CO, 13CO, C18O and DCO+ spectra extracted from a 200 au (i.e. 1.6) box centered on AS 209. The line profiles are all consistent with the velocity of the source. In addition, all molecular line shapes are consistent with each other, except that of CO that displays a brighter red-shifted emission. The latter is the result of absorption by the ambient cloud of part of the blue-shifted CO emission (see above as well as Figs. 1 and 3).
3.3 Line opacity
The estimate of the molecular surface density is strongly affected by the opacity of the targeted transition (e.g. Piétu et al., 2007). Assuming isotopic ratios for the local ISM of 16O/18O = 557 and 12C/13C=70 (Wilson, 1999), we estimate that the C18O emission is optically thin throughout the 200 au disk radii (with (C18O) 0.8) while that of 13CO and CO is optically thick with 2.5.
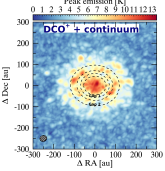
These estimates are consistent with the maximum peak intensity maps (moment 8, see further details on mom8 maps in Boehler et al., 2017) for the molecular emission lines that are displayed in Figure 3. More specifically, Fig. 3 shows moment 8 maps generated with and without continuum subtraction and one can see that the emission of C18O and DCO+ is optically thin while this is not the case for CO and 13CO emission.


3.4 Radial intensity profiles
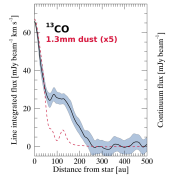
Figure 1 show the azimuthally averaged 1.3 mm dust continuum radial intensity profile along with that of 13CO, CO and DCO+ that have all been deprojected for the AS 209 disk inclination (PA=86 and = 35, see Paper I). Regarding CO, the displayed profile was averaged at 20 along the major west-east emission axis after deprojecting for the disk inclination due to the source geometry (see above and also Teague et al., 2018b) and in order to reduce the noise in the radial profile. It is apparent that the CO and 13CO emission decrease with increasing radius, which is consistent with previous observations by Huang et al. (2016). The opacity of both lines prevents us to see further details.
One notable feature of Fig. 1 is that the C18O radial intensity profile follows that of the dust continuum and harbours a drop in intensity between the two continuum gaps. Another salient result is that the DCO+ radial intensity profile is clearly anticorrelated with that of C18O and continuum: while the DCO+ intensity increases or decreases with increasing radius, that of C18O shows the opposite trend. In particular, the DCO+ surface density is seen between the two continuum gaps.
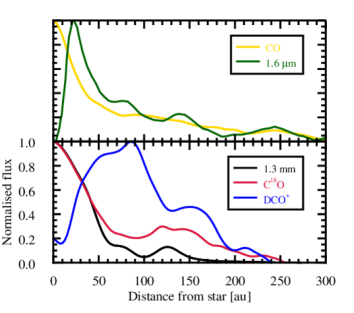
Finally, Fig. 4 displays the AS 209 CO, C18O and DCO+ radial profiles along with that of the 1.3 mm continuum emission and the 1.6m scattered light radial profile as observed in H-band with VLT/SPHERE (see Avenhaus et al., 2018). As noted by Teague et al. (2018b), the radial location of both the dust rings and emission peaks are offset between the two grains population, and CO emission peak at about 250 au coincide with that of the 1.6m scattered light. Incidentally, it is interesting to note that both molecular and m scattered light extend beyond the mm continuum emission.
4 Gas gaps thermochemical Modelling
In this section we aim to investigate whether the deficit of the C18O emission is due to perturbations of the gas surface density. As we aim not to perfectly fit the disk temperature and density structures but rather to analyse how gas gaps can affect the molecular emission, we have only performed a simple parametric study of the gas perturbation as described below.
4.1 Model description
We used the thermochemical disk model Dust And LInes (DALI, see Bruderer et al., 2012; Bruderer, 2013, for a complete description), which includes the following updates. (i) CO isotope-selective photodissociation (Miotello et al., 2014, 2016), to reproduce the CO isotopologues emission maps shown in Fig 1. (ii) Density scaling factors to reproduce the AS 209 dust and gas gaps, as described below.
| Fixed parameter | Value | Description |
| 0.133 | Scale height | |
| 0.1 | Flaring exponent | |
| [] | 35aaPaper I. | Disk inclination |
| [] | 86aaPaper I. | Disk position angle |
| d [pc] | 126a,ba,bfootnotemark: | distance of the source |
| M [M⊙] | 0.9a,ca,cfootnotemark: | Stellar mass |
| L [L⊙] | 1.5a,ca,cfootnotemark: | Stellar luminosity |
| Mgas [M⊙] | 3.0 | Disk gas massddThe following standard elemental abundances of carbon and oxygen of 1.3510-4 and 2.8810-4 are assumed. |
| Mdust [M⊙] | 3.5 | Disk dust mass |
| Adopted parameter | ValueseeThe adopted values are given in boldface. | Description |
| 0.1, 0.2, 0.3, 0.4, 0.5 | exponent | |
| Rc,gas [au] | 80, 100, 120, 140, 160 | cutoff radius |
| 0.1, 0.2, 0.3, 0.4 | scaling factor for the gaps | |
| 0.4, 0.6, 0.8, 1.0 | scaling factor for the ring |
The starting point is the best-fit model of the dust presented in Paper I, which reproduces the 1.3 mm continuum emission. For the dust surface density profile we used that of Paper I. For simplicity, the surface density profile of the small grains population is assumed to follow that of the large grains (for further details see Section 4.1 of Paper I). The gas density surface density, , is defined as follows :
| (1) |
where is the cutoff radius of the gas, is the surface density power-law exponent and is the surface density scaling factor within the gaps described as follows (by definition 0):
| (5) |
We note that owing to the data angular resolution (allowing us to probe only scale 30 au), we assumed the same (R) in the two gaps.
In order to reproduce both the absolute flux level and the radial profile of the three CO isotopologues (=2-1) transitions, we first run a grid of DALI models varying 111For the total gas mass, we assumed the following standard elemental abundances of carbon and oxygen of 1.3510-4 and 2.8810-4, respectively., and Rc,gas, while keeping fixed the scale height222The scale height distribution is described by: (for further details see Paper I). (0.133) and the flaring exponent (0.10) as in paper I. Table 2 lists the DALI parameter values adopted in the present study.
In a second step, a grid of DALI disk structures has been created by varying and (the values are given in Table 2). The data-model comparison is performed in the image plane: DALI creates synthetic channel maps which are then convolved with a Gaussian beam of the same size as the beam of the observations (see Table 1). Then, the latter are collapsed to create integrated intensity maps.
4.2 Modelling results
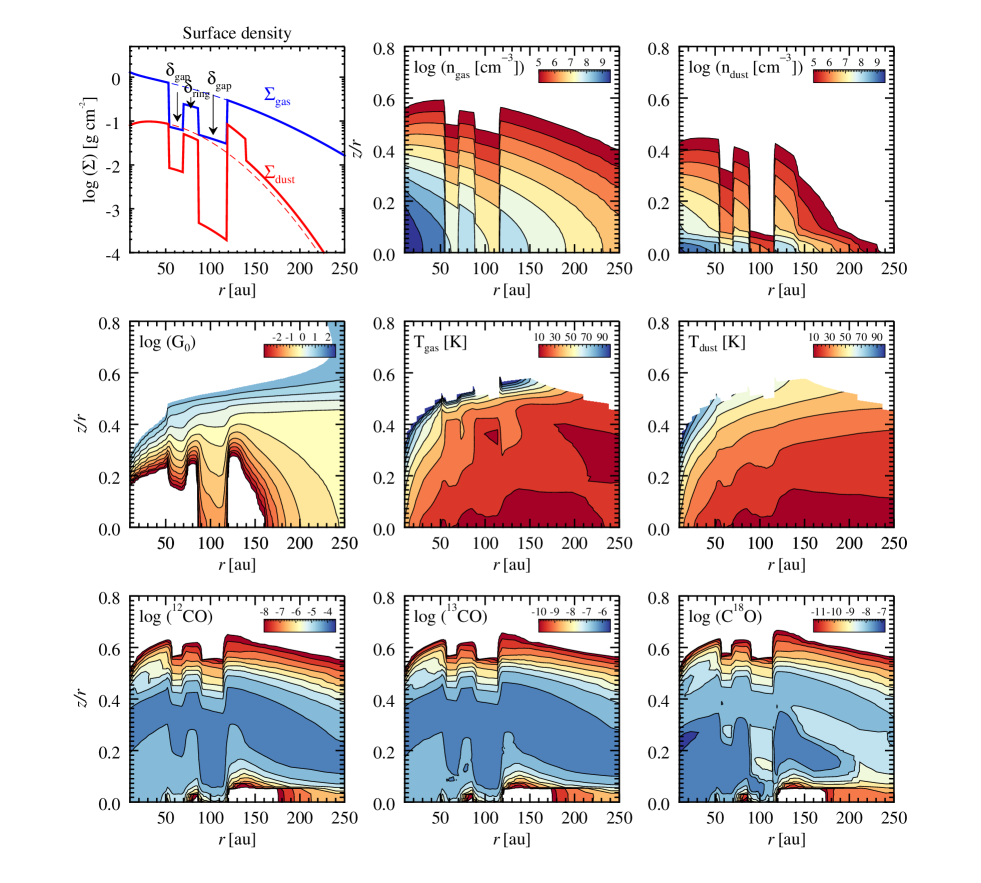
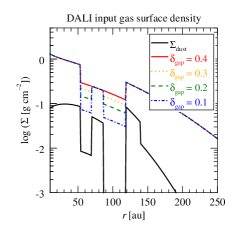
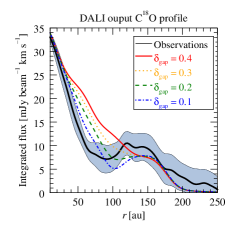
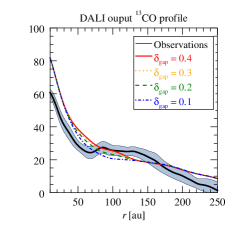
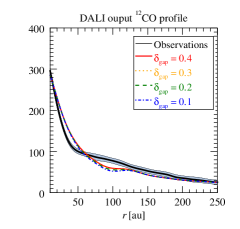
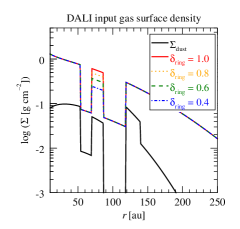
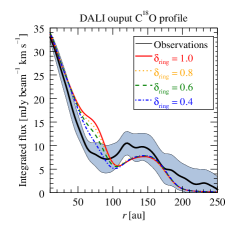
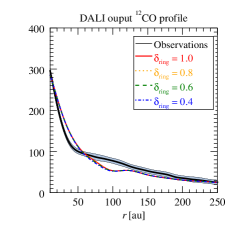
Figure 5 shows the surface density parametrisation along with the density and temperature structures of a random DALI model and the resulting abundance of the three CO isotopologues in presence of gas gaps. Figure 6 shows the input surface density structure for the different values of and along with the resulting deprojected and azimuthally averaged along with the observed CO, 13CO and C18O radial profiles. The adopted gas density structures reproduces well the overall 13CO and 12CO profiles although minor differences are seen. The latter are mainly due to the uncertainties in the vertical density and temperature structures (see Bruderer et al., 2012).
Our modelling clearly shows that in order to reproduce the observed C18O deficit, needs to be lowered, in the gaps, by applying a scaling factor of about 0.1–0.2 compared to the unperturbed profile (i.e. (R)=1). Our gas gaps thermochemical modelling also shows that the drop of C18O is not the result of temperature and/or opacity effects alone (the emission of transition being thin) but that of an intrinsic gas density drop. Indeed, without gas gaps, our model cannot reproduce the C18O profile (see Figure 6). Interestingly enough, the 13CO and 12CO emission remains optically thick within the gaps. As a consequence, the modelled surface density perturbations lead to minor changes in the resulting 13CO and 12CO radial profiles as shown in Figure 6.

Finally, it is interesting to note that UV irradiation penetrates deeper in the disk layers where gap dusts are located as shown in Figure 5. In that instance, the FUV radiation field G0 is larger and the C18O/12CO mass ratio is further reduced because of photochemistry. From the measured 12CO/C18O flux ratio, we estimate that isotope-selective photodissociation (Visser et al., 2009) contributed to about 10–20 on the observed C18O intensity inside the gaps.
We stress that our present modelling does not fully reproduce the observations because of uncertainties on the 2D temperature structure. A more detailed modelling will be presented in an upcoming paper (Fedele et al. in prep.), however.
5 Discussion
5.1 Comparison with hydrodynamical simulations
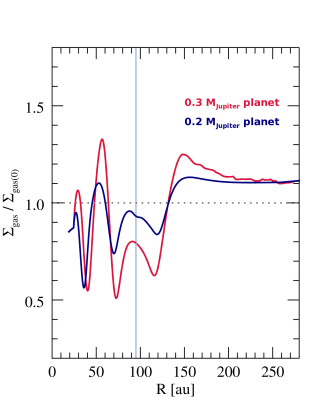
From our 1.3 mm continuum observations coupled with hydrodynamical simulations, we have previously shown that the presence of a giant planet or of a pair of planets likely explains the observed dust gaps (see Paper I). Recently, from 2D hydrodynamical simulations of planet–disk interaction, Facchini et al. (2018) have shown that gaps opened by a planet leads to a thermal gas and dust decoupling. The latter strongly affects the dust-to-gas mass ratio within the gaps with respect to the overall ratio. Our DALI modelling of the dust and C18O emission is consistent with this interpretation. In addition, hydrodynamical simulations of planet-disk models by Facchini et al. (2018) show that the presence of a giant planet not only affects the dust radial intensity profile but also the ones of CO and its isotopologues. Indeed, the latter harbour a gap (whose depth and width both depend on the planet mass and disk viscosity, see e.g. Lin & Papaloizou, 1986; Crida et al., 2006; Fung et al., 2014; Duffell, 2015; Dürmann & Kley, 2015; Kanagawa et al., 2017) at the planet location in the disk. In that context, we have thus performed hydrodynamical simulations to further investigate the hypothesis of a planet producing gas gaps in the AS 209 disk. More specifically, we have carried out 2D hydrodynamical simulations using FARGO-3D (see further details in paper I, and in Benítez-Llambay & Masset, 2016; Rosotti et al., 2016) for a planet of 0.2 MJupiter and one of 0.3 MJupiter located at 95 au. The simulations were run for 1000 orbits of the planet (corresponding to about 106 years) and are inviscid (i.e. the viscosity, , is null). The simulations used a grid extending from 19 to 285 au, using 1766 logarithmically spaced cells in radius and 4096 cells in azimuth. Wave-killing boundaries were used in the radial direction (de Val-Borro et al., 2006). The disk aspect ratio was taken to be as in Paper I. The results are shown in Figure 7. It is immediately apparent that the presence of a planet perturbes the gas surface density by inducing a gap which is wider and deeper for a massive planet. This is commensurate with our C18O observations and the results of Section 4. We infer that the optical thickness of the 13CO and CO line prevents us to see any gap in their radial distribution profiles as they only probe the disk surface (see Section 4 and Ober et al., 2015). Incidentally, the hydrodynamical simulations show a bump at the location of the planet due to the so-called co-rotation zone. This feature is not seen in our data because we do not have sufficient sensitivity.
5.2 On the physical nature of the gap
Our modelling of the CO isotopologues emission shows that the drop of C18O between the two dust gaps is the result of an intrinsic gas density drop (see Fig. 6 and Section 4) ; which is commensurate with our hydrodynamical simulations. Incidentally, Huang et al. (2016) argued that the observed C18O outer ring was due to external photodesorption processes (Facchini et al., 2016). However, the lower angular resolution and sensitivity of their data were not sufficient enough to allow the authors to see the same structure in the dust emission. Our more sensitive combined high resolutions data clearly show that the outer gas ring seen in C18O is also seen in the 1.3 mm dust emission (see Figs. 1, 4 and Paper I) and, therefore, rule out the hypothesis of external photodesorption.
Our findings strongly support the scenario proposed in Paper I: the formation of a giant planet (at least Mplanet0.2 MJupiter) is likely occurring in the AS 209 disk as: i) the C18O outer ring at 120 au is also seen in the 1.3 mm continuum emission, ii) the observations can only be reproduced by lowering the gas surface density and, iii) the wide C18O deficiency between the two continuum gaps along with the C18O increased beyond the dust gaps are both consistent with hydrodynamical simulations of massive planet(s) in formation. Moreover, among the proposed gap-opening mechanisms, magneto-rotational instability can only reduce by a factor of a few at the edge of the dead zone (Flock et al., 2015), while only a planet-induced dynamical clearing is able to generate the deep gas gaps observed here. Finally, our present data does not allow us to distinguish between the single planet scenario that can open multiple gaps for very low viscosity from the one suggesting the presence of two planets (see Paper I and Dong et al., 2015, 2017; Bae et al., 2017).
5.3 DCO+ a tracer of forming-planet(s)?
One notable feature of the DCO+ emission towards AS209 is that it harbors a ring lying in the region located between the two dust continuum gaps (see Fig. 1). Interestingly enough, within these dust gaps, one can observe an overdensity of DCO+ while neutral gas (i.e C18O) and dust are depleted (see Figs 1 and 4).
Owing to the low density of both gas and dust within the dust gaps, the medium is likely more ionized than the surrounding regions. Indeed, ionisation processes are more efficient in regions of the disk depleted of material as the gas is less shielded by the dust. Consequently, DCO+ enhancement might be the result of multiple chemical pathways such as i) deuterium exchange between CO and H2D+ at low temperatures (20K, Watson, 1976; Pagani et al., 1992), ii) that with HCO+ and D atoms (Aikawa et al., 2018) and, iii) with CH2D+ and CH4D+ at warmer temperatures (30 KT70 K Favre et al., 2015; Carney et al., 2018), although owing to the distance from the central star and the disk self-shielding in the gap, this region is probably cold. A full physico-chemical modelling of the DCO+ chemistry is needed to investigate furthermore the production of DCO+ and will be the subject on an upcoming paper. Nonetheless, our finding leads us to suggest that ions enrichment at the location of neutral gas and dust deficit in protoplanetary disk could be used as proxy for planet(s) formation.
6 Conclusions
Our study shows that the optically thin C18O (2–1) and DCO+ (3-2) emission harbors rings and displays anti-correlated radial profiles. More specifically, between the previously observed two dust gaps, there is a deficit of C18O while DCO+ (3-2) is enhanced. Our thermohemical modelling of CO, 13CO and C18O implies a reduced gas surface density in correspondance of the dust gaps identified in Paper I. These findings led us to infer that the formation of a planet of 0.2–0.3 MJupiter at about 100 au is occurring in the AS 209 protoplanetary disk. The lower limit of 0.2 MJupiter is needed to reproduce the observed C18O deficit between 60 au up to 110 au. The upper limit of 0.3 MJupiter is determined by the size of the dust gaps as measured in Paper I.
An interesting outcome of our thermochemical modelling is that C18O being more sensitive to the gas and dust density perturbations (in comparison to the optically thicker CO isotopologues), it is best suited to probe the presence of forming-planet(s) down to MSaturn in the outer disk.
Appendix A Channel emission maps
References
- Aikawa et al. (2018) Aikawa, Y., Furuya, K., Hincelin, U., & Herbst, E. 2018, ApJ, 855, 119, doi: 10.3847/1538-4357/aaad6c
- ALMA Partnership et al. (2015) ALMA Partnership, Brogan, C. L., Pérez, L. M., et al. 2015, ApJ, 808, L3, doi: 10.1088/2041-8205/808/1/L3
- Andrews et al. (2009) Andrews, S. M., Wilner, D. J., Hughes, A. M., Qi, C., & Dullemond, C. P. 2009, ApJ, 700, 1502, doi: 10.1088/0004-637X/700/2/1502
- Andrews et al. (2016) Andrews, S. M., Wilner, D. J., Zhu, Z., et al. 2016, ApJ, 820, L40, doi: 10.3847/2041-8205/820/2/L40
- Avenhaus et al. (2018) Avenhaus, H., Quanz, S. P., Garufi, A., et al. 2018, ApJ, 863, 44, doi: 10.3847/1538-4357/aab846
- Bae et al. (2018) Bae, J., Pinilla, P., & Birnstiel, T. 2018, ApJ, 864, L26, doi: 10.3847/2041-8213/aadd51
- Bae et al. (2017) Bae, J., Zhu, Z., & Hartmann, L. 2017, ApJ, 850, 201, doi: 10.3847/1538-4357/aa9705
- Benítez-Llambay & Masset (2016) Benítez-Llambay, P., & Masset, F. S. 2016, ApJS, 223, 11, doi: 10.3847/0067-0049/223/1/11
- Boehler et al. (2017) Boehler, Y., Weaver, E., Isella, A., et al. 2017, ApJ, 840, 60, doi: 10.3847/1538-4357/aa696c
- Bruderer (2013) Bruderer, S. 2013, A&A, 559, A46, doi: 10.1051/0004-6361/201321171
- Bruderer et al. (2012) Bruderer, S., van Dishoeck, E. F., Doty, S. D., & Herczeg, G. J. 2012, A&A, 541, A91, doi: 10.1051/0004-6361/201118218
- Carney et al. (2018) Carney, M. T., Fedele, D., Hogerheijde, M. R., et al. 2018, A&A, 614, A106, doi: 10.1051/0004-6361/201732384
- Caselli & Dore (2005) Caselli, P., & Dore, L. 2005, A&A, 433, 1145, doi: 10.1051/0004-6361:20042118
- Cazzoli et al. (2004) Cazzoli, G., Puzzarini, C., & Lapinov, A. V. 2004, ApJ, 611, 615, doi: 10.1086/421992
- Crida et al. (2006) Crida, A., Morbidelli, A., & Masset, F. 2006, Icarus, 181, 587, doi: 10.1016/j.icarus.2005.10.007
- de Val-Borro et al. (2006) de Val-Borro, M., Edgar, R. G., Artymowicz, P., et al. 2006, MNRAS, 370, 529, doi: 10.1111/j.1365-2966.2006.10488.x
- Dong et al. (2017) Dong, R., Li, S., Chiang, E., & Li, H. 2017, ApJ, 843, 127, doi: 10.3847/1538-4357/aa72f2
- Dong et al. (2015) Dong, R., Zhu, Z., & Whitney, B. 2015, ApJ, 809, 93, doi: 10.1088/0004-637X/809/1/93
- Duffell (2015) Duffell, P. C. 2015, ApJ, 807, L11, doi: 10.1088/2041-8205/807/1/L11
- Dürmann & Kley (2015) Dürmann, C., & Kley, W. 2015, A&A, 574, A52, doi: 10.1051/0004-6361/201424837
- Facchini et al. (2016) Facchini, S., Clarke, C. J., & Bisbas, T. G. 2016, MNRAS, 457, 3593, doi: 10.1093/mnras/stw240
- Facchini et al. (2018) Facchini, S., Pinilla, P., van Dishoeck, E. F., & de Juan Ovelar, M. 2018, A&A, 612, A104, doi: 10.1051/0004-6361/201731390
- Favre et al. (2015) Favre, C., Bergin, E. A., Cleeves, L. I., et al. 2015, ApJ, 802, L23, doi: 10.1088/2041-8205/802/2/L23
- Fedele et al. (2017) Fedele, D., Carney, M., Hogerheijde, M. R., et al. 2017, A&A, 600, A72, doi: 10.1051/0004-6361/201629860
- Fedele et al. (2018) Fedele, D., Tazzari, M., Booth, R., et al. 2018, A&A, 610, A24, doi: 10.1051/0004-6361/201731978
- Flock et al. (2015) Flock, M., Ruge, J. P., Dzyurkevich, N., et al. 2015, A&A, 574, A68, doi: 10.1051/0004-6361/201424693
- Fung et al. (2014) Fung, J., Shi, J.-M., & Chiang, E. 2014, ApJ, 782, 88, doi: 10.1088/0004-637X/782/2/88
- Gaia Collaboration et al. (2016) Gaia Collaboration, Brown, A. G. A., Vallenari, A., et al. 2016, A&A, 595, A2, doi: 10.1051/0004-6361/201629512
- Goorvitch (1994) Goorvitch, D. 1994, ApJS, 95, 535, doi: 10.1086/192110
- Harsono et al. (2018) Harsono, D., Bjerkeli, P., van der Wiel, M. H. D., et al. 2018, Nature Astronomy, doi: 10.1038/s41550-018-0497-x
- Huang et al. (2016) Huang, J., Öberg, K. I., & Andrews, S. M. 2016, ApJ, 823, L18, doi: 10.3847/2041-8205/823/1/L18
- Huang et al. (2017) Huang, J., Öberg, K. I., Qi, C., et al. 2017, ApJ, 835, 231, doi: 10.3847/1538-4357/835/2/231
- Isella et al. (2016) Isella, A., Guidi, G., Testi, L., et al. 2016, Phys. Rev. Lett., 117, 251101, doi: 10.1103/PhysRevLett.117.251101
- Kanagawa et al. (2017) Kanagawa, K. D., Tanaka, H., Muto, T., & Tanigawa, T. 2017, PASJ, 69, 97, doi: 10.1093/pasj/psx114
- Klapper et al. (2001) Klapper, G., Lewen, F., Gendriesch, R., Belov, S. P., & Winnewisser, G. 2001, Z. Naturforsch., 56a, 329
- Lin & Papaloizou (1986) Lin, D. N. C., & Papaloizou, J. 1986, ApJ, 307, 395, doi: 10.1086/164426
- Loomis et al. (2017) Loomis, R. A., Öberg, K. I., Andrews, S. M., & MacGregor, M. A. 2017, ApJ, 840, 23, doi: 10.3847/1538-4357/aa6c63
- McMullin et al. (2007) McMullin, J. P., Waters, B., Schiebel, D., Young, W., & Golap, K. 2007, in Astronomical Society of the Pacific Conference Series, Vol. 376, Astronomical Data Analysis Software and Systems XVI, ed. R. A. Shaw, F. Hill, & D. J. Bell, 127
- Miotello et al. (2014) Miotello, A., Bruderer, S., & van Dishoeck, E. F. 2014, A&A, 572, A96, doi: 10.1051/0004-6361/201424712
- Miotello et al. (2016) Miotello, A., van Dishoeck, E. F., Kama, M., & Bruderer, S. 2016, A&A, 594, A85, doi: 10.1051/0004-6361/201628159
- Muro-Arena et al. (2018) Muro-Arena, G. A., Dominik, C., Waters, L. B. F. M., et al. 2018, A&A, 614, A24, doi: 10.1051/0004-6361/201732299
- Ober et al. (2015) Ober, F., Wolf, S., Uribe, A. L., & Klahr, H. H. 2015, A&A, 579, A105, doi: 10.1051/0004-6361/201526117
- Öberg et al. (2011) Öberg, K. I., Qi, C., Fogel, J. K. J., et al. 2011, ApJ, 734, 98, doi: 10.1088/0004-637X/734/2/98
- Paardekooper & Mellema (2004) Paardekooper, S.-J., & Mellema, G. 2004, A&A, 425, L9, doi: 10.1051/0004-6361:200400053
- Pagani et al. (1992) Pagani, L., Salez, M., & Wannier, P. G. 1992, A&A, 258, 479
- Papaloizou & Lin (1984) Papaloizou, J., & Lin, D. N. C. 1984, ApJ, 285, 818, doi: 10.1086/162561
- Piétu et al. (2007) Piétu, V., Dutrey, A., & Guilloteau, S. 2007, A&A, 467, 163, doi: 10.1051/0004-6361:20066537
- Pinte et al. (2018) Pinte, C., Price, D. J., Ménard, F., et al. 2018, ApJ, 860, L13, doi: 10.3847/2041-8213/aac6dc
- Rosotti et al. (2016) Rosotti, G. P., Juhasz, A., Booth, R. A., & Clarke, C. J. 2016, MNRAS, 459, 2790, doi: 10.1093/mnras/stw691
- Teague et al. (2018a) Teague, R., Bae, J., Bergin, E. A., Birnstiel, T., & Foreman-Mackey, D. 2018a, ApJ, 860, L12, doi: 10.3847/2041-8213/aac6d7
- Teague et al. (2018b) Teague, R., Bae, J., Birnstiel, T., & Bergin, E. A. 2018b, ApJ, 868, 113, doi: 10.3847/1538-4357/aae836
- Teague et al. (2017) Teague, R., Semenov, D., Gorti, U., et al. 2017, ApJ, 835, 228, doi: 10.3847/1538-4357/835/2/228
- van Boekel et al. (2017) van Boekel, R., Henning, T., Menu, J., et al. 2017, ApJ, 837, 132, doi: 10.3847/1538-4357/aa5d68
- Visser et al. (2009) Visser, R., van Dishoeck, E. F., & Black, J. H. 2009, A&A, 503, 323, doi: 10.1051/0004-6361/200912129
- Watson (1976) Watson, W. D. 1976, Reviews of Modern Physics, 48, 513, doi: 10.1103/RevModPhys.48.513
- Wilson (1999) Wilson, T. L. 1999, Reports on Progress in Physics, 62, 143, doi: 10.1088/0034-4885/62/2/002
- Winnewisser et al. (1997) Winnewisser, G., Belov, S. P., Klaus, T., & Schieder, R. 1997, J. Mol. Spectrosc, 184, 468
- Winnewisser et al. (1985) Winnewisser, M., Winnewisser, B. P., & Winnewisser, G. 1985, Mol. Astrophys. ser. C, 157, 375
- Zhang et al. (2016) Zhang, K., Bergin, E. A., Blake, G. A., et al. 2016, ApJ, 818, L16, doi: 10.3847/2041-8205/818/1/L16