Real-Time Carbon Accounting Method for the European Electricity Markets
Abstract
Electricity accounts for 25% of global greenhouse gas emissions. Reducing emissions related to electricity consumption requires accurate measurements readily available to consumers, regulators and investors. In this case study, we propose a new real-time consumption-based accounting approach based on flow tracing. This method traces power flows from producer to consumer thereby representing the underlying physics of the electricity system, in contrast to the traditional input-output models of carbon accounting. With this method we explore the hourly structure of electricity trade across Europe in 2017, and find substantial differences between production and consumption intensities. This emphasizes the importance of considering cross-border flows for increased transparency regarding carbon emission accounting of electricity.
keywords:
carbon accounting , carbon emission , carbon intensity , flow tracing1 Introduction
For several decades, more than 80% of the global electricity generation has been generated from fossil fuel [1]. As a result, electricity and heat production account for 25% of global greenhouse gas (GHG) emissions [2]. Furthermore, electricity demand is widely expected to rise because of electrification of vehicles [3]. These facts highlight the importance of an accurate and transparent carbon emission accounting system for electricity.
Reducing emissions related to electricity consumption requires accurate measurements readily available to consumers, regulators and investors [4]. In the GHG protocol [5], “Scope 2 denotes the point-of-generation emissions from purchased electricity (or other forms of energy)” [4]. A major challenge regarding Scope 2 emissions is the fact that it is not possible to trace electricity from a specific generator to a specific consumer [6, 7]. This has lead to the use of two different accounting methods: the of grid average emission factors or the market-based method [4, 7]. Grid average factors are averaged over time and therefore not specific to the time of consumption due to limited availability of emission factors with high temporal resolution. The market based method entails purchasing contractual emission factors in the form of different types of certificates, which do not affect the amount of renewable electricity being generated, and therefore fail to provide accurate information in GHG reports. For a detailed criticism of both approaches, see [4].
In this case study, we propose a new method for real-time carbon accounting based on flow tracing techniques. This method is applied to hourly market data for 28 areas within Europe. We use this method to introduce a new consumption-based accounting method that represents the underlying physics of the electricity system in contrast to the traditional input-output models of carbon accounting [8, 9, 10]. The approach advances beyond [11], where a similar flow tracing methodology is used to create a consumption-based carbon allocation between six Chinese regions. However, the data for that study was limited to annual aggregates and different generation technologies were also aggregated. We apply the method to real-time system data, including the possibility of distinguishing between different generation technologies, providing a real-time CO2 signal for all actors involved. This increases the overall transparency and credibility of emission accounting related to electricity consumption, which is of high importance [12]. To investigate the impact of the new consumption-based accounting method we compare it with the straightforward production-based method (i.e. looking at the real-time generation mix within each area). For discussions on the shift from production-based to consumption-based accounting and the idea of sharing the responsibility between producer and consumer, we refer to [13, 14].
2 Methods
2.1 Data
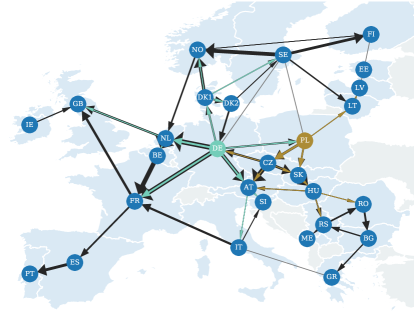
The method is applied to data from the electricityMap database [15], which collects real-time data from electricity generation and imports/exports around the world. The European dataset, consisting of 28 areas, is used with hourly resolution for the year 2017. Data sources for each individual area can be found on the project’s webpage [16]. Figure 1 shows the 28 areas and the 47 interconnectors considered. Power flows to and from neighboring areas, e.g. Switzerland, are included when available. The black arrows show a snapshot of hourly power flows between the areas. In the results, we aggregate the two price areas of Denmark and, thus, compare 27 countries.
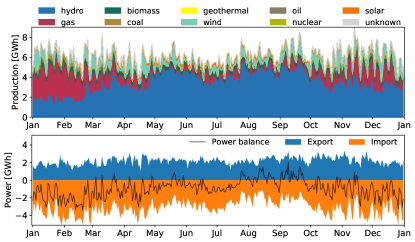
The top panel of Figure 2 shows stacked daily-average production for each technology for Austria. The bottom panel shows daily-average exports and imports. The black line represents the sum of the hourly exports and imports showing Austria’s net import/export position. The daily averages in this figure are based on the full 8760 hours in the dataset representing the full year 2017.
| Technology | Intensity [kgCO2eq/MWh] |
|---|---|
| solar | 0.00410 |
| geothermal | 0.00664 |
| wind | 0.141 |
| nuclear | 10.3 |
| hydro | 16.2 |
| biomass | 50.9 |
| \hdashlinegas | 583 |
| unknown | 927 |
| oil | 1033 |
| coal | 1167 |
Carbon emission intensities are derived from the ecoinvent 3.4 database to construct an accurate average intensity per generation technology per country decomposed in lifecycle, infrastructure and operations [17]. The operations intensities are used for the production and consumption-based carbon allocation in this study. Operational emissions include all emissions occurring over the fuel chain (from extraction to supply at plant) as well as direct emissions on site. For fossil fuels, operational emissions are therefore higher than only direct combustion emissions. For solar, geothermal and wind, the emissions are strictly from maintenance operations.
The operations intensity per technology averaged over all countries is summarized in Table 1. The dashed line indicates the split between non-fossil and fossil technologies. For details on country-specific values, see Table 1–3 in the supplementary material.
2.2 Carbon emission allocation
The consumption-based accounting method proposed in this case study builds on flow tracing techniques. Flow tracing was originally introduced as a method for transmission loss allocation and grid usage fees [18, 19]. It follows power flows on the transmission network mapping the paths between the location of generation and the location of consumption. It works in such a way that each technology for each country is assigned a unique color mathematically. This is a mathematical abstraction since it is not physically possible to color power flows. For each hour local production and imported flows are assumed to mix evenly at each node in the transmission network (see Figure 1) and determine the color mix of the power serving the demand and the exported flows. As an example, the colored arrows in Figure 1 show the cascade of power flows resulting from flow tracing of German wind power (light blue) and Polish coal power (brown) for the first hour of January 1st, 2017. The size of the colored arrows shows how much of the total power flow (in black) is accounted for. A threshold has been applied such that the technology specific flows are only shown if they account for at least 2% of the total power flow for each interconnector.
Flow tracing has been proposed as the method for flow allocation in the Inter-Transmission System Operator Compensation mechanism for transit flows [20, 21]. Recently, the method has been applied to various aspects of power system models to allocate transmission network usage [22, 23], a generalization that allows associating power flows on the grid to specific regions or generation technologies [24], creating a flow-based nodal levelized cost of electricity [25], and analyzing the usage of different storage technologies [26].
The challenge of cross-border power flows in relation to carbon emission accounting has previously been studied in [6, 11]. Both studies simplify nodes as being either net importers or net exporters and neither are able to distinguish between different generation technologies. Those simplifications are not necessary in our approach as we can deal with both imports, exports, consumption and generation simultaneously at every node while also distinguishing between different generation technologies. Additionally, Figure 1 exhibits loop flows. However, these do not affect the validity of the flow tracing methodology [11], and no effort has been made to eliminate them as they occur naturally in the transmission system at the area level [27].
Flow tracing methods are almost unanimously applied to simulation data – typically with high shares of renewable energy. In this case study, we apply the flow tracing method to hourly time series from the electricityMap [16]. From this we are able to map the power flows between exporting and importing countries for each type of generation technology for every hour of the time series. Applying country-specific average carbon emission intensity per generation technology to this mapping, we construct a consumption-based carbon accounting method. For details on the mathematical definitions, see Section B in the supplementary material.
The production-based accounting method used for comparison, is calculated as the carbon intensity from local generation within each country.
3 Results
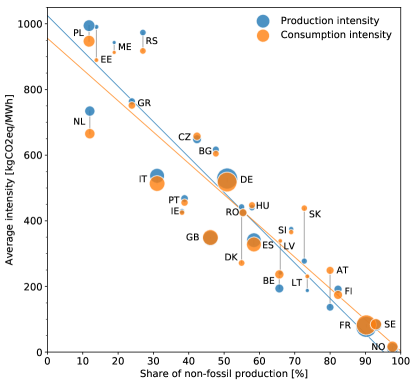
Figure 3 shows a comparison of average production and consumption intensity as a function of the share of non-fossil generation in each country’s generation mix. The consumption intensity is calculated using flow tracing. The size of the circles is proportional to the average hourly generation and consumption in MWh, respectively. A vertical gray line connects the production and consumption intensity corresponding to the same country. We see a decline in intensity with increasing share of non-fossil generation. For high shares of non-fossil generation, the consumption intensity tends to be higher than the production intensity due to imports from countries with higher production intensity. The pattern is reversed for low shares of non-fossil generation. The values plotted in this figure are shown in Table 4 in the supplementary material.
Some countries exhibit a huge difference between production and consumption intensity. An example of this is Slovakia (SK), which has a high share of nuclear power and Austria (AT), which has a high share of hydro power, but both rely heavily on imports of large amounts of coal power especially from Poland (PL) and Czech Republic (CZ). Denmark (DK) is an extreme example of the opposite case, having a high share of coal and gas power and importing large amounts of hydro and nuclear power from Norway (NO) and Sweden (SE).
While this figure only shows average values, Figure 7 in the supplementary material highlights the interval of hourly variation of production and consumption intensity per country. This interval is high for all countries except the ones with very high non-fossil share (FR, SE, NO).
From a national perspective, it is important to know the source electricity that is being imported, and whether it increases a country’s reliance on high-carbon, insecure, or otherwise undesirable sources of generation.
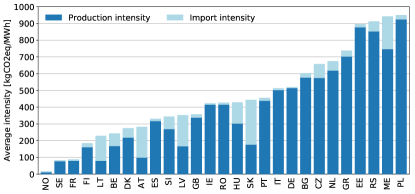
Figure 4 shows the consumption-based intensity per country. The height of each bar corresponds to the consumption intensity for each country shown in Figure 3. This figure decomposes the consumption intensity for each country and shows how much of a particular country’s consumption intensity is caused by the local generation mix compared with the generation mix of imported power. We see that for many countries it is important to be able to distinguish between local generation and imports since the imports make a substantial contribution to the country’s consumption-based emission. In cases with a large difference between the intensity of local power production and the imported power, imports have a high impact. As mentioned in an earlier example, this is the case for both Austria and Slovakia. For details on the average intensity of imports and exports between the countries, see Figure 9 and Table 5 in the supplementary material.
4 Conclusion
We introduce a new method for consumption-based carbon emission allocation based on flow tracing applied to a historical sample of real-time system data from the electricityMap.
The method we propose demonstrates that consumption-based accounting is more difficult than production-based due to the added complexity of cross-border flows. However, with this method we have found substantial differences between production and consumption intensities for each country considered, which follow a trend proportional to the share of non-fossil generation technologies. It would be straightforward to subsequently apply these results to attribute carbon emissions to individual consumers like companies or households.
The difference between production and consumption intensities and the associated impact of imports on average consumption intensity emphasize the importance of including cross-border flows for increased transparency regarding carbon emission accounting of electricity. While there are limitations to the accuracy of this method due to data availability and the mathematical abstraction of flow tracing, we believe that this method provides the first step in a new direction for carbon emission accounting of electricity.
This case study focuses on the European electricity system. When additional sources of live system data become available this approach could be extended to cover a wider geographical area. Even for areas without significant import and export the method could be applied within a single country provided that local system data is available at high spatial resolution. Another interesting application of this method would be to include additional sectors such as heating and transport as these are becoming electrified. This could lead to a real-time carbon emission signal for the entire energy system and potentially lay the foundation for time-varying electricity taxes.
Acknowledgments
Gorm Bruun Andresen acknowledges the APPLAUS project for financial support. Iain Staffell acknowledges the Engineering and Physical Sciences Research Council (EPSRC) for funding via project EP/N005996/1. We thank Mirko Schäfer for helpful discussions.
References
References
- [1] International Energy Agency, World Energy Balances 2018 (2018).
- [2] D. G. Victor, D. Zhou, E. H. M. Ahmed, P. K. Dadhich, J. G. J. Olivier, H.-H. Rogner, K. Sheikho, M. Yamaguchi, Introductory chapter. in: Climate change 2014: Mitigation of climate change. contribution of working group iii to the fifth assessment report of the intergovernmental panel on climate change (2014).
- [3] International Energy Agency, Global EV Outlook 2018 (2018).
- [4] M. Brander, M. Gillenwater, F. Ascui, Creative accounting: A critical perspective on the market-based method for reporting purchased electricity (scope 2) emissions, Energy Policy 112 (2018) 29 – 33.
- [5] World Resource Institute, GHG Protocol Scope 2 Guidance (2015).
- [6] S. Jiusto, The differences that methods make: Cross-border power flows and accounting for carbon emissions from electricity use, Energy Policy 34 (17) (2006) 2915 – 2928.
- [7] H. L. Raadal, Greenhouse gas (GHG) emissions from electricity generation systems Tracking and claiming in environmental reporting (2013).
- [8] J.-L. Fan, Y.-B. Hou, Q. Wang, C. Wang, Y.-M. Wei, Exploring the characteristics of production-based and consumption-based carbon emissions of major economies: A multiple-dimension comparison, Applied Energy 184 (2016) 790 – 799.
- [9] Z. Zhang, J. Lin, From production-based to consumption-based regional carbon inventories: Insight from spatial production fragmentation, Applied Energy 211 (2018) 549 – 567.
- [10] J. Clauß, S. Stinner, C. Solli, K. B. Lindberg, H. Madsen, L. Georges, A generic methodology to evaluate hourly average CO2eq. intensities of the electricity mix to deploy the energy flexibility potential of Norwegian buildings, in: 10th International Conference on System Simulation in buildings, 2018.
- [11] B. Li, Y. Song, Z. Hu, Carbon flow tracing method for assessment of demand side carbon emissions obligation, IEEE Transactions on Sustainable Energy 4 (4) (2013) 1100–1107.
- [12] J. Sjödin, S. Grönkvist, Emissions accounting for use and supply of electricity in the nordic market, Energy Policy 32 (13) (2004) 1555 – 1564.
- [13] M. Lenzen, J. Murray, F. Sack, T. Wiedmann, Shared producer and consumer responsibility — theory and practice, Ecological Economics 61 (1) (2007) 27 – 42.
- [14] G. P. Peters, From production-based to consumption-based national emission inventories, Ecological Economics 65 (1) (2008) 13 – 23.
- [15] Tomorrow, electricityMap Database (Accessed December 2018).
- [16] Tomorrow, electricityMap (Accessed December 2018).
- [17] G. Wernet, C. Bauer, B. Steubing, J. Reinhard, E. Moreno-Ruiz, B. Weidema, The ecoinvent database version 3 (part I): overview and methodology, The International Journal of Life Cycle Assessment 21 (9) (2016) 1218–1230.
- [18] J. W. Bialek, Tracing the flow of electricity, IEE Proceedings - Generation, Transmission and Distribution 143 (4) (1996) 313–320.
- [19] D. Kirschen, R. Allan, G. Strbac, Contributions of individual generators to loads and flows, IEEE Transactions on Power Systems 12 (1997) 52–60.
- [20] CONSENTEC, Frontier Economics, Study on the further issues relating to the inter-TSO compensation mechanism, Final Report, Study commissioned by the European Commission Directorate-General Energy and Transport (2006).
- [21] ACER, On a new regulatory framework for the inter-transmission system operator compensation (2013).
- [22] B. Tranberg, A. Thomsen, R. Rodriguez, G. Andresen, M. Schäfer, M. Greiner, Power flow tracing in a simplified highly renewable European electricity networks, New Journal of Physics 17 (2015) 105002.
- [23] M. Schäfer, B. Tranberg, S. Hempel, S. Schramm, M. Greiner, Decompositions of injection patterns for nodal flow allocation in renewable electricity networks, The European Physical Journal B 90 (8) (2017) 144.
- [24] J. Hörsch, M. Schäfer, S. Becker, S. Schramm, M. Greiner, Flow tracing as a tool set for the analysis of networked large-scale renewable electricity systems, International Journal of Electrical Power & Energy Systems 96 (2018) 390 – 397.
- [25] B. Tranberg, L. J. Schwenk-Nebbe, M. Schäfer, J. Hörsch, M. Greiner, Flow-based nodal cost allocation in a heterogeneous highly renewable european electricity network, Energy 150 (2018) 122 – 133.
- [26] B. Tranberg, M. Schäfer, T. Brown, J. Hörsch, M. Greiner, Flow-based analysis of storage usage in a low-carbon european electricity scenario, in: 2018 15th International Conference on the European Energy Market (EEM), 2018, pp. 1–5.
- [27] F. Kunz, Quo vadis? (un)scheduled electricity flows under market splitting and network extension in central europe, Energy Policy 116 (2018) 198 – 209.
See pages - of supplementary