Neutron star cooling with microscopic equations of state
Abstract
We model neutron star cooling with several microscopic nuclear equations of state based on different nucleon-nucleon interactions and three-body forces, and compatible with the recent GW170817 neutron star merger event. They all feature strong direct Urca processes. We find that all models are able to describe well the current set of cooling data for isolated neutron stars, provided that large and extended proton gaps and no neutron gaps are active in the stellar matter. We then analyze the neutron star mass distributions predicted by the different models and single out the preferred ones.
keywords:
stars: neutron – dense matter – equation of state.1 Introduction
The recently observed first neutron star (NS) merger event GW170817 (Abbott et al., 2017) has allowed to substantially restrict the freedom of constructing NS equations of state (EOS) compatible with observation. In particular the determination of the NS tidal compressibility allowed to derive severe constraints on the NS radii and the related stiffness of the NS EOS (Radice et al., 2018; Paschalidis et al., 2018; Burgio et al., 2018; Wei et al., 2018). It turns out that microscopic EOSs compatible with those constraints are rather stiff and feature fairly large proton fractions in the stellar matter, which in turn implies the presence of the extremely strong Direct Urca (DU) neutrino cooling process over an extended range of density in NS matter.
This allows to take a fresh look at the phenomenon of NS cooling, where for a long time EOSs featuring DU cooling have been disregarded in the so-called minimal cooling paradigm (Page et al., 2004), which imposed a strong bias on the choice of the NS EOS. In fact many microscopic nuclear EOSs do reach easily the required proton fractions for the DU process (Li & Schulze, 2008; Burgio & Schulze, 2010; Li et al., 2012; Taranto et al., 2013), and we have already shown in Taranto et al. (2016); Fortin et al. (2018) that a microscopic EOS featuring strong DU processes is very well able to describe current cooling observations of isolated NSs as well as the reheated cooling of the accreting NSs in X-ray transients in quiescence (Yakovlev & Pethick, 2004; Beznogov & Yakovlev, 2015a, b), provided the DU process is dampened by the presence of nuclear pairing throughout a sufficiently large (but not complete) set of the NS population.
The purpose of this work is to extend the cooling simulations of Taranto et al. (2016); Fortin et al. (2018), where only one specific microscopic EOS was used, to three other microscopic EOSs that have also been identified as compatible with the GW170817 event in Burgio et al. (2018); Wei et al. (2018). All these EOSs fulfill upper and lower constraints on the tidal compressibility derived from the interpretation of the merger event. We investigate now which specific features of the EOSs determine the NS cooling properties and compare the results obtained with the four EOSs.
This paper is organized as follows. In Section 2 we give a brief overview of the theoretical framework, namely the Brueckner-Hartree-Fock (BHF) formalism adopted for the EOS, the various cooling processes, and the pairing gaps obtained with the same interactions. Section 3 is devoted to the presentation and discussion of the results for the cooling diagrams and the deduced NS mass distributions. Conclusions are drawn in Section 4.
2 Formalism
2.1 Equation of state
One of the key ingredients of cooling simulations is the EOS. In this paper we assume (without further justification) the absence of exotic components like hyperons and/or quark matter, such that the composition of the NS core is asymmetric, charge-neutral, and beta-stable matter made of nucleons and leptons.
In our model, we calculate the EOS of nuclear matter within the BHF theoretical approach (Jeukenne et al., 1976; Baldo, 1999; Baldo & Burgio, 2012), in which the starting point is the Brueckner-Bethe-Goldstone equation for the in-medium -matrix, whose only input is the nucleon-nucleon (NN) bare potential ,
| (1) |
where is the nucleon number density, is the starting energy, and the Pauli operator determines the propagation of intermediate baryon pairs. The single-particle (s.p.) energy reads ()
| (2) |
where the s.p. potential is calculated in the so-called continuous choice and is given by
| (3) |
where the subscript indicates antisymmetrization of the matrix element. Finally the energy per nucleon is expressed by
| (4) |
In this scheme, we use several different nucleon-nucleon potentials as bare NN interaction in the Bethe-Goldstone equation (1), in particular the Argonne (Wiringa et al., 1995), the Bonn B (BOB) (Machleidt et al., 1987; Machleidt, 1989), and the Nijmegen 93 (N93) (Nagels et al., 1978; Stoks et al., 1994). These two-body forces are supplemented by suitable three-nucleon forces (TBF), which are introduced in order to reproduce correctly the nuclear matter saturation point. In particular, BOB and N93 have been supplemented by microscopic TBF employing the same meson-exchange parameters as the NN potential (Grangé et al., 1989; Zuo et al., 2002; Li et al., 2008; Li & Schulze, 2008), whereas is combined either with the microscopic or a phenomenological TBF, the latter consisting of an attractive term due to two-pion exchange with excitation of an intermediate resonance, and a repulsive phenomenological central term (Carlson et al., 1983; Schiavilla et al., 1986; Pudliner et al., 1997; Baldo et al., 1997). They are labeled as V18 and UIX, respectively, throughout the paper and in all figures.
Further important ingredients in the cooling simulations are the neutron and proton effective masses,
| (5) |
which we derived consistently from the BHF s.p. energy , Eq. (2), see Baldo et al. (2014) for the numerical parametrizations. Their effect is small compared to other uncertainties regarding the cooling, and therefore in this paper we use the bare nucleon mass, at variance with our previous simulations (Taranto et al., 2016), where the effective masses were used in a consistent manner.
2.2 Cooling processes
One important tool of analysis is the temperature(or luminosity)-vs.-age cooling diagram, in which currently a few () observed isolated NSs are located. NS cooling is over a vast domain of time () dominated by neutrino emission due to several microscopic processes (Yakovlev et al., 2001; Page & Reddy, 2006; Page et al., 2006; Lattimer & Prakash, 2007; Potekhin et al., 2015). The theoretical analysis of these reactions requires the knowledge of the elementary matrix elements, the relevant beta-stable nuclear EOS, and, very important, the superfluid properties of the stellar matter, i.e., the gaps and critical temperatures in the different pairing channels.
The main contribution to the cooling comes from the neutrons, protons, and electrons in the NS core. In a non-superfluid NS, the most powerful neutrino process is the DU process, which is in fact the neutron -decay followed by its inverse reaction:
| (6) |
However, the energy and momentum conservation imposes a density threshold on this process (Lattimer et al., 1991). Various less efficient neutrino processes may be operating in the NS core (Yakovlev et al., 2001), and dominate when the DU process is forbidden or strongly reduced. The two main ones are the so-called modified Urca (MU) process:
| (7) |
where is a spectator nucleon that ensures momentum conservation, and the nucleon-nucleon bremsstrahlung:
| (8) |
with a nucleon and , an (anti)neutrino of any flavor.
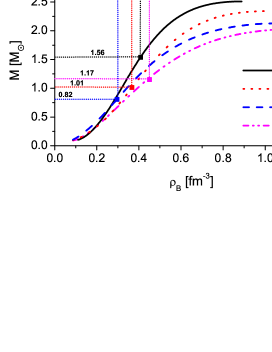
For the different EOSs used in this work, the DU process sets in at slightly different values of the proton fraction due to the presence of muons, as shown in Fig. 1. The threshold values are calculated starting from Eq. (6), in which the momentum conservation imposes the triangle rule, i.e.,
| (9) |
This is indicated by the vertical dotted lines in Fig. 1 for the different EOSs, and is comprised in the range . It is important to determine at which corresponding value of the nucleon density of beta-stable and charge-neutral matter the DU process sets in, because compact stars characterized by central densities larger than will cool down very rapidly. This is also displayed in Fig. 1 and occurs in a density range between 0.30 and 0.45 depending on the EOS. In the lower panel we display the NS mass-central density relations obtained by solving the Tolman-Oppenheimer-Volkoff equations for hydrostatic equilibrium. The NS masses corresponding to the central densities span a range between 0.82 (N93) and 1.56 (BOB) , above which the DU process can potentially operate. We notice that in all cases the value of the maximum mass is larger than the current observational lower limits (Demorest et al., 2010; Antoniadis et al., 2013; Fonseca et al., 2016).
The main results for , , , and are also listed in Table 1. We conclude that in all cases there is a wide range of NS masses where the DU process is operative, practically for all NSs with the V18 and N93 EOSs, while only for the BOB EOS the threshold is high, but in this case also is very large.
| EOS | ||||||
|---|---|---|---|---|---|---|
| BOB | 0.1357 | 0.41 | 1.56 | 0.59 | 2.23 | 2.51 |
| V18 | 0.1348 | 0.37 | 1.01 | 0.60 | 1.91 | 2.34 |
| N93 | 0.1331 | 0.30 | 0.82 | 0.52 | 1.59 | 2.13 |
| UIX | 0.1363 | 0.45 | 1.17 | 0.70 | 1.70 | 2.04 |
We finally remind the possible strong constraints on NS cooling imposed by the speculated very rapid cooling of the supernova remnant Cas A (Ho & Heinke, 2009; Heinke & Ho, 2010; Elshamouty et al., 2013; Ho et al., 2015), which we have studied in detail in Taranto et al. (2016). As the observational claims remain highly debated (Posselt et al., 2013; Posselt & Pavlov, 2018), we do not consider this scenario in this work.
2.3 Pairing gaps
The effect of the neutron or proton superfluidity in the dominant 1S0 and 3P2 channels on the neutrino emissivity is twofold (Yakovlev et al., 2001). On one hand, when the temperature decreases below the critical superfluid temperature of a given type of baryons, the neutrino emissivity of processes involving a superfluid baryon is exponentially reduced, together with the specific heat of that component. For example, proton superfluidity in the core of a NS suppresses both Urca processes but does not affect the neutron-neutron bremsstrahlung. On the other hand, the pairing of baryons initiates a new type of neutrino reactions called the pair breaking and formation (PBF) processes. The energy is released in the form of a neutrino-antineutrino pair when a Cooper pair of baryons is formed. The process starts when , is maximally efficient when , and is exponentially suppressed for (Yakovlev et al. 2001). Therefore an essential ingredient for cooling simulations is the knowledge of the pairing gaps for neutrons and protons in beta-stable matter.
In a previous paper (Taranto et al., 2016) we presented calculations obtained using gaps computed consistently with the EOS, i.e., based on the same NN interaction and using the same medium effects (TBF and effective masses), as shown in Zhou et al. (2004). In this work we extend those studies by employing different nucleonic potentials. Before illustrating the new results, we remind the reader that the pairing gaps were computed on the BCS level by solving the (angle-averaged) gap equation (Amundsen & Østgaard, 1985; Baldo et al., 1992; Takatsuka & Tamagaki, 1993; Elgarøy et al., 1996; Khodel et al., 1998; Baldo et al., 1998) for the (1S0 gaps) and the two-component (3P2 gaps) gap functions,
| (10) |
with
| (11) |
while fixing the (neutron or proton) density,
| (12) |
Here are the BHF s.p. energies, Eq. (2), containing contributions due to two-body and three-body forces, is the chemical potential determined self-consistently from Eqs. (10–12), and
| (13) |
are the relevant potential matrix elements ( and ; for the 1S0 channel, ; for the 3P2 channel). The relation between (angle-averaged) pairing gap at zero temperature obtained in this way and the critical temperature of superfluidity is then .
In Taranto et al. (2016); Fortin et al. (2018) we concluded that a very good description of cooling properties can be obtained by just using the (eventually scaled) BCS values in the p1S0 channel and disregarding any pairing in the n3P2 channel. The complete suppression of the 3P2 gaps could be caused by polarization corrections (Lombardo & Schulze, 2001; Khodel et al., 2004; Schwenk & Friman, 2004; Baldo & Schulze, 2007; Gandolfi et al., 2008; Ding et al., 2016), which for the 1S0 channel are known to be repulsive, but for the 3P2 are still essentially unknown; and this might change the value of these gaps even by orders of magnitude.
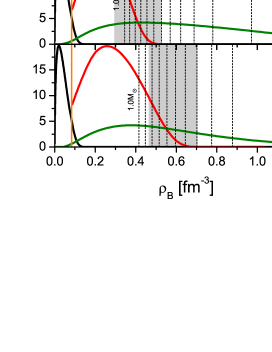
For illustration we display in Fig. 2 the BCS pairing gaps and critical temperatures as a function of baryonic density of beta-stable matter for the different EOSs. In this way one can easily identify which range of gaps is active in different stars, whose central densities are shown by vertical dotted lines for given NS masses.
Regarding the p1S0 pairing, an important information is the density at which the BCS gap disappears, and the corresponding NS mass with that central density. The DU process can only be completely blocked for NSs with , whereas for heavier stars it is active and unblocked in a certain domain of the core, which leads to extremely fast cooling of these objects. The value of is also listed in Table 1 and together with determines the ranges of blocked and unblocked DU cooling. We observe that for the BOB, V18, UIX, N93 EOS the DU blocking terminates at , respectively, which implies very rapid cooling for heavier stars, reflected in the following cooling diagrams. The regions of blocked DU cooling are represented by shading in Fig. 2.
3 Results
Having quantitatively specified EOS and pairing gaps, the NS cooling simulations are carried out using the widely used code NSCool (Page, 2010), which comprises all relevant cooling reactions: DU, MU, PBF, and Bremsstrahlung, including modifications due to pairing discussed before. In order to assess the uncertainty of the heat-blanketing effect of the atmosphere, we compare in the following results obtained with a non-accreted heavy-elements (Fe) atmosphere and one containing also a maximum fraction of light elements from accretion, see Potekhin et al. (2003).
Our set of observational cooling data comprises the (age, temperature) information of the 19 isolated NS sources listed in Beznogov & Yakovlev (2015a), where it was also pointed out that in many cases the distance to the object, the composition of its atmosphere, thus its luminosity, and its age are rather estimated than measured. Thus in these cases, we use large error bars (a factor 0.5 and 2) to reflect this uncertainty.
3.1 Cooling diagrams
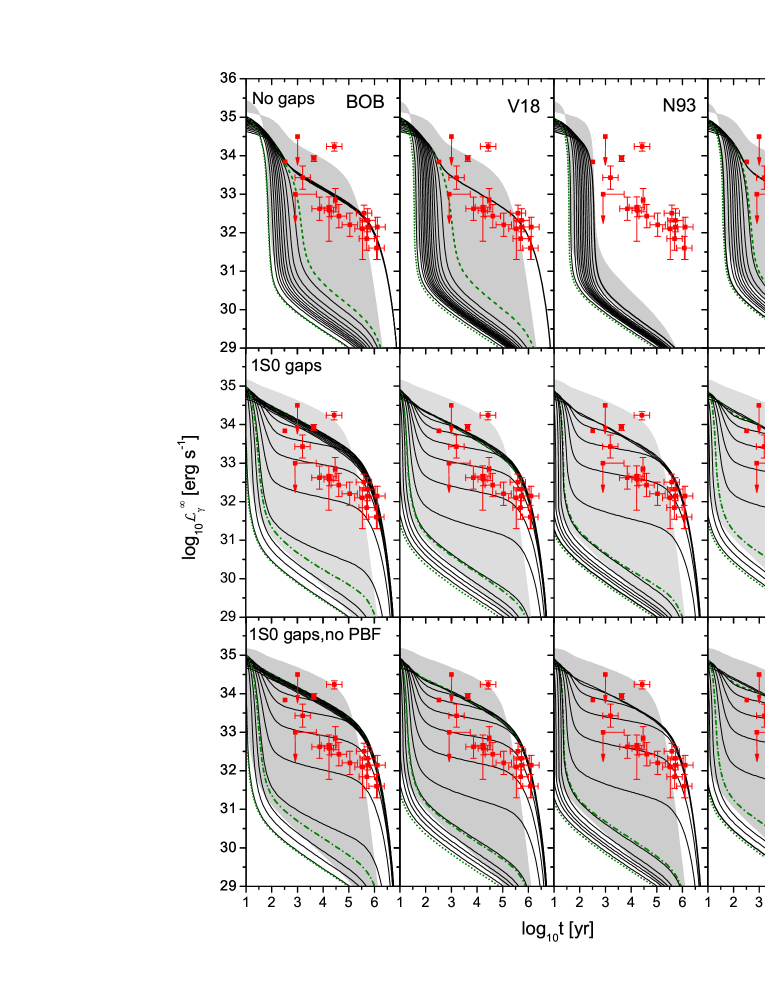
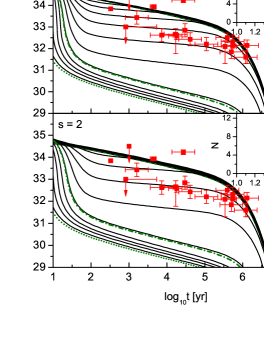
For a better understanding, we begin by discussing the simulations obtained with different EOSs without including any superfluidity. Results are displayed in Fig. 3 (upper panels), where the luminosity vs. age is plotted for several NS masses in the range . The dashed green curves mark the NS mass at which the DU process has just set in, whereas the dotted green curves correspond to the maximum mass .
The results are clearly unrealistic, as observed NSs would essentially be divided into very hot ones and very cold ones by the DU threshold , with very few stars in between: In a NS with , the DU process is turned off and therefore the total neutrino emissivity is orders of magnitude smaller than for a NS with a mass above the DU threshold. Consequently the former has at a given age has a much higher luminosity than the latter. All NSs with have a small neutrino emissivity, hence their cooling curves are nearly indistinguishable on the scale of Fig. 3, while for objects with , the larger is the mass and thus the bigger is the central region of the star where the DU process operates, the lower is the luminosity and the cooling curves are no longer superimposed.
This feature depends on the EOS as explained in Sect. 2.2. For example, in the N93 case the onset takes place at a very small value of the density and the related gravitational mass , and therefore all NS masses undergo DU processes. In the V18 case, the DU process starts for a 1.01 NS, and therefore only the first upper curve is influenced by MU alone, whereas the remaining ones are determined by DU cooling. The other EOSs have higher threshold values of for the UIX and BOB, respectively.
We now discuss the cooling curves switching on the n1S0 and p1S0 gaps, as shown in Fig. 3 (central panels). For the gaps used in this work, the main effect of superfluidity on NSs with (dashed green curves, partially covered) is the strong quenching of the DU process, and thus a substantial reduction of the total neutrino emissivity. Hence those stars have a higher luminosity compared to the non-superfluid case. On the other hand, if (dash-dotted green curves), the complete blocking of the DU process disappears and the star cools very rapidly again. One observes results in line with these features in the figure, namely between and there is now a smooth dependence of the luminosity on the NS mass for a given age. The effect is qualitatively the same for all EOSs, just the distribution of NS masses in the cooling diagram depends on the EOS, which will be analyzed in the next section.
Regarding the effect of the atmosphere models, we note that by assuming a proper atmosphere for any given data point, all current cooling data could potentially be explained in the present scenario, by assigning a Fe atmosphere (black curves) to the oldest objects and an accreted light-elements atmosphere (shaded area) to the hottest ones. The currently known most extrem object, XMMU J1731-347, (, ), is indeed supposed to have a carbon atmosphere, see the discussions in Beznogov & Yakovlev (2015a, b); Fortin et al. (2018).
Although in general the presence of superfluidity is slowing down the cooling, the PBF processes might prevail in certain situations and provide an accelerated cooling of certain stellar configurations (Page et al., 2011; Shternin et al., 2011; Yakovlev et al., 2011; Taranto et al., 2016). It is therefore of interest to show in Fig. 3 (lower panels) also results where the 1S0 PBF processes have been switched off by hand. It can be seen, however, that the effect of PBF cooling in the 1S0 channels is practically negligible.
We conclude that the BCS p1S0 gap alone is able to suppress sufficiently the DU cooling and to yield realistic cooling curves, provided that it extends over a large enough density/mass range. This is the case for all considered EOSs, which yield however different mass profiles in the luminosity vs. age plane. This illustrates the necessity of precise information on the masses of the NSs in the cooling diagram, without which no theoretical cooling model can be verified. We study this issue in some detail in the following.
3.2 Neutron star mass distributions
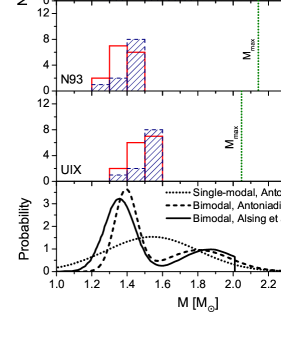
Assuming that the currently observed set of isolated NSs in the cooling diagrams of Fig. 3 reflects the unbiased mass distribution of NSs in the Universe (which is highly unlikely due to strong selection effects; for example, very old and massive NSs are too faint to be observed and would therefore never appear in the cooling diagrams. Also, the mass distribution of isolated NSs could be very different from those in binary systems, etc.), one can extract straightforwardly the predicted mass distribution of NSs from the figures. For simplicity we disregard the error bars in this analysis. The results are shown as histograms in Fig. 4, obtained directly from the binning in mass intervals in Fig. 3. One observes clear differences between the four EOSs, with surprisingly small dependence on the atmosphere model. The lowest panel provides for comparison a compilation of recent theoretical results for the NS mass distribution (Özel et al., 2012; Kiziltan et al., 2013; Antoniadis et al., 2016; Alsing et al., 2018). We stress again, however, that there is no good reason that the mass distribution extracted from the cooling data in this way should be similar to the overall mass distribution of NSs in the Universe or even to that of isolated NSs only.
Due to this problem and the scarcity of data, no firm conclusions can be drawn for the moment, apart from perhaps excluding the BOB model, which does not predict any mass even close to the NS canonical value of about . This model features also a very large , which seems to be in conflict with recent upper limits on derived from analysis of the NS merger event (Shibata et al., 2017; Margalit & Metzger, 2017; Rezzolla et al., 2018). On the other hand, the of the UIX EOS appears too small, which leaves as most realistic models either N93 or V18. Clearly more data points, ideally with assigned known masses, would be required for a more profound analysis of this kind.
To emphasize even more the value of data with well-assigned masses, we point out that the mass distributions do not only depend on the EOS, but also on the pairing gaps. For that purpose we plot in Fig. 5 the results obtained with the V18 model and applying different scaling factors to the 1S0 BCS gaps, which could be motivated by the polarization effects discussed in Sec. 2.3. One sees that while the overall coverage of the luminosity vs. age plane remains nearly unaffected, the deduced NS mass distributions (shown as insets) depend sensitively on the gap scaling factor. In the specific case, one would be able to exclude very large scaling factors, which is indeed physically reasonable. Of course, modifying also the density domain of the pairing, similar variations would be obtained in line with the considerations in Sec. 3.1. But we think it is premature to try to resolve this issue with the present set of cooling data.
4 Conclusions
Motivated by the recent availability of more stringent restrictions on the NS EOS provided by a NS merger event, we have analyzed in this work the predictions of some compatible microscopic BHF EOSs for the cooling properties of isolated NSs. All EOSs feature strong DU cooling for a wide range of masses and the presence of superfluidity is required for realistic cooling scenarios.
We find that assuming absence of n3P2 pairing and employing n1S0 and p1S0 BCS gaps with possible rather generous scaling factors, a reproduction of all current cooling data for isolated NSs can be achieved with any of the proposed EOSs. A naive and straightforward analysis of the deduced NS mass distribution would exclude only the stiffest BOB EOS, which also predicts a fairly large maximum mass.
The combined and consistent analysis of different aspects of NS physics like mergers, radius measurements, and cooling will allow in the future an always more accurate derivation of the nuclear EOS, also in view of the possible presence of exotic components like quarks or hyperons, which was excluded from the start in the present work, but will be addressed in the future.
Acknowledgments
We acknowledge helpful discussions with M. Fortin and financial support from “PHAROS,” COST Action CA16214, and the China Scholarship Council (CSC File No. 201706410092).
References
- Abbott et al. (2017) Abbott B., et al., 2017, Phys. Rev. Lett., 119, 161101
- Alsing et al. (2018) Alsing J., Silva H. O., Berti E., 2018, MNRAS, 478, 1377
- Amundsen & Østgaard (1985) Amundsen L., Østgaard E., 1985, Nuclear Phys. A, 442, 163
- Antoniadis et al. (2013) Antoniadis J., et al., 2013, Science, 340, 6131
- Antoniadis et al. (2016) Antoniadis J., Tauris T. M., Ozel F., Barr E., Champion D. J., Freire P. C. C., 2016, preprint, (arXiv:1605.01665)
- Baldo (1999) Baldo M., 1999, Int. Rev. Nucl. Phys., World Scientific, Singapore, vol.8,
- Baldo & Burgio (2012) Baldo M., Burgio G. F., 2012, Rep. Prog. Phys., 75, 026301
- Baldo & Schulze (2007) Baldo M., Schulze H.-J., 2007, Phys. Rev. C, 75, 025802
- Baldo et al. (1992) Baldo M., Cugnon J., Lejeune A., Lombardo U., 1992, Nuclear Phys. A, 536, 349
- Baldo et al. (1997) Baldo M., Bombaci I., Burgio G. F., 1997, Astron. Astroph., 328, 274
- Baldo et al. (1998) Baldo M., Elgarøy Ø., Engvik L., Hjorth-Jensen M., Schulze H.-J., 1998, Phys. Rev. C, 58, 1921
- Baldo et al. (2014) Baldo M., Burgio G. F., Schulze H.-J., Taranto G., 2014, Phys. Rev. C, 89, 048801
- Beznogov & Yakovlev (2015a) Beznogov M. V., Yakovlev D. G., 2015a, MNRAS, 447, 1598
- Beznogov & Yakovlev (2015b) Beznogov M. V., Yakovlev D. G., 2015b, MNRAS, 452, 540
- Burgio & Schulze (2010) Burgio G. F., Schulze H.-J., 2010, A&A, 518, A17
- Burgio et al. (2018) Burgio G. F., Drago A., Pagliara G., Schulze H. J., Wei J. B., 2018, Astrophys. J., 860, 139
- Carlson et al. (1983) Carlson J., Pandharipande V., Wiringa R. B., 1983, Nuclear Phys. A, 401, 59
- Demorest et al. (2010) Demorest P. B., Pennucci T., Ransom S. M., Roberts M. S., Hessels J. W., 2010, Nature, 467, 1081
- Ding et al. (2016) Ding D., Rios A., Dussan H., Dickhoff W. H., Witte S. J., Carbone A., Polls A., 2016, Phys. Rev. C, 94, 025802
- Elgarøy et al. (1996) Elgarøy Ø., Engvik L., Hjorth-Jensen M., Osnes E., 1996, Nuclear Phys. A, 607, 425
- Elshamouty et al. (2013) Elshamouty K. G., Heinke C. O., Sivakoff G. R., Ho W. C. G., Shternin P. S., Yakovlev D. G., Patnaude D. J., David L., 2013, ApJ, 777, 22
- Fonseca et al. (2016) Fonseca E., et al., 2016, Astrophys. J., 832, 167
- Fortin et al. (2018) Fortin M., Taranto G., Burgio G. F., Haensel P., Schulze H.-J., Zdunik J. L., 2018, MNRAS, 475, 5010
- Gandolfi et al. (2008) Gandolfi S., Illarionov A. Y., Fantoni S., Pederiva F., Schmidt K. E., 2008, Phys. Rev. Lett., 101, 132501
- Grangé et al. (1989) Grangé P., Lejeune A., Martzolff M., Mathiot J.-F., 1989, Phys. Rev. C, 40, 1040
- Heinke & Ho (2010) Heinke C. O., Ho W. C. G., 2010, ApJ, 719, L167
- Ho & Heinke (2009) Ho W. C. G., Heinke C. O., 2009, Nature, 462, 71
- Ho et al. (2015) Ho W. C. G., Elshamouty K. G., Heinke C. O., Potekhin A. Y., 2015, Phys. Rev. C, 91, 015806
- Jeukenne et al. (1976) Jeukenne J. P., Lejeune A., Mahaux C., 1976, Phys. Rep., 25, 83
- Khodel et al. (1998) Khodel V. A., Khodel V. V., Clark J. W., 1998, Phys. Rev. Lett., 81, 3828
- Khodel et al. (2004) Khodel V. A., Clark J. W., Takano M., Zverev M. V., 2004, Phys. Rev. Lett., 93, 151101
- Kiziltan et al. (2013) Kiziltan B., Kottas A., De Yoreo M., Thorsett S. E., 2013, ApJ, 778, 66
- Lattimer & Prakash (2007) Lattimer J. M., Prakash M., 2007, Phys. Rep., 442, 109
- Lattimer et al. (1991) Lattimer J. M., Pethick C. J., Prakash M., Haensel P., 1991, Physical Review Letters, 66, 2701
- Li & Schulze (2008) Li Z. H., Schulze H.-J., 2008, Phys. Rev. C, 78, 028801
- Li et al. (2008) Li Z., Lombardo U., Schulze H.-J., Zuo W., 2008, Phys. Rev. C, 77, 034316
- Li et al. (2012) Li Z.-H., Zhang D.-P., Schulze H.-J., Zuo W., 2012, Chinese Physics Letters, 29, 012101
- Lombardo & Schulze (2001) Lombardo U., Schulze H.-J., 2001, in Blaschke D., Glendenning N. K., Sedrakian A., eds, Lecture Notes in Physics, Berlin Springer Verlag Vol. 578, Physics of Neutron Star Interiors. p. 30 (arXiv:astro-ph/0012209)
- Machleidt (1989) Machleidt R., 1989, Advances in Nuclear Physics. Springer US, pp 189–376
- Machleidt et al. (1987) Machleidt R., Holinde K., Elster C., 1987, Phys. Rep., 149, 1
- Margalit & Metzger (2017) Margalit B., Metzger B. D., 2017, Astrophys. J., 850, L19
- Nagels et al. (1978) Nagels M. M., Rijken T. A., de Swart J. J., 1978, Phys. Rev. D, 17, 768
- Özel et al. (2012) Özel F., Psaltis D., Narayan R., Santos Villarreal A., 2012, ApJ, 757, 55
-
Page (2010)
Page D., 2010, NSCool code available at
http://www.astroscu.unam.mx/neutrones/NSCool - Page & Reddy (2006) Page D., Reddy S., 2006, Annual Review of Nuclear and Particle Science, 56, 327
- Page et al. (2004) Page D., Lattimer J. M., Prakash M., Steiner A. W., 2004, ApJS, 155, 623
- Page et al. (2006) Page D., Geppert U., Weber F., 2006, Nuclear Phys. A, 777, 497
- Page et al. (2011) Page D., Prakash M., Lattimer J. M., Steiner A. W., 2011, Phys. Rev. Lett., 106, 081101
- Paschalidis et al. (2018) Paschalidis V., Yagi K., Alvarez-Castillo D., Blaschke D. B., Sedrakian A., 2018, Phys. Rev. D, 97, 084038
- Posselt & Pavlov (2018) Posselt B., Pavlov G. G., 2018, ApJ, 864, 135
- Posselt et al. (2013) Posselt B., Pavlov G. G., Suleimanov V., Kargaltsev O., 2013, ApJ, 779, 186
- Potekhin et al. (2003) Potekhin A. Y., Yakovlev D. G., Chabrier G., Gnedin O. Y., 2003, ApJ, 594, 404
- Potekhin et al. (2015) Potekhin A. Y., Pons J. A., Page D., 2015, Space Sci. Rev., 191, 239
- Pudliner et al. (1997) Pudliner B. S., Pandharipande V. R., Carlson J., Pieper S. C., Wiringa R. B., 1997, Phys. Rev. C, 56, 1720
- Radice et al. (2018) Radice D., Perego A., Zappa F., Bernuzzi S., 2018, Astrophys. J., 852, L29
- Rezzolla et al. (2018) Rezzolla L., Most E. R., Weih L. R., 2018, Astrophys. J., 852, L25
- Schiavilla et al. (1986) Schiavilla R., Pandharipande V., Wiringa R. B., 1986, Nuclear Phys. A, 449, 219
- Schwenk & Friman (2004) Schwenk A., Friman B., 2004, Phys. Rev. Lett., 92, 082501
- Shibata et al. (2017) Shibata M., Fujibayashi S., Hotokezaka K., Kiuchi K., Kyutoku K., Sekiguchi Y., Tanaka M., 2017, Phys. Rev. D, 96, 123012
- Shternin et al. (2011) Shternin P. S., Yakovlev D. G., Heinke C. O., Ho W. C. G., Patnaude D. J., 2011, MNRAS, 412, L108
- Stoks et al. (1994) Stoks V. G. J., Klomp R. A. M., Terheggen C. P. F., de Swart J. J., 1994, Phys. Rev. C, 49, 2950
- Takatsuka & Tamagaki (1993) Takatsuka T., Tamagaki R., 1993, Prog. Theor. Phys. Suppl., 112, 27
- Taranto et al. (2013) Taranto G., Baldo M., Burgio G., 2013, Phys. Rev. C, 87, 045803
- Taranto et al. (2016) Taranto G., Burgio G. F., Schulze H.-J., 2016, MNRAS, 456, 1451
- Wei et al. (2018) Wei J.-B., Figura A., Burgio G. F., Chen H., Schulze H.-J., 2018, preprint, (arXiv:1809.04315)
- Wiringa et al. (1995) Wiringa R. B., Stoks V., Schiavilla R., 1995, Phys. Rev. C, 51, 38
- Yakovlev & Pethick (2004) Yakovlev D. G., Pethick C. J., 2004, ARA&A, 42, 169
- Yakovlev et al. (2001) Yakovlev D. G., Kaminker A. D., Gnedin O. Y., Haensel P., 2001, Phys. Rep., 354, 1
- Yakovlev et al. (2011) Yakovlev D. G., Ho W. C. G., Shternin P. S., Heinke C. O., Potekhin A. Y., 2011, MNRAS, 411, 1977
- Zhou et al. (2004) Zhou X.-R., Schulze H.-J., Zhao E.-G., Pan F., Draayer J. P., 2004, Phys. Rev. C, 70, 048802
- Zuo et al. (2002) Zuo W., Lejeune A., Lombardo U., Mathiot J. F., 2002, European Physical Journal A, 14, 469