Metallicity estimates of young clusters in the Magellanic Clouds from Strömgren photometry of supergiant stars
Abstract
We present results obtained from Strömgren photometry of 13 young (30-220 Myr) Magellanic Cloud (MC) clusters, most of them lacking in the literature from direct metallicity measurements. We derived for them [Fe/H] values from a high-dispersion spectroscopy-based empirical calibration of the Strömgren metallicity sensitive index for yellow and red supergiants (SGs). Particular care was given while estimating their respective uncertainties. In order to obtain the mean cluster metallicities, we used [Fe/H] values of selected SGs for which we required to be located within the cluster radii, placed in the expected SG region in the cluster colour-magnitude diagrams, and with [Fe/H] values within the FWHM of the observed cluster metallicity distributions. The resulting metallicities for nearly 75 per cent of the cluster sample agree well with the most frequently used values of the mean MCs’ present-day metallicities. The remaining clusters have mean [Fe/H] values that fall near the edge of the MC present-day metallicity distributions. When comparing the cluster metallicities with their present positions, we found evidence that supports the claimed recent interaction of the MCs with the Milky Way, that could have caused that some clusters were scattered from their birthplaces. Indeed, we show examples of clusters with metal contents typical of the galaxy inner regions placed outward them. Likewise, we found young clusters, at present located in the inner regions of both MCs, formed out of gas that has remained unmixed since several Gyr ago.
keywords:
galaxies: individual: Magellanic Clouds – galaxies: star clusters: general1 Introduction
Nearly 100-200 Myr ago the Milky Way has experienced its first passage to the Magellanic Clouds (MCs) (Besla et al., 2012). As a consequence of such an interaction sudden cluster formation episodes have taken place throughout these galaxies (Bekki & Chiba, 2005; Maschberger & Kroupa, 2011; Piatti, 2018c). Since clusters share the metallicities of their birthplaces, those younger objects can tell us about the efficiency of the gas mixing within the MCs, the metal enrichment due to the galaxy chemical evolution, the infall of gas from MCs-Milky Way interaction, etc. Young clusters also describe the most recent structures of these galaxies, where active cluster formation regions can even exist. Young clusters are tracers of the galaxy present-day metallicity distributions. By analysing the broadness of such a metallicity distributions and their relationship with the young cluster spatial distribution, we can get some clues about the effectiveness of scattering clusters from galaxy interactions, to assess whether clusters have been formed in an outside-in or inside-out formation scenario, among others.
The number of young clusters (age 200 Myr) in the MCs with actual measurements of their metal contents is really negligible in the literature. Most of the catalogued young clusters have been studied photometrically, using their colour-magnitude diagrams (CMDs) to derive their ages by assuming that they share the known MCs’ mean present-day metallicities (see, e.g. Glatt et al., 2010; Piatti, 2017). Sometimes, a couple of different [Fe/H] values have been chosen to match theoretical isochrones to the cluster CMDs. More recently, bayesian and maximum-likelihood approaches have been implemented to fits thousand of isochrones to the CMDs in order to get the best fitted cluster ages and metallicities (Dias et al., 2014; Perren et al., 2015). Nevertheless, none of them perform direct measures of the cluster’s members chemical compositions.
With the aim of mitigating the lack of metallicity measurements of young MC clusters, we used here Strömgren photometry of yellow and red supergiants (SGs) to provide for the first time with accurate mean [Fe/H] values for 12 young MCs, and for the Small Magellanic Cloud cluster NGC 330, whose previous spectroscopic iron abundance served as a reference for our metallicity scale. Details of the data sets obtained and the careful process carried out with the images until obtaining the standardised Strömgren photometry is described in Section 2. In Section 3 we deal with the cluster metallicities, how we derived them and thoroughly estimated their uncertainties. We analyse and discuss in Section 4 different implications of the resulting cluster [Fe/H] values, in the context of the MCs’ chemical evolution histories and interaction with each other and of them with the Milky Way. Finally, Section 5 summarises the main conclusions of this work.
2 Strömgren photometry data set
The photometric data sets analysed in this work were obtained during an observing campaign aimed at studying the chemical evolution of the MCs from star clusters and field stars (programme ID: SO2008B-0917, PI: Pietrzyński). The images are publicly available at the National Optical Astronomy Observatory (NOAO) Science Data Management (SDM) Archives.111http //www.noao.edu/sdm/archives.php. Two different observing runs were carried out (17-19 December 2008 and 16-18 January 2009) with the SOAR Optical Imager (SOI) attached to the 4.1m Southern Astrophysical Research (SOAR) telescope (FOV = 5.255.25, scale=0.154/px in binned mode). The images resulted of excellent quality (typical FWHM 0.6) and were processed following the SOI’s pipeline guidance available at http://www.ctio.noao.edu/soar/content/soar-optical-imager-soi. In doing this, we used suitable zero and flat-field images obtained during each observing night. Table 1 lists the log of observations for the studied young MC clusters. Other subsample of clusters have been analysed previously to search for intrinsic metallicity spreads among Large Magellanic Cloud (LMC) old globular clusters (Piatti & Koch, 2018) and in NGC 1978 (Martocchia et al., 2018; Piatti & Bailin, 2018) and hints of multiple populations among Small Magellanic Cloud (SMC) intermediate-age clusters (Niederhofer et al., 2017; Piatti, 2018a).
We selected the standard stars HD64, HD3417, HD12756, HD22610, HD57568, HD58489, HD66020, TYC 7547-711-1, TYC 7548-698-1, TYC 7583-1011-1, TYC 7583-1622-1, TYC 7626-763-1, TYC 8033-906-1, TYC 8067-207-1, TYC 8104-856-1 and TYC 8104-969-1 (Hauck & Mermilliod, 1998; Paunzen, 2015) to secure transformation of the instrumental magnitudes to the standard system. Particular care was given to the observations of these stars by obtaining images in all the filters at small and large hour angle (airmass between 1.02 and 2.20). Additionally, we observed each star twice at a given airmass, with the aim of placing them in each of the two CCDs used by SOI. As shown in Piatti & Bailin (2018), there is an excellent agreement between the independent transformation coefficients from both CCDs. For this reason, we decided to use all the measured stars, regardless their positions in SOI. The transformation equations fitted are as follows:
,
,
,
where , and are the i-th fitted coefficients, and represents the effective airmass. The resulting coefficients are listed in Table 2.
The instrumental magnitudes were derived from point-spread-function (PSF) photometry using the routine packages daophot, allstar, daomatch and daomaster in their stand-alone version (Stetson et al., 1990). The PSF of each image was created from a sample of nearly one hundred not-saturated, bright, isolated stars, interactively selected and distributed throughout the entire image. These PSF samples were previously cleaned from fainter neighbours using preliminary PSFs built with the best nearly forty PSF candidates. We adopted a quadratically spatially-varying PSF function for all the images. We applied the created PSFs to the identified stellar sources and took advantage of the subtracted images for identifying new fainter stars that were added to the previous list. The last steps were iterated three times, deriving instrumental magnitudes from simultaneously applying the respective PSF to the enlarged sample of stars. We computed aperture corrections in the range -0.04 - -0.07 mag. Finally, we inverted the fitted transformation equations to obtain magnitudes in the standard system.
Errors were estimated from extensive artificial star tests as previously performed for other subsets of MC clusters imaged during the same observing programme (see Piatti & Koch, 2018; Piatti, 2018a; Piatti & Bailin, 2018). In brief, we used the stand-alone addstar program in the daophot package (Stetson et al., 1990) to add synthetic stars, generated bearing in mind the colour and magnitude distributions of the stars in the CMD as well as the cluster radial stellar density profile. We added a number of stars equivalent to 5 of the measured stars in order to avoid in the synthetic images significantly more crowding than in the original images. We created a thousand different images for each original one. We used the option of entering the number of photons per ADU in order to properly add the Poisson noise to the star images. We then repeated the same steps to obtain the photometry of the synthetic images as described above, i.e., performing three passes with the daophot/allstar routines. The photometric errors were derived from the magnitude difference between the output and input data of the added synthetic stars using the daomatch and daomaster tasks. We found that this difference resulted typically equal to zero and in all the cases smaller than 0.003 mag. The respective rms errors were adopted as the photometric errors.
3 Strömgren metallicities
Grebel & Richtler (1992) recommended the following expression to estimate metallicities of SGs:
| (1) |
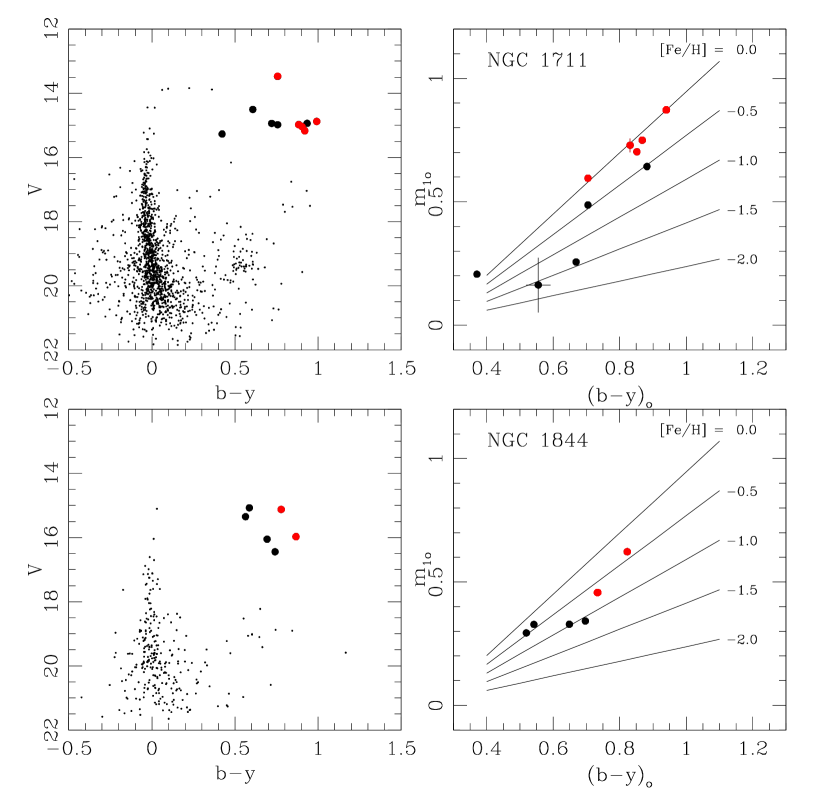
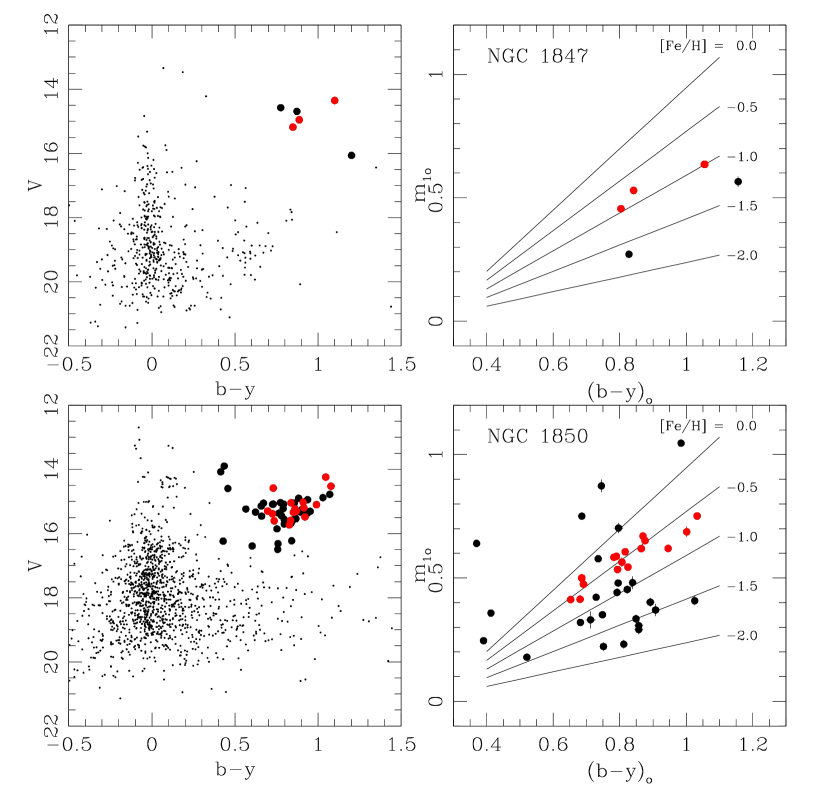
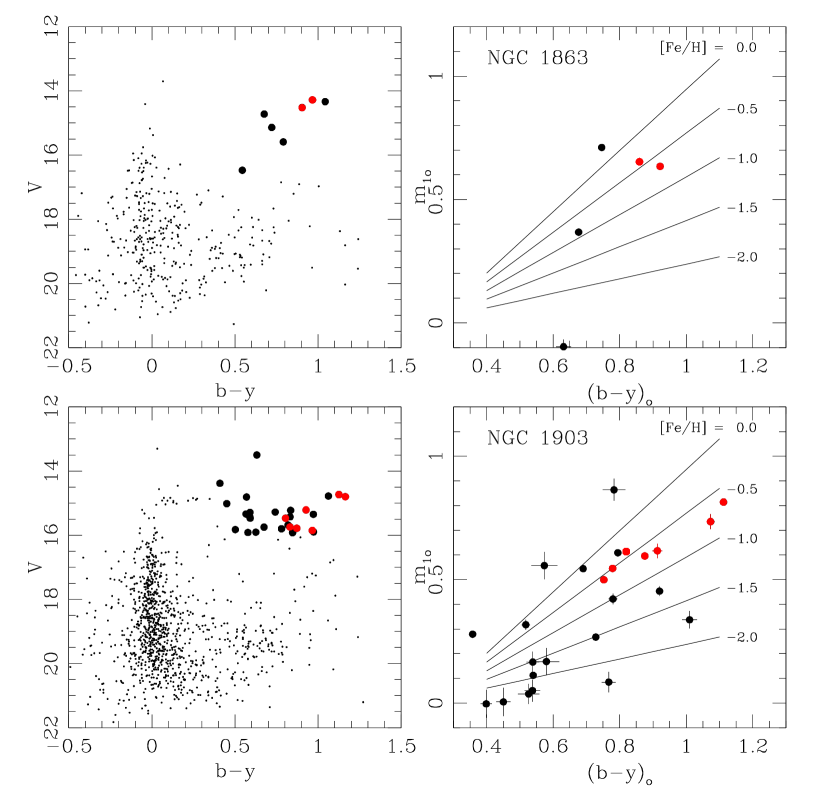
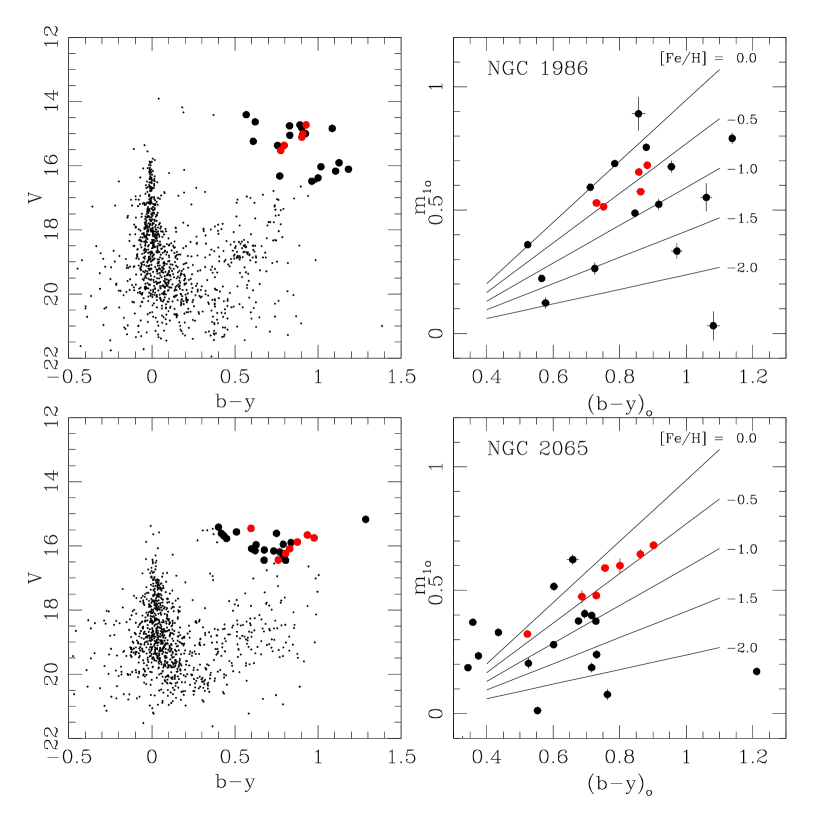
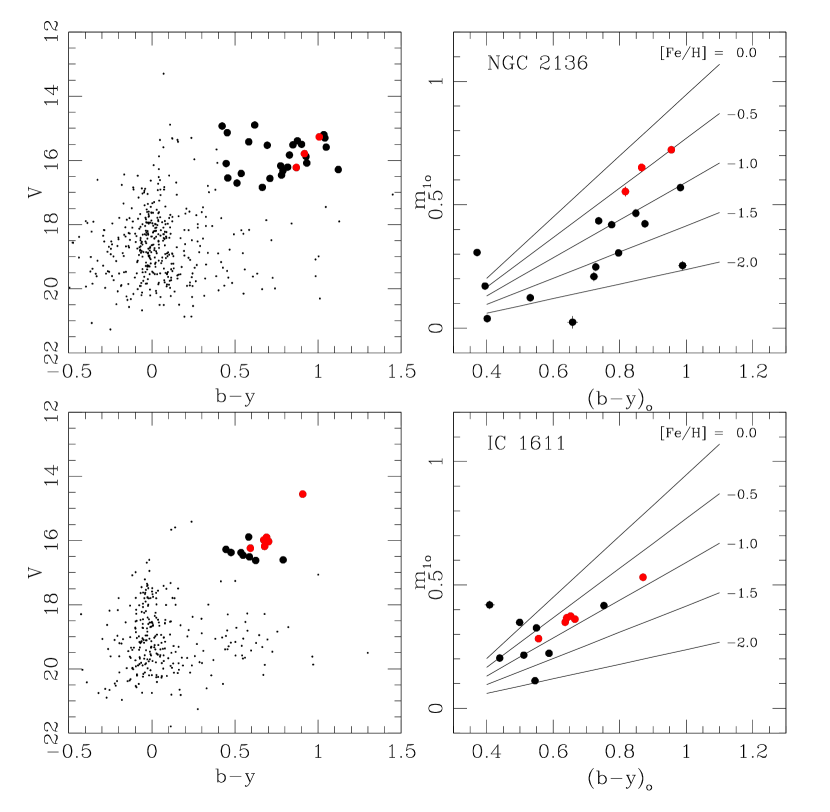
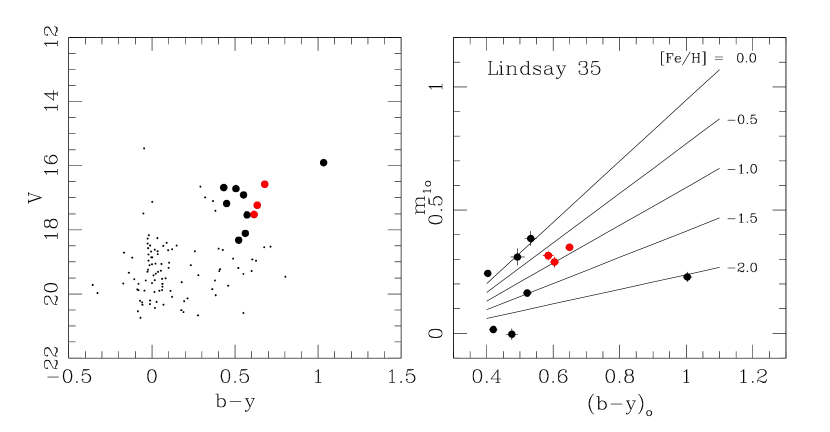
where = -1.2400.006, = 0.2940.030, = 0.4720.040 and = -0.1180.020, respectively. Notice that = () - (). We used eq. (1) for cluster SGs that satisfy the following requirements: i) the SGs lie within the cluster radius (Bica et al., 2008). ii) They have intrinsic colours in the range 0.4 - 1.1 mag for which eq. (1) is valid. iii) They fall above the cluster main sequence turnoff in the versus CMD, where cluster SGs are expected to be distributed. iv) Their individual [Fe/H] values are within the FWHM of the metallicity distribution of all SGs complying with the above criteria. This latter requisite helped us to clean the sample of cluster SGs. Notice that field SGs are not homogeneously distributed throughout the observed fields, so that the frequently procedure of choosing a region with an equal cluster area far away from the cluster as a star field reference to clean the cluster CMD, could be misleading. In addition, field SGs are distributed stochastically in the cluster CMD, so that it could not be straightforward to distinguish them from cluster SGs by considering only their positions in those CMDs. Fig. 1 shows the CMDs for all the stars within the clusters’ radii with black dots, while selected stars above the cluster turnoffs and with metallicities within the FWHM of the metallicity distributions are drawn with big black and red filled circles, respectively.
We extracted from the Gaia archive222http://gea.esac.esa.int/archive/ parallaxes () and proper motions in Right Ascension (pmra) and Declination (pmdec) for stars located within 10 arcmin from the centres of our cluster sample, with the aim of including an additional criterion on the membership status of cluster SG selection. To choose cluster stars we constrained our sample to those satisfying the following criteria: i) stars located at the MC distances, i.e. 3 and 4.0 mas. We rejected all stars with not consistent with zero at more than 3 level (see Vasiliev, 2018); ii) stars located within the cluster radii (Bica et al., 2008). Unfortunately, we did not find stars with proper motion errors 0.3 mas/yr, which correspond to 70 and 85 km/s, if the mean Large and Small Magellanic Clouds (L/SMC) distances are used. Therefore, without the necessary proper motion accuracy, it was not possible to conduct any membership probability analysis.
We have highlighted the sample of selected cluster SGs with big red filled circles in the
cluster CMDs of Fig. 1. We also show their placement in the
versus plane, which includes iso-abundance lines according to eq. (1).
In order to estimate the individual metallicities, we first dereddened the measured
and colour indices by using the expression given by Crawford &
Mandwewala (1976)
and the largest value of those retrieved from the Haschke
et al. (2011, hereafter H11)
MC extinction map and from the NASA/IPAC Extragalactic Database (NED). For the sake of
the reader, Table 3 lists both colour excesses. The uncertainties
in the [Fe/H] values were calculated by propagating every involved error,
namely: the photometric errors and and the errors
in the values () of eq. (1), according to the expression:
,
where . Since varies from one SG to another within a cluster, we used the well-known maximum likelihood approach described in, e.g., Pryor & Meylan (1993) and Walker et al. (2006) to derive the mean cluster metallicities and the respective errors. The resulting [Fe/H] values are listed in the last column of Table 3.
4 Analysis and discussion
As far as we are aware, most of the studied clusters do not have direct estimates of their metallicities. From a careful search through the available literature, we realised that only NGC 330 have been targeted for a spectroscopic metallicity analysis (see (Grebel & Richtler, 1992, and references therein). Grebel & Richtler (1992) obtained a mean value of [Fe/H] = -1.26 dex, in excellent agreement with our present estimate. Note, however, that the recent work by Milone et al. (2018) adopted a more metal-rich value ([Fe/H] = -0.9 dex). Dirsch et al. (2000) estimated [Fe/H] = -0.57 dex for NGC 1711, rather different to our derived value (-0.060.05 dex). Notice that they showed a comparison of their metallicities with those from high-dispersion spectroscopy that resulted in differences between 0.0 and 0.8 dex, being their values more metal-poor. For the remaining clusters, previous photometric studies have adopted the accepted mean galaxy present-day metallicities, i.e.. [Fe/H]= -0.4 and -0.7 dex, for the LMC and SMC, respectively (see, e.g. Piatti & Geisler, 2013). Some few photometric studies have tried with a couple of different metallicity values while matching isochrones to the cluster CMDs or recovering their formation histories (NGC 376, 1844, 1847 and 2136). The middle columns of Table 3 list the values of ages and metallicities we found while searching the literature.
By comparing our resulting cluster metallicities with those previously used in the literature, we found some differences (([Fe/H]) 0.3-0.4 dex) that led us to speculate about the possibility that the assumption for young MC clusters to have metal contents similar to the mean galaxy present-day metallicities is justified for statistical purposes. Otherwise, when young clusters are studied to search for chemical abundance anomalies, light element abundance variations, binary fraction, extended main sequence turnoffs, among others, the knowledge of their actual metallicities could have an impact. This could be the case, for instance, of NGC 1844, NGC 1847 and NGC 330, for which Milone et al. (2013), Niederhofer et al. (2015) and Milone et al. (2018) adopted, respectively, more metal-rich metal abundances to show evidence of multiple populations. In order to see whether a better tracking of the split main sequences can be achieved, it would be worth trying to match their CMDs with theoretical isochrones with metallcities similar to those derived in this work. In the case of NGC 1850, a cluster with a large population of near-critically rotating stars, a slightly more metal-rich value has usually been adopted (Bastian et al., 2017).
The existence of a spread in metallicity within the younger stellar populations of both MCs is well-known. Piatti & Geisler (2013), using an homogeneous age/metallicity compilation, showed that the FWHM of such a scatter is 0.51 dex for the LMC and and 0.32 dex for the SMC (see, also Choudhury et al., 2016, 2018); the MC cluster populations also exhibit a noticeable scatter at their younger end (see, also Perren et al., 2017). In this context, most of the present studied clusters are within the expected metallicity range, while others fall at the edge of the known metallicity distributions. This is the case of NGC 330, the most metal-poor young SMC cluster ([Fe/H] = -1.15 dex) so far. In the LMC, NGC 1847 resulted to be the most-metal poor young cluster ([Fe/H]=-0.91 dex) ever known, while NGC 1711 turned out to be at the metal-rich end of the LMC cluster’s metallicities ([Fe/H]= -0.06 dex). These relatively extreme metallicity values tell us that the gas out of which these young clusters were formed was not well-mixed. Note that there has been speculations about the role of infall of unenriched (or less enriched) gas into the MCs leading to an unexpectedly large spread in cluster abundances at a relatively constant age (see, e.g. Da Costa & Hatzidimitriou, 1998).
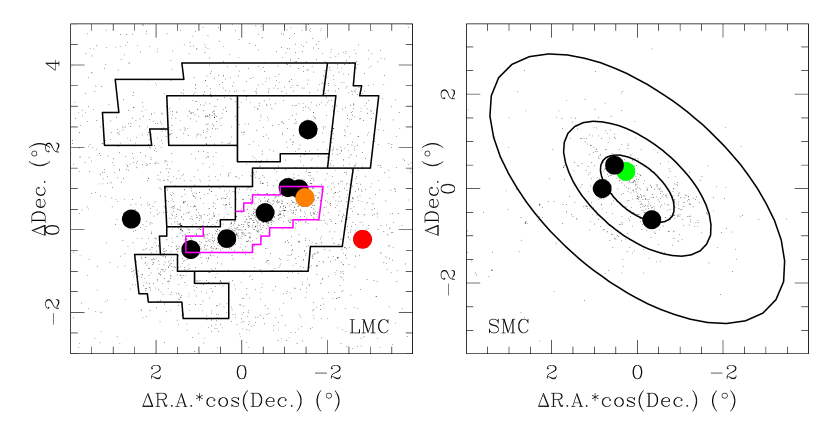
We looked at the cluster positions in their respective host galaxies in order to search for any link of their derived metallicities with the chemical evolution histories of the MCs, particularly of those with more extreme values. Fig. 2 depicts with black points the spatial distributions in both MCs of all the clusters catalogued by Bica et al. (2008). The studied clusters are drawn with big filled circles. As a spatial reference, we have also included the areas defined by Harris & Zaritsky (2009) in the LMC main body (the bar is traced with a light-blue line) and the ellipses proposes by Piatti et al. (2007) as a simple representation of the orientation, dimension and shape of the SMC main body. As can be seen, most of the studied LMC clusters are located along the bar, and some few others in the disc, while the studied SMC clusters are confined to the ellipse with semi-major axis of 1 degree.
In an outside-in galaxy formation scenario – which appears to be the case of both MCs (Meschin et al., 2014; Rubele et al., 2018; Piatti, 2018c, b) – the inner regions of a galaxy turn our to be more metal-rich than the outer ones. Indeed, from Piatti & Geisler (2013) we found that the metallicity level of field stars in the outer LMC disc (, [Fe/H] = -0.900.20 dex) is on average more metal-poor than that for inner disc field stars (, [Fe/H] =-0.500.20 dex). For the SMC, we got [Fe/H] = -1.200.20 dex and -0.700.15 dex for regions with semi-major axes larger and smaller than , respectively (Piatti, 2012). Star clusters share the metallicities of their birthplaces. Nevertheless, with time they drift away from their birth locations. Interactions and other perturbations may produce additional velocity components.
The derived metallicities of NGC 330 ([Fe/H]= -1.15 dex, light-green circle in Fig. 2) and NGC 1847 ([Fe/H]= -0.91 dex, orange circle in Fig. 2) are typical of stellar populations located in the outer regions of the MCs, although both clusters are projected toward inner regions. Conversely, NGC 1711 (red circle in Fig. 2), which is projected on to the LMC outer disc, have a metal content ([Fe/H]= -0.06 dex) typical of the LMC bar. Recently, Piatti et al. (2018a) showed that a recently discovered young cluster placed in the outer disc of the LMC, possibly reached the present position after being scattered from the innermost LMC regions where it might have been born. This possibility could be applied to NGC 1711, unless the cluster is the outcome of an episode of recent cluster formation as a consequence of the first passage of the LMC by the Milky Way triggering cluster formation due to the ram pressure of Milky Way halo gas (Piatti et al., 2018b). As for the birthplaces of NGC 330 and NGC 1847, we can only infer that they have been formed from gas that has remained unmixed during the last 4 Gyr in the SMC and 9 Gyr in the LMC. In order to infer these ages, we used the age-metallicity relationships derived by Piatti & Geisler (2013, see their figure 6); we then entered with the cluster metallicities and looked for the corresponding ages.
Finally, we searched the literature for radial velocity (RV) measurements. As far as we are aware, we found RVs for NGC 330 (149.08.0 km/sec Feast & Black, 1980), NGC 1850 (251.42.0 km/sec Fischer et al., 1993) and NGC 2136 (271.40.4 km/sec Mucciarelli et al., 2012). Radial velocities are not available for the two anomalous LMC clusters NGC 1711 and NGC 1847. One of the diagnostic diagrams most frequently used to assess whether a cluster belongs to the LMC disc is that which shows the relationship between position angles (PAs) and RVs (Schommer et al., 1992; Grocholski et al., 2006; Sharma et al., 2010; van der Marel et al., 2002; van der Marel & Kallivayalil, 2014) for a disc-like rotation geometry. We here followed the recipe used by Schommer et al. (1992), who converted the observed heliocentric cluster RVs to Galactocentric RVs through eq.(4) in Feitzinger & Weiss (1979). We computed cluster PAs by adopting the LMC disc central coordinates obtained by van der Marel & Kallivayalil (2014) from average proper motion measurements for stars in 22 fields. We obtained PAs of 308.0 and 44.0 and Galactocentric RVs of 33.0 km/sec and 95.0 km/sec for NGC 330 and 2136, respectively. These values are fully consistent with both clusters belonging to the LMC disc (see figure 7 in Piatti et al. (2018a)). As for the SMC, we used the high-resolution H I data from the Australian Square Kilometre Array Pathfinder (ASKAP) obtained by Di Teodoro et al. (2019). We compared the NGC 330’s RV with that from the ASKAP velocity map (see their figure 1) for the cluster position and found a very good agreement.
5 Conclusions
We obtained Strömgren photometry of selected young MC clusters in order to provide direct estimates of their metal contents, which are noticeably lacking in the literature. The observations of 13 young MC clusters, namely: NGC 330, 376, 1711, 1844, 1847, 1850, 1863, 1903, 1986, 2065, 2136, IC 1611 and Lindsay 35, were performed with the SOI attached to the SOAR telescope during two observing runs in December 2008 and January 2009, respectively, as part of an observational programme aimed at studying the chemical evolution of these galaxies from their star clusters and field star populations.
In deriving the metallicities of measured yellow and red SGs we made use of an empirical calibration recommended by Grebel & Richtler (1992), based on the Strömgren metallicity sensitive index . We paid particular attention in estimating the metallicity uncertainties, which were calculated from propagation of all the involved errors added in quadrature, i.e., those coming from the obtained Strömgren photometry and those published from the employed metallcity calibration.
After a careful selection of yellow and red cluster SGs, on the basis of their positions along the line-of-sight of the clusters, their locations in their respective cluster CMDs and relative placement in the cluster metallicty distribution functions, we estimated mean cluster metallicities by applying a maximum likelihood approach. The derived uncertainties are between 0.04 and 0.15 dex, with an average of 0.08 dex. We found null intrinsic [Fe/H] spreads within the studied clusters with an upper limit between 0.05 and 0.24 dex, with an average of 0.10 dex.
As far as we are aware, only NGC 330 has previous metallicity estimates. Particularly, the most recent [Fe/H] value obtained by Grebel & Richtler (1992) as well as those from high-dispersion spectroscopy (Spite et al., 1986) are in excellent agreement with that obtained in this work. For the remaining studied clusters, the [Fe/H] values derived here are the first metallicity estimates provided so far. In general, the resulting metal abundances agree well with the known mean galaxy present-day metallicities, as expected since the youth of the studied clusters. Nevertheless, there are some clusters whose derived mean [Fe/H] values fall toward to edge of the present-day metallicity distribution function. We found that NGC 300 and NGC 1847 are at present the most metal-poor young clusters in the SMC and LMC, whereas NGC 1711 one of the most metal-rich in the LMC.
When comparing the cluster metallicities with their present positions in the galaxies, we found evidence that support the outside-in formation scenario in both MCs. At the same time, we found that interactions between the MCs and of the MCs with the Milky Way could have caused that some clusters were scattered from their birthplaces. Indeed, we show examples of LMC clusters with metal contents typical of the innermost galaxy regions placed in the galaxy outer disc. Likewise, we found young clusters, at present located in the inner regions of both MCs, formed out of gas that has remained unmixed since several Gyr ago.
Acknowledgements
We thank the referee for the thorough reading of the manuscript and timely suggestions to improve it. This research has made use of the NASA/IPAC Extragalactic Database (NED), which is operated by the Jet Propulsion Laboratory, California Institute of Technology, under contract with the National Aeronautics and Space Administration. This work has made use of data from the European Space Agency (ESA) mission Gaia (https://www.cosmos.esa.int/gaia), processed by the Gaia Data Processing and Analysis Consortium (DPAC, https://www.cosmos.esa.int/web/gaia/dpac/consortium). Funding for the DPAC has been provided by national institutions, in particular the institutions participating in the Gaia Multilateral Agreement. We also thank support from the IdP II 2015 0002 64 grant of the Polish Ministry of Science and Higher Education.
References
- Asa’d et al. (2016) Asa’d R. S., Vazdekis A., Zeinelabdin S., 2016, MNRAS, 457, 2151
- Bastian et al. (2017) Bastian N., et al., 2017, MNRAS, 465, 4795
- Bekki & Chiba (2005) Bekki K., Chiba M., 2005, MNRAS, 356, 680
- Besla et al. (2012) Besla G., Kallivayalil N., Hernquist L., van der Marel R. P., Cox T. J., Kereš D., 2012, MNRAS, 421, 2109
- Bica et al. (2008) Bica E., Bonatto C., Dutra C. M., Santos J. F. C., 2008, MNRAS, 389, 678
- Choudhury et al. (2016) Choudhury S., Subramaniam A., Cole A. A., 2016, MNRAS, 455, 1855
- Choudhury et al. (2018) Choudhury S., Subramaniam A., Cole A. A., Sohn Y.-J., 2018, MNRAS, 475, 4279
- Crawford & Mandwewala (1976) Crawford D. L., Mandwewala N., 1976, PASP, 88, 917
- Da Costa & Hatzidimitriou (1998) Da Costa G. S., Hatzidimitriou D., 1998, AJ, 115, 1934
- Di Teodoro et al. (2019) Di Teodoro E. M., et al., 2019, MNRAS, 483, 392
- Dias et al. (2014) Dias B., Kerber L. O., Barbuy B., Santiago B., Ortolani S., Balbinot E., 2014, A&A, 561, A106
- Dirsch et al. (2000) Dirsch B., Richtler T., Gieren W. P., Hilker M., 2000, A&A, 360, 133
- Elson & Fall (1985) Elson R. A. W., Fall S. M., 1985, ApJ, 299, 211
- Feast & Black (1980) Feast M. W., Black C., 1980, MNRAS, 191, 285
- Feitzinger & Weiss (1979) Feitzinger J. V., Weiss G., 1979, A&AS, 37, 575
- Fischer et al. (1993) Fischer P., Welch D. L., Mateo M., 1993, AJ, 105, 938
- Glatt et al. (2010) Glatt K., Grebel E. K., Koch A., 2010, A&A, 517, A50
- Grebel & Richtler (1992) Grebel E. K., Richtler T., 1992, A&A, 253, 359
- Grocholski et al. (2006) Grocholski A. J., Cole A. A., Sarajedini A., Geisler D., Smith V. V., 2006, AJ, 132, 1630
- Harris & Zaritsky (2009) Harris J., Zaritsky D., 2009, AJ, 138, 1243
- Haschke et al. (2011) Haschke R., Grebel E. K., Duffau S., 2011, AJ, 141, 158
- Hauck & Mermilliod (1998) Hauck B., Mermilliod M., 1998, A&AS, 129, 431
- Martocchia et al. (2018) Martocchia S., et al., 2018, MNRAS, 477, 4696
- Maschberger & Kroupa (2011) Maschberger T., Kroupa P., 2011, MNRAS, 411, 1495
- Meschin et al. (2014) Meschin I., Gallart C., Aparicio A., Hidalgo S. L., Monelli M., Stetson P. B., Carrera R., 2014, MNRAS, 438, 1067
- Milone et al. (2013) Milone A. P., Bedin L. R., Cassisi S., Piotto G., Anderson J., Pietrinferni A., Buonanno R., 2013, A&A, 555, A143
- Milone et al. (2018) Milone A. P., et al., 2018, MNRAS, 477, 2640
- Mucciarelli et al. (2012) Mucciarelli A., Origlia L., Ferraro F. R., Bellazzini M., Lanzoni B., 2012, ApJ, 746, L19
- Niederhofer et al. (2015) Niederhofer F., Hilker M., Bastian N., Silva-Villa E., 2015, A&A, 575, A62
- Niederhofer et al. (2017) Niederhofer F., et al., 2017, MNRAS, 465, 4159
- Paunzen (2015) Paunzen E., 2015, A&A, 580, A23
- Perren et al. (2015) Perren G. I., Vázquez R. A., Piatti A. E., 2015, A&A, 576, A6
- Perren et al. (2017) Perren G. I., Piatti A. E., Vázquez R. A., 2017, A&A, 602, A89
- Piatti (2012) Piatti A. E., 2012, MNRAS, 422, 1109
- Piatti (2017) Piatti A. E., 2017, A&A, 606, A21
- Piatti (2018a) Piatti A. E., 2018a, preprint, (arXiv:1809.08123)
- Piatti (2018b) Piatti A. E., 2018b, MNRAS, 475, 2553
- Piatti (2018c) Piatti A. E., 2018c, MNRAS, 478, 784
- Piatti & Bailin (2018) Piatti A. E., Bailin J., 2018, AJ, accepted (arXiv:1812.00685)
- Piatti & Geisler (2013) Piatti A. E., Geisler D., 2013, AJ, 145, 17
- Piatti & Koch (2018) Piatti A. E., Koch A., 2018, ApJ, 867, 8
- Piatti et al. (2003) Piatti A. E., Geisler D., Bica E., Clariá J. J., 2003, MNRAS, 343, 851
- Piatti et al. (2007) Piatti A. E., Sarajedini A., Geisler D., Clark D., Seguel J., 2007, MNRAS, 377, 300
- Piatti et al. (2008) Piatti A. E., Geisler D., Sarajedini A., Gallart C., Wischnjewsky M., 2008, MNRAS, 389, 429
- Piatti et al. (2015) Piatti A. E., et al., 2015, MNRAS, 454, 839
- Piatti et al. (2018a) Piatti A. E., Salinas R., Grebel E. K., 2018a, MNRAS,
- Piatti et al. (2018b) Piatti A. E., Cole A. A., Emptage B., 2018b, MNRAS, 473, 105
- Pryor & Meylan (1993) Pryor C., Meylan G., 1993, in Djorgovski S. G., Meylan G., eds, Astronomical Society of the Pacific Conference Series Vol. 50, Structure and Dynamics of Globular Clusters. p. 357
- Rubele et al. (2018) Rubele S., et al., 2018, MNRAS, 478, 5017
- Sabbi et al. (2011) Sabbi E., Nota A., Tosi M., Smith L. J., Gallagher J., Cignoni M., 2011, ApJ, 739, 15
- Schommer et al. (1992) Schommer R. A., Suntzeff N. B., Olszewski E. W., Harris H. C., 1992, AJ, 103, 447
- Sharma et al. (2010) Sharma S., Borissova J., Kurtev R., Ivanov V. D., Geisler D., 2010, AJ, 139, 878
- Spite et al. (1986) Spite M., Cayrel R., François P., Richtler T., Spite F., 1986, A&A, 168, 197
- Stetson et al. (1990) Stetson P. B., Davis L. E., Crabtree D. R., 1990, in Jacoby G. H., ed., Astronomical Society of the Pacific Conference Series Vol. 8, CCDs in astronomy. pp 289–304
- Vasiliev (2018) Vasiliev E., 2018, preprint, (arXiv:1805.08157)
- Walker et al. (2006) Walker M. G., Mateo M., Olszewski E. W., Bernstein R., Wang X., Woodroofe M., 2006, AJ, 131, 2114
- van der Marel & Kallivayalil (2014) van der Marel R. P., Kallivayalil N., 2014, ApJ, 781, 121
- van der Marel et al. (2002) van der Marel R. P., Alves D. R., Hardy E., Suntzeff N. B., 2002, AJ, 124, 2639
| Cluster | Date | Exposure time (sec) | Airmass | ||||
|---|---|---|---|---|---|---|---|
| NGC 330 | 17 Dec. 2008 | 400 | 200 | 120 | 1.50 | 1.49 | 1.49 |
| 19 Dec. 2008 | 400 | 160 | 100 | 1.48 | 1.48 | 1.47 | |
| NGC 376 | 18 Dec. 2008 | 500 | 300 | 180 | 1.53 | 1.52 | 1.52 |
| 19 Dec. 2008 | 350 | 140 | 90 | 1.53 | 1.52 | 1.52 | |
| NGC 1711 | 16 Jan. 2009 | 350 | 180 | 100 | 1.37 | 1.38 | 1.38 |
| NGC 1844 | 17 Jan. 2009 | 400 | 140 | 100 | 1.27 | 1.27 | 1.27 |
| NGC 1847 | 17 Jan. 2009 | 350 | 160 | 100 | 1.29 | 1.30 | 1.30 |
| NGC 1850 | 18 Jan. 2009 | 400 | 160 | 100 | 1.34 | 1.34 | 1.34 |
| NGC 1863 | 18 Jan. 2009 | 400 | 180 | 100 | 1.32 | 1.32 | 1.32 |
| NGC 1903 | 17 Dec. 2008 | 300 | 100 | 60 | 1.36 | 1.36 | 1.36 |
| NGC 1986 | 18 Jan. 2009 | 350 | 180 | 100 | 1.53 | 1.52 | 1.51 |
| NGC 2065 | 18 Jan. 2009 | 400 | 180 | 90 | 2.07 | 2.05 | 2.04 |
| NGC 2136 | 17 Jan. 2009 | 450 | 180 | 110 | 1.99 | 1.97 | 1.96 |
| IC 1611 | 18 Dec. 2008 | 500 | 200 | 120 | 1.57 | 1.56 | 1.56 |
| Lindsay 35 | 18 Dec. 2008 | 500 | 200 | 120 | 1.83 | 1.81 | 1.81 |
| Date | Filter | coef1 | coef2 | coef3 | coef4 | rms |
|---|---|---|---|---|---|---|
| 17 Dec. 2008 | 0.946 | 0.118 | -0.008 | 0.010 | ||
| 0.015 | 0.009 | 0.015 | ||||
| 0.959 | 0.163 | 0.942 | 0.002 | |||
| 0.003 | 0.002 | 0.003 | ||||
| 1.137 | 0.301 | 2.008 | 1.028 | 0.017 | ||
| 0.027 | 0.016 | 0.058 | 0.068 | |||
| 18 Dec. 2008 | 0.932 | 0.122 | -0.005 | 0.010 | ||
| 0.015 | 0.009 | 0.016 | ||||
| 0.942 | 0.177 | 0.946 | 0.008 | |||
| 0.014 | 0.009 | 0.014 | ||||
| 1.122 | 0.295 | 1.995 | 1.026 | 0.002 | ||
| 0.007 | 0.005 | 0.048 | 0.061 | |||
| 19 Dec. 2008 | 0.939 | 0.107 | 0.018 | 0.016 | ||
| 0.019 | 0.010 | 0.015 | ||||
| 0.916 | 0.169 | 0.999 | 0.010 | |||
| 0.013 | 0.007 | 0.011 | ||||
| 1.096 | 0.286 | 2.004 | 1.117 | 0.010 | ||
| 0.015 | 0.009 | 0.030 | 0.038 | |||
| 16 Jan. 2009 | 1.005 | 0.120 | -0.046 | 0.007 | ||
| 0.004 | 0.010 | 0.011 | ||||
| 1.014 | 0.170 | 0.939 | 0.011 | |||
| 0.007 | 0.003 | 0.018 | ||||
| 1.196 | 0.290 | 2.034 | 0.914 | 0.007 | ||
| 0.005 | 0.010 | 0.032 | 0.028 | |||
| 17 Jan. 2008 | 0.940 | 0.155 | 0.012 | 0.017 | ||
| 0.019 | 0.023 | 0.090 | ||||
| 0.957 | 0.201 | 0.931 | 0.013 | |||
| 0.015 | 0.014 | 0.058 | ||||
| 1.194 | 0.295 | 2.025 | 0.950 | 0.010 | ||
| 0.010 | 0.007 | 0.049 | 0.058 | |||
| 18 Jan. 2008 | 1.003 | 0.132 | -0.035 | 0.013 | ||
| 0.013 | 0.007 | 0.023 | ||||
| 1.013 | 0.184 | 0.916 | 0.008 | |||
| 0.008 | 0.004 | 0.014 | ||||
| 1.194 | 0.300 | 2.018 | 0.987 | 0.012 | ||
| 0.032 | 0.016 | 0.097 | 0.092 |
| Cluster | (mag) | Age (Myr) | [Fe/H] (dex) | Ref. | [Fe/H] (dex) | |
| H11 | NED | |||||
| SMC | ||||||
| NGC 330 | — | 0.03 | 40 | -0.90 | 1 | -1.150.06 |
| NGC 376 | 0.03 | 0.03 | 28 | -0.60 | 2 | -0.550.09 |
| IC 1611 | 0.05 | 0.03 | 100 | -0.70 | 6 | -0.800.09 |
| Lindsay 35 | 0.04 | 0.03 | 220 | -0.70 | 11 | -0.850.15 |
| LMC | ||||||
| NGC 1711 | 0.07 | 0.06 | 50 | -0.57 | 12 | -0.060.05 |
| NGC 1844 | 0.04 | 0.06 | 150 | -0.20 | 4 | -0.500.11 |
| NGC 1847 | 0.05 | 0.06 | 50 | -0.40 | 3 | -0.910.09 |
| NGC 1850 | 0.06 | 0.06 | 80 | -0.40 | 5 | -0.530.04 |
| NGC 1863 | 0.05 | 0.06 | 40 | -0.40 | 8 | -0.530.09 |
| NGC 1903 | 0.07 | 0.06 | 100 | -0.40 | 9 | -0.600.05 |
| NGC 1986 | 0.05 | 0.06 | 70 | — | 10 | -0.460.06 |
| NGC 2065 | 0.10 | 0.06 | 100 | — | 7 | -0.400.06 |
| NGC 2136 | 0.07 | 0.06 | 124 | -0.50 | 3 | -0.510.08 |
Ref.: (1) Milone et al. (2018); (2) Sabbi et al. (2011); (3) Niederhofer et al. (2015); (4) Milone et al. (2013); (5) Bastian et al. (2017); (6) Piatti et al. (2007); (7) Asa’d et al. (2016); (8) Piatti et al. (2003); (9) Piatti et al. (2015); (10) Elson & Fall (1985); (11) Piatti et al. (2008); (12) Dirsch et al. (2000).