Probing breakdown of topological protection: Filling-factor-dependent evolution of robust quantum Hall incompressible phases
Abstract
The integer quantum Hall (QH) effects characterized by topologically quantized and nondissipative transport are caused by an electrically insulating incompressible phase that prevents backscattering between chiral metallic channels. We probed the incompressible area susceptible to the breakdown of topological protection using a scanning gate technique incorporating nonequilibrium transport. The obtained pattern revealed the filling-factor ()-dependent evolution of the microscopic incompressible structures located along the edge and in the bulk region. We found that these specific structures, respectively attributed to the incompressible edge strip and bulk localization, show good agreement in terms of -dependent evolution with a calculation of the equilibrium QH incompressible phases, indicating the robustness of the QH incompressible phases under the nonequilibrium condition. Further, we found that the dependency of the incompressible patterns is, in turn, destroyed by a large imposed current during the deep QH effect breakdown. These results demonstrate the ability of our method to image the microscopic transport properties of a topological two-dimensional system.
pacs:
Valid PACS appear hereA two-dimensional electron system (2DES) subjected to strong magnetic fields forms a quantum Hall (QH) insulating phase with a state lying in a gap between quantized Landau levels (LLs). This gapped phase, the so-called incompressible phase, prevents backscattering between the metallic gapless (compressible) phase counter-propagating along both sides of the 2DES edges Chakraborty and Pietiläinen (2013). This is the key microscopic aspect of nondissipative chiral transport of the integer QH effect, which is characterized by a longitudinal resistance that vanishes and a universal quantized Hall conductance protected by a topological invariant Thouless et al. (1982); Hatsugai (1993). Topological phases are attracting renewed attention due to the recent discovery of exotic topological materials such as insulators Kane and Mele (2005a, b); Bernevig et al. (2006); Chang et al. (2013), superconductors Fu and Kane (2008), and Weyl semimetals Burkov and Balents (2011).
The formation of incompressible and compressible phases in the QH regime originates from the interplay between Landau quantization and the Coulomb interaction Chklovskii et al. (1992), which drives nonlinear screening Wulf et al. (1988); Efros et al. (1993). The spatial configuration depends on the potential landscape. For example, the edge confinement potential, accompanied by strong bending of the LLs, forms spatially alternating unscreening and screening regions due to the Fermi-level pinning at the gap and LLs. These regions respectively result in alternating incompressible and compressible strips near the 2DES edge. The innermost incompressible strip moves and spreads to the bulk as the LL filling factor reduces to an integer from a higher . This dependency of the edge strips has been microscopically investigated using various imaging techniques such as single-electron transistor imaging Yacoby et al. (1999), Hall-potential imaging Ahlswede et al. (2001); Weis and Klitzing (2011), microwave impedance imaging Lai et al. (2011), capacitance imaging Suddards et al. (2012), and scanning gate imaging Woodside et al. (2001); Baumgartner et al. (2007); Paradiso et al. (2012); Pascher et al. (2014); Connolly et al. (2012); König et al. (2013); Dou et al. (2018), and it has been extended with superconducting quantum interference device (SQUID) magnetometry Nowack et al. (2013) for a topological spin-Hall insulator.
In the bulk incompressible region formed at , the disorder potential plays an important role in giving rise to isolated compressible puddles that result in QH localization Huckestein (1995); Struck and Kramer (2006); Sohrmann and Römer (2007). QH localized states have been probed Ilani et al. (2004); Steele et al. (2005), and they were demonstrated to undergo phase transition to a delocalized state with a scanning tunneling microscope Hashimoto et al. (2008), which accounts for the transition from nondissipative to dissipative transport Huckestein (1995); Struck and Kramer (2006); Sohrmann and Römer (2007).
By contrast, for a practical sample such as a Hall bar, microscopic pictures of the QH effect have not been fully understood von Klitzing (2019). For instance, the contribution of the innermost incompressible strip to nondissipative transport is debatableSiddiki and Gerhardts (2004). Moreover, the microscopic mechanism of the breakdown of topological protection is thought to originate from backscattering through the incompressible region Eaves et al. (1984); Eaves (1998), and this has recently become a key issue in research on the quantum spin Hall effect König et al. (2013); Wu et al. (2018) and anomalous QH effectXing et al. (2018). To understand the transport properties inherent to the QH effect, it is important to elucidate the microscopic aspects of QH transport in real devices—namely, how the innermost incompressible region evolves in the Hall bar and, hence, limits non-dissipative, topologically quantized transport. Here, we present the ability of a novel scanning-gate method incorporating a nonequilibrium transport technique to pinpoint the areas susceptible to breakdown of topological protection and hence gives access to the local breakdown at a nonequilibrium transport. We found the robust QH nature, i.e., the evolution of the innermost incompressible QH phase from the edge strip to bulk localization, and the microscopic aspects of the global QH breakdown —namely, the breakdown of the QH effect, under a larger nonequilibrium condition.
To probe the local breakdown of the incompressible area, we used a powerful tool (the scanning gate microscope (SGM)), which uses resistive detection as transport measurements and hence directly images transport channels with a high sensitivity at a high spatial resolution Topinka et al. (2000). In topological phases such as QH Woodside et al. (2001); Aoki et al. (2005); Baumgartner et al. (2007); Paradiso et al. (2012); Pascher et al. (2014), and quantum spin Hall König et al. (2013), the SGM has been widely used to probe an important local transport characteristic, namely backscattering between counter-propagating edge channels. To capture a sufficiently intense signal from backscattering—one that is strongly suppressed at , a conventional SGM requires the electrostatic influence of a large negative tip voltage V Paradiso et al. (2012); Pascher et al. (2014); Aoki et al. (2005), moving the incompressible strip across a narrow channel. However, the tip-induced displacement of the incompressible strip may locally disturb the intrinsic structure.
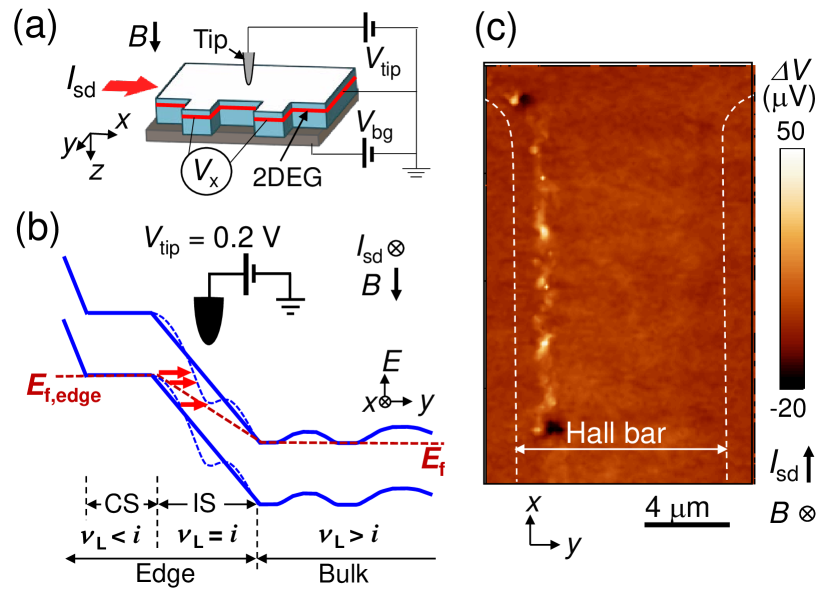
In our setup shown in Fig. 1(a), to minimize global perturbation, the tip voltage was set to V, corresponding to the value of the contact potential mismatch between the tip and the sample Sup . To address the QH phase at and obtain a local signal without applying a large tip voltage, we incorporated nonequilibrium transport. We investigated a 2DES that was confined in a 20-nm-wide GaAs/Al0.3Ga0.7As quantum well located 165 nm beneath the surface. The wafer was processed into a 10-m-wide Hall bar. The mobility of the 2DES was at an electron density . Figure 1(b) depicts the alternating compressible and incompressible regions formed along an edge of the Hall bar. The local () of an incompressible strip is maintained at , while the bulk is modified by sweeping or tuned by a back gate voltage (). To achieve the nonequilibrium condition, we increased the source–drain current () until the Hall voltage deviated from the QH condition. The imposed Hall voltage predominantly enhances the potential slope within the innermost incompressible region Weis and Klitzing (2011), inducing inter-LL tunneling from the edge to the bulk through the innermost incompressible strip. Then, an electron is backscattered into the opposite edge channel through compressible or directional-hopping channels along the Hall electric field. This leads to a dissipative current Eaves and Sheard (1986); Panos et al. (2014), and thus a nonzero longitudinal resistance. The tip locally provides small electric perturbation to 2DEG owing to the effective potential mismatch rearranged by imposed excess Hall voltage, and eventually bends the LL locally and, hence, increases the inter-LL tunneling rate, as shown in Fig. 1(b) (details are discussed in the Supplementary Material Sup ). The tip induced inter-LL tunneling further enhances backscattering and hence the longitudinal voltage (), By mapping the resulting , we can visualize the innermost incompressible region. All measurements were performed at a sample temperature below 250 mK.
Figure 1(c) shows a typical SGM image obtained by capturing at ( T) under the nonequilibrium conditions at 3.1 A. A distinct line-like pattern can be seen extending in the direction along a Hall bar edge (left dashed line), which corresponds to the side with the higher chemical potential () across the direction of the Hall bar. This dependency, confirmed by reversing the direction of the current Sup , can be explained by the fact that mainly drops at the higher- incompressible strip in a nonequilibrium condition Panos et al. (2014), where we expect a higher rate of inter-LL scattering Hashimoto et al. (2018) and thus more SGM sensitivity with respect to the corresponding incompressible strip. To minimize the influence of on the incompressible patterns, was limited to below the current in all measurements, at which the position of the strip shows no significant dependence in the entire measurement region of . Otherwise, there is a deviation associated with global QH breakdown, as discussed in the Supplementary Material Sup .
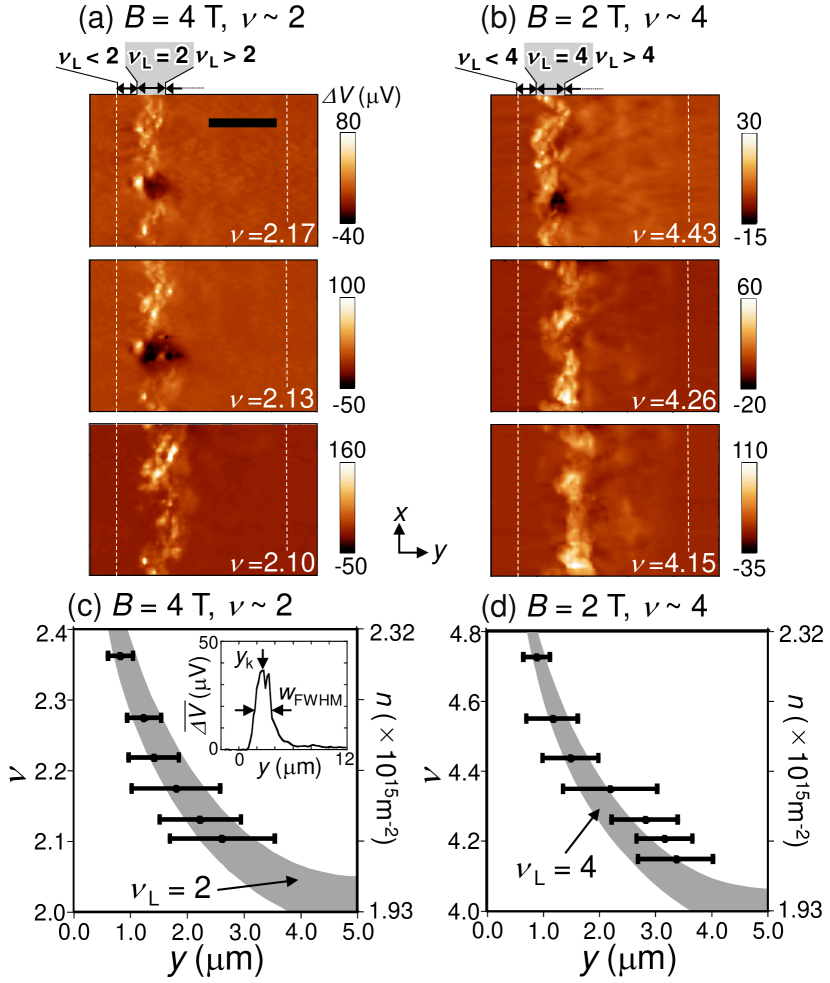
We examined the dependence of the SGM patterns. The measurements were performed at , which was tuned to maintain a constant offset ( mV) at each (for details regarding the conditions, see the Supplementary Material Sup ). Figure 2(a) displays representative SGM images captured near and tuned with the gate-controlled at constant ( T). Decreasing from 2.17, the position of the line pattern shifts and widens to the bulk of 2DES. The same tendency of the -dependent patterns was also observed in the same area near at T, as shown in Fig. 2(b).
We extracted the positions () and width () of the line patterns, which were respectively defined as the first moment (for details, see the Supplementary Material Sup ) and the full width at half maximum in a profile after spatially averaging over the 8.5-m range in the direction (), as shown in the inset of Fig. 2(c). For a quantitative comparison of the observed peak positions, we performed a calculation in the Landau gauge based on the local spin-density approximation (LSDA) Nomura and Aoyagi (2004); Mamyouda et al. (2015) using a typical potential profile Güven and Gerhardts (2003) in the QH regime ( A) (for details regarding the calculations, see the Supplementary Material Sup ). The -dependent incompressible region, experimentally determined from (dots) and (bars), is compared with the innermost QH incompressible region (gray area) calculated by the LSDA for in Fig. 2(c) and in Fig. 2(d). We found good agreement between the experimental results and the LSDA calculation for both values of . Additionally, a closer examination of the line pattern shows local fluctuation in the same region at both values of , e.g., in the bottom half of the images taken at in Fig. 2(a) and at in Fig. 2(b). This implies that the edge incompressible strip meanders along the equipotential line disturbed by potential disorder.
The same technique was further applied to the spin-gap incompressible region emerging at odd . Figure 3(a) displays SGM images captured near at T. The incompressible strip was observed as a straight line that moves from the higher- edge (at ) to the interior of the Hall bar (at ). As seen in Fig. 3(b), the measured shifts, and widens with decreasing , which is again consistent with the incompressible region (gray area) evaluated with the LSDA calculations that considered the exchange enhancement of the spin gap.
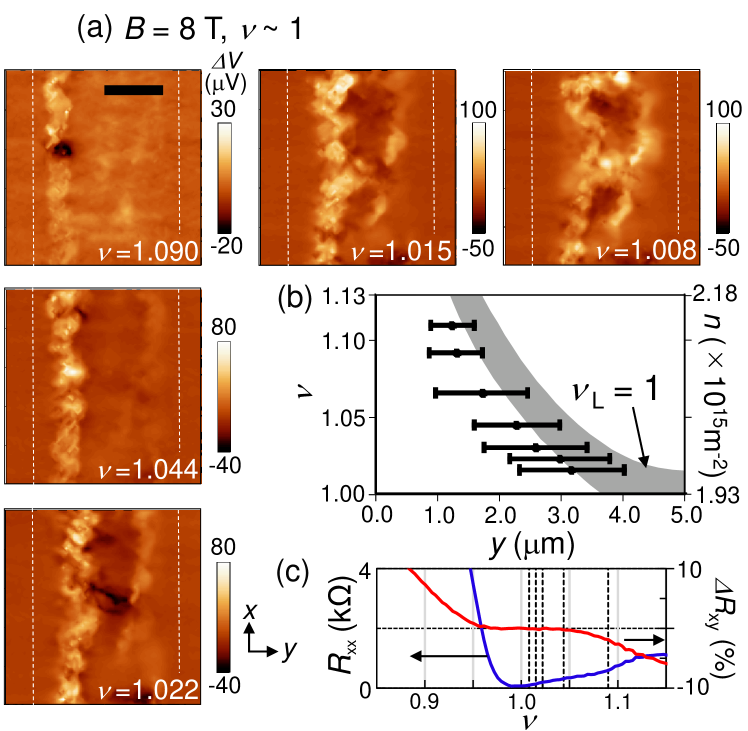
To examine the incompressible bulk localization, we focused on the region closer to (here, ) in which the incompressible region is expected to extend over the entire bulk region, as expected by the LSDA calculation and as shown in the gray region in Fig. 3(b). At and 1.008 (Fig. 3(a)), we found a closed-loop pattern in the incompressible region. Notably, this region corresponds to that in which the global longitudinal and Hall resistances at equilibrium in the QH regime (Fig. 3(c)) exhibit a dip and plateau, respectively. The same tendency was also observed in a wider spatial region at different —namely, T, as shown in Figs. 4(a)–(c). In particular, Fig. 4(c) shows distinct closed loop patterns (around white crosses) over the entire Hall bar in the direction. The observed loop structure is attributed to an incompressible barrier encircling compressible puddles Ilani et al. (2004) where electrons accumulate to screen the potential valley, as depicted in Fig. 4(f) and discussed in Supplementary Material Sup . The average distance between the structures was estimated to be about 3 m, which is of the same order as the separation of the potential-disorder-related states (a few m) observed in a similar modulation-doped quantum well Hayakawa et al. (2013).
The observed evolution of the incompressible phases that shows agreement with the LSDA calculation indicates that the QH phases is microscopically robust against the local breakdown caused by inter-LL scattering under the nonequilibrium condition. The robustness of a QH state is supported by our previously reported scanning nuclear resonance imaging Hashimoto et al. (2018), where we demonstrated the spatial homogeneity of the fully polarized state maintained under similar nonequilibrium conditions near the onset of breakdown of the QH effect. We speculate that this robustness maintains at nonequiliblium up to the limit above which the position of the incompressible pattern showed the dependence (see the Supplementary Material Sup ).
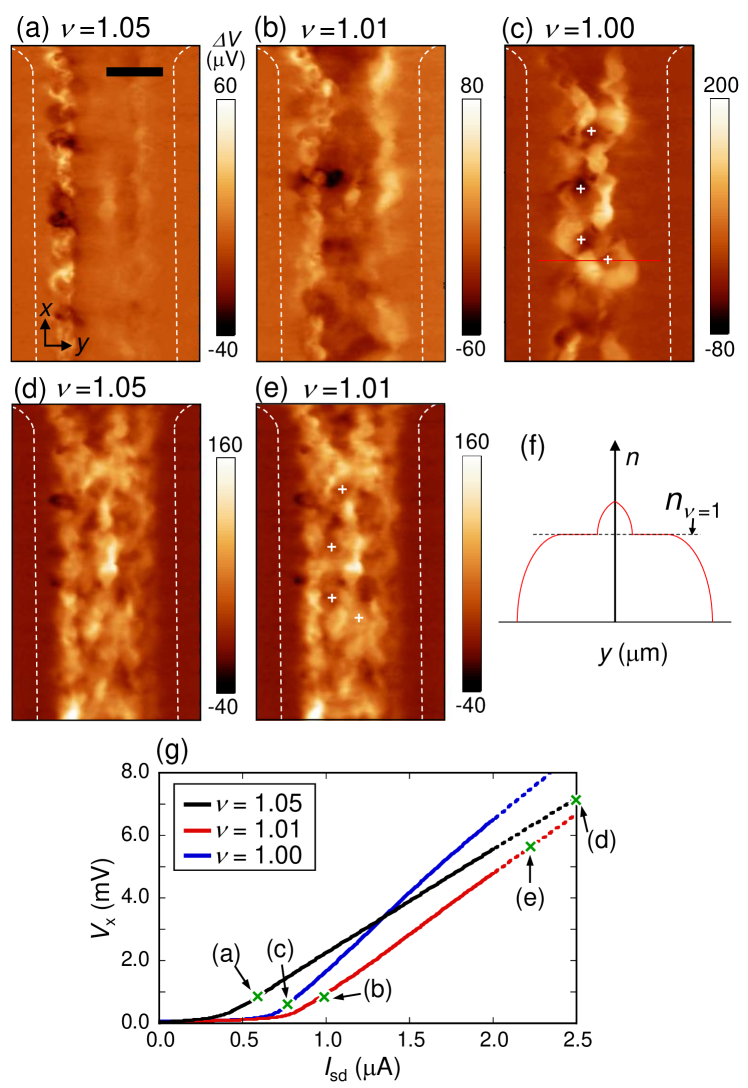
To explore how QH systems are microscopically broken by a larger imposed current, we examined the current-induced evolution of the patterns by imposing up to 2–5 times higher than those used for the low-current images (Figs. 4(a)–(c)), as indicated by the – curves (Fig. 4(g)). As shown in the Supplementary Movies, both the local incompressible patterns near the edge (Fig. 4(a)) and in the bulk region (Fig. 4(b)) gradually expand with increasing to the compressible region, eventually covering the entire region and exhibiting a dense filament pattern independent of (Figs. 4(d)–(e)). The observed vanishing of the dependency in the patterns clearly indicates a global breakdown of the -dependent QH effect.
Compared with the QH incompressible pattern enclosing the compressible puddle (Fig. 4(c)), the observed filament pattern shows a wider distribution and corrugates at a shorter length scale. Notably, the observed filaments partially surround the positions marked by crosses (Fig. 4(e)), which correspond to the positions (crosses in Figs 4(c)) of the disorder-induced QH compressible puddles. These indicate that the filament pattern is correlated with the potential disorder whose potential slope may not be fully screened owing to less compressibility induced by the heating effect Machida et al. (1996); Kato et al. (2009) in the dissipative QH breakdown regime Komiyama et al. (1996); Hashimoto et al. (2018). This implies that inter-LL scattering arises along the potential disorder Güven et al. (2002) over the sample in the deep QH breakdown regime.
In conclusion, using a nonequilibrium-transport-assisted SGM technique, we demonstrated the robustness of the microscopic structures of the incompressible QH phases contributing to topologically quantized and nondissipative transport in a Hall bar. In the deep QH breakdown regime, the observed -dependent characteristics vanish and are unified into a disorder-related pattern, suggesting that microscopic breakdown arises along the potential disorder of the sample. In our future research, we shall use this powerful method to attain a microscopic understanding of nondissipative transport, in the fractional QH effect and other topological edge-transport effects of topological insulators. Our method can probe local properties of topological protection, e.g., by imaging the backscattering sites from the helical edge channel to electron puddles Väyrynen et al. (2013). As such, it can tackle topical issues, such as the suppression of the quantized conductance of the quantum spin Hall effect König et al. (2013); Wu et al. (2018) and the nonzero longitudinal resistance of the anomalous quantum Hall effect Xing et al. (2018); Kawamura et al. (2017), which can be caused by backscattering. Moreover, our method can be applied to research on the hydrodynamics of the QH fluid Eaves (1998); Martin et al. (2003) and extended to the hydrodynamics of Dirac fluid Mendoza et al. (2011).
We thank K. Muraki and NTT for supplying high-quality wafers, K. Sato and K. Nagase for sample preparation, M.H. Fauzi for helpful discussion, and Y. Takahashi for figure preparation. K.H. and T.T. acknowledge the JSPS for financial support: KAKENHI 17H02728 and 18K04874, respectively. Y.H. acknowledges support from the JSPS (KAKENHI 15H05867, 15K21727, and 18H01811), and S.N. also acknowledges the JSPS for their support (15H03673). K.H. and Y.H. thank Tohoku University’s GP-Spin program for support.
References
- Chakraborty and Pietiläinen (2013) T. Chakraborty and P. Pietiläinen, The quantum Hall effects: integral and fractional, Vol. 85 (Springer Science & Business Media, 2013).
- Thouless et al. (1982) D. J. Thouless, M. Kohmoto, M. P. Nightingale, and M. denNijs, Physical Review Letters 49, 405 (1982).
- Hatsugai (1993) Y. Hatsugai, Physical Review Letters 71, 3697 (1993).
- Kane and Mele (2005a) C. L. Kane and E. J. Mele, Physical Review Letters 95, 146802 (2005a).
- Kane and Mele (2005b) C. L. Kane and E. J. Mele, Physical Review Letters 95, 226801 (2005b).
- Bernevig et al. (2006) B. Bernevig, T. Hughes, and S.-C. Zhang, Science 314, 1757 (2006).
- Chang et al. (2013) C. Z. Chang, J. Zhang, X. Feng, J. Shen, Z. Zhang, M. Guo, K. Li, Y. Ou, P. Wei, L. L. Wang, Z. Q. Ji, Y. Feng, S. Ji, X. Chen, J. Jia, X. Dai, Z. Fang, S. C. Zhang, K. He, Y. Wang, L. Lu, X. C. Ma, and Q. K. Xue, Science 340, 167 (2013).
- Fu and Kane (2008) L. Fu and C. L. Kane, Physical Review Letters 100, 096407 (2008).
- Burkov and Balents (2011) A. A. Burkov and L. Balents, Physical Review Letters 107, 127205 (2011).
- Chklovskii et al. (1992) D. B. Chklovskii, B. I. Shklovskii, and L. I. Glazman, Physical Review B 46, 4026 (1992).
- Wulf et al. (1988) U. Wulf, V. Gudmundsson, and R. R. Gerhardts, Physical Review B 38, 4218 (1988).
- Efros et al. (1993) A. L. Efros, F. G. Pikus, and V. G. Burnett, Physical Review B 47, 2233 (1993).
- Yacoby et al. (1999) A. Yacoby, H. F. Hess, T. A. Fulton, L. N. Pfeiffer, and K. W. West, Solid State Communications 111, 1 (1999).
- Ahlswede et al. (2001) E. Ahlswede, P. Weitz, J. Weis, K. Von Klitzing, and K. Eberl, Physica B: Condensed Matter 298, 562 (2001).
- Weis and Klitzing (2011) J. Weis and K. V. Klitzing, Philosophical Transactions of the Royal Society A: Mathematical, Physical and Engineering Sciences 369, 3954 (2011).
- Lai et al. (2011) K. Lai, W. Kundhikanjana, M. A. Kelly, Z.-X. Shen, J. Shabani, and M. Shayegan, Physical Review Letters 107, 176809 (2011).
- Suddards et al. (2012) M. Suddards, A. Baumgartner, M. Henini, and C. J. Mellor, New Journal of Physics 14, 083015 (2012).
- Woodside et al. (2001) M. T. Woodside, C. Vale, P. L. McEuen, C. Kadow, K. D. Maranowski, and A. C. Gossard, Physical Review B 64, 041310 (2001).
- Baumgartner et al. (2007) A. Baumgartner, T. Ihn, K. Ensslin, K. Maranowski, and A. C. Gossard, Physical Review B 76, 085316 (2007).
- Paradiso et al. (2012) N. Paradiso, S. Heun, S. Roddaro, L. Sorba, F. Beltram, G. Biasiol, L. N. Pfeiffer, and K. W. West, Physical Review Letters 108, 246801 (2012).
- Pascher et al. (2014) N. Pascher, C. Rössler, T. Ihn, K. Ensslin, C. Reichl, and W. Wegscheider, Physical Review X 4, 011014 (2014).
- Connolly et al. (2012) M. R. Connolly, R. K. Puddy, D. Logoteta, P. Marconcini, M. Roy, J. P. Griffiths, G. A. C. Jones, P. A. Maksym, . M. Macucci, and C. G. Smith, Nano Letters 12, 5448 (2012).
- König et al. (2013) M. König, M. Baenninger, A. G. Garcia, N. Harjee, B. L. Pruitt, C. Ames, P. Leubner, C. Brüne, H. Buhmann, L. W. Molenkamp, et al., Physical Review X 3, 021003 (2013).
- Dou et al. (2018) Z. Dou, S. Morikawa, A. Cresti, S. W. Wang, C. G. Smith, C. Melios, O. Kazakova, K. Watanabe, T. Taniguchi, S. Masubuchi, T. Machida, and M. R. Connolly, Nano Letters 18, 2530 (2018), 1711.08005 .
- Nowack et al. (2013) K. C. Nowack, E. M. Spanton, M. Baenninger, M. König, J. R. Kirtley, B. Kalisky, C. Ames, P. Leubner, C. Brüne, H. Buhmann, L. W. Molenkamp, D. Goldhaber-Gordon, and K. A. Moler, Nature Materials 12, 787 (2013).
- Huckestein (1995) B. Huckestein, Reviews of Modern Physics 67, 357 (1995).
- Struck and Kramer (2006) A. Struck and B. Kramer, Physical Review Letters 97, 106801 (2006).
- Sohrmann and Römer (2007) C. Sohrmann and R. A. Römer, New Journal of Physics 9, 97 (2007).
- Ilani et al. (2004) S. Ilani, J. Martin, E. Teitelbaum, J. Smet, D. Mahalu, V. Umansky, and A. Yacoby, Nature 427, 328 (2004).
- Steele et al. (2005) G. A. Steele, R. C. Ashoori, L. N. Pfeiffer, and K. W. West, Physical Review Letters 95, 136804 (2005).
- Hashimoto et al. (2008) K. Hashimoto, C. Sohrmann, J. Wiebe, T. Inaoka, F. Meier, Y. Hirayama, R. A. Römer, R. Wiesendanger, and M. Morgenstern, Physical Review Letters 101, 256802 (2008).
- von Klitzing (2019) K. von Klitzing, Physical Review Letters 122, 200001 (2019).
- Siddiki and Gerhardts (2004) A. Siddiki and R. R. Gerhardts, Physical Review B 70, 195335 (2004).
- Eaves et al. (1984) L. Eaves, P. Guimaraes, J. Portal, T. Pearsall, and G. Hill, Physical review letters 53, 608 (1984).
- Eaves (1998) L. Eaves, Physica B: Condensed Matter 256, 47 (1998).
- Wu et al. (2018) S. Wu, V. Fatemi, . Quinn, D. Gibson, K. Watanabe, T. Taniguchi, R. J. Cava, and P. Jarillo-Herrero, Science 359, 76 (2018).
- Xing et al. (2018) Y. Xing, F. Xu, Q. F. Sun, J. Wang, and Y. G. Yao, Journal of Physics Condensed Matter 30, 435303 (2018).
- Topinka et al. (2000) M. Topinka, B. J. LeRoy, S. Shaw, E. Heller, R. Westervelt, K. Maranowski, and A. Gossard, Science 289, 2323 (2000).
- Aoki et al. (2005) N. Aoki, C. R. Da Cunha, R. Akis, D. K. Ferry, and Y. Ochiai, Physical Review B 75, 155327 (2005).
- (40) See Supplementary Materials at http://link.aps.org/ supplemental// for details on the methods of the SGM measurement, experimental analysis, and LSDA calculation. It contains Refs. [10,34-37].
- Eaves and Sheard (1986) L. Eaves and F. W. Sheard, Semiconductor Science and Technology 1, 346 (1986).
- Panos et al. (2014) K. Panos, R. Gerhardts, J. Weis, and K. von Klitzing, New Journal of Physics 16, 113071 (2014).
- Hashimoto et al. (2018) K. Hashimoto, T. Tomimatsu, K. Sato, and Y. Hirayama, Nature Communications 9, 2215 (2018).
- Nomura and Aoyagi (2004) S. Nomura and Y. Aoyagi, Physical Review Letters 93, 096803 (2004).
- Mamyouda et al. (2015) S. Mamyouda, H. Ito, Y. Shibata, S. Kashiwaya, M. Yamaguchi, T. Akazaki, H. Tamura, Y. Ootuka, and S. Nomura, Nano Letters 15, 2417 (2015).
- Güven and Gerhardts (2003) K. Güven and R. R. Gerhardts, Physical Review B 67, 115327 (2003).
- Hayakawa et al. (2013) J. Hayakawa, K. Muraki, and G. Yusa, Nature Nanotechnology 8, 31 (2013).
- Machida et al. (1996) T. Machida, H. Hirai, S. Komiyama, T. Osada, and Y. Shiraki, Phys. Rev. B 54, 14261 (1996).
- Kato et al. (2009) M. Kato, A. Endo, S. Katsumoto, and Y. Iye, Physical Review Letters 102, 086802 (2009).
- Komiyama et al. (1996) S. Komiyama, Y. Kawaguchi, T. Osada, and Y. Shiraki, Physical Review Letters 77, 558 (1996).
- Güven et al. (2002) K. Güven, R. R. Gerhardts, I. I. Kaya, E. Sagol, B, and G. Nachtwei, Physical Review B 65, 155316 (2002).
- Väyrynen et al. (2013) J. I. Väyrynen, M. Goldstein, and L. I. Glazman, Physical Review Letters 110, 22 (2013).
- Kawamura et al. (2017) M. Kawamura, R. Yoshimi, A. Tsukazaki, K. S. Takahashi, M. Kawasaki, and Y. Tokura, Physical Review Letters 119, 016803 (2017).
- Martin et al. (2003) A. Martin, K. Benedict, F. Sheard, and L. Eaves, Physical review letters 91, 126803 (2003).
- Mendoza et al. (2011) M. Mendoza, H. Herrmann, and S. Succi, Physical review letters 106, 156601 (2011).