Double-Decker Filament Configuration Revealed by Mass Motions
Abstract
It is often envisaged that dense filament material lies in the dips of magnetic field lines belonging to either a sheared arcade or a magnetic flux rope. But it is also debated which configuration correctly depicts filaments’ magnetic structure, due to our incapacity to measure the coronal magnetic field. In this paper, we address this issue by employing mass motions in an active-region filament to diagnose its magnetic structure. The disturbance in the filament was driven by a surge initiated at the filament’s eastern end in the NOAA active region 12685, which was observed by the 1-m New Vacuum Solar Telescope (NVST) in the H line center and line wing ( Å). Filament material predominately exhibits two kinds of motions, namely, rotation about the spine and longitudinal oscillation along the spine. The former is evidenced by antisymmetric Doppler shifts about the spine; the latter features a dynamic barb with mass extending away from the H spine until the transversal edge of the EUV filament channel. The longitudinal oscillation in the eastern section of the filament is distinct from that in the west, implying that the underlying field lines have different lengths and curvature radii. The composite motions of filament material suggest a double-decker host structure with mixed signs of helicity, comprising a flux rope atop a sheared-arcade system.
1 Introduction
Solar filaments are composed of dense (1011-12 cm-3) and cold plasma (104K) suspended in the tenuous (108-9 cm-3) and hot (106K) corona, hence appear dark in H or EUV against the solar disk. As filament threads are most likely aligned with magnetic field (Lin et al., 2005), high-resolution observations possess the potential of disclosing magnetic structures above the photosphere, which we still cannot measure directly. In EUV, a dark corridor termed “EUV filament channel” is well extended beyond the H filament. This enhanced width is explained by Lyman continuum absorption of EUV radiation ( Å) and “volume blocking”, an additional reduction in EUV intensity because the cool plasma occupying the corridor does not emit any EUV radiation (Anzer & Heinzel, 2005). Usually solar eruptions originate from filament channels, where dense filament material may or may not be present but the magnetic field is highly non-potential and opposite in polarity at two sides. Hence the magnetic configuration of filaments is crucial for understanding the physics of solar eruptions (Mackay et al., 2010).
Three kinds of filament models with distinct magnetic configurations have been proposed in the literature, namely the wire model (Martin & Echols, 1994; Lin et al., 2008), the sheared arcade model (Kippenhahn & Schlüter, 1957), and the twisted flux-rope model (Kuperus & Raadu, 1974). The empirical wire model assumes that a filament is composed of field-aligned fine threads. It differs from the other two in the absence of magnetic dips, which are present either at the top of a sheared arcade or the bottom of a flux rope. Besides its structural and morphological similarities with coronal cavities (§3.3 in Gibson, 2018), the flux rope model is appealing in that its helical windings provide for filament plasma both support against gravity and thermal insulation from the hot corona. Further, it explains the inverse-polarity configuration observed often in quiescent filaments (Leroy et al., 1984; Bommier & Leroy, 1998), i.e., the magnetic field traversing the filament is directed from negative to positive polarity. The sheared arcade model generally implies a normal-polarity configuration, but a mixture of normal- and inverse-polarity dips is found in numerical experiments (Aulanier et al., 2002).
Although the flux-rope model is consistent with many active-region filaments (e.g., Dudík et al., 2008; Canou & Amari, 2010; Sasso et al., 2014; Liu et al., 2014a, 2016), more complicated magnetic configurations are not rare. For example, Guo et al. (2010) found that a flux rope and a sheared arcade match two sections of a filament separately. To explain a ‘double-decker’ filament that was resolved stereoscopically and later erupted partially, Liu et al. (2012) proposed two possible configurations, either a double flux rope or a single flux rope atop a sheared arcade. The former configuration has found support in modeling (Kliem et al., 2014) and in more observations (e.g., Cheng et al., 2014; Zhu et al., 2015; Liu et al., 2016, 2017). The latter configuration is considered natural for a flux rope suspended high in the corona, but direct observational evidence has been lacking. Further, Awasthi et al. (2018) identified an even more complex flux-rope system with multiple branches braiding about each other, displaying signatures of internal reconnections.
An additional modeling constraint is the pattern of filament chirality, which is consistent with the hemispheric rule of magnetic helicity (Pevtsov et al., 1995). By definition, a filament is dextral (sinistral) if its axial magnetic field points right (left) when viewed from its positive-polarity side. It is believed that a dextral (sinistral) filament has right-bearing (left-bearing) barbs, a bundle of filament threads extruding out of the filament spine in a way similar to right- or left-bearing exit ramps off a highway. The majority of filaments in the northern (southern) hemisphere indeed have right-bearing (left-bearing) barbs and are overarched by left-skewed (right-skewed) coronal arcades, corresponding to the dominantly negative (positive) helicity in the same hemisphere (Martin, 1998; Bernasconi et al., 2005; Pevtsov et al., 2003; Yeates et al., 2007). However, Chen et al. (2014) argued that the correspondence between the filament chirality and the bearing sense of barbs works only for filaments supported by flux ropes and the correspondence is reversed for sheared arcades, if the sheared arcade possesses the same sign of helicity as the flux rope. Alternatively, Chen et al. (2014) proposed that a filament is dextral (sinistral) if during the eruption the conjugate sites of plasma draining are right-skewed (left-skewed) with respect to the polarity inversion line (PIL). With this new criteria, the hemispheric rule of filament chirality is significantly strengthened (Ouyang et al., 2017).
Mass motions in a filament also provide clues on its host magnetic field (e.g., Zirker et al., 1998; Okamoto et al., 2016; Wang et al., 2018) or how it interacts with the surrounding field (e.g., Liu et al., 2018), assuming a low- plasma environment. Filament ‘winking’ (Dyson, 1930), later recognized as large-amplitude oscillations (Ramsey & Smith, 1966), is promising in probing the filament magnetic field. Often activated by shock waves impinging on the filament side, transverse oscillations perpendicular to the filament spine have been modeled by a damped harmonic oscillator with magnetic tension serving as the restoring force (Hyder, 1966). In contrast, longitudinal oscillations along the spine are often activated by a subflare (e.g., Jing et al., 2003, 2006) or a jet (e.g., Luna et al., 2014) at one end of the filament, or, occasionally by a shock wave propagating along the filament spine (e.g., Shen et al., 2014). Various restoring forces have been considered since the discovery of the phenomenon (Jing et al., 2003), e.g., the magnetic pressure gradient (Vršnak et al., 2007), the gas pressure gradient (Jing et al., 2003; Vršnak et al., 2007), and the projected gravity in a magnetic dip (Jing et al., 2003; Zhang et al., 2012; Luna & Karpen, 2012). The first two forces have implications that are seldom observed, either predicting motions perpendicular to the local magnetic field (however, see Zhang et al., 2017) or requiring a temperature difference of several million Kelvins (Vršnak et al., 2007). The simplified pendulum model, however, appears self-consistent and can provide diagnostics on magnetic parameters such as the curvature of the field-line dip and the minimum field strength (Luna & Karpen, 2012; Luna et al., 2014).
Here we investigate in an active-region filament two co-existing dynamic motions triggered by a small flare, i.e., longitudinal oscillations along, and rotary motions about, the spine (§2). In §3 we confront the existing filament models with the observations and propose a double-decker configuration.
2 Observations & Analysis
2.1 Instruments
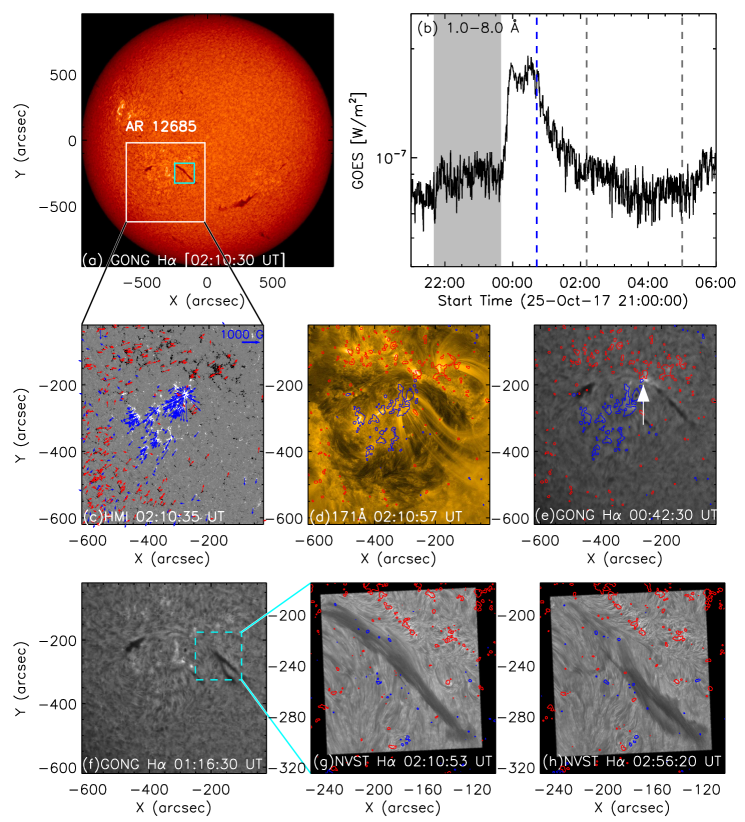
In this study we mainly used H observations acquired by the 1-m New Vacuum Solar Telescope (NVST; Liu et al. (2014b)) at three wavelength positions, namely the line-center and the line wing at 0.4 Å, during 02:10:54 UT–04:57:02 UT on 2017 October 26. After being processed by a speckle-masking method, the H images have a pixel scale of and a cadence of 28 s. To provide the context, we have also utilized EUV images of the full-disk Sun with a pixel scale of (corresponding to a spatial resolution of ) and a temporal cadence of 12 s acquired by the Atmospheric Imaging Assembly (AIA; Lemen et al., 2012)) onboard Solar Dynamical Observatory (SDO; Pesnell et al., 2012), photospheric magnetograms made available by the Helioseismic and Magnetic Imager (HMI; Scherrer et al., 2012)) onboard SDO, full-disk H images with an pixel scale and a 60-s temporal cadence provided by the Global Oscillation Network Group (GONG), and soft X-ray flux at 1–8 and 0.5–4 Å by the Geostationary Operational Environmental Satellites (GOES).
2.2 Morphological and Dynamical Characteristics of the Filament
The filament of interest was located in the NOAA active region 12685 on 2017 October 26 (Figure 1a). In the line-of-sight magnetogram, the active region is characterized by positive magnetic fluxes around the sunspot in the center and negative fluxes in the surrounding facular region (Figure 1c). Aligned along the PIL, the dark EUV filament channel possesses a similar circular shape, as observed in 171 Å (Figure 1d). The H filament under investigation occupies the northwestern section of the filament channel, oriented in a northeast-southwest direction (Figure 1e). For simplicity, the filament’s two half sections are hereafter referred to as the eastern and western section, respectively.
The filament was already dynamic in the earliest image recorded by NVST (Figure 1g), which covered the gradual phase of a B1.9-class flare (Figure 1b). Analyzing earlier AIA 171 Å and GONG H observations, we found that particularly the eastern section of the H filament under investigation exhibits multiple episodes of disturbances energized by precursor activities near the eastern end of the filament, where positive fluxes in the south contact negative fluxes in the north (marked by an arrow in Figure 1c). The B-class flare occurs in the same place and initiates a surge (Figure 1e and accompanying animation) that is directed westward and disturbs the filament. Following the flare, filament material in the eastern section of the H filament shoots southwestward, reaching as far as 20′′ away from the spine, and then moves backward, forming a ‘dynamic’ barb structure that is right-bearing with respect to the filament spine (Figure 1(g–h)). Below the dynamical motions are investigated in detail.
2.2.1 Large-Amplitude Longitudinal Oscillations
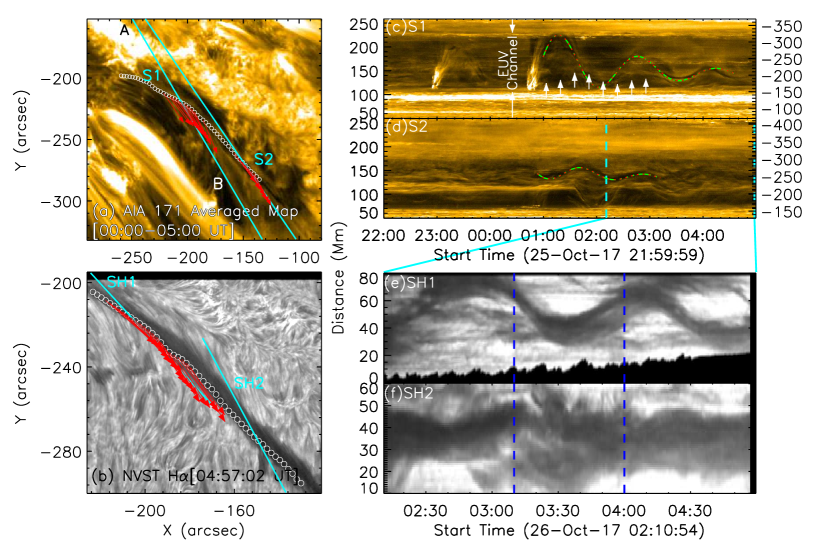
To characterize the oscillations of the filament, we employed the technique of Luna et al. (2014, 2018). Firstly, the filament spine is represented by 50 uniformly-spaced points picked by visual inspection of the averaged EUV 171 image (during 00:00–05:00 UT; Figure 2a) and NVST H image obtained at 04:57:02 UT (Figure 2b), respectively. We then constructed time-distance maps (hereafter TD maps) through a series of virtual slits centered on each spine point and oriented with angles relative to the solar west ranging from +15∘ to -85∘ at a step of 2∘. The slits are numbered 1–50 from east to west. A total of 2500 TD maps were prepared from EUV 171 images obtained during 25-Oct-2017 21:00 UT–26-Oct-2017 05:00 UT (in view of the prolonged precursor activities; see Figure 1b) and all the NVST H images available. The slit length is (261 Mm) for EUV (Figure 2(c & d)) and (79 Mm) for H images (Figure 2(e & f)). The TD maps display typical large-amplitude longitudinal oscillations, with temporal agreement between EUV and H. EUV TD maps reveal the flare-induced brightening as the trigger of the filament oscillation, which reaches as far as the boundary of the EUV filament channel (Figure 2c). Further, a precursor surge at about 23:00 UT on 2017 October 25 also triggered the oscillation in the same direction as that of the impending flare, however with a smaller amplitude.
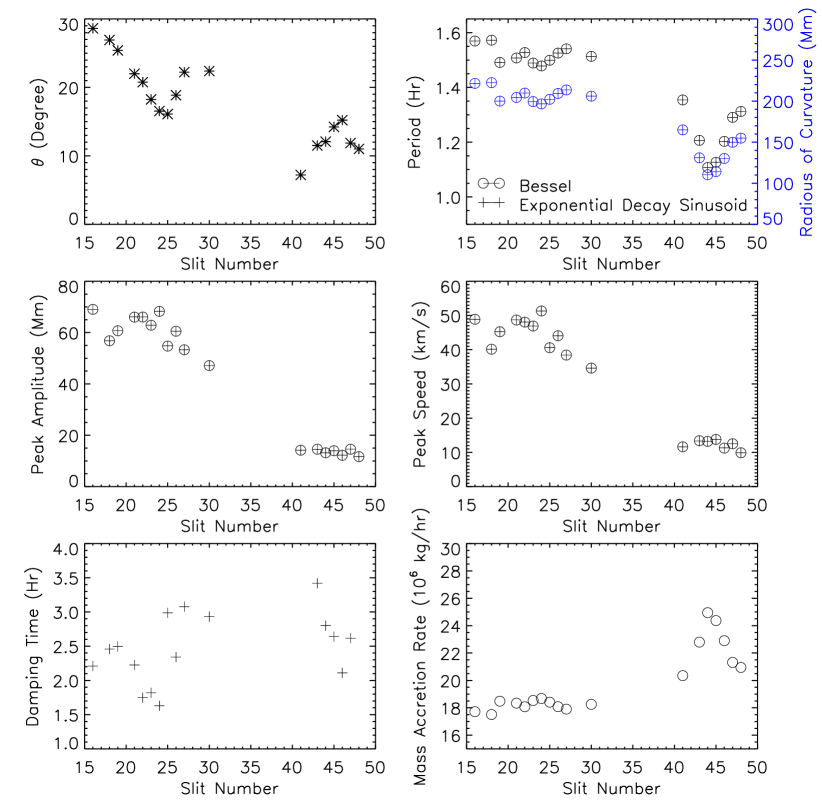
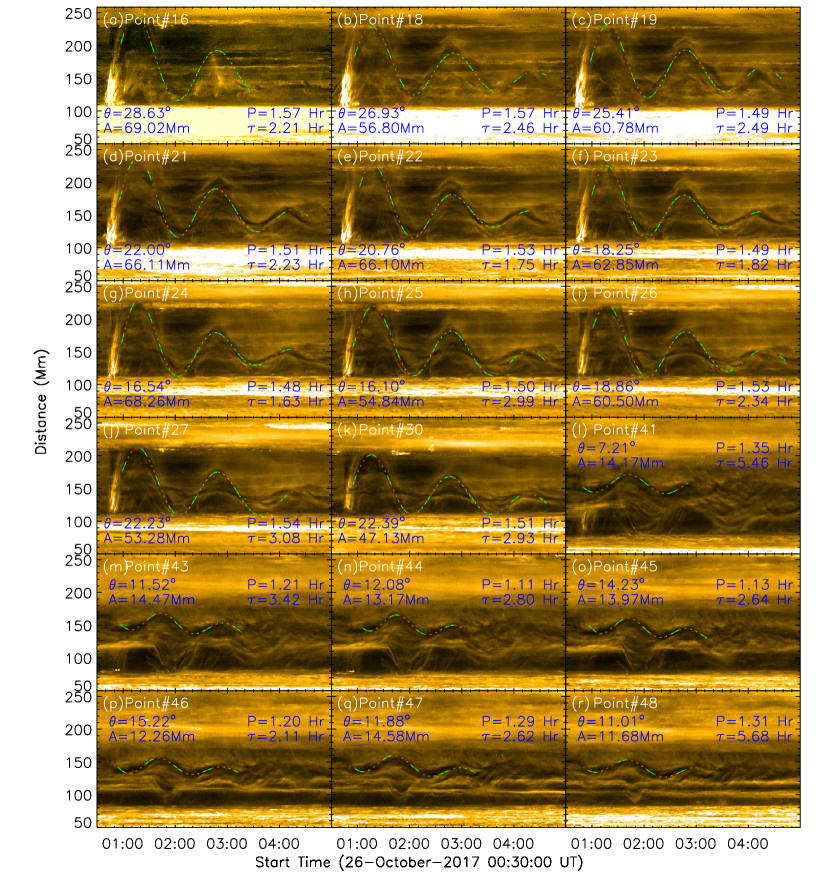
We then visually identified the best TD map characterizing the oscillations at each spine position, following the same rules as in Luna et al. (2014). For each selected map, the angle of the slit relative to the spine provides the oscillation direction (), which is found to vary in the range 7∘–30∘ (Figure 3b). At the intermediate spine positions, the oscillation direction (23∘) is consistent with previous observations utilizing the Hanel effect to measure the field direction relative to the filament spine (Leroy et al., 1983). Next, the oscillatory pattern , extracted using the method elaborated in Appendix A, are fitted with both the exponentially decaying sinusoidal and Bessel functions as follows (Luna & Karpen, 2012; Luna et al., 2014),
| (1) |
| (2) |
where is the oscillation center at the time () of maximum amplitude . , , and represent the period, initial phase, and damping time-scale of the oscillation, respectively. in Eq. 2 accounts for additional small-scale energy losses. In general, both functions yield almost the same fitting to the oscillation patterns (Figure 2c & d) with a typical standard deviation 50 arcsec2, indicating the fitting results to be reliable. The difference between the two fitting curves is extremely small compared to the dynamic range of the oscillation (see Appendix A).
From the fitting results, one can see that the oscillatory pattern in the eastern section is distinct from that in the western section in terms of the oscillation direction , period , peak amplitude, and peak speed (Figure 3). Particularly, a simple pendulum analogy gives the curvature radius of field lines (Figure 3b), i.e., (Luna et al., 2014). The calculation indicates that the curvature radius of field lines in the east (200–220 [15] Mm111The uncertainties of all the fitting parameters are relatively small and hence not shown in Figure 3, but the maximum is reported alongside the respective parameter.) is larger than that in the west (110–160 [10] Mm; Figure 3b). In the TD maps one can discern in the east an oscillatory pattern (Figure 2c) similar to that in the west (Figure 2d). It is very faint, probably obscured by the dominant oscillation in the east, but appears in phase with its western counterpart. Thus, two distinct and out-of-phase oscillatory patterns coexist in the east, but only one exists in the west.
The damping of oscillations can be modeled by a continued mass accretion by condensation at a rate (Luna & Karpen, 2012), where is the mass of the filament at . and are defined in Eq. 2. Here the surge feeds mass into the filament. We estimated to be kg, following Eq. (8) in Luna et al. (2014). We found that ranges between 17–26 kg/hr, comparable to kg/hr in Luna et al. (2014). The error is large ( kg/hr in our case) because of large uncertainties in estimating .
2.2.2 Rotational Motion Around the Spine
Besides the longitudinal oscillations, an apparent rolling or transverse motion of individual filament threads is discernible around the filament spine, especially in the western section (see the animation accompanying Figure 4), which is reminiscent of the helical motions studied by Okamoto et al. (2016). To further understand this motion, we constructed Dopplergrams employing the following equation (Langangen et al., 2008),
| (3) |
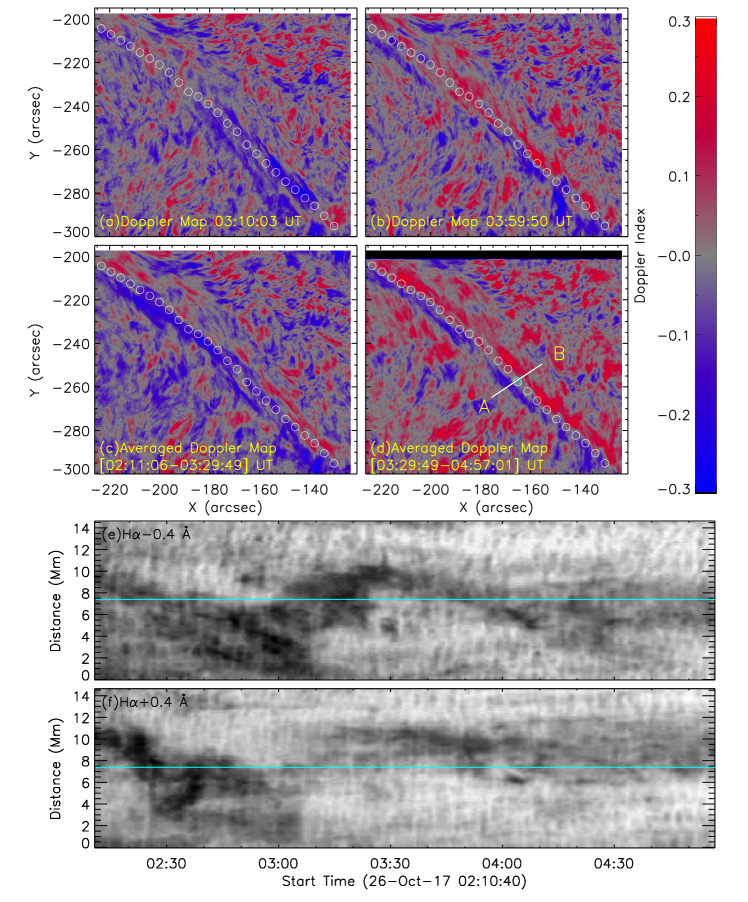
where and denote the pixel intensity recorded in the blue-wing (H-0.4 Å) and red-wing (H+0.4 Å) images, respectively. For absorption features like filaments, Doppler blue-shift (red-shift) is translated to negative (positive) Doppler index , indicating plasma motions towards (away from) the observer. At 03:10:03 UT the Doppler map shows an upward motion of the material predominately at the immediate south of the spine (Figure 4a) and at 03:59:50 UT a downward motion at the immediate north of the spine (Figure 4b). Averaging Dopplergrams over 02:11:06–03:29:49 UT (Figure 4c) and 03:29:49–04:57:01 UT (Figure 4d), we found this pattern persists, i.e., consistent blue (red) shift appears in the immediate south (north) of the filament spine during the whole temporal sequence. This suggests a rotational motion of the filament material around the spine, because the Doppler pattern would have changed periodically and ended up canceling out each other with a long time integration if the filament material were oscillating up and down.
To make further sense of the Doppler pattern, we prepared time-distance maps with blue- and red-wings H images (Figure 4(e & f)) along a slit perpendicularly across the spine (Figure 4d). Through the slit longitudinal oscillations are recorded as transverse motions across the spine. But beside the transverse motions, one can also see that at 03:10 UT the blue wing looks significantly darker than the red wing in the south of the spine, which explains the dominant blue-shift therein (Figure 4a). In contrast, at 03:59 UT the red wing looks darker than the blue wing in the north of the spine, which explains the dominant red-shift therein (Figure 4b). Thus, either blue or red shift may dominate in an instantaneous Dopplergram because of the longitudinal oscillations superimposed upon the rotational motions.
Oppositely directed motions on two sides of the filament spine have been noticed before (e.g., Engvold et al., 1985; Williams et al., 2009), and were interpreted by either flows following the magnetic field of a helical flux rope (Engvold et al., 1985) or internal motions of the flux-rope field lines due to the kink instability (Williams et al., 2009). With high-resolution EUV and H observations presented above, we are able to exclude the latter possibility, as no kinking motions of the filament spine are visible (Gilbert et al., 2007).
3 Discussion and Conclusion
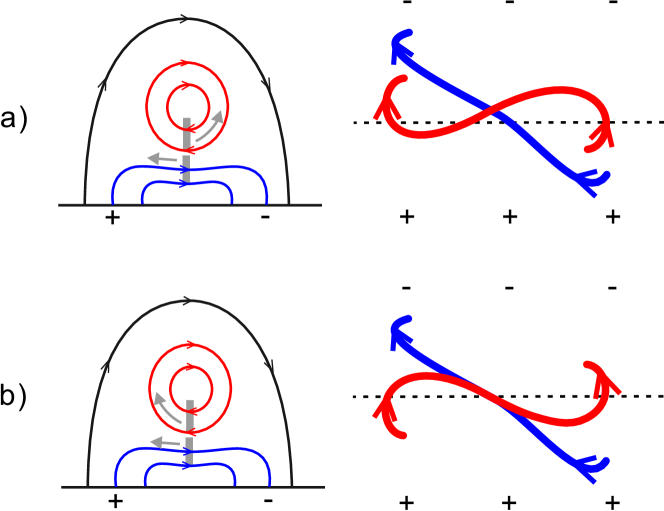
This paper presents distinctive yet co-existing motions in an active-region filament, viz., rotation around, and longitudinal oscillation along, the filament spine. Constrained by the EUV filament channel, the large-amplitude longitudinal oscillations make an acute angle with the filament spine, which is consistent with oscillations along sheared magnetic field lines across the PIL (Karpen et al., 2005; Luna & Karpen, 2012; Luna et al., 2018). The rotating plasma, on the other hand, argues strongly for the presence of twisted field lines in the vicinity of the spine. Since there is no sign of bald patches (Figure 1c; Titov et al., 1993) – an inverse-polarity configuration at the photosphere (), we propose a ‘double-decker’ configuration comprising a flux-rope atop a sheared arcade (Figure 5; see also Liu et al., 2012) to account for the filament magnetic field as outlined by plasma motions. The wide EUV filament channel corresponds to the sheared arcade, while the narrow H filament corresponds to the co-spatial dips of both the flux rope and of the sheared arcade, where filament material is expected to be mostly concentrated and thermally insulated. Flux ropes often have an inverted teardrop shape in cross section (e.g., Jiang et al., 2018), which may explain why the Doppler shifts associated with rotational motions are mainly detected around the spine. However, such a configuration appears not uniform along the spine. This is evidenced by the two distinctive patterns of longitudinal oscillations (Figure 3), from which we derive small- field lines in the western section, but both small- and large- field lines in the eastern section. Since twisted field lines are typically longer and possess smaller curvature radii than sheared field lines, we speculate that the sheared arcade in the east does not communicate with its counterpart in the west, while the flux rope extends along the whole spine as suggested by the Dopplergrams (Figure 4). It is likely that the surge disturbs both the eastern sheared arcade and the flux rope, but fails to trigger longitudinal oscillations in the western sheared arcade.
This hybrid configuration may accommodate two possible scenarios depending upon how the flux rope is winded and anchored. Consequently, plasma would move in opposite directions in the flux rope when disturbed by the westward surge initiated at its eastern end (Figure 5). Although Dopplergrams are only available during the 2nd oscillation cycle and beyond (marked in Figure 2(d & e)), we hypothesize that the rotational pattern is similar during the 1st cycle, with upward (downward) motions at the immediate south (north) of the spine. This pattern is consistent with Figure 5b, in which the flux rope and sheared arcade are anchored at the opposite side of the PIL but the twisted field lines cross the PIL in an inverse-polarity manner. We hence exclude the alternative scenario (Figure 5a), in which the flux rope also has an inverse-polarity configuration but is anchored at the same side of the PIL as the sheared arcade.
In the proposed configuration (Figure 5b), the right-skewed sheared arcade possesses positive helicity, which is dominant in the southern hemisphere (Pevtsov et al., 1995); but the flux rope possesses negative (left-handed) helicity, exhibiting an inverse-S shape, the dominant shape of soft X-ray sigmoids in the northern hemisphere (Pevtsov et al., 2001). Following the reasoning by Chen et al. (2014), one would expect right-bearing barbs at the dips of both the shear arcade and the flux rope, because the arcade and the rope possess opposite signs of helicity. Indeed the dynamic barb as excited by the surge is right-bearing; but the filament is sinistral because the axial field points to the left if we view the filament from the positive-polarity side (Martin, 1998). Here the correspondence between the filament chirality and the bearing sense of barbs does not conform to the conventional wisdom because mixed signs of helicity is distributed above the same PIL. Such a distribution of helicity may result from an injection of opposite helicity through photospheric evolution (e.g., Liu et al., 2010; Chandra et al., 2010; Romano et al., 2011). Unfortunately we cannot explore this possibility here because AR 12685 was highly decayed at the time of the event investigated. If there were any significant helicity injection, it must have occurred during the early phase of the active region.
Alternatively, an injection of excess twist into the filament from one footpoint could drive a combination of longitudinal and rotational plasma motions (Uchida et al., 2001; Vršnak et al., 2007). However, when the Alfvén-wave packet caused by the injection is reflected at the opposite footpoint, the direction of rotational motions is expected to reverse, but in our case the Doppler pattern persists (Figure 4). Moreover, we found no sign of twisting motions in the surge. Hence we dismissed the wave-packet interpretation for the current observation. But we cannot dismiss the possibility that the observed rotational motion is a manifestation of unwinding relaxation; in other words, magnetic twist is propagating out of rather than into the filament, which could happen when the twisted filament field reconnects with the ambient, untwisted field (Okamoto et al., 2016). Additionally, Jing et al. (2003, 2006) speculated that a mass perturbation in a fine thread would propagate along the spine across the obliquely stacked threads making up the filament. In our high-resolution observations, it is clear that mass motions involved in longitudinal oscillations are directed along individual threads, but it is obscure whether there are any perturbations propagating across the threads.
To conclude, this study has demonstrated a promising methodology to diagnose the magnetic configuration of filaments and has substantiated the presence of the double-decker configuration with a flux rope atop a sheared arcade (Liu et al., 2012). Since no discernible separation is seen inside the filament studied, such a configuration might be more common than previously thought. With this configuration, however, one expects normal polarity in the lower atmosphere but inverse polarity in the higher atmosphere; because of the mixed signs of helicity, one also expects two pairs of plasma draining sites if the filament fully erupts, except that double-decker filaments often erupt partially (e.g., Liu et al., 2012; Cheng et al., 2014; Zhu et al., 2015). These predictions remain to be verified by future observation.
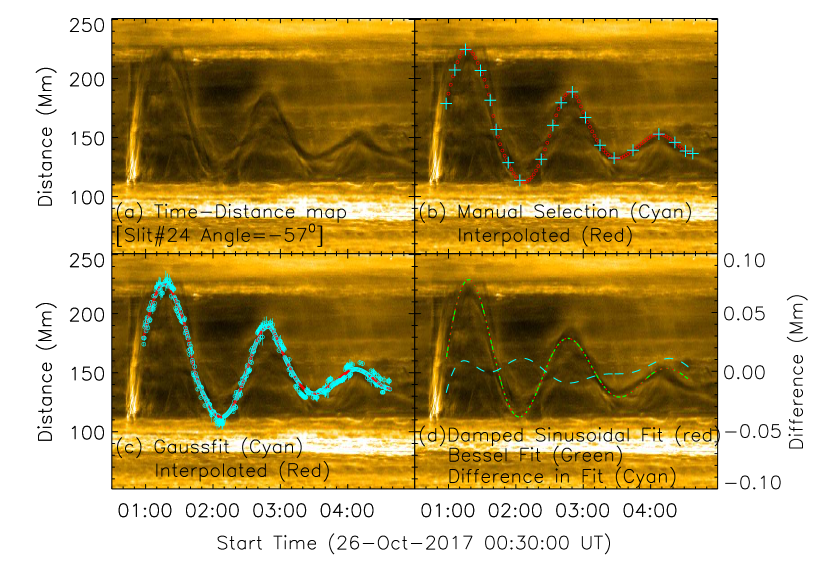
Appendix A Extraction of Oscillatory Patterns
From the representative TD maps selected along the spine (Figure 6), we extracted the oscillatory pattern through a semi-automatic procedure which starts by visually choosing 20 points outlining the entire discernible pattern (Figure 7b). Next, we applied a cubic spline to interpolate the intermediate points (Figure 7b). We further refined the interpolations if the intensity profiles deduced from the TD maps can be well fitted by a Gaussian function (gaussfit.pro; Figure 7c). Each intensity profile is 20 pixels wide, centering on the minimum intensity location within 15 pixels of the original interpolated location. The full-width-half-maximum of the best-fit Gaussian function is considered as the uncertainty of oscillation amplitude. We then fitted the extracted oscillation pattern by the exponentially decaying sinusoidal and Bessel functions with a non-linear least squares fitting method (mpfitfun.pro; Figure 7d). The difference between the two fitting curves is very small with a maximum value Mm (1 pixel on TD maps 0.44 Mm) for the case shown in Figure 7d.
References
- Anzer & Heinzel (2005) Anzer, U., & Heinzel, P. 2005, ApJ, 622, 714, doi: 10.1086/427817
- Aulanier et al. (2002) Aulanier, G., DeVore, C. R., & Antiochos, S. K. 2002, ApJ, 567, L97, doi: 10.1086/339436
- Awasthi et al. (2018) Awasthi, A. K., Liu, R., Wang, H., Wang, Y., & Shen, C. 2018, ApJ, 857, 124, doi: 10.3847/1538-4357/aab7fb
- Bernasconi et al. (2005) Bernasconi, P. N., Rust, D. M., & Hakim, D. 2005, Sol. Phys., 228, 97, doi: 10.1007/s11207-005-2766-y
- Bommier & Leroy (1998) Bommier, V., & Leroy, J. L. 1998, in Astronomical Society of the Pacific Conference Series, Vol. 150, IAU Colloq. 167: New Perspectives on Solar Prominences, ed. D. F. Webb, B. Schmieder, & D. M. Rust, 434
- Canou & Amari (2010) Canou, A., & Amari, T. 2010, ApJ, 715, 1566, doi: 10.1088/0004-637X/715/2/1566
- Chandra et al. (2010) Chandra, R., Pariat, E., Schmieder, B., Mandrini, C. H., & Uddin, W. 2010, Sol. Phys., 261, 127, doi: 10.1007/s11207-009-9470-2
- Chen et al. (2014) Chen, P. F., Harra, L. K., & Fang, C. 2014, ApJ, 784, 50, doi: 10.1088/0004-637X/784/1/50
- Cheng et al. (2014) Cheng, X., Ding, M. D., Zhang, J., et al. 2014, ApJ, 789, 93, doi: 10.1088/0004-637X/789/2/93
- Dudík et al. (2008) Dudík, J., Aulanier, G., Schmieder, B., Bommier, V., & Roudier, T. 2008, Sol. Phys., 248, 29, doi: 10.1007/s11207-008-9155-2
- Dyson (1930) Dyson. 1930, MNRAS, 91, 239, doi: 10.1093/mnras/91.2.239
- Engvold et al. (1985) Engvold, O., Tandberg-Hanssen, E., & Reichmann, E. 1985, Sol. Phys., 96, 35, doi: 10.1007/BF00239793
- Gibson (2018) Gibson, S. E. 2018, Living Reviews in Solar Physics, 15, 7, doi: 10.1007/s41116-018-0016-2
- Gilbert et al. (2007) Gilbert, H. R., Alexander, D., & Liu, R. 2007, Sol. Phys., 245, 287, doi: 10.1007/s11207-007-9045-z
- Guo et al. (2010) Guo, Y., Schmieder, B., Démoulin, P., et al. 2010, ApJ, 714, 343, doi: 10.1088/0004-637X/714/1/343
- Hyder (1966) Hyder, C. L. 1966, ZAp, 63, 78
- Jiang et al. (2018) Jiang, C., Zou, P., Feng, X., et al. 2018, ApJ, 869, 13, doi: 10.3847/1538-4357/aaeacc
- Jing et al. (2006) Jing, J., Lee, J., Spirock, T. J., & Wang, H. 2006, Sol. Phys., 236, 97, doi: 10.1007/s11207-006-0126-1
- Jing et al. (2003) Jing, J., Lee, J., Spirock, T. J., et al. 2003, ApJ, 584, L103, doi: 10.1086/373886
- Karpen et al. (2005) Karpen, J. T., Tanner, S. E. M., Antiochos, S. K., & DeVore, C. R. 2005, ApJ, 635, 1319, doi: 10.1086/497531
- Kippenhahn & Schlüter (1957) Kippenhahn, R., & Schlüter, A. 1957, ZAp, 43, 36
- Kliem et al. (2014) Kliem, B., Török, T., Titov, V. S., et al. 2014, ApJ, 792, 107, doi: 10.1088/0004-637X/792/2/107
- Kuperus & Raadu (1974) Kuperus, M., & Raadu, M. A. 1974, A&A, 31, 189
- Langangen et al. (2008) Langangen, Ø., Rouppe van der Voort, L., & Lin, Y. 2008, ApJ, 673, 1201, doi: 10.1086/524057
- Lemen et al. (2012) Lemen, J. R., Title, A. M., Akin, D. J., et al. 2012, Sol. Phys., 275, 17, doi: 10.1007/s11207-011-9776-8
- Leroy et al. (1983) Leroy, J. L., Bommier, V., & Sahal-Brechot, S. 1983, Sol. Phys., 83, 135, doi: 10.1007/BF00148248
- Leroy et al. (1984) —. 1984, A&A, 131, 33
- Lin et al. (2005) Lin, Y., Engvold, O., Rouppe van der Voort, L., Wiik, J. E., & Berger, T. E. 2005, Sol. Phys., 226, 239, doi: 10.1007/s11207-005-6876-3
- Lin et al. (2008) Lin, Y., Martin, S. F., & Engvold, O. 2008, in Astronomical Society of the Pacific Conference Series, Vol. 383, Subsurface and Atmospheric Influences on Solar Activity, ed. R. Howe, R. W. Komm, K. S. Balasubramaniam, & G. J. D. Petrie, 235
- Liu et al. (2017) Liu, L., Wang, Y., Liu, R., et al. 2017, ApJ, 844, 141, doi: 10.3847/1538-4357/aa7d56
- Liu et al. (2018) Liu, R., Chen, J., & Wang, Y. 2018, Science China Physics, Mechanics, and Astronomy, 61, 69611, doi: 10.1007/s11433-017-9147-x
- Liu et al. (2012) Liu, R., Kliem, B., Török, T., et al. 2012, ApJ, 756, 59, doi: 10.1088/0004-637X/756/1/59
- Liu et al. (2010) Liu, R., Liu, C., Wang, S., Deng, N., & Wang, H. 2010, ApJ, 725, L84, doi: 10.1088/2041-8205/725/1/L84
- Liu et al. (2014a) Liu, R., Titov, V. S., Gou, T., et al. 2014a, ApJ, 790, 8, doi: 10.1088/0004-637X/790/1/8
- Liu et al. (2016) Liu, R., Kliem, B., Titov, V. S., et al. 2016, ApJ, 818, 148, doi: 10.3847/0004-637X/818/2/148
- Liu et al. (2014b) Liu, Z., Xu, J., Gu, B.-Z., et al. 2014b, Research in Astronomy and Astrophysics, 14, 705, doi: 10.1088/1674-4527/14/6/009
- Luna & Karpen (2012) Luna, M., & Karpen, J. 2012, ApJ, 750, L1, doi: 10.1088/2041-8205/750/1/L1
- Luna et al. (2018) Luna, M., Karpen, J., Ballester, J. L., et al. 2018, ApJS, 236, 35, doi: 10.3847/1538-4365/aabde7
- Luna et al. (2014) Luna, M., Knizhnik, K., Muglach, K., et al. 2014, ApJ, 785, 79, doi: 10.1088/0004-637X/785/1/79
- Mackay et al. (2010) Mackay, D. H., Karpen, J. T., Ballester, J. L., Schmieder, B., & Aulanier, G. 2010, Space Sci. Rev., 151, 333, doi: 10.1007/s11214-010-9628-0
- Markwardt (2009) Markwardt, C. B. 2009, in Astronomical Society of the Pacific Conference Series, Vol. 411, Astronomical Data Analysis Software and Systems XVIII, ed. D. A. Bohlender, D. Durand, & P. Dowler, 251
- Martin (1998) Martin, S. F. 1998, Sol. Phys., 182, 107, doi: 10.1023/A:1005026814076
- Martin & Echols (1994) Martin, S. F., & Echols, C. R. 1994, An Observational and Conceptual Model of the Magnetic Field of a Filament, ed. R. J. Rutten & C. J. Schrijver (Dordrecht: Springer Netherlands), 339–346. https://doi.org/10.1007/978-94-011-1188-1_29
- Okamoto et al. (2016) Okamoto, T. J., Liu, W., & Tsuneta, S. 2016, ApJ, 831, 126, doi: 10.3847/0004-637X/831/2/126
- Ouyang et al. (2017) Ouyang, Y., Zhou, Y. H., Chen, P. F., & Fang, C. 2017, ApJ, 835, 94, doi: 10.3847/1538-4357/835/1/94
- Pesnell et al. (2012) Pesnell, W. D., Thompson, B. J., & Chamberlin, P. C. 2012, Sol. Phys., 275, 3, doi: 10.1007/s11207-011-9841-3
- Pevtsov et al. (2003) Pevtsov, A. A., Balasubramaniam, K. S., & Rogers, J. W. 2003, ApJ, 595, 500, doi: 10.1086/377339
- Pevtsov et al. (2001) Pevtsov, A. A., Canfield, R. C., & Latushko, S. M. 2001, ApJ, 549, L261, doi: 10.1086/319179
- Pevtsov et al. (1995) Pevtsov, A. A., Canfield, R. C., & Metcalf, T. R. 1995, ApJ, 440, L109, doi: 10.1086/187773
- Ramsey & Smith (1966) Ramsey, H. E., & Smith, S. F. 1966, AJ, 71, 197, doi: 10.1086/109903
- Romano et al. (2011) Romano, P., Pariat, E., Sicari, M., & Zuccarello, F. 2011, A&A, 525, A13, doi: 10.1051/0004-6361/201014437
- Sasso et al. (2014) Sasso, C., Lagg, A., & Solanki, S. K. 2014, A&A, 561, A98, doi: 10.1051/0004-6361/201322481
- Scherrer et al. (2012) Scherrer, P. H., Schou, J., Bush, R. I., et al. 2012, Sol. Phys., 275, 207, doi: 10.1007/s11207-011-9834-2
- Shen et al. (2014) Shen, Y., Liu, Y. D., Chen, P. F., & Ichimoto, K. 2014, ApJ, 795, 130, doi: 10.1088/0004-637X/795/2/130
- Titov et al. (1993) Titov, V. S., Priest, E. R., & Demoulin, P. 1993, A&A, 276, 564
- Uchida et al. (2001) Uchida, Y., Miyagoshi, T., Yabiku, T., Cable, S., & Hirose, S. 2001, PASJ, 53, 331, doi: 10.1093/pasj/53.2.331
- Vršnak et al. (2007) Vršnak, B., Veronig, A. M., Thalmann, J. K., & Žic, T. 2007, A&A, 471, 295, doi: 10.1051/0004-6361:20077668
- Wang et al. (2018) Wang, H., Liu, R., Li, Q., et al. 2018, ApJ, 852, L18, doi: 10.3847/2041-8213/aaa2f4
- Williams et al. (2009) Williams, D. R., Harra, L. K., Brooks, D. H., Imada, S., & Hansteen, V. H. 2009, PASJ, 61, 493, doi: 10.1093/pasj/61.3.493
- Yeates et al. (2007) Yeates, A. R., Mackay, D. H., & van Ballegooijen, A. A. 2007, Sol. Phys., 245, 87, doi: 10.1007/s11207-007-9013-7
- Zhang et al. (2012) Zhang, Q. M., Chen, P. F., Xia, C., & Keppens, R. 2012, A&A, 542, A52, doi: 10.1051/0004-6361/201218786
- Zhang et al. (2017) Zhang, Q. M., Li, D., & Ning, Z. J. 2017, ApJ, 851, 47, doi: 10.3847/1538-4357/aa9898
- Zhu et al. (2015) Zhu, C., Liu, R., Alexander, D., Sun, X., & McAteer, R. T. J. 2015, ApJ, 813, 60, doi: 10.1088/0004-637X/813/1/60
- Zirker et al. (1998) Zirker, J. B., Engvold, O., & Martin, S. F. 1998, Nature, 396, 440, doi: 10.1038/24798