Study of gravity waves distribution and propagation in the thermosphere of Mars based on MGS, ODY, MRO and MAVEN density measurements
Abstract
By measuring the regular oscillations of the density of CO2 in the upper atmosphere (between 120 and 190 km), the mass spectrometer MAVEN/NGIMS (Atmosphere and Volatile EvolutioN/Neutral Gas Ion Mass Spectrometer) reveals the local impact of gravity waves. This yields precious information on the activity of gravity waves and the atmospheric conditions in which they propagate and break. The intensity of gravity waves measured by MAVEN in the upper atmosphere has been shown to be dictated by saturation processes in isothermal conditions. As a result, gravity waves activity is correlated to the evolution of the inverse of the background temperature. Previous data gathered at lower altitudes (95 to 150 km) during aerobraking by the accelerometers on board MGS (Mars Global Surveyor), ODY (Mars Odyssey) and MRO (Mars Reconnaissance Orbiter) are analyzed in the light of those recent findings with MAVEN. The anti-correlation between GW-induced density perturbations and background temperature is plausibly found in the ODY data acquired in the polar regions, but not in the MGS and MRO data. MRO data in polar regions exhibit a correlation between the density perturbations and the Brunt-Väisälä frequency (or, equivalently, static stability), obtained from Global Climate Modeling compiled in the Mars Climate Database. At lower altitude levels (between 100 and 120 km), although wave saturation might still be dominant, isothermal conditions are no longer verified. In this case, theory predicts that the intensity of gravity waves is no more correlated to background temperature, but to static stability. At other latitudes in the three aerobraking datasets, the GW-induced relative density perturbations are correlated with neither inverse temperature nor static stability; in this particular case, this means that the observed activity of gravity waves is not only controlled by saturation, but also by the effects of gravity-wave sources and wind filtering through critical levels. This result highlights the exceptional nature of MAVEN/NGIMS observations which combine both isothermal and saturated conditions contrary to aerobraking measurements.
Planetary and Space Science
Laboratoire de Météorologie Dynamique (LMD/IPSL), Sorbonne Université, Centre National de la Recherche Scientifique, École Normale Supérieure, École Polytechnique, Paris, France Institut Universitaire de France, Paris, France Space Science Institute, Greenbelt, MD, USA
M. Valsmargaux.vals@lmd.jussieu.fr
Gravity wave activity causes density perturbations in the Martian thermosphere.
MAVEN found a correlation between gravity wave activity and inverse background temperature.
Lower-altitude aerobraking measurements do not show this correlation, except for Mars Odyssey.
Aerobraking data and climate models suggest instead wave activity correlated with static stability.
No such correlation in low latitudes points to a mix of saturation, critical levels and sources.
1 Introduction
Gravity waves propagate as perturbations of the stratified atmospheric fluid (Gossard and Hooke, 1975), with the buoyancy force being the restoring mechanism giving rise to the waves (cf Fritts and Alexander, 2003; Alexander et al., 2010, for a review). While being essentially regional-scale phenomena, gravity waves can be responsible for significant dynamical and thermal forcing of the global atmospheric state, as they transfer their momentum and energy upon their saturation and breaking in the upper atmosphere (Lindzen, 1981; Palmer et al., 1986; McFarlane, 1987).
Gravity waves are ubiquitous in the Martian atmosphere and were actually one of the first atmospheric phenomenon to be witnessed by orbiting spacecraft (Briggs and Leovy, 1974). As is the case on Earth (O’sullivan and Dunkerton, 1995; Vincent and Alexander, 2000; Plougonven et al., 2003; Spiga et al., 2008), those waves may be triggered in the Martian lower atmosphere by different sources: topography (Pickersgill and Hunt, 1979, 1981), convection (Spiga et al., 2013; Imamura et al., 2016), or jet-streams and fronts in ageostrophic evolution. Amongst all those sources, only the impact of the topographic source on the global circulation is accounted for in all Martian Global Climate Models (GCM, e.g. Barnes, 1990; Collins et al., 1997; Forget et al., 1999; Hartogh et al., 2005), although the exploration of the impact of an additional non-orographic source is a topic of current active research (Medvedev et al., 2015; Gilli et al., 2018).
The upward propagation of gravity waves from their tropospheric sources to the upper atmosphere leads to large departures of density, temperature and winds in the thermosphere, owing to the exponential increase of gravity wave amplitude with height (Fritts and Alexander, 2003; Parish et al., 2009). Measurements of CO2 density through accelerometers, gathered during the aerobraking of Mars Global Surveyor (MGS), Mars Odyssey (ODY) and Mars Reconnaissance Orbiter (MRO) observed the sustained gravity wave activity in the Martian thermosphere between 90 and 130 km (Fritts et al., 2006; Creasey et al., 2006; Tolson et al., 2007b). Those measurements also demonstrated the large variability of the gravity-wave amplitudes with season, local time, latitude and longitude.
The Mars Atmosphere and Volatile Evolution (MAVEN) mission to Mars (Jakosky et al., 2015), operating since 2014, is dedicated to studying the upper atmosphere of Mars and, as such, is a unique opportunity to broaden the knowledge of gravity wave activity on Mars. The mass spectrometer NGIMS (Neutral Gas Ion Mass Spectrometer) on board MAVEN (Mahaffy et al., 2015) recently delivered new and more accurate measurements of density fluctuations at upper altitudes between 120 and 300 km, identified as typical gravity-wave signatures (Yiğit et al., 2015; England et al., 2017).
Based on those MAVEN/NGIMS measurements, Terada et al. (2017) observed that gravity-wave amplitudes derived from Ar density with wavelengths between 100 and 500 km near the exobase in the Martian thermosphere are anti-correlated with the background temperature. The authors demonstrated this anti-correlation by considering gravity waves saturation caused by convective instability in the upper thermosphere. These observations were further discussed in a recent study focusing on Ar density between 120 and 200 km by Siddle et al. (2019), who observed that gravity waves amplitudes also increase with increasing solar zenith angle.
The goal of this paper is to build on those recent findings by MAVEN and to expand this analysis by comparing all available aerobraking data from other orbiting spacecraft. In particular, we explore the saturation conditions of gravity waves in a lower part of the thermosphere (between 90 and 130 km) than the one observed by MAVEN (between 120 and 300 km). Thus, we obtain a broader dataset of the variability of gravity wave activity with altitude, latitude and season. This allows us to compare the available measurements with diagnostics obtained by GCM through the Mars Climate Database (MCD Lewis et al., 1999; Forget et al., 1999; Millour et al., 2015)
2 Data and Method
2.1 Datasets used in this study
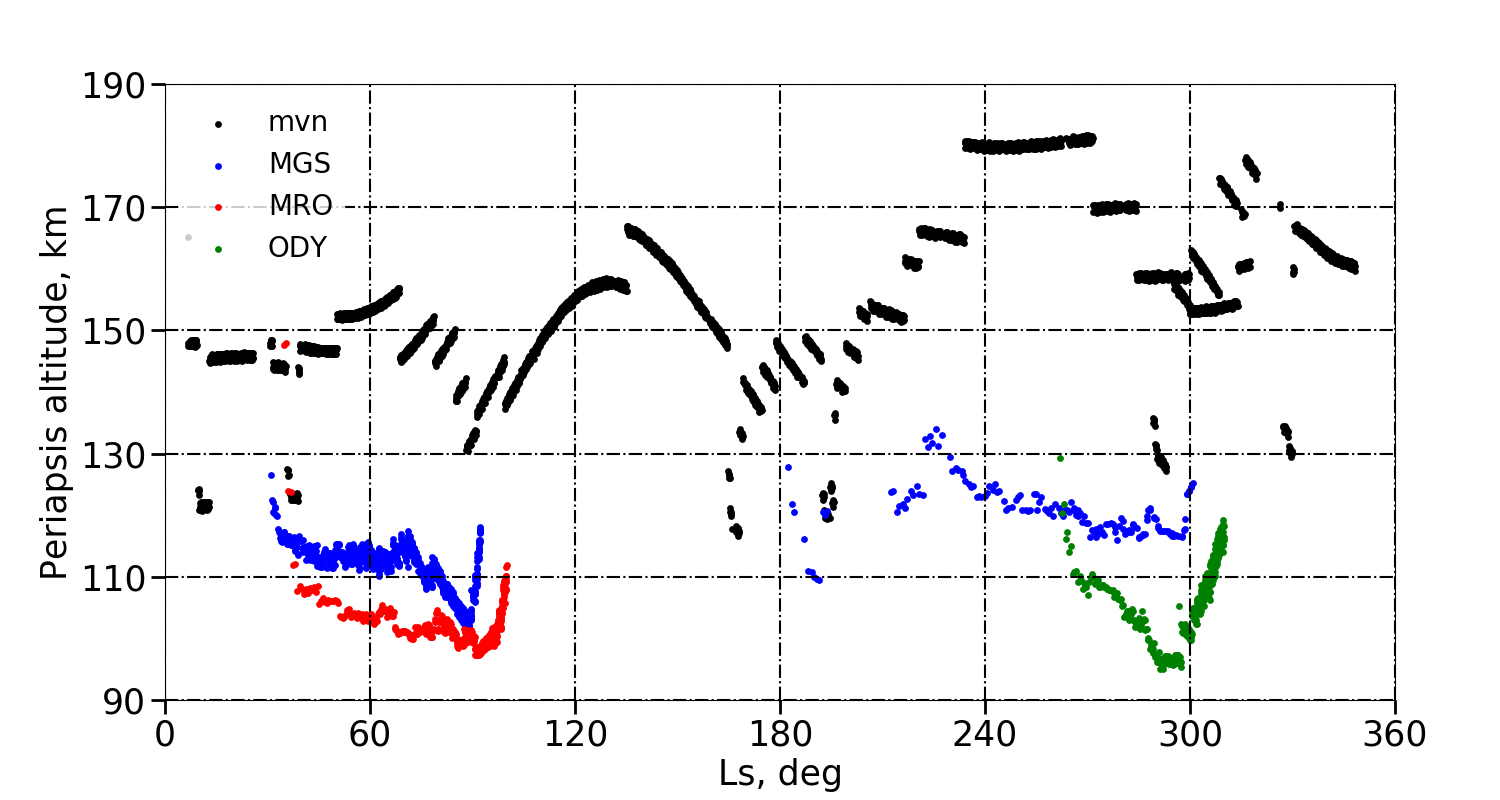
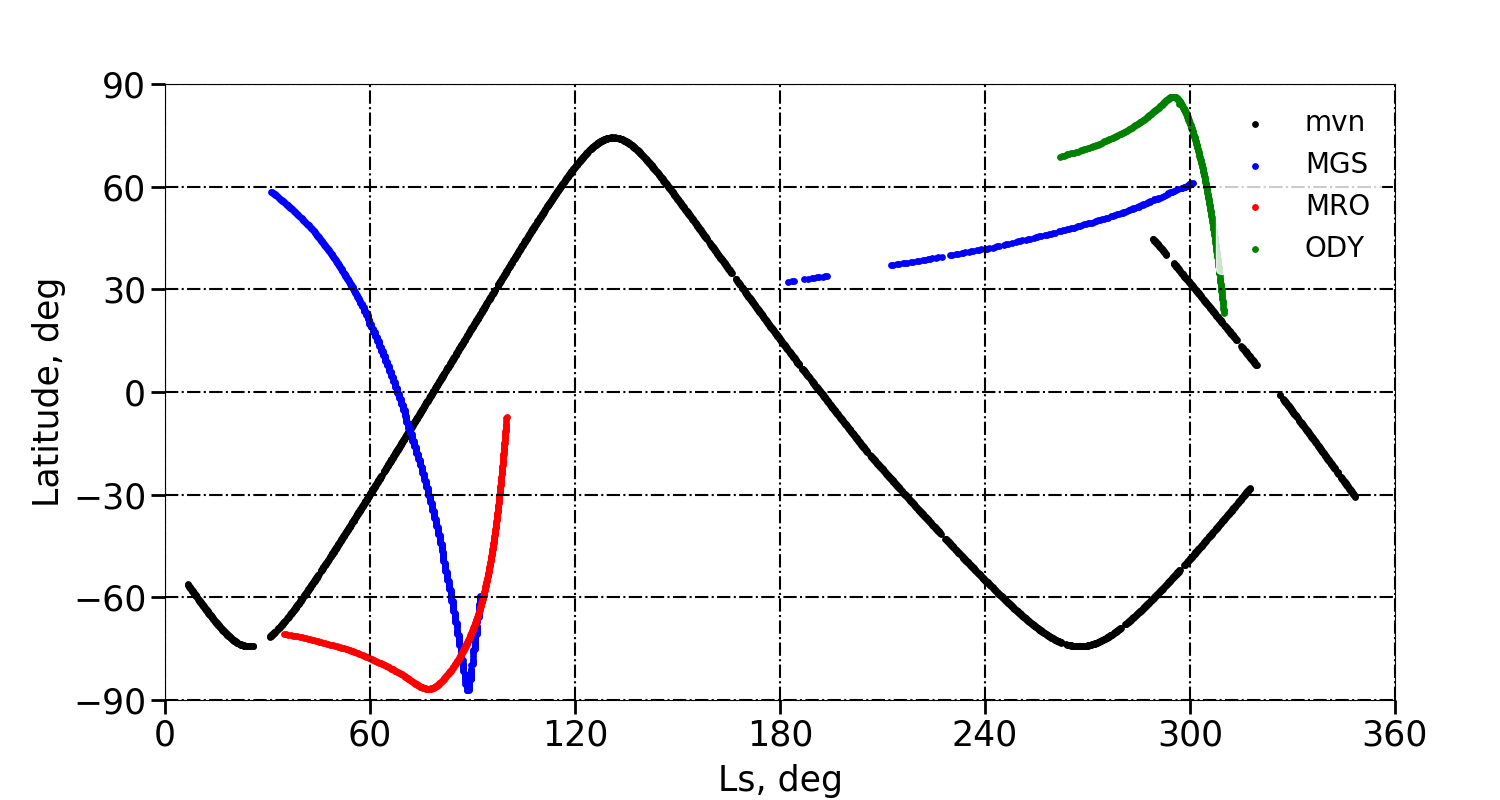
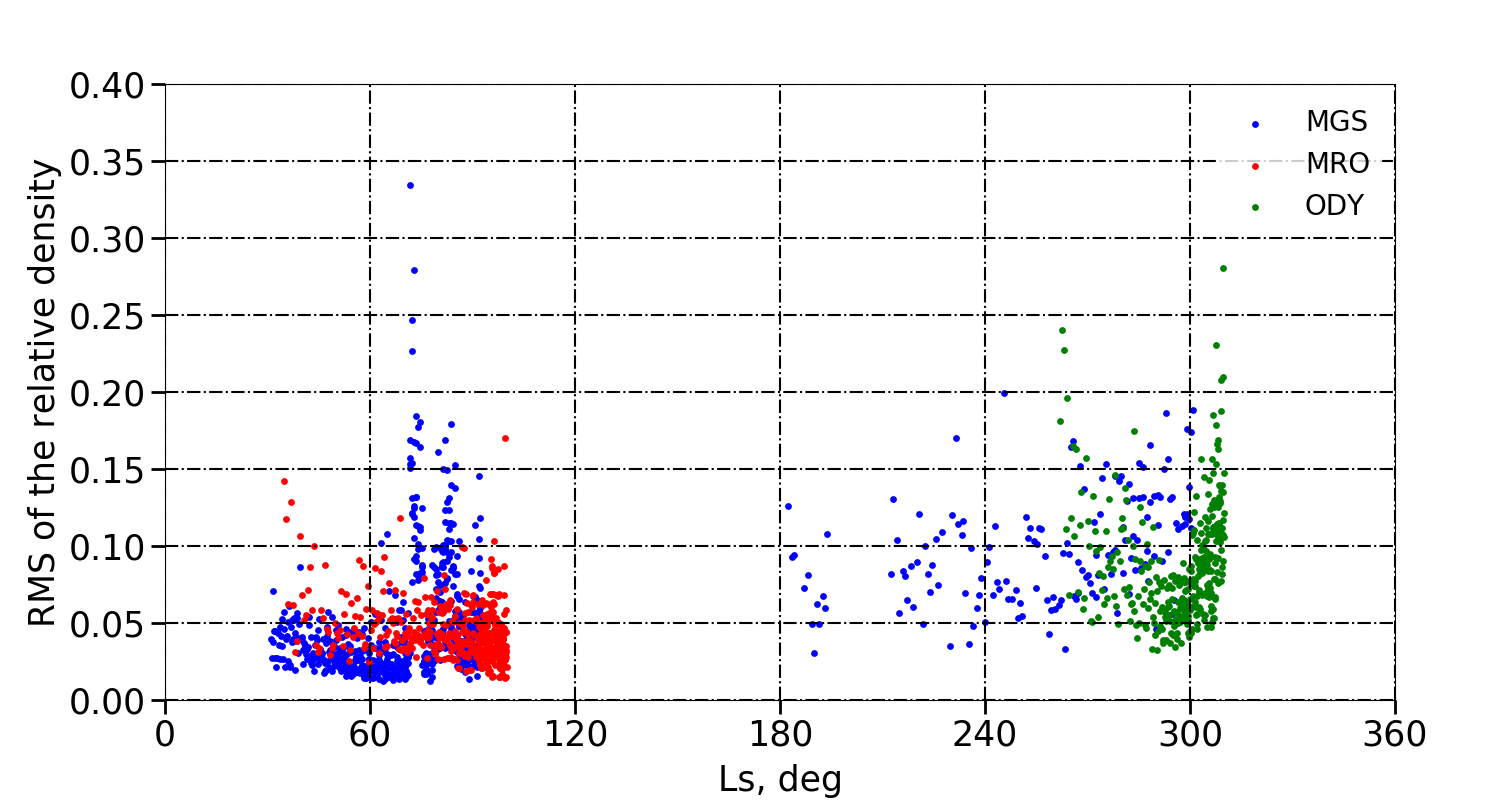
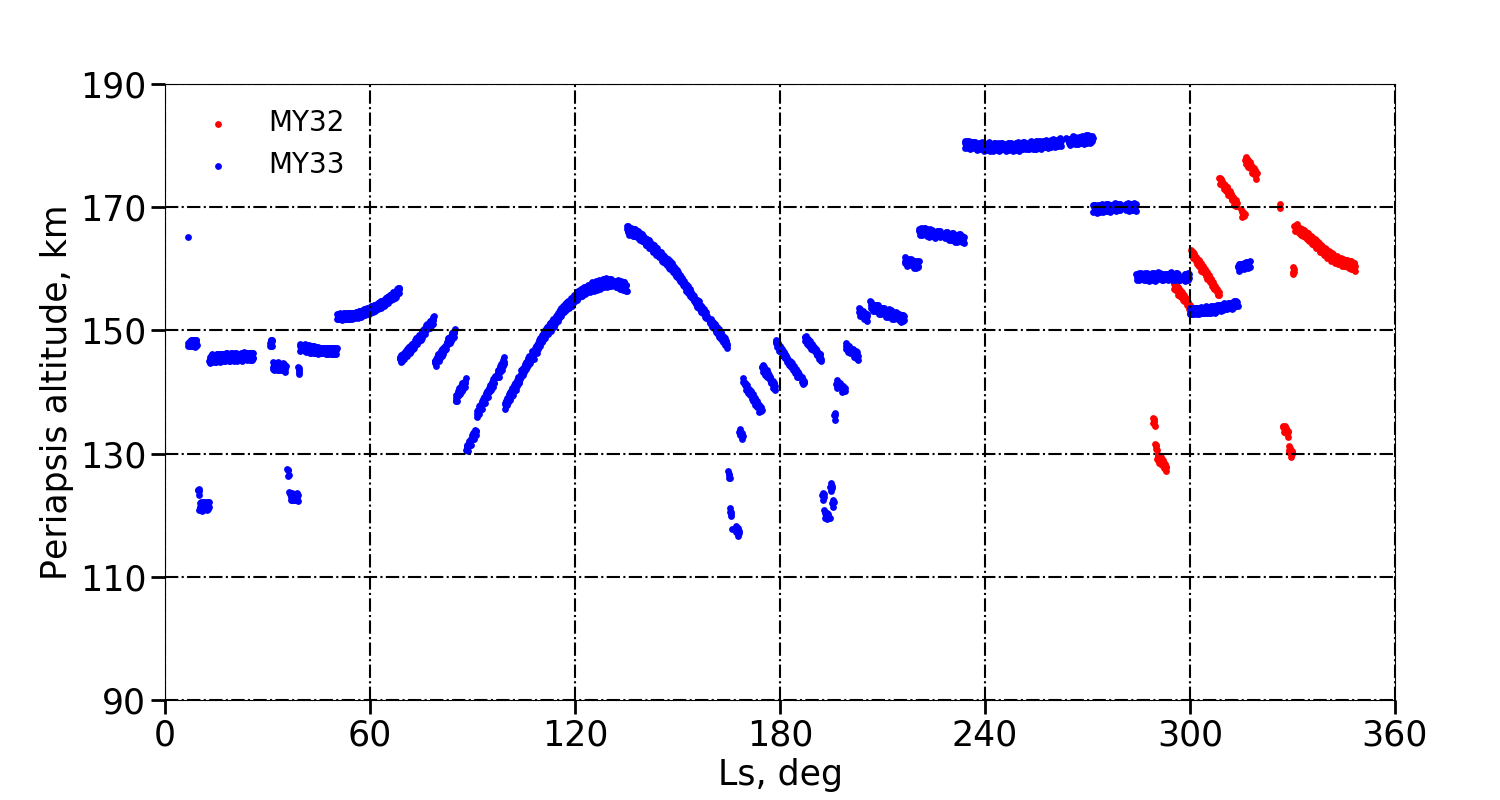
During aerobraking operations in the Martian thermosphere, the accelerometers of MGS, ODY and MRO (Lyons et al., 1999; Smith and Bell, 2005; Tolson et al., 2008) acquired data during 850 passes for MRO (since September 1997, Martian Year [MY] 23) (Keating et al., 2002), 320 passes for ODY (since October 2001, MY 25) (Tolson et al., 2007a), and 430 passes for MGS (from April to August 2006, MY 28) (Tolson, 2007), covering latitude ranges from 60∘N to 90∘S for MGS, 30∘N to 90∘N for ODY, and 0∘ to 90∘S for MRO. Periapsis altitudes varied from about 95 km to 150 km (see Figures 1 and 2).
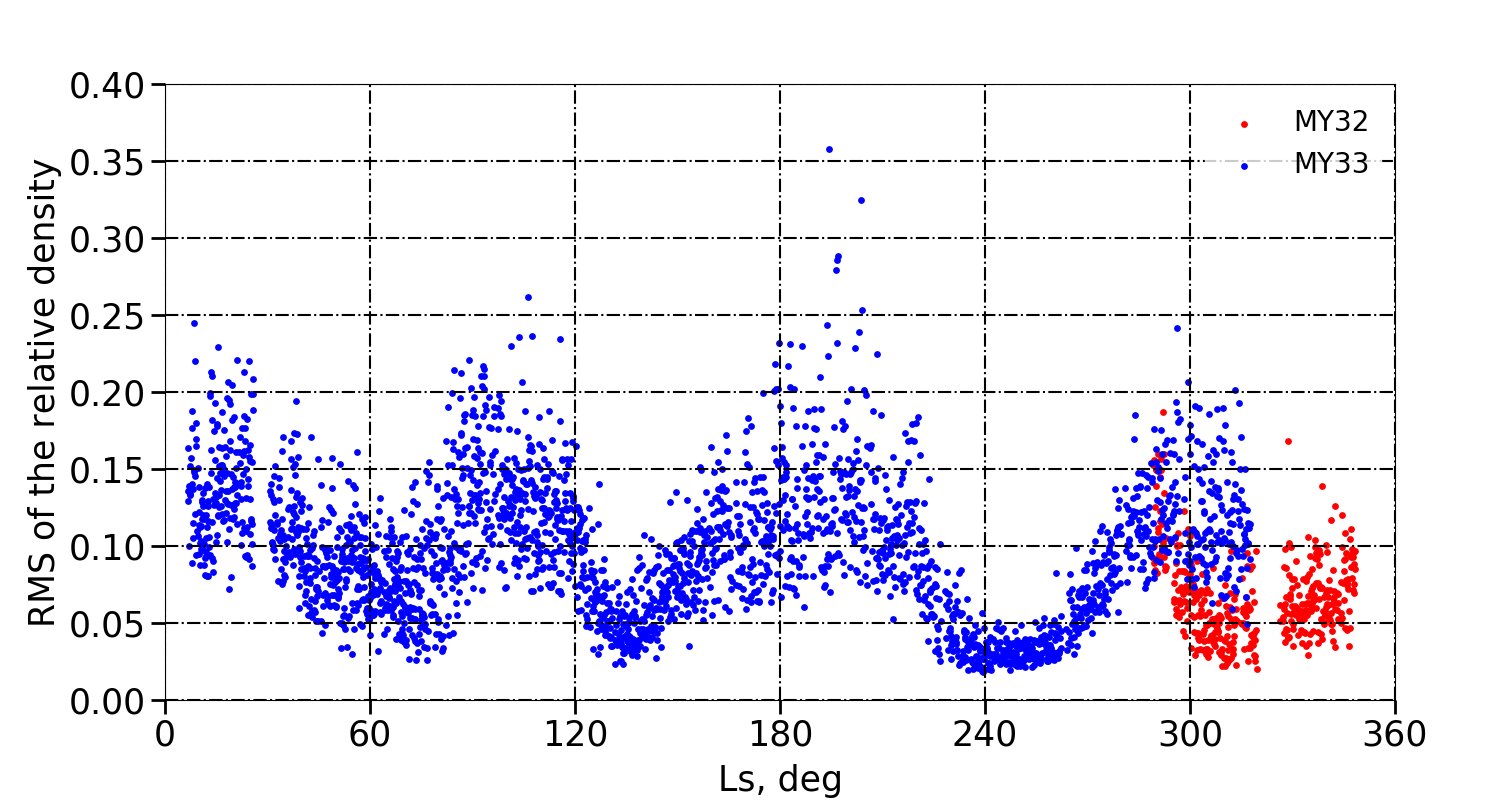
In addition to those aerobraking datasets, the CO2 density variations from 3124 orbits are available from MAVEN/NGIMS mass spectrometer data reported in the NASA Planetary Data System from October 2014 (MY32) to February 2017 (MY33) (Benna and Lyness, 2014). Considering the NGIMS settings were changed to a new operating mode starting from February 2015, as mentioned in England et al. (2017) and Terada et al. (2017), we chose to focus on datasets from February 2015 to February 2017. The instrument is still in operation at the time of writing and the present study can be complemented in the future by an analysis of the interannual variability. The MAVEN observations cover (high periapsis) altitude ranges between 120 km and 190 km, and have large latitudinal coverage, as shown in Figure 1 and Figure 2.
2.2 Computing the amplitude of gravity wave perturbations
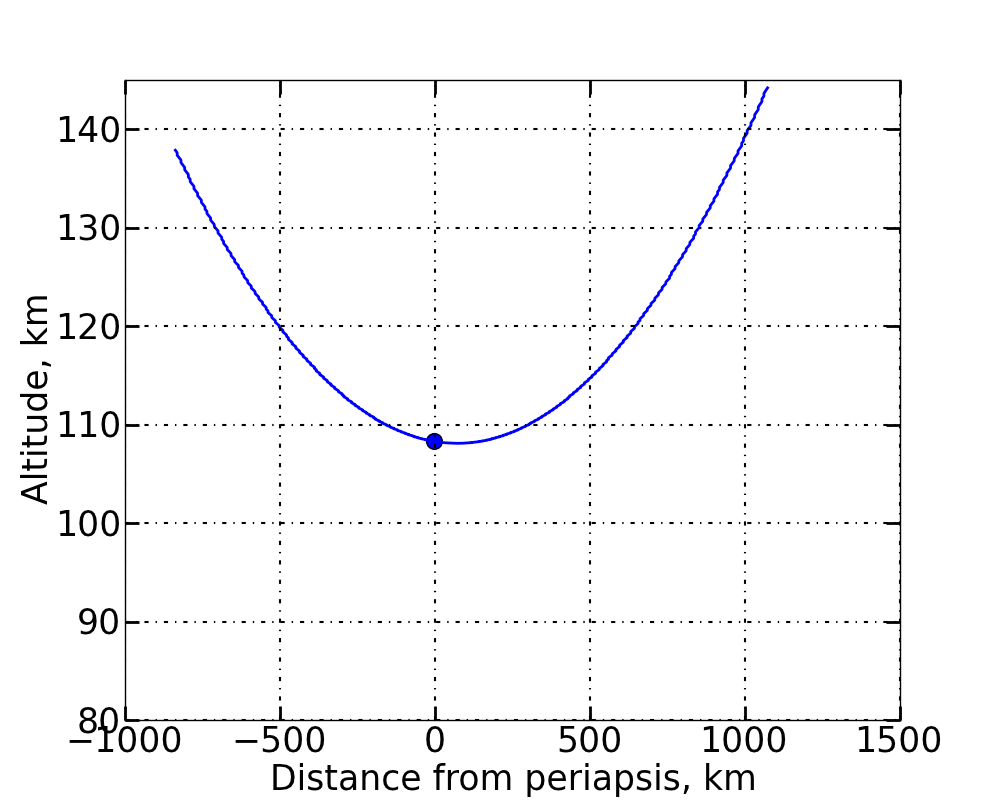
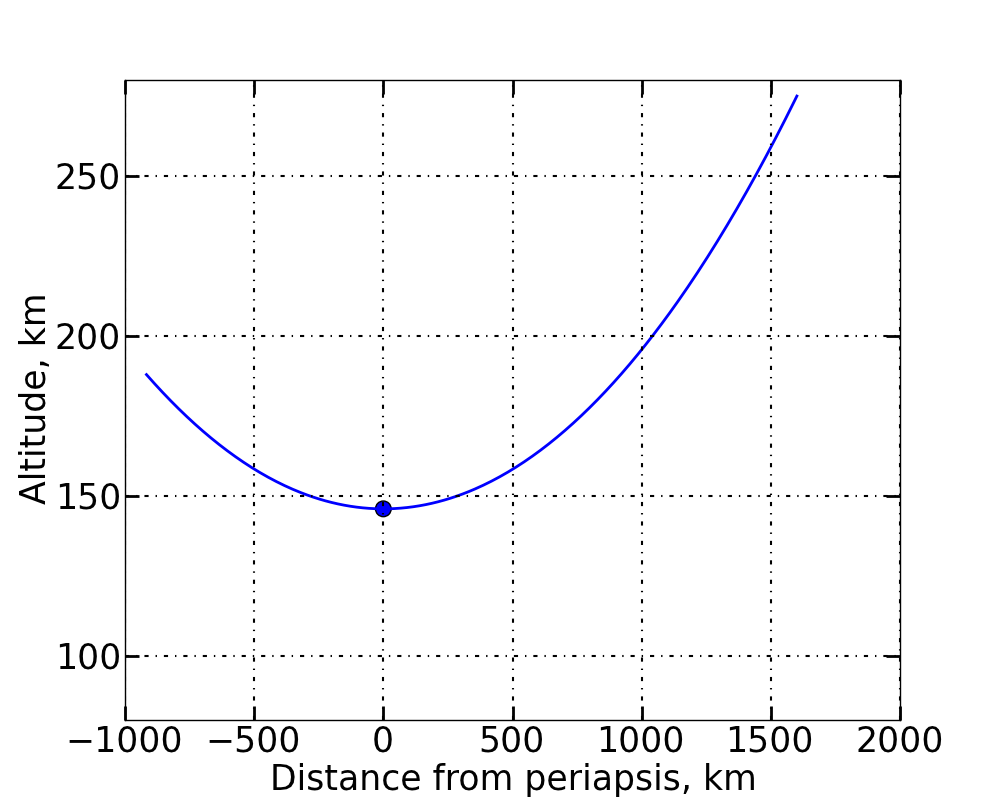
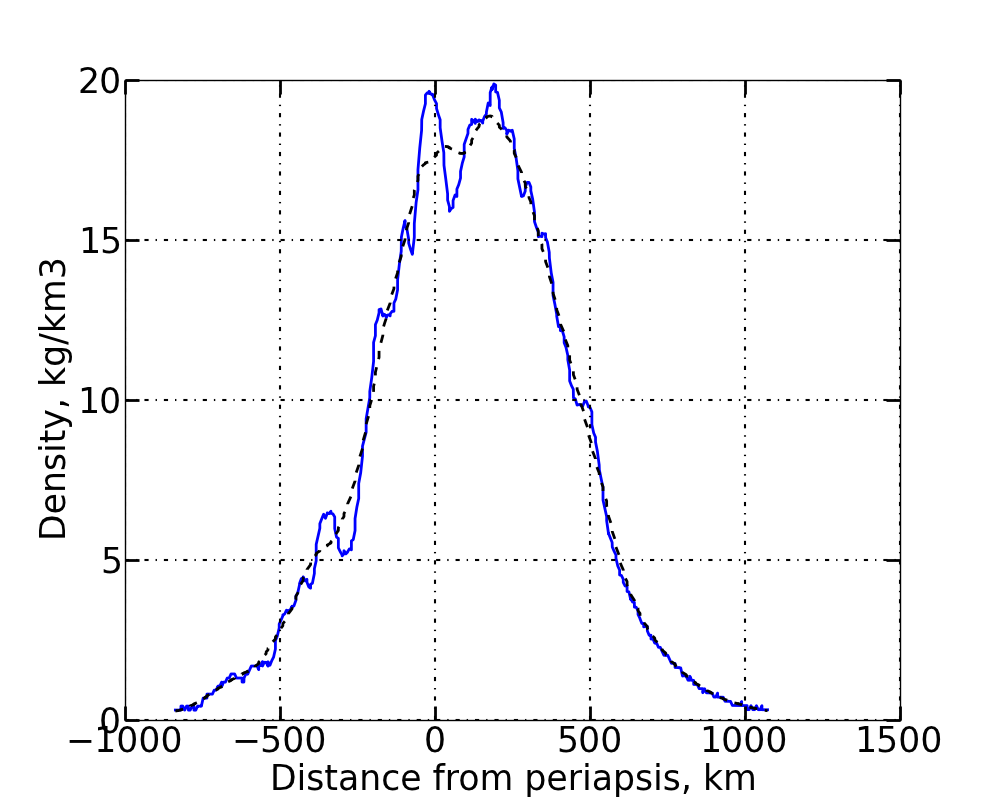
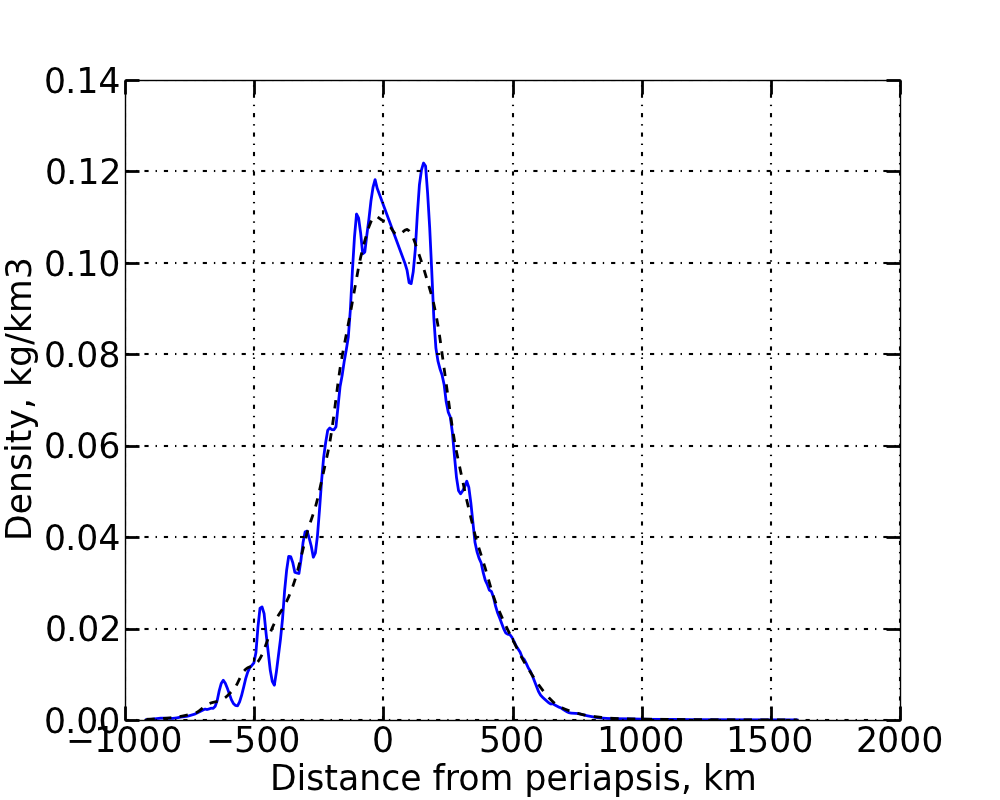
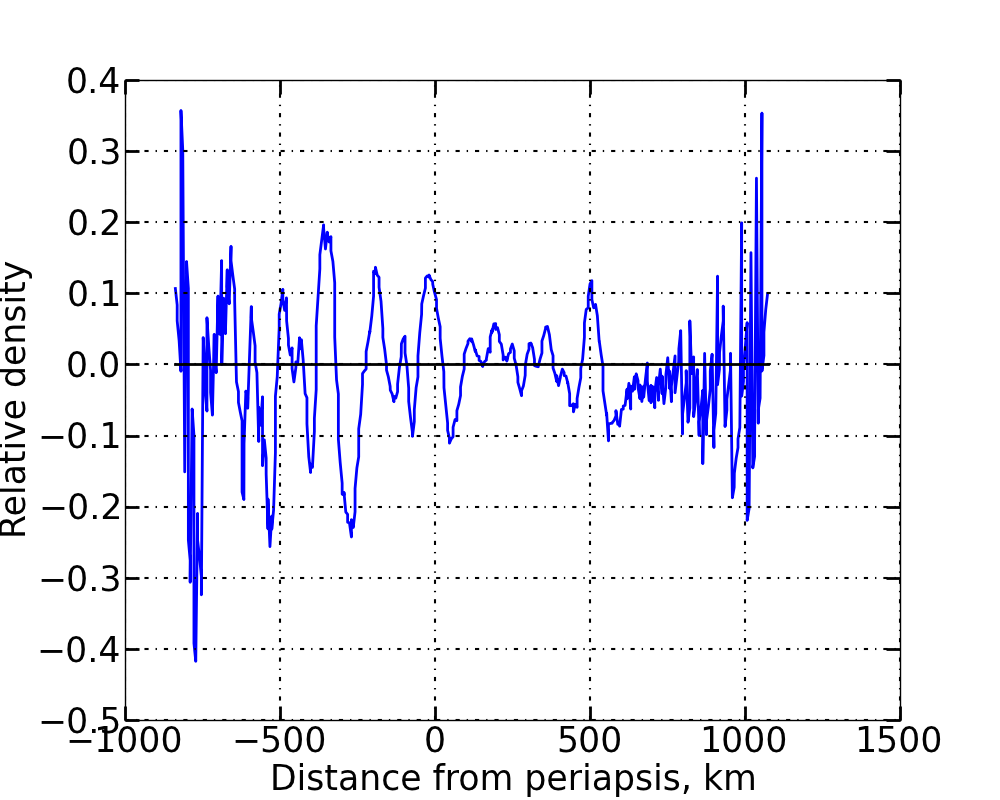
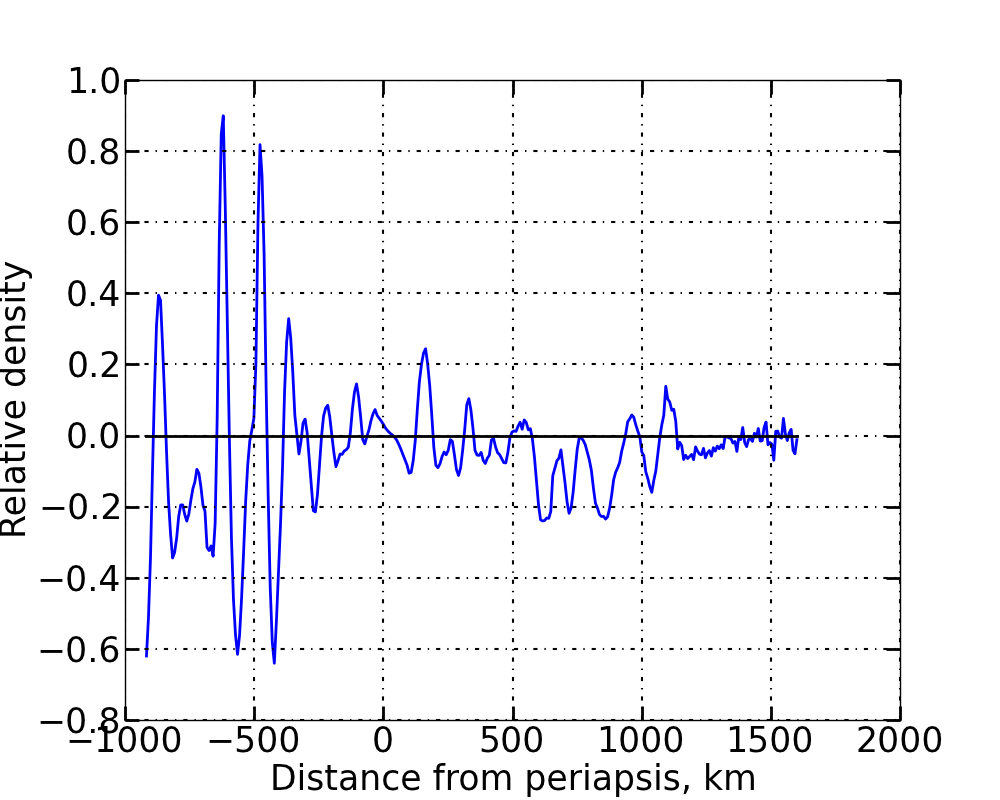
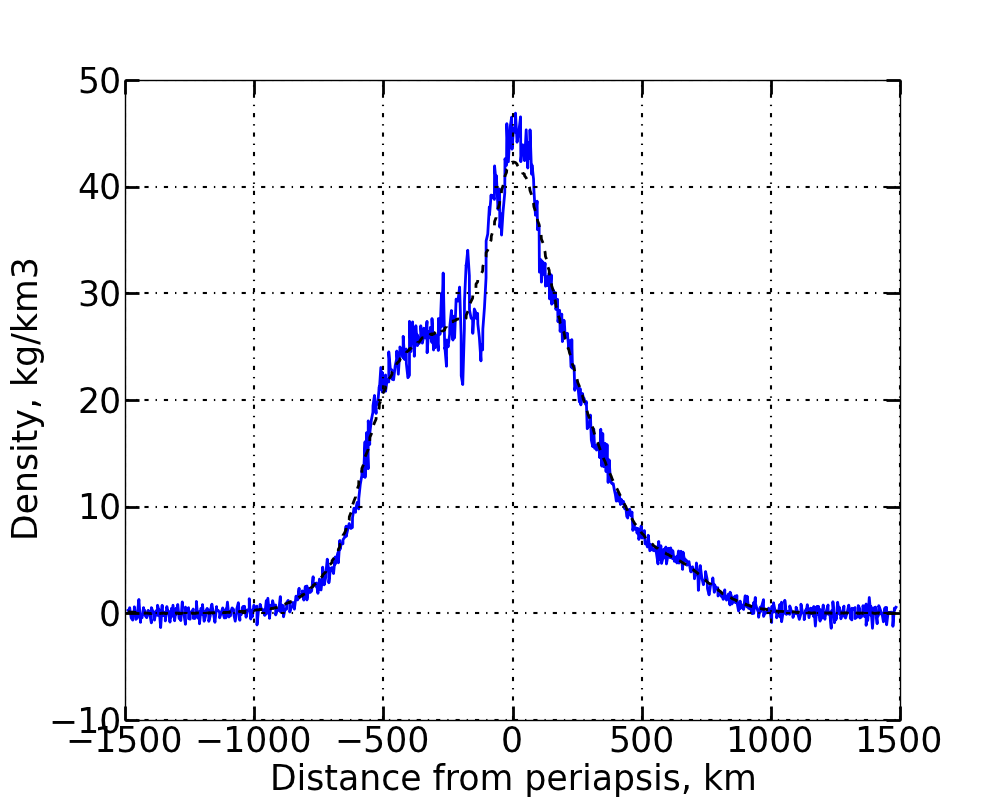
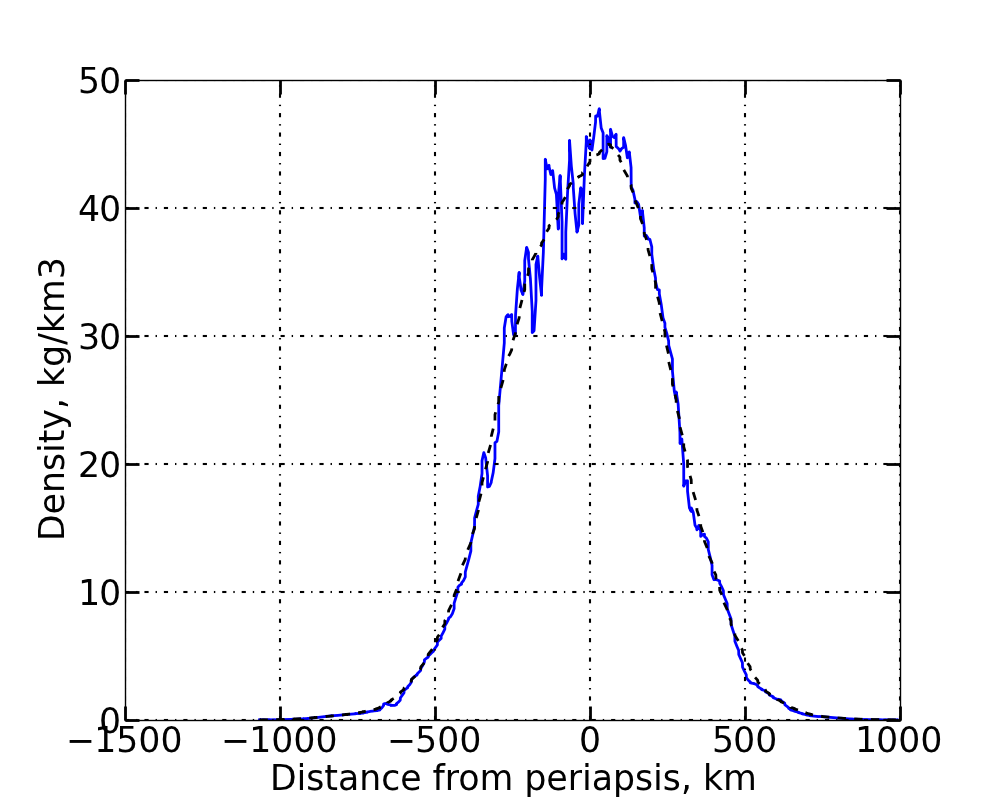
Along each orbit trajectory, we extract the longitudes, latitudes, solar longitudes (Ls, which is the position of the planet on its orbit, defined as an angle from a reference position, corresponding by convention to the northern spring equinox), local times, altitudes, CO2 density measurements, as well as the elapsed time from the periapsis. The geodesic distance from the periapsis is calculated from the latitude and longitude displacements. A relative density perturbation is obtained by subtracting the mean density (considered here to be a 40-second rolling averaged density, as in Tolson et al., 1999, 2005, 2007b, 2008; Creasey et al., 2006) from the instantaneous density , and by normalizing with the mean density
| (1) |
Typical examples of orbit trajectory, absolute and relative density variations, obtained for the MGS orbit 1046 and for the MAVEN orbit 3641 are shown in Figure 3. Considering the relative density perturbations, rather than the absolute value, enables a direct diagnostic of the effect of gravity waves, with the underlying assumption that the 40-second average provides an acceptable estimate of the “background” atmospheric state upon which the gravity waves propagate.
|
|
|
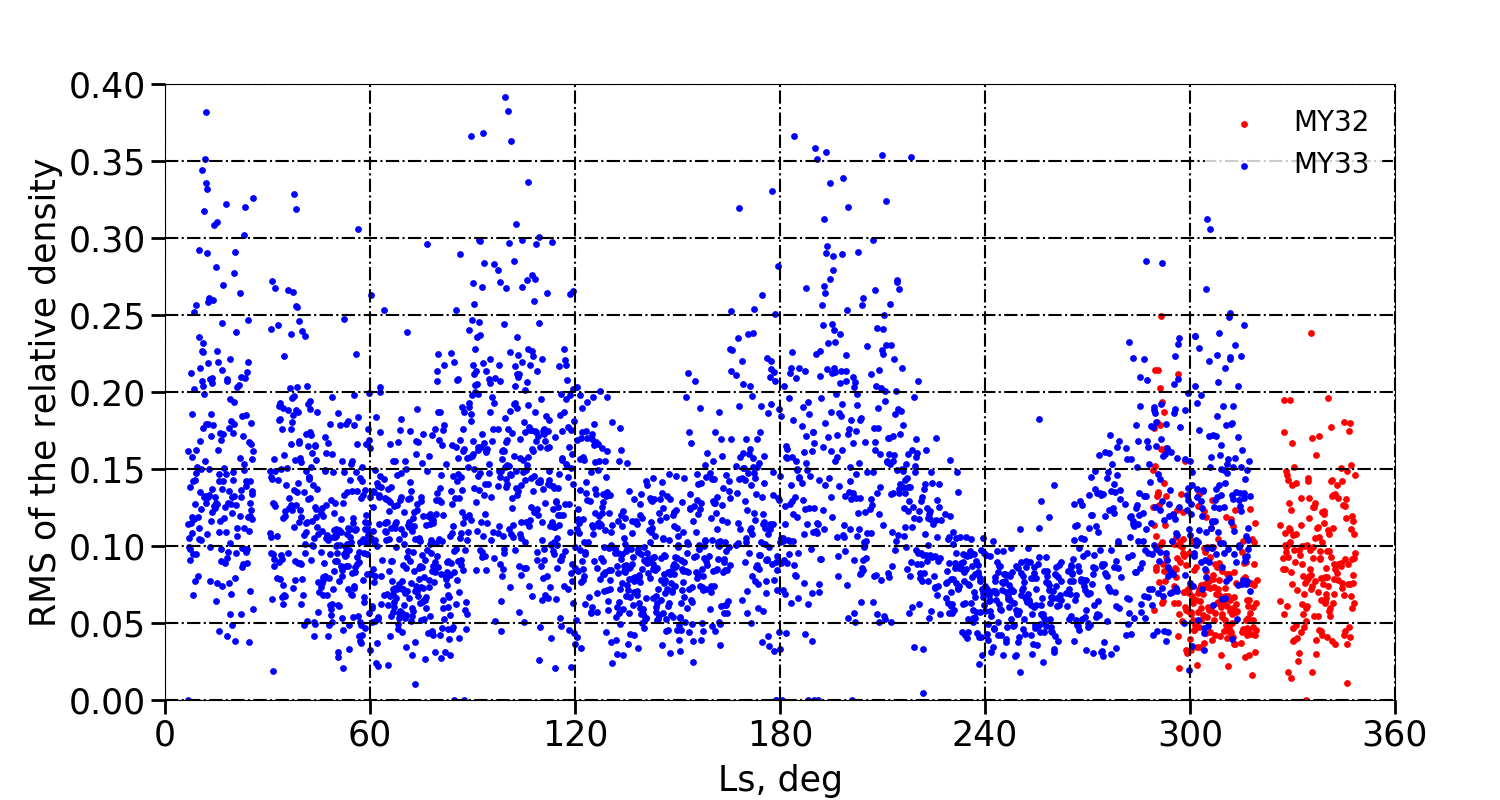
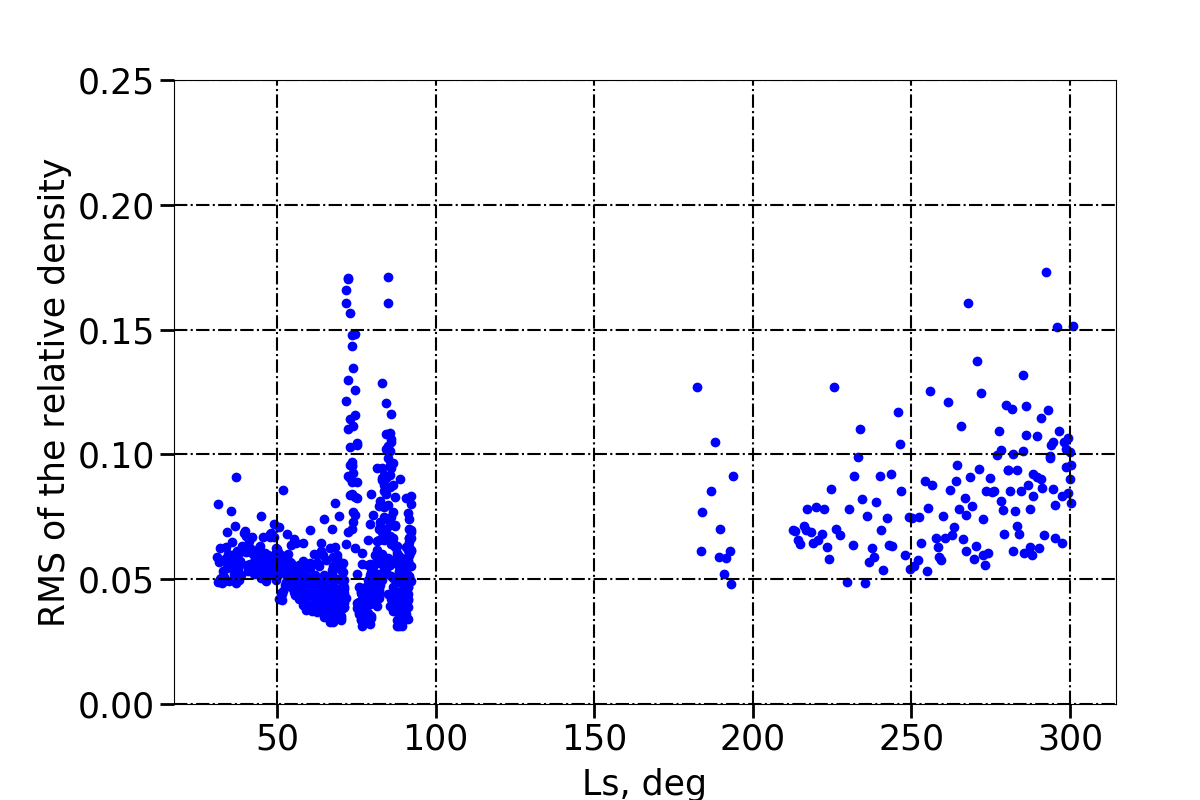
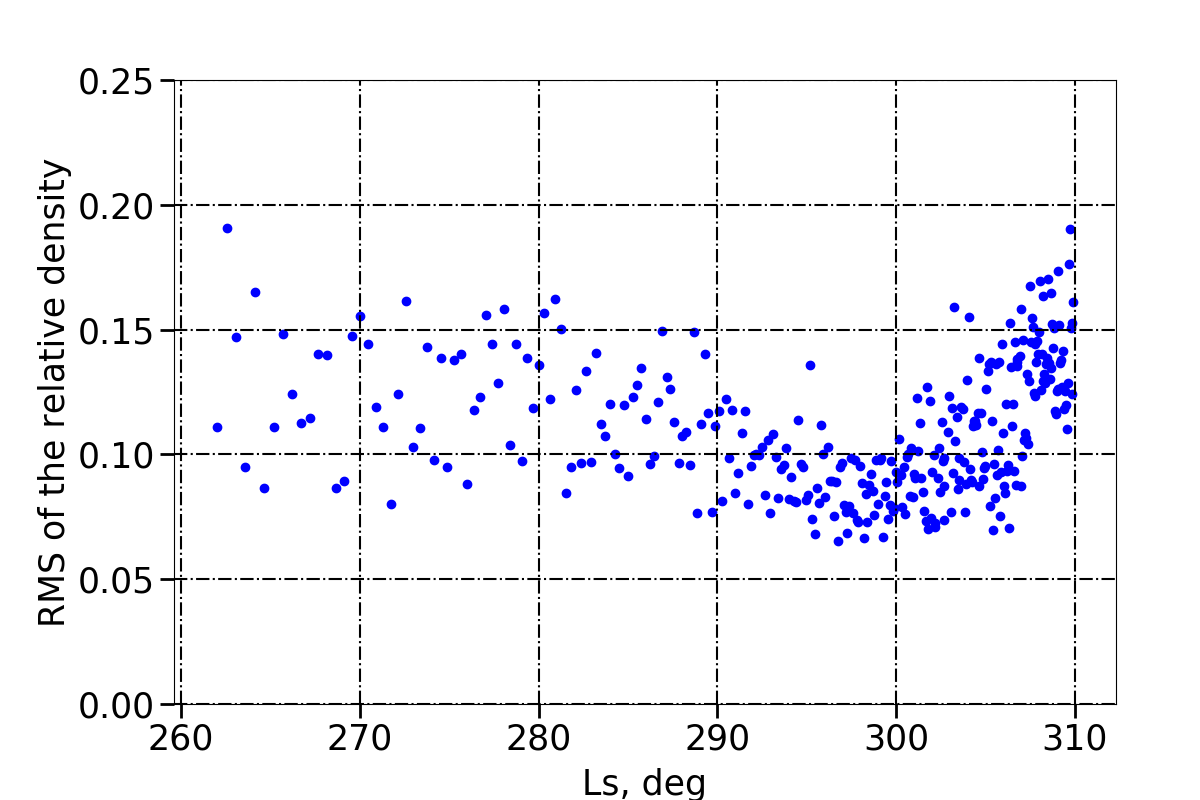
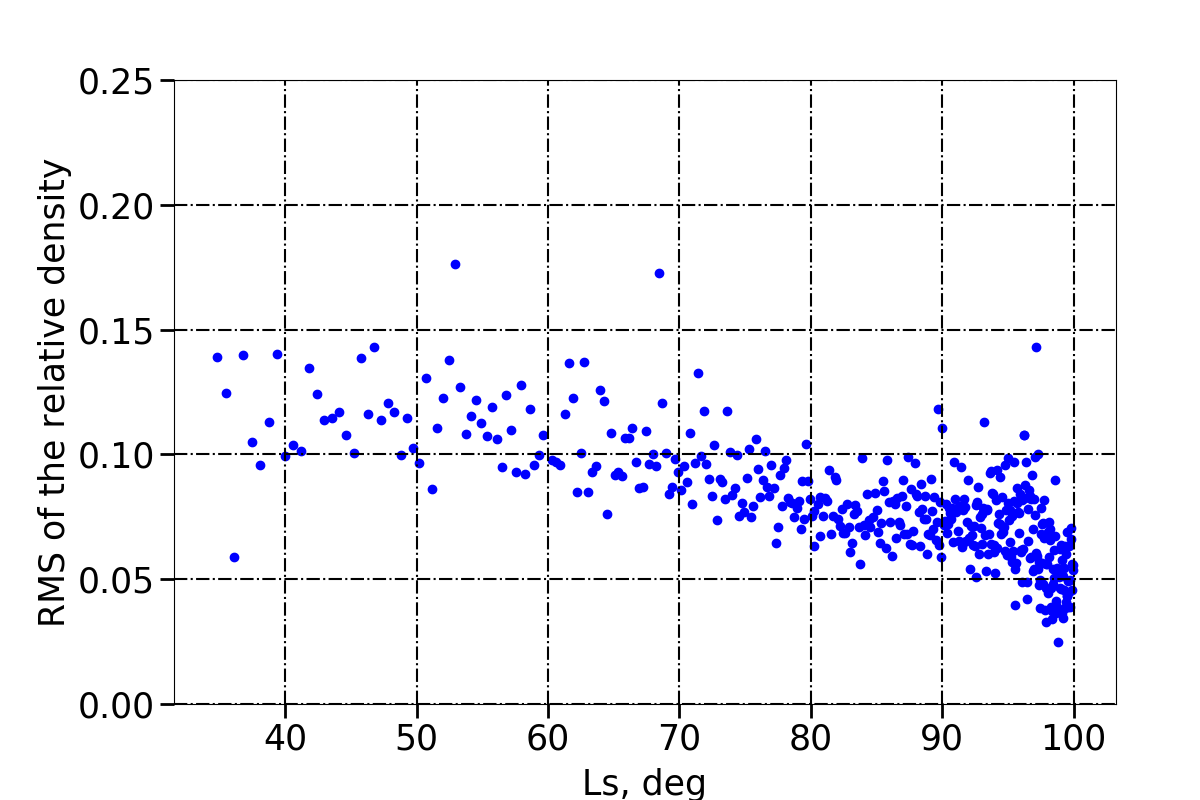
In order to quantify the amplitude (i.e. the intensity) of the observed gravity waves on a single orbit, and to assess the spatial and seasonal variability of the gravity wave activity, we calculate for each orbit the Root Mean Square (RMS) of the fluctuations of relative densities along the trajectory.
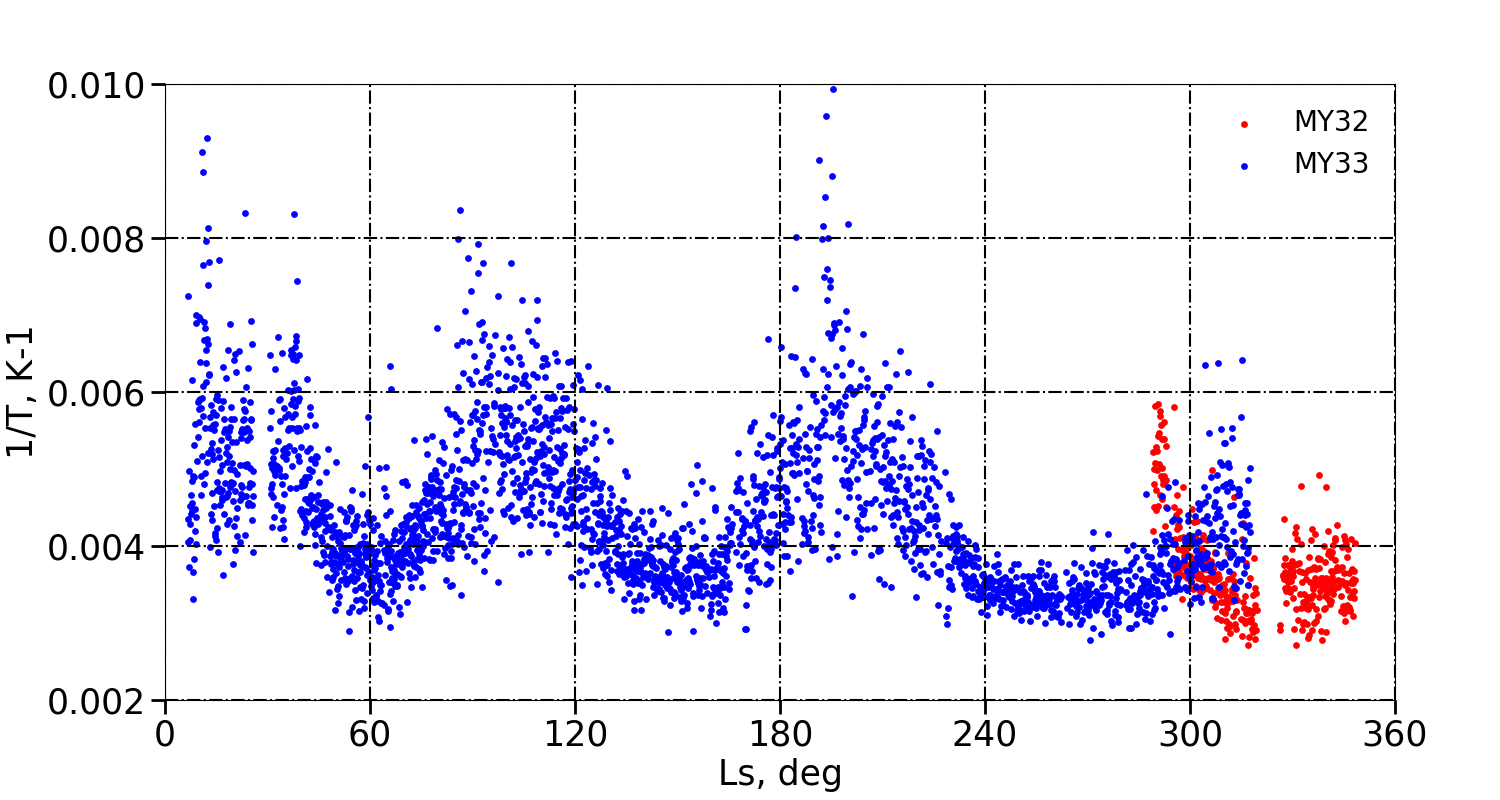
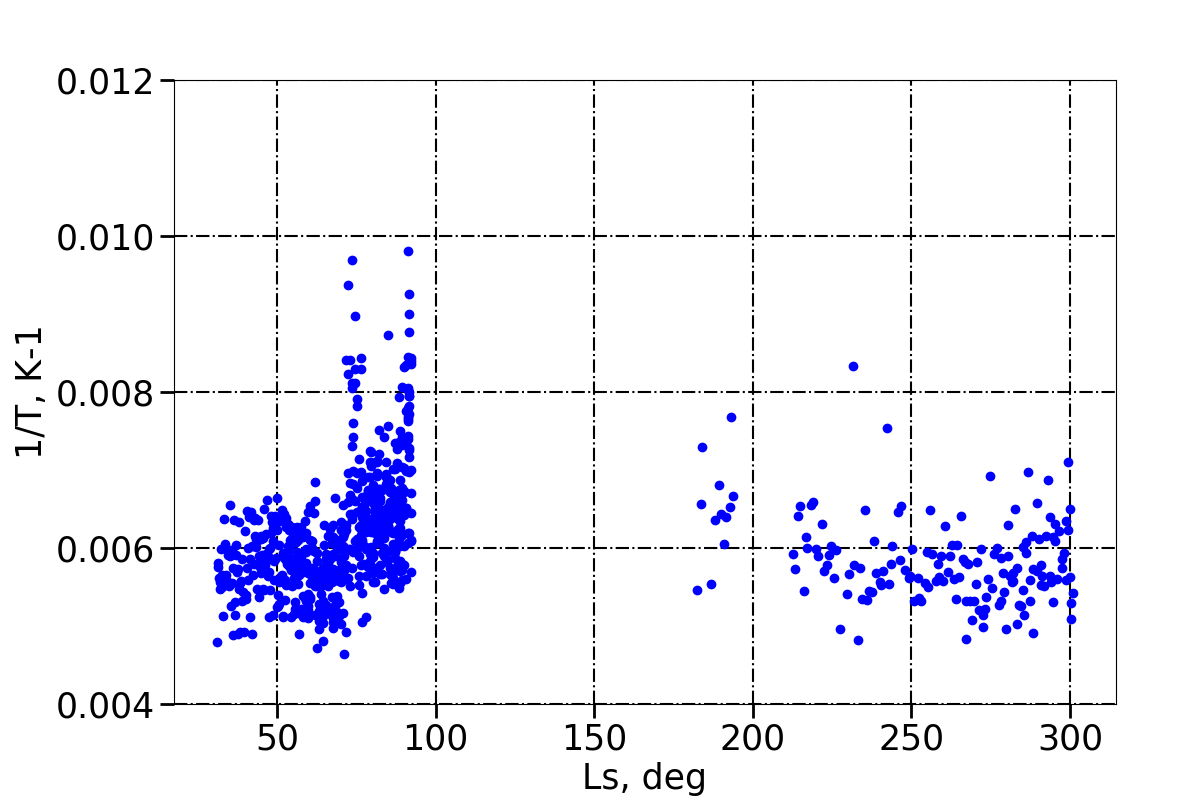
Figure 4 (MAVEN/NGIMS data) and Figure 5 (aerobraking data) show the seasonal variations of the GW activity as quantified by this RMS quantity, i.e. the RMS as a function of the Ls, all other parameters (longitudes, latitudes, local times, altitudes) confounded. A distinctive pattern of amplitude fluctuations with season is found in the MAVEN data in Figure 4, in agreement with the tendencies discussed in Terada et al. (2017).
2.3 Temperature estimates
The background temperature is estimated at each point of each orbit with the ideal gas law and the hydrostatic equilibrium, as a function of the mean density of CO2 and the altitude as follows:
| (2) |
with the gravitational acceleration and the ideal gas constant of CO2.
We split the orbit in three parts.
-
1.
The middle leg is the part of the orbit track close to the periapsis, where the displacement is almost horizontal, the density almost constant, and, consequently, where the temperature can no longer be deduced from equation 2. We arbitrarily define this middle leg as containing the points for which the ratio between the mean density and the maximal density is greater than 10%.
-
2.
The inbound leg corresponds to the points located ”before” the perapsis not included in the middle leg.
-
3.
The outbound leg refers to the points located ”after” the periapsis not included in the middle leg.
Thus the middle leg of the measurements is excluded from the comparative analysis, and we only keep the inbound and outbound profiles for all aerobrakings and MAVEN/NGIMS measurements.
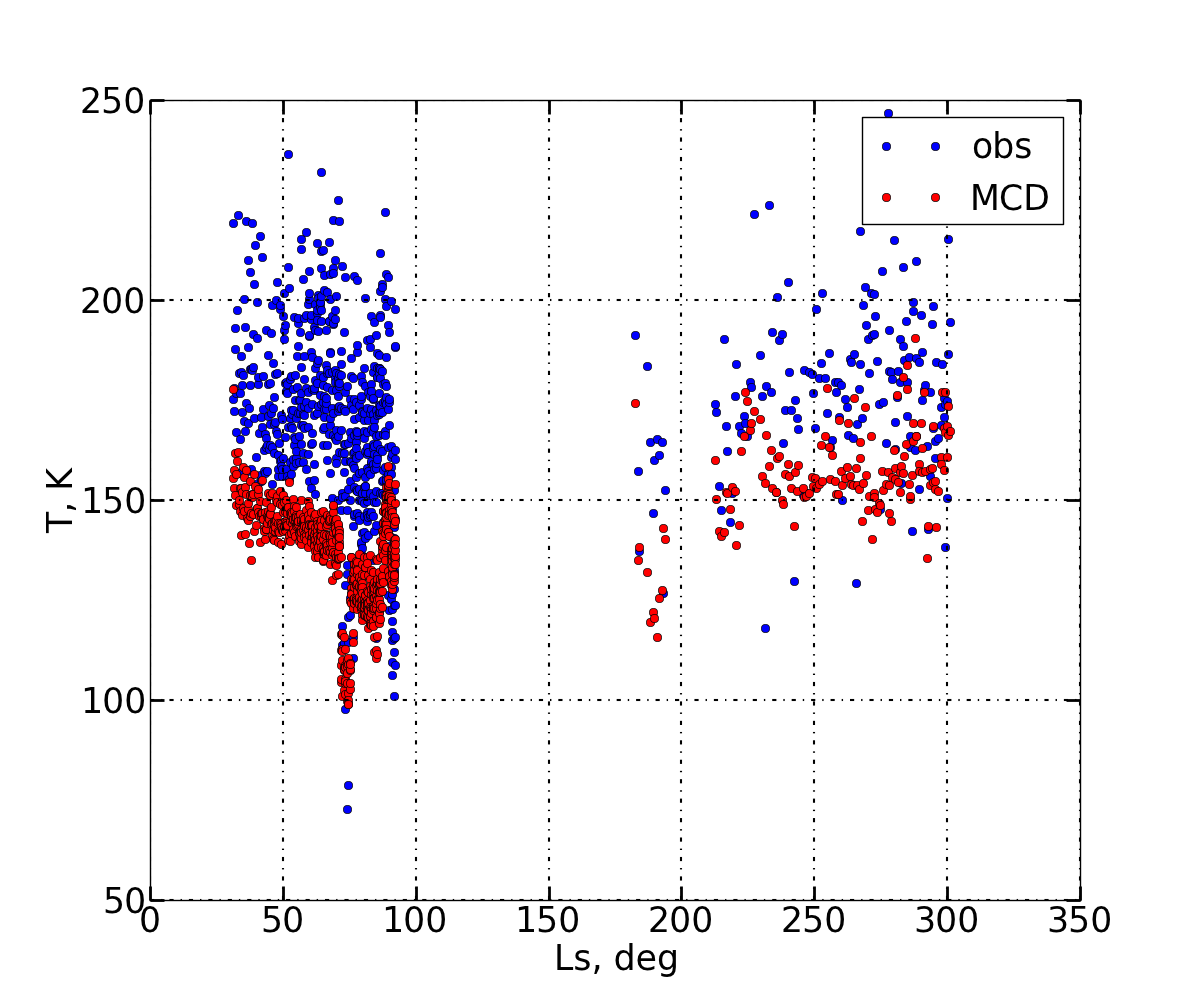
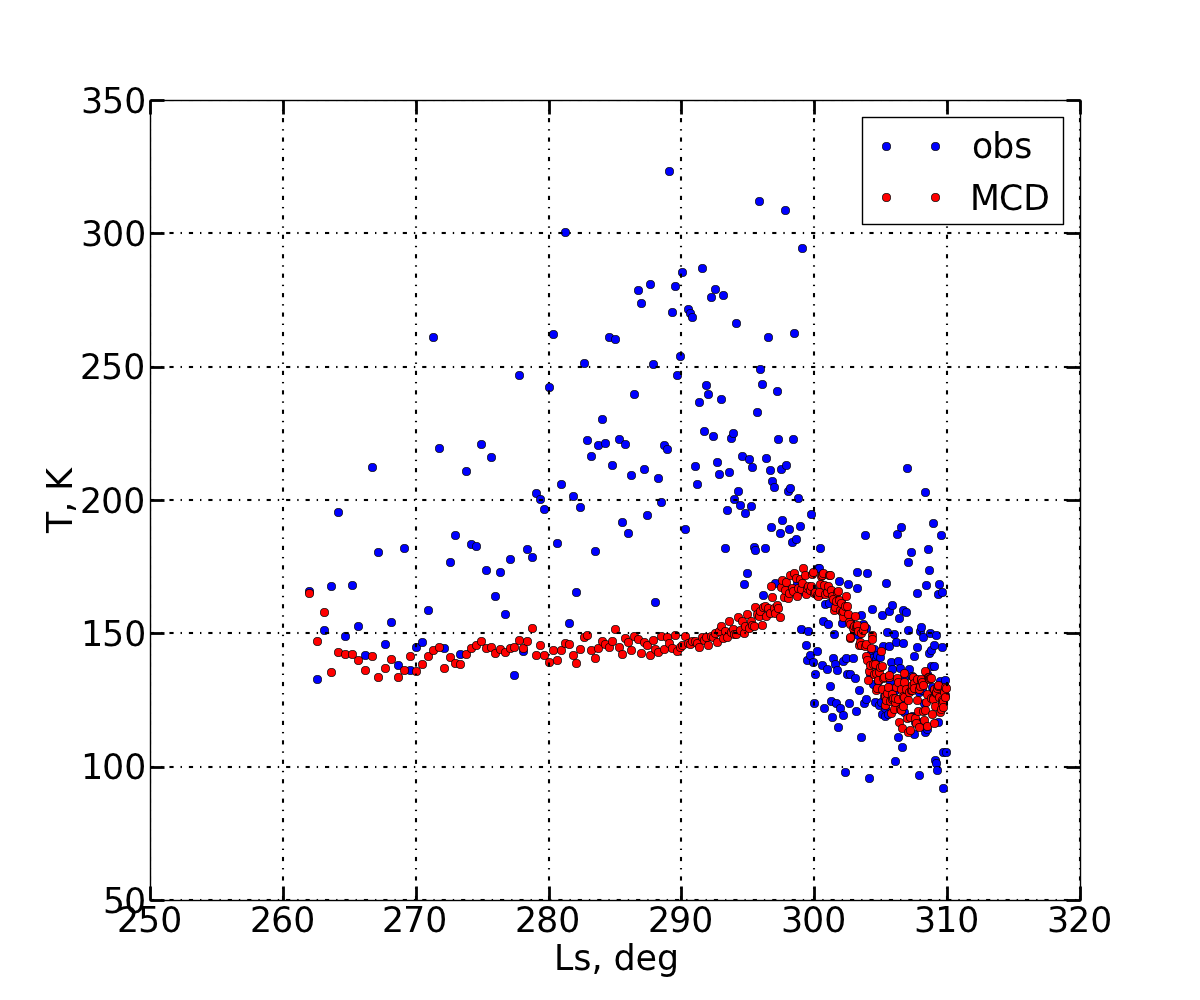
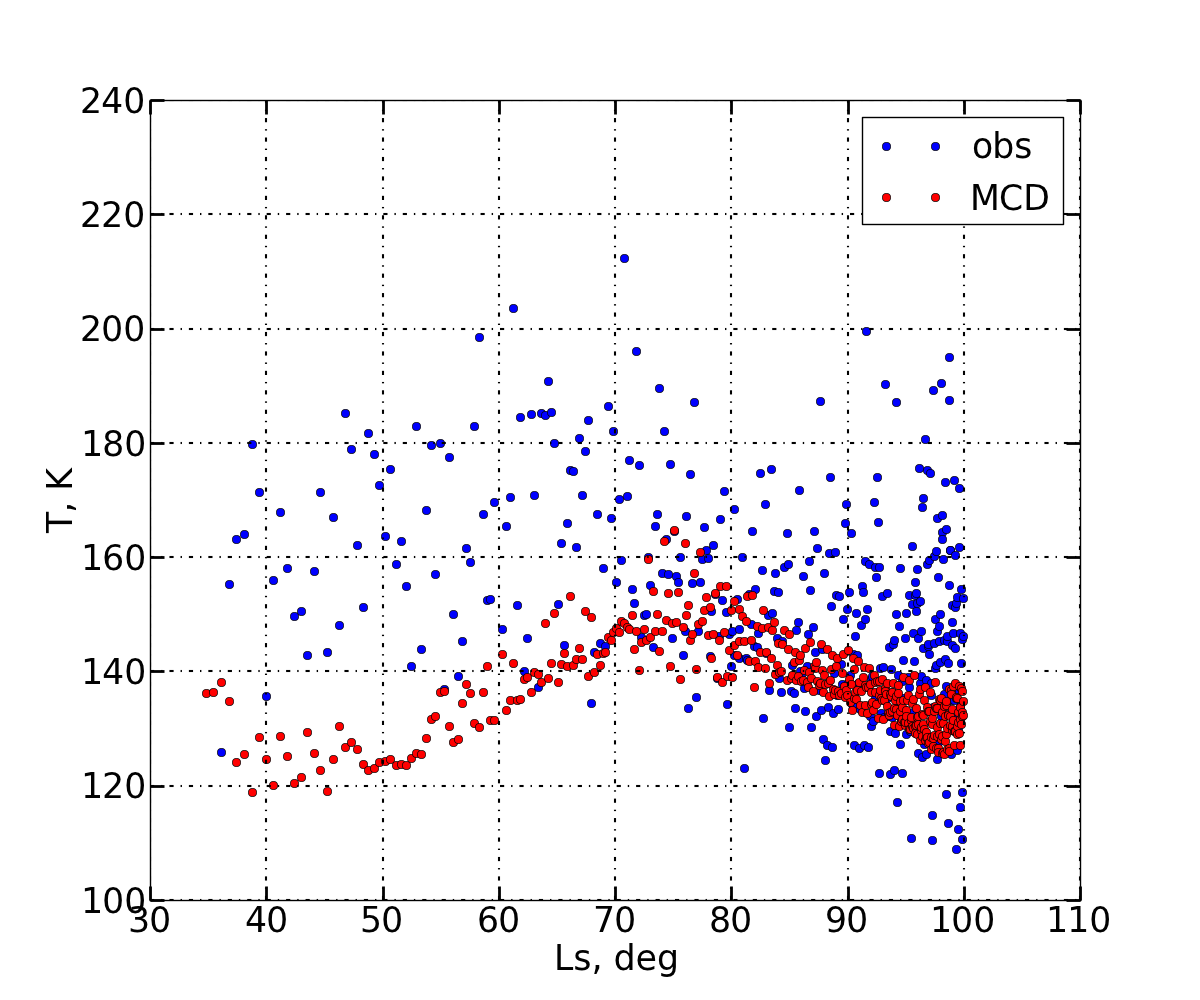
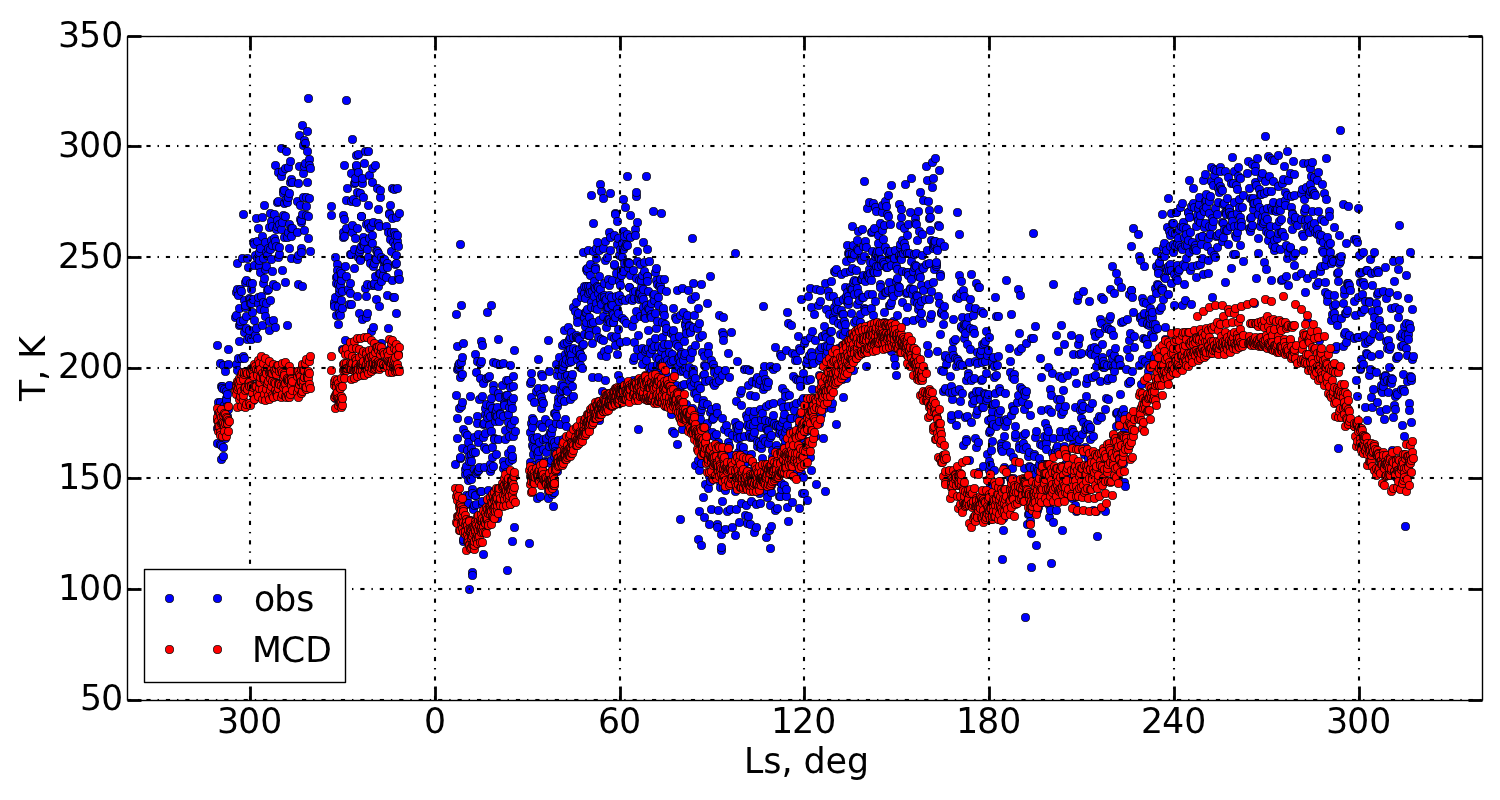
We found that in the inbound and outbound legs, the temperature profiles follow a similar vertical gradient. We thus study the variability of temperature from one orbit to another with a single representative value for both the inbound and outbound legs, chosen as the average value on each leg. Those temperatures estimated from aerobraking and MAVEN/NGIMS measurements are compared in Figure 6 and Figure 7 with the temperature in the Mars Climate Database (built from Global Climate Model (GCM) simulations Millour et al., 2015) for the same spatio-temporal coordinates (Ls, longitude, latitude, altitude, local time). Only the comparisons of temperatures measured on outbound legs versus temperature modeled in the MCD are displayed for the sake of brevity; the analysis for inbound legs is similar. The MCD temperatures are systematically lower than those observed by MAVEN and aerobraking, and there is also much more variability in the observation data points; however, the overall seasonal variability is well reproduced, except the maximum observed by ODY. This gives us confidence that using a value of background temperature averaged over the inbound and outbound legs is suitable to carry out an analysis of the seasonal (climatological) trends.
|
 |
3 Vertical Propagation of Gravity Waves: analysis of the MAVEN observations in the thermosphere
In the absence of additional wave sources and dissipation processes (e.g., radiative damping Eckermann et al., 2011), the amplitude of gravity waves is expected to grow exponentially with altitude as the atmospheric density decreases. Conversely, the amplitudes of gravity waves appear to anti-correlate with altitude, according to the altitudes of the MAVEN measurements shown in Figure 1 and the amplitudes of the perturbations shown in Figure 4. In other words, in the MAVEN observations, gravity-wave amplitude seems to correlate with density, as opposed to an anti-correlation expected if the amplification of gravity-wave amplitude with altitude (and reduced density) was the only controlling factor. This is confirmed by considering the seasonal variations of density perturbations at a constant pressure level, e.g. at pressures Pa (corresponding to altitudes between 160 and 240 km) in Figure 8. The observed variability in gravity-wave amplitude must be controlled by either the sources of those waves and/or the impact of saturation and critical levels.
In the MAVEN measurements, gravity wave activity in the thermosphere is randomly distributed with longitude and latitude (figures not shown). No correlation appears to exist between this gravity wave activity and either the position of topographical highs and lows (mountains and craters), or the position of mesospheric jet-streams. This suggests that the regional distribution of the intensity of gravity waves is more controlled by propagation effects (e.g., filtering by saturation or critical levels, Fritts and Alexander, 2003) than by the distribution of the sources triggering those waves.
The background horizontal wind plays a particularly crucial role in impacting the conditions for the upward propagation of gravity waves emitted in the troposphere. A critical level occurs when and where the background horizontal wind velocity almost equals the gravity wave phase speed (first Eliassen-Palm theorem, Lindzen, 1981). A gravity wave that reaches a critical level can no longer propagate towards the thermosphere: hence horizontal circulations may filter out gravity waves emitted in the troposphere from the mesosphere and the thermosphere.
Considering, for the sake of simplicity, a gravity-wave phase speed (typical of orographic gravity waves), we explored the regional and seasonal variability of background horizontal winds simulated in the MCD from the troposphere to the lower mesosphere (since no measurements of such winds are available). We found no correlation between this variability, and the regional and seasonal variability of the gravity wave amplitudes observed by MAVEN (not shown). While the modeled winds have not been validated and may differ from reality, there is no reason to explain the variability of the observed gravity wave amplitudes solely with the occurrence of critical levels.
It follows from the above discussions that the most likely possibility to explain the observed variability of gravity wave amplitude in the MAVEN observations is the breaking/saturation due to convective instability. This shall lead to, according to Terada et al. (2017), the gravity wave amplitudes to be inversely proportional to the background temperature. Let us propose an alternate, yet equivalent, derivation of the theoretical arguments in Terada et al. (2017) that we will use in section 4.
The saturation of a gravity wave occurs as soon as it encounters convective instability (Lindzen, 1981; Hauchecorne et al., 1987; Terada et al., 2017). Local mixing occurs as the gravity wave breaks, inducing an adiabatic (neutral) temperature lapse rate. We consider the case of a medium-frequency gravity wave , where , and are respectively the Coriolis, the gravity-wave and the Brunt-Väisälä frequencies, with such that
assuming the short-wavelength approximation , where is the vertical wave number. Which are reasonable assumptions for most gravity waves observed in planetary upper atmospheres (Fritts and Alexander, 2003). In those conditions, according to Hauchecorne et al. (1987), the saturated conditions lead to
| (3) |
where is the amplitude of the wave at saturation (expressed in perturbations of potential temperature), the background potential temperature and the acceleration of gravity. Besides, the linearized fluid equations applied to the propagation of gravity waves (Fritts and Alexander, 2003) lead to:
| (4) |
where is the density, and the pressure and density perturbations, and the sound speed. We can neglect the compressibility term related to the background density gradient, which is equivalent to filter out acoustic gravity waves (). This entails:
| (5) |
Combining equations 3 and 5, we obtain the equation expressing the relative density perturbations by gravity waves:
| (6) |
which corresponds to the observed diagnostic described in equation 1. Isothermal background profiles are often observed in the Martian thermosphere, where EUV heating is offset by molecular conduction (Bougher et al., 1990). In the specific case of isothermal profiles, can be reduced to:
| (7) |
which yields the “inverse temperature” dependency (Terada et al., 2017) in the case of isothermal profiles at saturation:
| (8) |
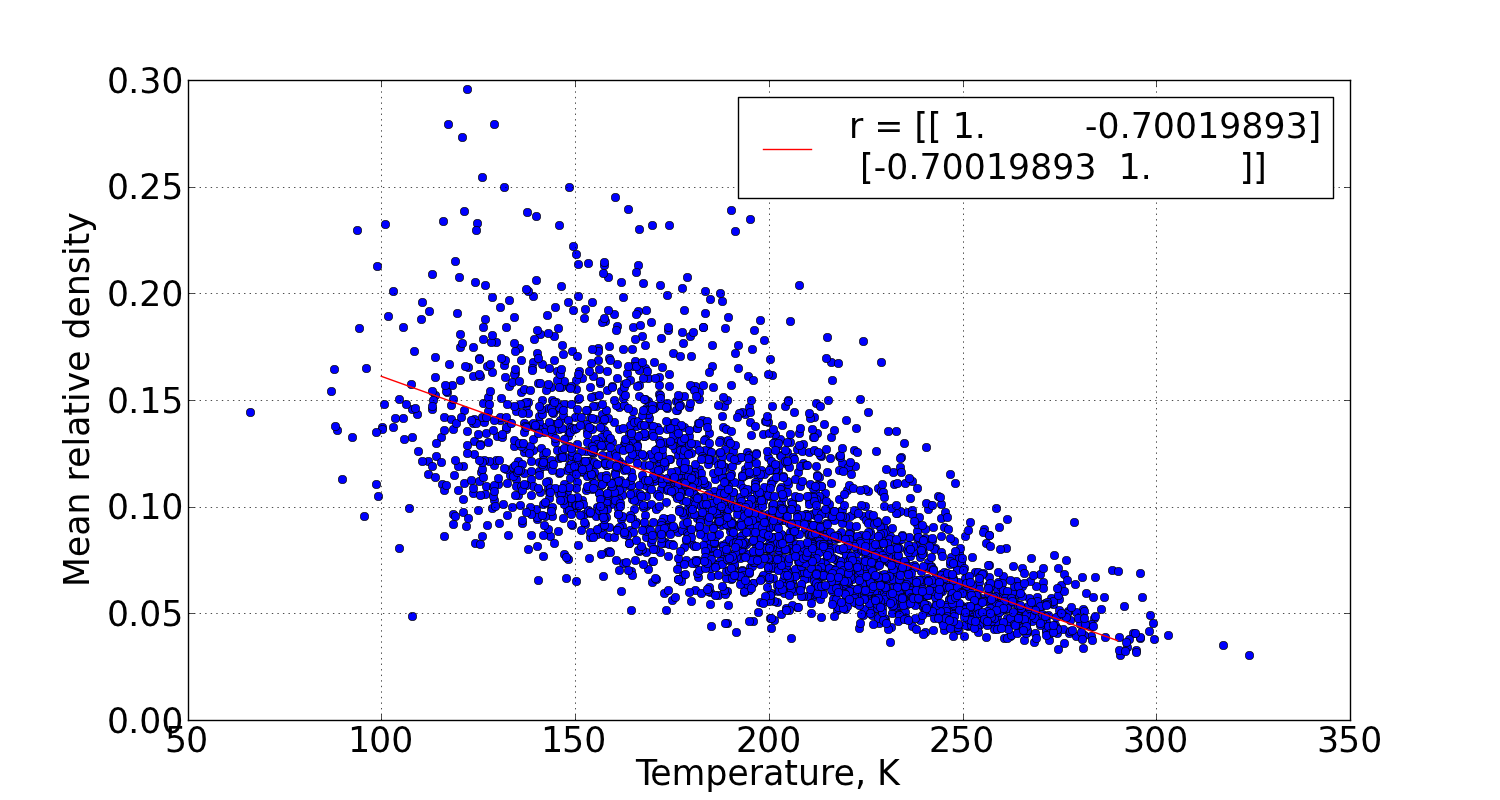
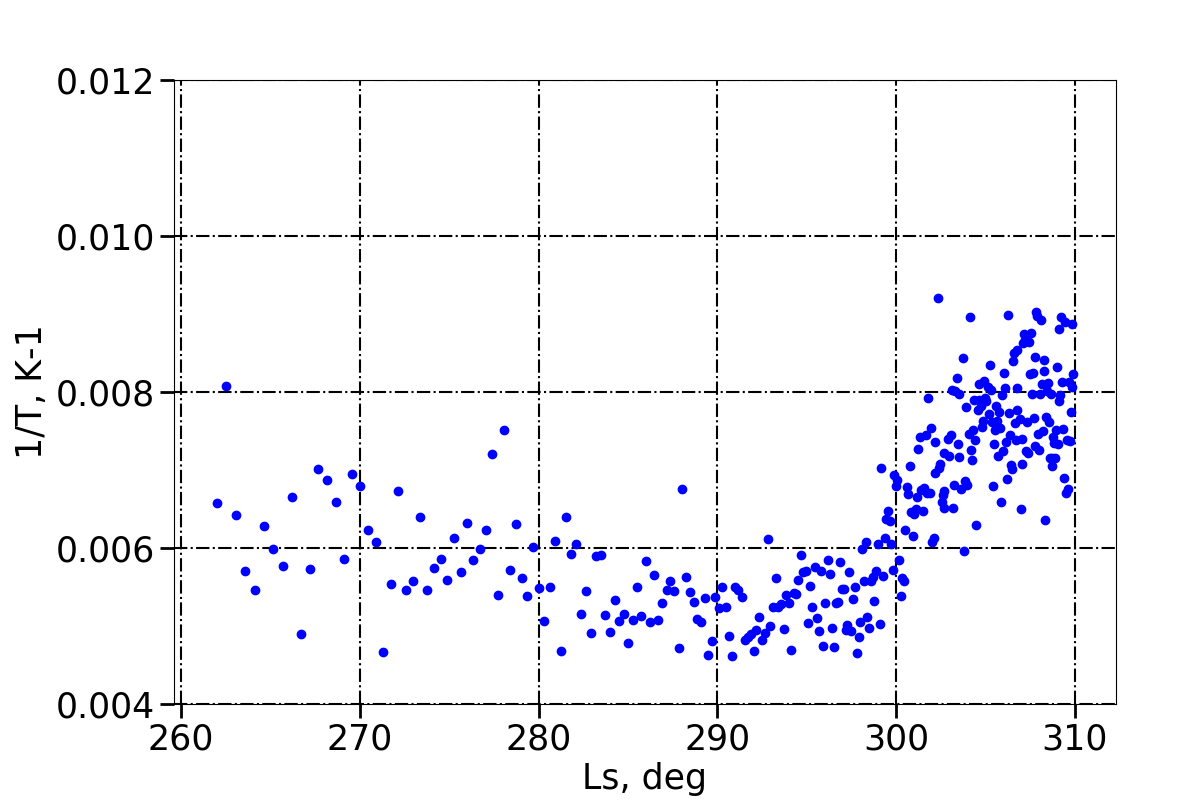
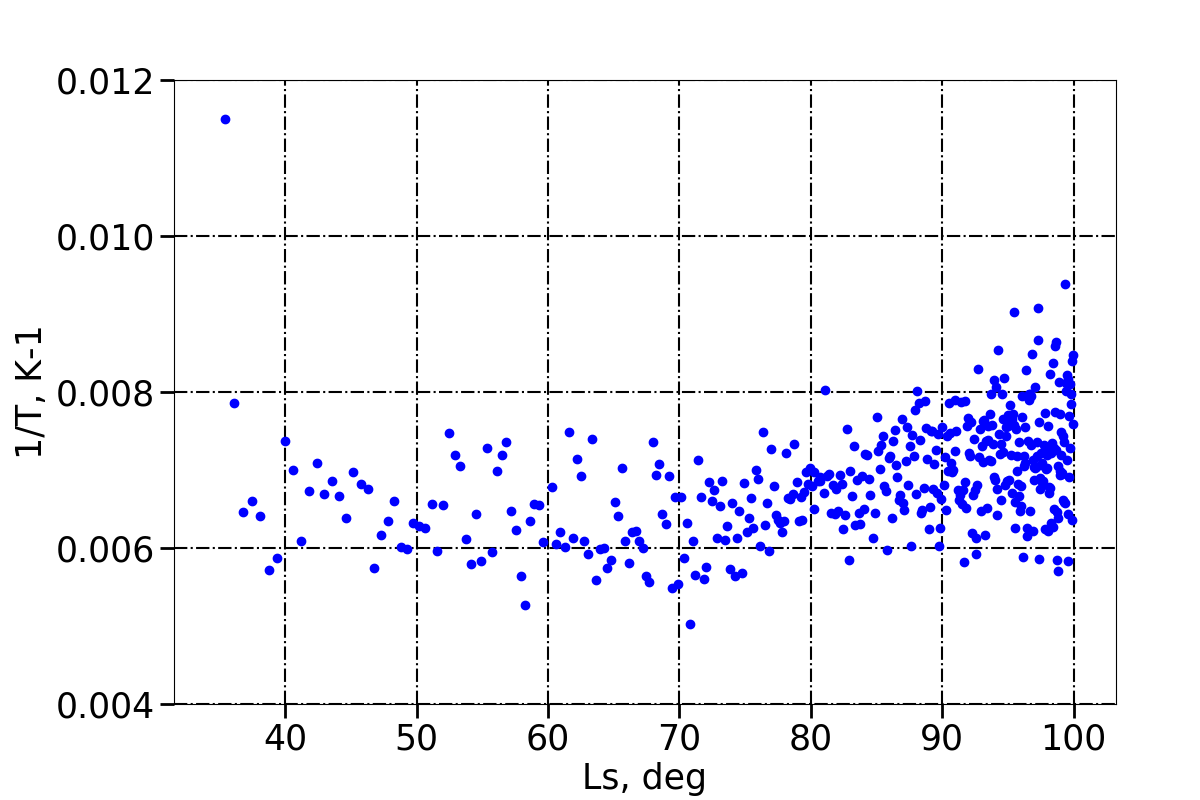
MAVEN data are acquired high in the Martian thermosphere (above 150 km) even for deep dip acquisitions: hence the temperature profiles retrieved by MAVEN are approximately isothermal (England et al., 2017; Terada et al., 2017). The temperature profiles modeled and compiled in the MCD also indicate widespread isothermal profiles at the altitudes probed by MAVEN. Comparing Figures 4 and 9 confirms qualitatively equation 8, i.e. the correlation between the amplitude of gravity wave perturbations and the inverse background temperature. Quantitatively, in the case of the inbound leg of each orbit, a correlation coefficient between the average of the relative density and the calculated temperature is found (see Figure 10). Our analysis of the MAVEN is thus compliant with the one conducted by Terada et al. (2017), and we now turn to the analysis of aerobraking data in the lower thermosphere.
4 Gravity Waves in the Lower Thermosphere: Aerobraking Data
4.1 Analysis
Aerobraking data have been studied in the past to observe the activity of gravity waves in the lower thermosphere, either to discuss the variability of potential sources (Creasey et al., 2006) or to assess wave filtering by zonal jets and how large-amplitude GWs could penetrate to high altitudes (Fritts et al., 2006). Here we assess if the “inverse temperature” correlation inferred from the MAVEN/NGIMS data (Terada et al., 2017, and section 3 of this paper) can be extended to those lower-thermosphere aerobraking observations obtained by the three accelerometers of MGS, ODY and MRO.
In the aerobraking observations, as is emphasized by Tolson et al. (2005) and Tolson et al. (2008), the intensity of density perturbations are systematically lower when the spacecraft enters the polar vortex (e.g. MRO during the southern hemisphere winter and ODY during the northern hemisphere winter). Figure 11 shows two examples: ODY orbit 155, which goes through the northern hemisphere winter vortex at and latitude 82.43∘N, and MRO orbit 250, going through the southern hemisphere winter vortex at and latitude=69.50∘S. These variations of density perturbations within the same orbital track could be explained by the anti-correlation between temperature and gravity wave activity explained above (an explanation that was not provided in Tolson et al., 2008). Polar warming at thermospheric altitudes (first observed by ODY during aerobraking, Keating et al., 2003) results from the adiabatic heating generated by the subsidence of air over the winter pole produced by strong interhemispheric transport (González-Galindo et al., 2009). The entry of the spacecraft inside the polar vortex is then expected to be associated with an increase of temperature, leading to a decrease of gravity wave activity according to equation 8.
 |
 |
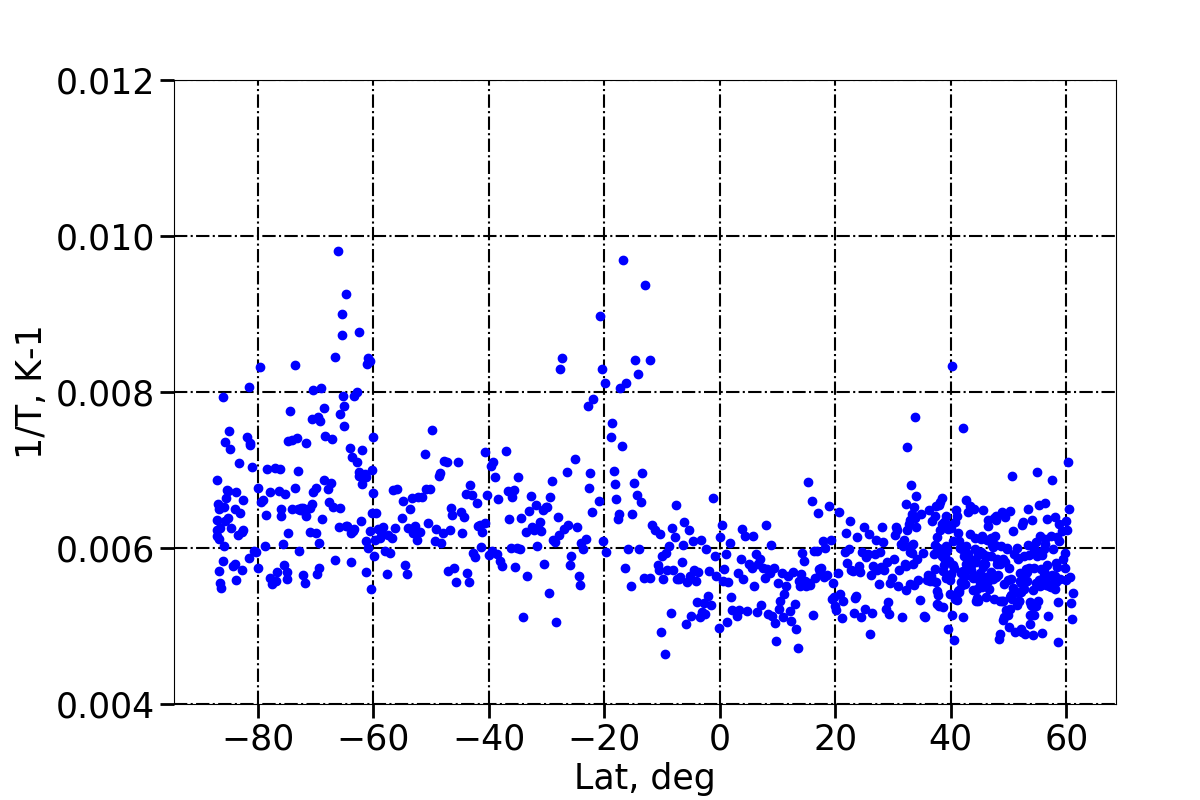
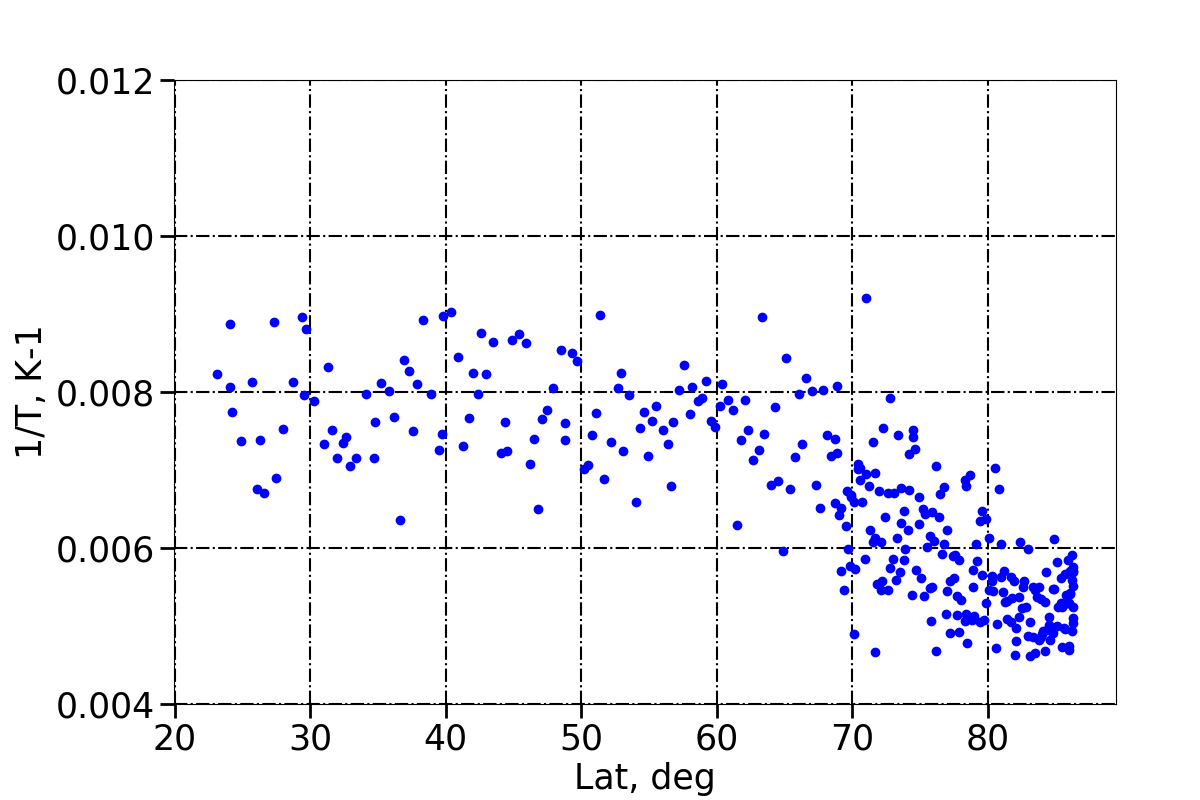
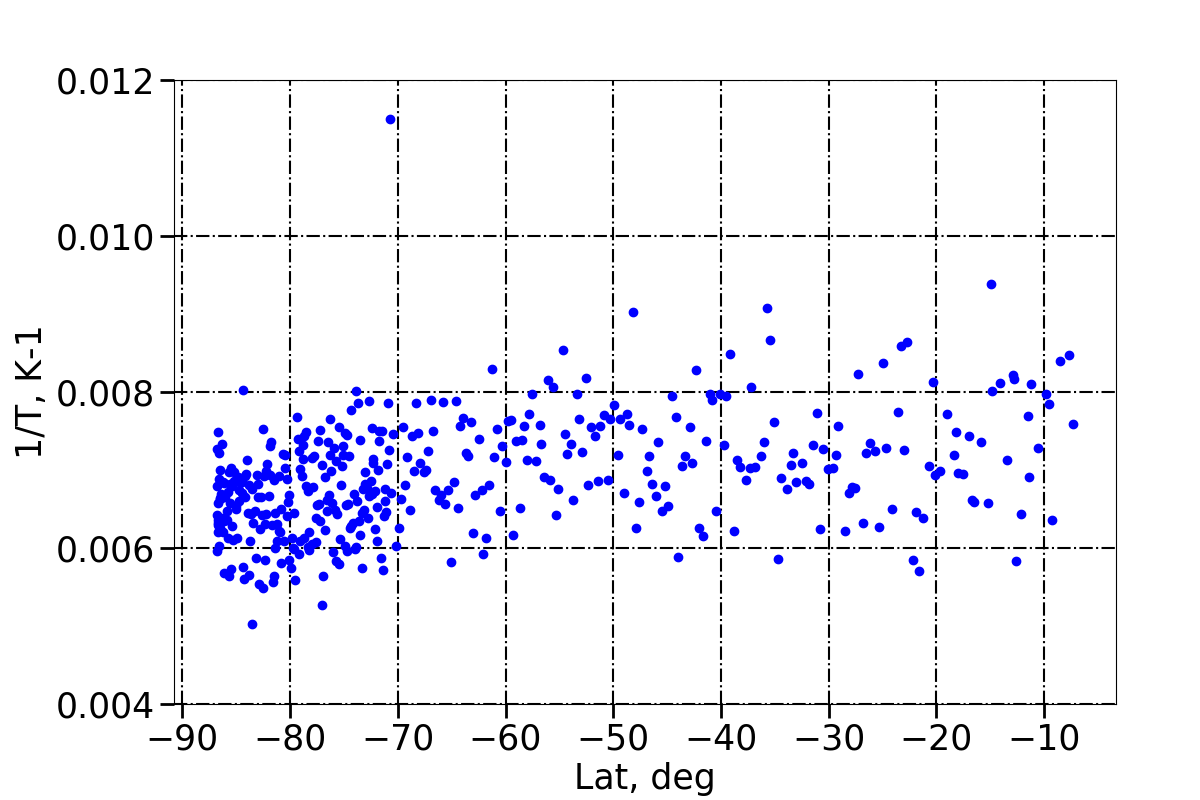
In Figures 12 and 13, the observed RMS of the relative density variations is compared to the inverse of the background temperature, calculated for each orbit of each instrument over the outbound leg (for the sake of brevity, similar results over the inbound leg are not shown). Latitudinal and seasonal variability are displayed respectively in Figures 12 and 13.
The amplitude of gravity waves present similar features with the inverse of temperature in the MGS observations, with an amplitude increase at latitudes 60∘S, 50∘N and particularly at 20∘S, where inverse temperature is higher in Figure 12, corresponding to L in Figure 13. The anti-correlation seems easier to identify in ODY data, in particular at polar latitudes around 80∘N, where a clear decrease of GWs amplitude is correlated with the polar warming (see previous paragraph). Conversely, no obvious correlation between density perturbations and inverse temperature is found in the MRO aerobraking data: there is an increase in gravity waves activity from latitude -90∘ to -70∘, while the tendency for inverse temperature is unclear, corresponding to L in Figure 13. Furthermore, the gravity waves activity decreases at L, corresponding to a latitude of -20∘, whereas it is not the case for inverse temperature. Correlations have been calculated for the three instruments between the gravity waves amplitude and inverse temperature as done for MAVEN in Figure 10, but for all of them the correlation coefficient remains below . The largest correlation coefficient is obtained for ODY (), whereas it is around for the two other datasets.
|
|
|
|
|
|
4.2 Discussion
The correlation between density perturbations, caused by gravity waves, and the inverse background temperature, suggested by equation 8, appears to be observed by MAVEN/NGIMS. A similar correlation, albeit less clear-cut than with the MAVEN/NGIMS dataset, is also noticed during ODY aerobraking phases at high latitudes. This correlation seems to be observed at certain locations for MGS, as seen in the previous section, and also in particular cases for MRO, as seen in the previous section for the orbits located in the polar warming. However, for those two spacecrafts, the correlation is not clear at all in the global analysis of the complete datasets.
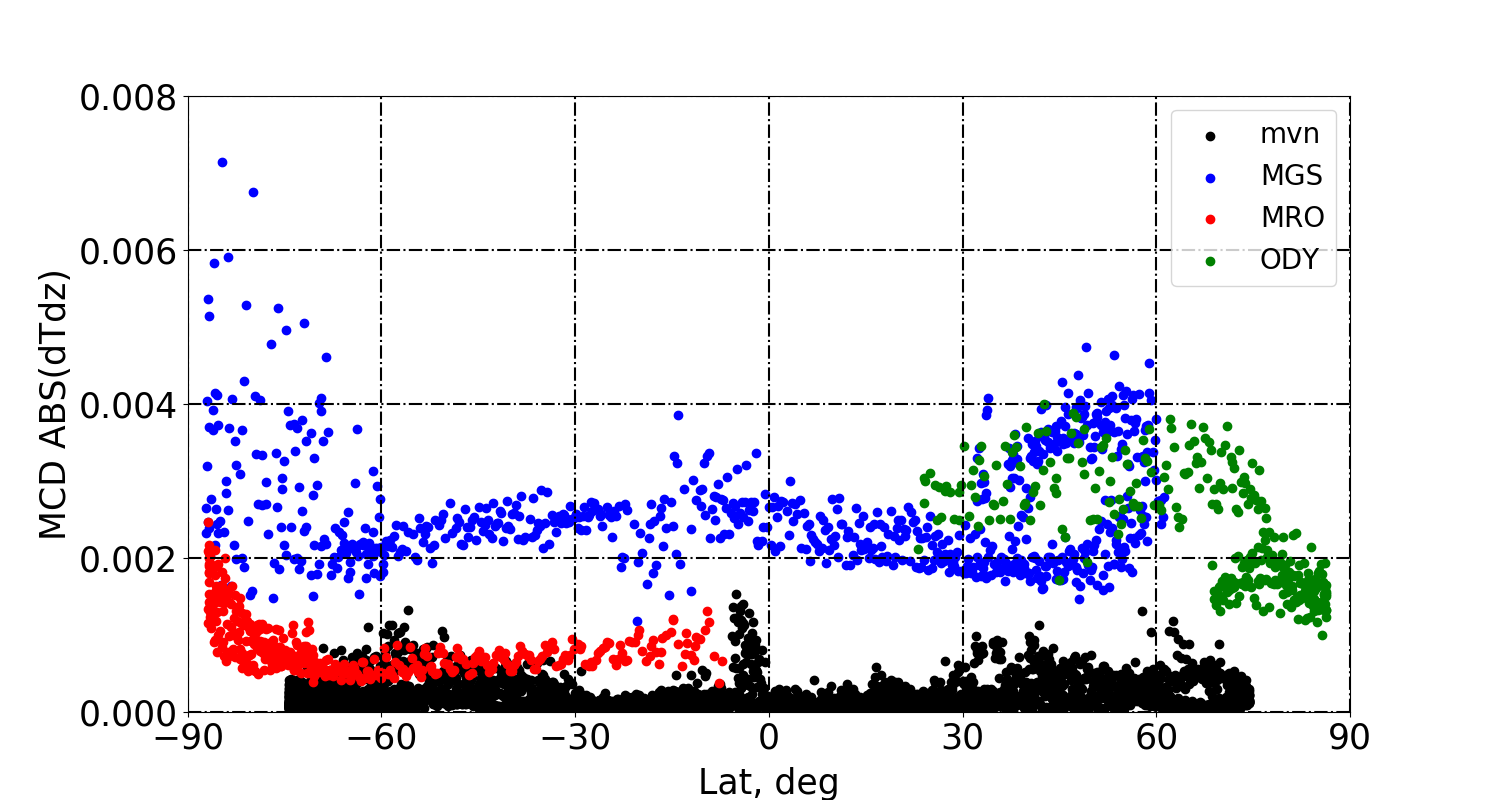
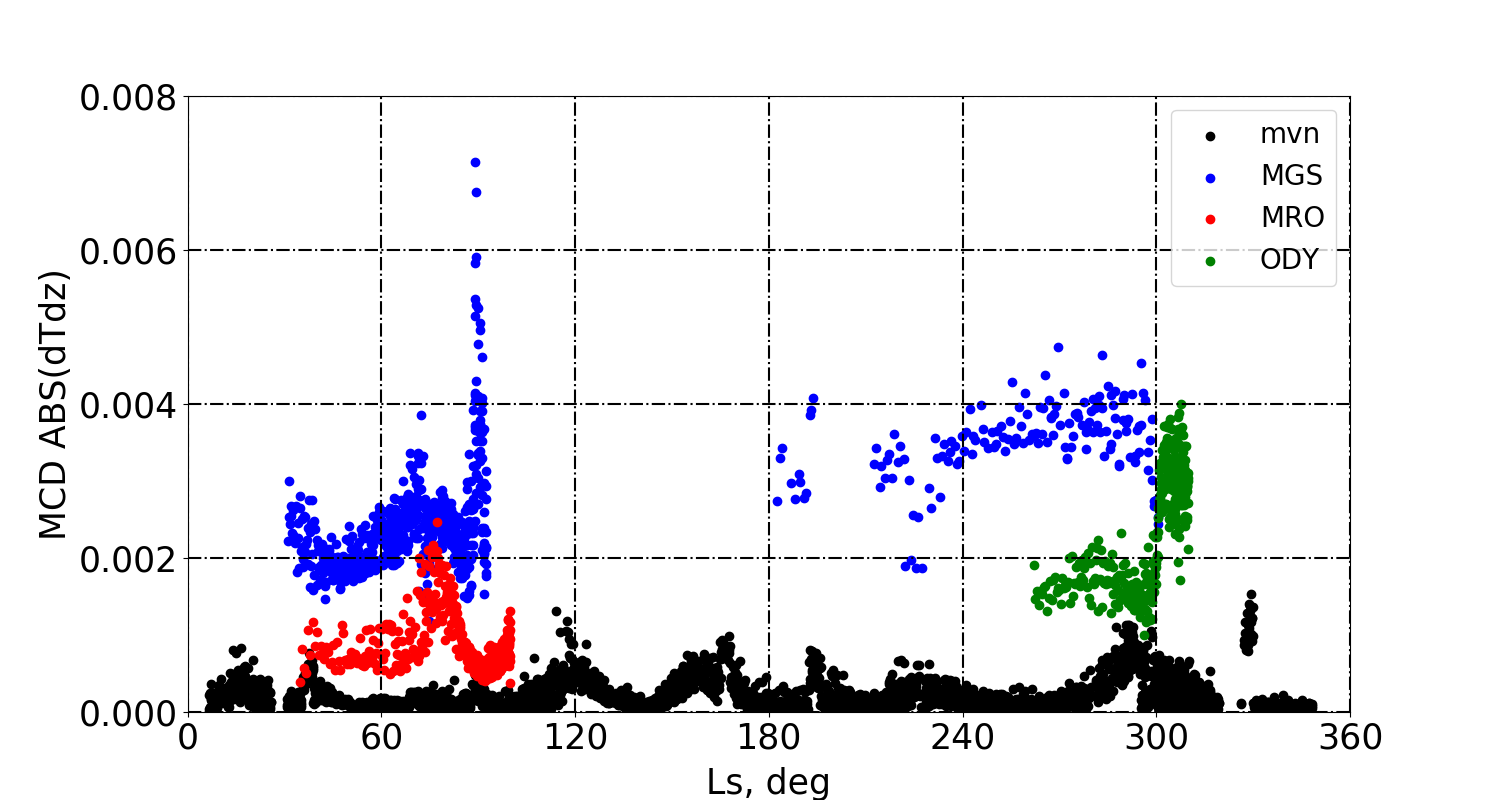
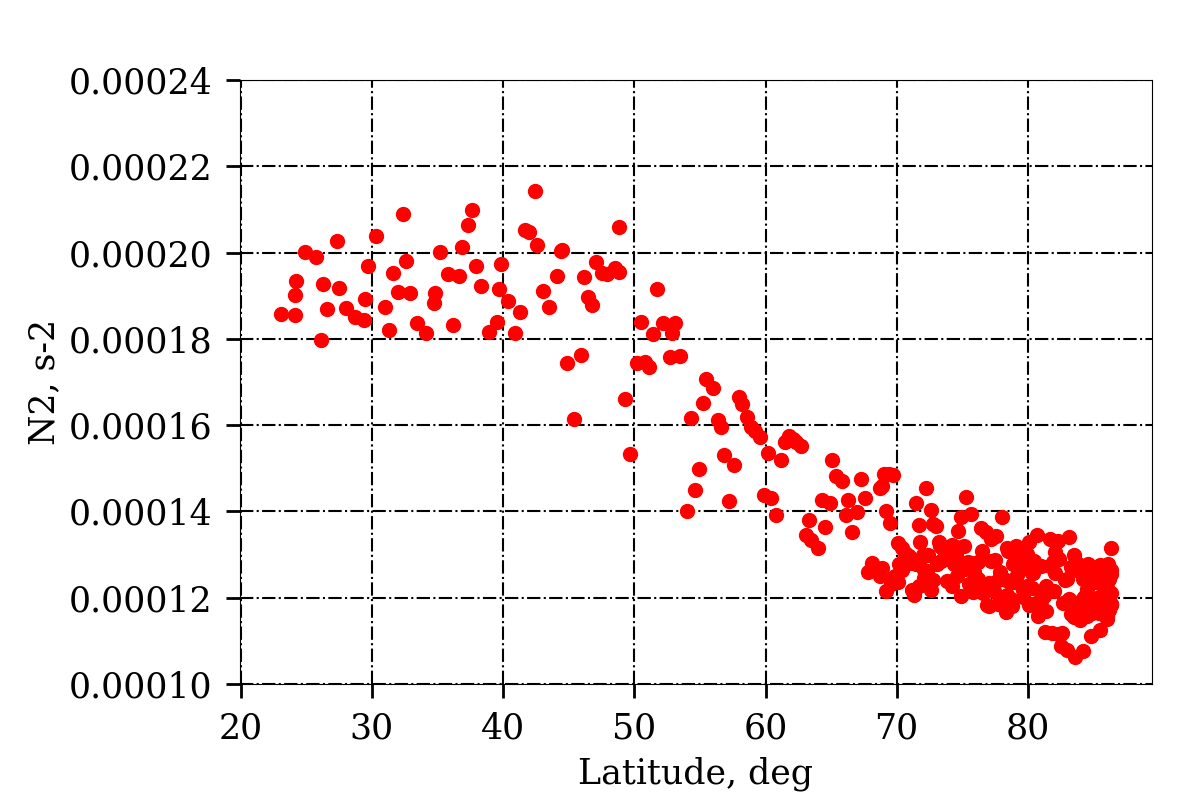
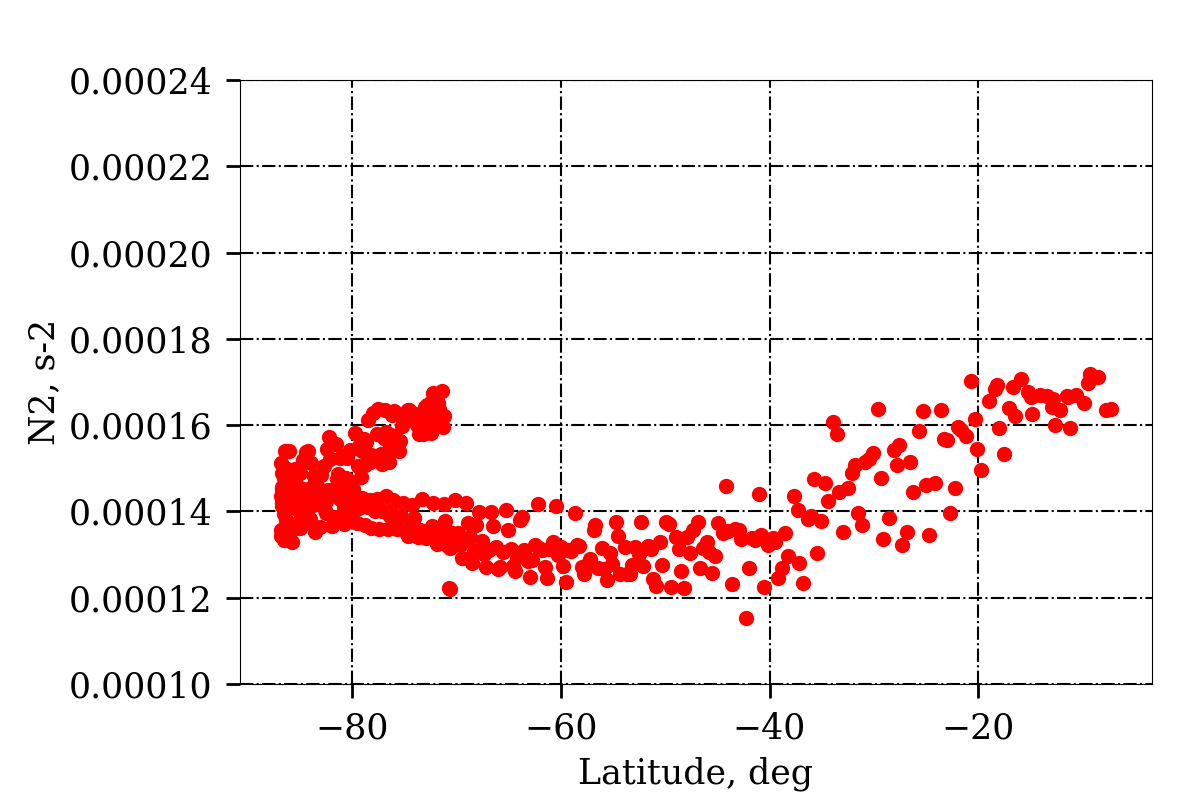
The aerobraking density measurements correspond to periapsis conditions at lower altitudes than the MAVEN/NGIMS measurements (cf. Figure 1). There, the assumption of isothermal profiles could not be valid. Indeed, in Figure 14 we compare the temperature gradients calculated with the MCD for the three aerobraking missions along with MAVEN/NGIMS. The Figure shows that MAVEN/NGIMS data mainly correspond to isothermal profiles, whereas the three other instruments present larger temperature gradients. Yet, equation 8 is only effective in isothermal conditions. As a matter of fact, we observe in the ODY data that a potential correlation between gravity wave activity and inverse temperature only appears where the temperature gradient is the lowest, at higher latitudes. This is also possibly the case for MGS at the points located around latitudes -60∘ and -20∘. However, MRO, which presents the lowest temperature gradient, presents no clear correlation with the inverse temperature. There could be an explanation for the temperature gradient being lower for ODY and MRO, despite the fact they are lower in altitude: at polar latitudes, the polar warming shifts the threshold for isothermal conditions to lower altitudes in the mesosphere. Furthermore, when the temperature gradient is significant, the more general equation 6 shall prevail instead of equation 8, which means that the amplitude of gravity waves is proportional to the static stability rather than the inverse background temperature.
 |
 |
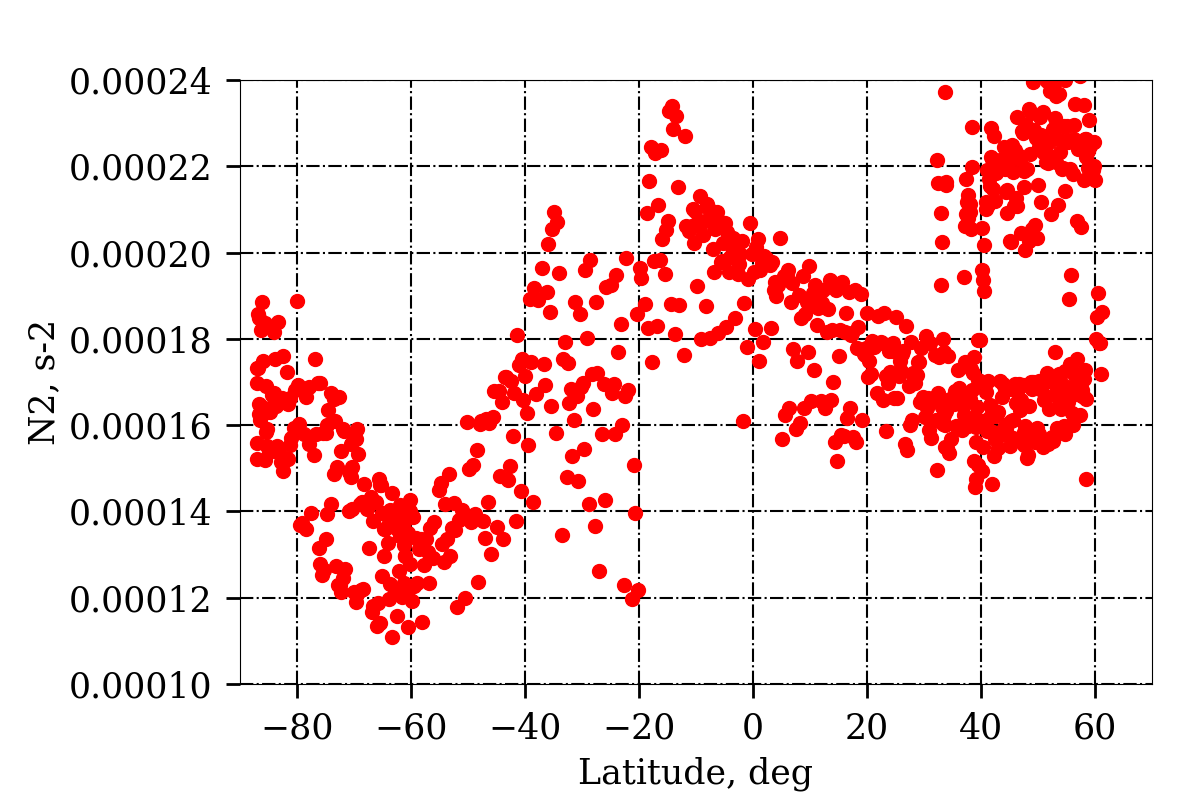
The possible correlation with static stability can be tested with the MCD in the conditions that were met by the aerobraking measurements. Figure 15 displays the comparison between the RMS of the relative density acquired at the different aerobraking orbits and the static stability calculated from the MCD (for the corresponding orbital spatio-temporal coordinates). We observe the same peak of gravity waves activity and static stability for MGS at latitude -20∘ and in the North pole, but not for the other latitudes. A good correlation between the GWs activity and the static stability, as with the inverse temperature, can be found for ODY. Regarding MRO, the static stability correlates well to the observed amplitude of gravity waves in high-latitude regions (latitudes above S), but such a correlation is not found at lower latitudes.
|
 |
|
 |
|
 |
There might be multiple reasons for aerobraking measurements not following equation 6 in the low and mid latitudes. Firstly, while no correlation was found with potential sources of gravity wave, it is still possible that outside the polar regions, propagation effects would compete with the regional variability of gravity-wave sources. Secondly, following a similar argument, the filtering by critical levels was ruled out for a lack of clear tendency, but might be of peculiar importance for specific regions (see Spiga et al., 2012). Thirdly, the regional variability of vertical wavelength , a parameter found in equations 6 and 8, in principle could impact density perturbations (Smith et al., 1987), which then would be less clearly correlated to static stability .
5 Conclusion
We have studied the seasonal and regional variability of density perturbations, putatively caused by the propagation of gravity waves in the thermosphere, in different sets of data issued from the aerobraking phases of MGS, ODY and MRO (accelerometers) and the observations of the NGIMS instrument on board MAVEN. The modeling compiled in the Mars Climate Database has been used to complement background atmospheric conditions obtained by observations. Our conclusions are as follows:
-
1.
The correlation found in the MAVEN observations by Terada et al. (2017) between the inverse background temperature and the density perturbations reasonably extends to the ODY aerobraking measurements, but not to the MGS and MRO aerobraking measurements. This result emphasizes the exceptional nature of MAVEN datasets, which combine both isothermal and saturated conditions (equation 8). The seasonal variability of inverse background temperature measured by MAVEN is reproduced in the Mars Climate Database.
-
2.
In comparison to MAVEN/NGIMS measurements, MGS, ODY and MRO aerobraking data cover a lower layer in the thermosphere, where the Mars Climate Database predicts non-isothermal conditions. In these conditions, and under the hypothesis of saturation, a correlation between the gravity waves perturbation with the static stability is expected (equation 6). A correlation of density perturbations monitored both by ODY and MRO during aerobraking in polar regions with static stability is observed and indicates that wave saturation might be still dominant, but the isothermal conditions are no longer verified (equation 6).
-
3.
The spatial variability of gravity-wave-induced density perturbations are difficult to explain for the global MGS dataset and in lower latitudes for ODY and MRO aerobraking, where no clear correlation with neither inverse temperature nor static stability is found. The effects of gravity-wave sources, or wind filtering effects through critical levels, were ruled out as explanations for most of the measured variability, yet might play a stronger role in the low-to-mid latitudes.
Future studies will employ measurements during the aerobraking phase of the ExoMars Trace Gas Orbiter, as well as new measurements by MAVEN, to confirm the conclusions drawn in this study and the existing literature. Broadening the knowledge of gravity wave activity in the mesosphere and thermosphere is crucial to understand the large-scale heat and momentum budget of this part of the Martian atmosphere.
Acknowledgements.
The authors acknowledge Centre National d’Études Spatiale (CNES) and European Space Agency (ESA) for financial support. We thank two reviewers for thorough and constructive comments that helped us to improve this paper.References
- Alexander et al. (2010) Alexander, M. J., M. Geller, C. McLandress, S. Polavarapu, P. Preusse, F. Sassi, K. Sato, S. Eckermann, M. Ern, A. Hertzog, Y. Kawatani, M. Pulido, T. A. Shaw, M. Sigmond, R. Vincent, and S. Watanabe (2010), Recent developments in gravity-wave effects in climate models and the global distribution of gravity-wave momentum flux from observations and models, Quarterly Journal of the Royal Meteorological Society, 136(650), 1103–1124, 10.1002/qj.637.
- Barnes (1990) Barnes, J. R. (1990), Possible effect of breaking gravity waves on the circulation of the middle atmosphere of Mars, J. Geophys. Res., 95, 1401–1421.
- Benna and Lyness (2014) Benna, M., and E. Lyness (2014), MAVEN Neutral Gas and Ion Mass Spectrometer Data, urn:nasa:pds:maven_ngims.
- Bougher et al. (1990) Bougher, S. W., R. G. Roble, E. C. Ridley, and R. E. Dickinson (1990), The Mars thermosphere. II - General circulation with coupled dynamics and composition, J. Geophys. Res., 95, 14,811–14,827.
- Briggs and Leovy (1974) Briggs, G. A., and C. B. Leovy (1974), Mariner 9 observations of the Mars north polar hood, Bull. Am. Meteorol. Soc., 55, 278–296.
- Collins et al. (1997) Collins, M., S. Lewis, and P. L. Read (1997), Gravity wave drag in a global circulation model of the Martian atmosphere: parametrisation and validation, Adv. Space Res., 44, 1395–1409.
- Creasey et al. (2006) Creasey, J. E., J. M. Forbes, and G. M. Keating (2006), Density variability at scales typical of gravity waves observed in Mars’ thermosphere by the MGS accelerometer, Geophys. Res. Lett., 33, L22,814, 10.1029/2006GL027583.
- Eckermann et al. (2011) Eckermann, S. D., J. Ma, and X. Zhu (2011), Scale-dependent infrared radiative damping rates on Mars and their role in the deposition of gravity-wave momentum flux, 211, 429–442, 10.1016/j.icarus.2010.10.029.
- England et al. (2017) England, S. L., G. Liu, E. Yiǧit, P. R. Mahaffy, M. Elrod, M. Benna, H. Nakagawa, N. Terada, and B. Jakosky (2017), MAVEN NGIMS observations of atmospheric gravity waves in the Martian thermosphere, Journal of Geophysical Research (Space Physics), 122, 2310–2335.
- Forget et al. (1999) Forget, F., F. Hourdin, R. Fournier, C. Hourdin, O. Talagrand, M. Collins, S. R. Lewis, P. L. Read, and J.-P. Huot. (1999), Improved general circulation models of the Martian atmosphere from the surface to above 80 km, J. Geophys. Res., 104, 24,155–24,176.
- Fritts and Alexander (2003) Fritts, D., and M. Alexander (2003), Gravity wave dynamics and effects in the middle atmosphere, Rev. Geophys, 41(1), 1003.
- Fritts et al. (2006) Fritts, D. C., L. Wang, and R. H. Tolson (2006), Mean and gravity wave structures and variability in the Mars upper atmosphere inferred from Mars Global Surveyor and Mars Odyssey aerobraking densities, Journal of Geophysical Research (Space Physics), 111(A10), 12,304–+, 10.1029/2006JA011897.
- Gilli et al. (2018) Gilli, G., F. Forget, A. Spiga, T. Navarro, and M. T. (2018), Impact of gravity waves on the middle atmosphere of mars: a non-orographic gravity wave parameterization based on global climate modeling and mcs observations, Submitted to Journal of Geophysical Research.
- González-Galindo et al. (2009) González-Galindo, F., F. Forget, M. A. López-Valverde, and M. Angelats i Coll (2009), A Ground-to-Exosphere Martian General Circulation Model. 2. The Atmosphere During Perihelion Conditions: Thermospheric Polar Warming , Journal of Geophysical Research (Planets), 114(E13), E08,004, 10.1029/2008JE003277.
- Gossard and Hooke (1975) Gossard, E. E., and W. H. Hooke (1975), Waves in the atmosphere: Atmospheric infrasound and gravity waves - Their generation and propagation, Developments in Atmospheric Science, vol. 2, first ed., Elsevier Scientific Publishing.
- Hartogh et al. (2005) Hartogh, P., A. S. Medvedev, T. Kuroda, R. Saito, G. Villanueva, A. G. Feofilov, A. A. Kutepov, and U. Berger (2005), Description and climatology of a new general circulation model of the Martian atmosphere, Journal of Geophysical Research (Planets), 110(E9), 11,008, 10.1029/2005JE002498.
- Hauchecorne et al. (1987) Hauchecorne, A., M. L. Chanin, and R. Wilson (1987), Mesospheric temperature inversion and gravity wave breaking, Geophys. Res. Lett., 14, 933–936, 10.1029/GL014i009p00933.
- Imamura et al. (2016) Imamura, T., A. Watanabe, and Y. Maejima (2016), Convective generation and vertical propagation of fast gravity waves on Mars: One- and two-dimensional modeling, Icarus, 267, 51–63, 10.1016/j.icarus.2015.12.005.
- Jakosky et al. (2015) Jakosky, B. M., R. P. Lin, J. M. Grebowsky, J. G. Luhmann, D. F. Mitchell, G. Beutelschies, T. Priser, M. Acuna, L. Andersson, D. Baird, D. Baker, R. Bartlett, M. Benna, S. Bougher, D. Brain, D. Carson, S. Cauffman, P. Chamberlin, J.-Y. Chaufray, O. Cheatom, J. Clarke, J. Connerney, T. Cravens, D. Curtis, G. Delory, S. Demcak, A. DeWolfe, F. Eparvier, R. Ergun, A. Eriksson, J. Espley, X. Fang, D. Folta, J. Fox, C. Gomez-Rosa, S. Habenicht, J. Halekas, G. Holsclaw, M. Houghton, R. Howard, M. Jarosz, N. Jedrich, M. Johnson, W. Kasprzak, M. Kelley, T. King, M. Lankton, D. Larson, F. Leblanc, F. Lefevre, R. Lillis, P. Mahaffy, C. Mazelle, W. McClintock, J. McFadden, D. L. Mitchell, F. Montmessin, J. Morrissey, W. Peterson, W. Possel, J.-A. Sauvaud, N. Schneider, W. Sidney, S. Sparacino, A. I. F. Stewart, R. Tolson, D. Toublanc, C. Waters, T. Woods, R. Yelle, and R. Zurek (2015), The Mars Atmosphere and Volatile Evolution (MAVEN) Mission, Space Science Reviews, 195, 3–48, 10.1007/s11214-015-0139-x.
- Keating et al. (2002) Keating, G., R. Tolson, J. Hanna, R. Beebe, J. Murphy, and L. Huber (2002), MGS-M-ACCEL-5-PROFILE-V1.2, NASA Planetary Data System.
- Keating et al. (2003) Keating, G. M., M. Theriot, Jr., R. Tolson, S. Bougher, F. Forget, and J. Forbes (2003), Global Measurements of the Mars Upper Atmosphere: In Situ Accelerometer Measurements from Mars Odyssey 2001 and Mars Global Surveyor, in Lunar and Planetary Institute Conference Abstracts, edited by S. Mackwell and E. Stansbery, p. 1142.
- Lewis et al. (1999) Lewis, S. R., M. Collins, P. L. Read, F. Forget, F. Hourdin, R. Fournier, C. Hourdin, O. Talagrand, and J.-P. Huot. (1999), A climate database for Mars, J. Geophys. Res., 104, 24,177–24,194.
- Lindzen (1981) Lindzen, R. S. (1981), Turbulence and stress owing to gravity wave and tidal breakdown, J. Geophys. Res., 86, 9707–9714.
- Lyons et al. (1999) Lyons, D. T., J. G. Beerer, P. Esposito, M. D. Johnston, and W. H. Willcockson (1999), Mars Global Surveyor: Aerobraking Mission Overview, Journal of Spacecraft and Rockets, 36, 307–313, 10.2514/2.3472.
- Mahaffy et al. (2015) Mahaffy, P. R., M. Benna, M. Elrod, S. W. Bougher, R. Yelle, and B. M. Jakosky (2015), Early Composition, Structure, and Isotope Measurements in the Upper Atmosphere of Mars from MAVEN’s Neutral Gas and Ion Mass Spectrometer, in Lunar and Planetary Science Conference, Lunar and Planetary Science Conference, vol. 46, p. 1981.
- McFarlane (1987) McFarlane, N. A. (1987), The effect of orographically excited gravity wave drag on the general circulation of the lower stratosphere and troposphere, J. Atmos. Sci., 44, 1775–1800.
- Medvedev et al. (2015) Medvedev, A. S., F. González-Galindo, E. Yiǧit, A. G. Feofilov, F. Forget, and P. Hartogh (2015), Cooling of the Martian thermosphere by CO2 radiation and gravity waves: An intercomparison study with two general circulation models, Journal of Geophysical Research (Planets), 120, 913–927, 10.1002/2015JE004802.
- Millour et al. (2015) Millour, E., F. Forget, A. Spiga, T. Navarro, J.-B. Madeleine, L. Montabone, A. Pottier, F. Lefevre, F. Montmessin, J.-Y. Chaufray, M. A. Lopez-Valverde, F. Gonzalez-Galindo, S. R. Lewis, P. L. Read, J.-P. Huot, M.-C. Desjean, and MCD/GCM development Team (2015), The Mars Climate Database (MCD version 5.2), European Planetary Science Congress 2015, 10, EPSC2015–438.
- Montabone et al. (2015) Montabone, L., F. Forget, E. Millour, R. J. Wilson, S. R. Lewis, B. Cantor, D. Kass, A. Kleinböhl, M. T. Lemmon, M. D. Smith, and M. J. Wolff (2015), Eight-year climatology of dust optical depth on Mars, Icarus, 251, 65–95, 10.1016/j.icarus.2014.12.034.
- O’sullivan and Dunkerton (1995) O’sullivan, D., and T. Dunkerton (1995), Generation of Inertia–Gravity Waves in a Simulated Life Cycle of Baroclinic Instability, Journal of the Atmospheric Sciences, 52(21), 3695–3716.
- Palmer et al. (1986) Palmer, T. N., G. J. Shutts, and R. Swinbank (1986), Alleviation of a systematic westerly bias in general circulation and numerical weather prediction models through an orographic gravity wave drag parametrisation, Q. J. R. Meteorol. Soc., 112, 1001–1039.
- Parish et al. (2009) Parish, H. F., G. Schubert, M. P. Hickey, and R. L. Walterscheid (2009), Propagation of tropospheric gravity waves into the upper atmosphere of Mars, Icarus, 203, 28–37, 10.1016/j.icarus.2009.04.031.
- Pickersgill and Hunt (1979) Pickersgill, A. O., and G. E. Hunt (1979), The formation of Martian lee waves generated by a crater, J. Geophys. Res., 84(B14), 8317–8331.
- Pickersgill and Hunt (1981) Pickersgill, A. O., and G. E. Hunt (1981), An examination of the formation of linear lee waves generated by giant Martian volcanoes, J. Atmos. Sci., 38, 40–51.
- Plougonven et al. (2003) Plougonven, R., H. Teitelbaum, and V. Zeitlin (2003), Inertia gravity wave generation by the tropospheric midlatitude jet as given by the Fronts and Atlantic Storm-Track Experiment radio soundings, J. Geophys. Res., 108(21), 4686–4704, 10.1029/2003JD003535.
- Siddle et al. (2019) Siddle, A., I. Mueller-Wodarg, S. Stone, and R. Yelle (2019), Global characteristics of gravity waves in the upper atmosphere of Mars asmeasured by MAVEN/NGIMS, Icarus, 333, 12–21, 10.1016/j.icarus.2019.05.021.
- Smith and Bell (2005) Smith, J. C., and J. Bell (2005), 2001 Mars Odyssey Aerobraking, Journal of Spacecraft and Rockets, 42, 406–415, 10.2514/1.15213.
- Smith et al. (1987) Smith, S. A., D. C. Fritts, and T. E. Vanzandt (1987), Evidence for a Saturated Spectrum of Atmospheric Gravity Waves., Journal of Atmospheric Sciences, 44(10), 1404–1410, 10.1175/1520-0469(1987)044¡1404:EFASSO¿2.0.CO;2.
- Spiga et al. (2008) Spiga, A., H. Teitelbaum, and V. Zeitlin (2008), Identification of the sources of inertia-gravity waves in the Andes Cordillera region, Annales Geophysicae, 26, 2551–2568.
- Spiga et al. (2012) Spiga, A., F. González-Galindo, M.-Á. López-Valverde, and F. Forget (2012), Gravity waves, cold pockets and CO2 clouds in the Martian mesosphere, Geophys. Res. Letters, 39, L02201, 10.1029/2011GL050343.
- Spiga et al. (2013) Spiga, A., J. Faure, J.-B. Madeleine, A. Määttänen, and F. Forget (2013), Rocket dust storms and detached dust layers in the Martian atmosphere, Journal of Geophysical Research (Planets), 118, 746–767, 10.1002/jgre.20046.
- Terada et al. (2017) Terada, N., F. Leblanc, H. Nakagawa, A. S. Medvedev, E. Yiǧit, T. Kuroda, T. Hara, S. L. England, H. Fujiwara, K. Terada, K. Seki, P. R. Mahaffy, M. Elrod, M. Benna, J. Grebowsky, and B. M. Jakosky (2017), Global distribution and parameter dependences of gravity wave activity in the Martian upper thermosphere derived from MAVEN/NGIMS observations, Journal of Geophysical Research (Space Physics), 122, 2374–2397.
- Tolson (2007) Tolson, R. (2007), MRO Profile Data Records V1.0, MRO-M-ACCEL-2-PROFILE-V1.0, NASA Planetary Data System.
- Tolson et al. (2005) Tolson, R., A. M. Dwyer, P. E. Escalera, B. E. George, J. L. Hanna, G. M. Keating, and M. R. Werner (2005), Application of Accelerometer Data to Mars Odyssey Aerobraking and Atmospheric Modeling, Journal of Spacecraft and Rockets, 42, 435–443, 10.2514/1.15173.
- Tolson et al. (2007a) Tolson, R., J. Murphy, R. Beebe, and L. Huber (2007a), ODY-M-ACCEL-5-PROFILE-V2.0, NASA Planetary Data System.
- Tolson et al. (2008) Tolson, R., E. Bemis, S. Hough, K. Zaleski, G. Keating, J. Shidner, S. Brown, A. Brickler, M. Scher, and P. Thomas (2008), Atmospheric Modeling Using Accelerometer Data During Mars Reconnaissance Orbiter Aerobraking Operations, Journal of Spacecraft and Rockets, 45, 511–518, 10.2514/1.34301.
- Tolson et al. (1999) Tolson, R. H., G. J. Cancro, G. M. Keating, S. N. Noll, J. S. Parker, and B. L. Wilkerson (1999), Application of Accelerometer Data to Mars Global Surveyor Aerobraking Operations, Journal of Spacecraft and Rockets, 36, 323–329, 10.2514/2.3474.
- Tolson et al. (2007b) Tolson, R. H., G. M. Keating, R. W. Zurek, S. W. Bougher, C. G. Justus, and D. C. Fritts (2007b), Application of Accelerometer Data to Atmospheric Modeling During Mars Aerobraking Operations, Journal of Spacecraft and Rockets, 44, 1172–1179, 10.2514/1.28472.
- Vincent and Alexander (2000) Vincent, R. A., and M. J. Alexander (2000), Gravity waves in the tropical lower stratosphere: An observational study of seasonal and interannual variability, J. Geophys. Res., 105(14), 17,971–17,982, 10.1029/2000JD900196.
- Yiğit et al. (2015) Yiğit, E., S. L. England, G. Liu, A. S. Medvedev, P. R. Mahaffy, T. Kuroda, and B. M. Jakosky (2015), High-altitude gravity waves in the martian thermosphere observed by maven/ngims and modeled by a gravity wave scheme, Geophysical Research Letters, pp. –, 10.1002/2015GL065307, 2015GL065307.