NIHAO XXI: The emergence of Low Surface Brightness galaxies
Abstract
The existence of galaxies with a surface brightness lower than the night sky has been known since three decades. Yet, their formation mechanism and emergence within a universe has remained largely undetermined. For the first time, we investigated the origin of Low Surface Brightness (LSB) galaxies with M⋆109.5-10M⊙, which we are able to reproduce within hydrodynamical cosmological simulations from the NIHAO suite. The simulated and observed LSBs share similar properties, having large HI reservoir, extended star formation histories and effective radii, low Sérsic index and slowly rising rotation curves. The formation mechanism of these objects is explored: simulated LSBs form as a result of co-planar co-rotating mergers and aligned accretion of gas at early times, while perpendicular mergers and mis-aligned gas accretion result in higher galaxies by =0. The larger the merger, the stronger the correlation between merger orbital configuration and final . While the halo spin parameter is consistently high in simulated LSB galaxies, the impact of halo concentration, feedback-driven gas outflows and merger time only plays a minor-to-no role in determining . Interestingly, the formation scenario of such ‘classical’ LSBs differs from the one of less massive, M⋆107-9M⊙, Ultra-Diffuse Galaxies, the latter resulting from the effects of SNae driven gas outflows: a M⋆ of 109M⊙ thus represents the transition regime between a feedback dominated to an angular momentum dominated formation scenario in the LSB realm. Observational predictions are offered regarding spatially resolved star formation rates through LSB discs: these, together with upcoming surveys, can be used to verify the proposed emergence scenario of LSB galaxies.
keywords:
methods: galaxies: haloes – galaxies: evolution – cosmology: theory – dark matter1 Introduction
Low Surface Brightness galaxies (LSBs) are diffuse, faint galaxies hardly distinguishable from the night sky, whose discovery dates back to the late 80’s (Bothun et al., 1987; Impey et al., 1988; Schombert & Bothun, 1988). Although a few giant LSBs have been discovered in the field, Malin 1 being the most famous example of this category (e.g. Bothun et al., 1987; Lelli et al., 2010), most LSB objects are found to be dwarf galaxies, with a M⋆1010M⊙ (see Impey & Bothun 1997; Bothun et al. 1997 for a review of ‘classical’ LSBs).
LSBs do not generally have a central bulge, like regular spirals, they are dark matter (DM) dominated and show a slowly rising rotation curve (e.g. Dalcanton et al., 1997; de Blok et al., 2001; McGaugh et al., 2001), an extended star formation history (SFH) with a high fraction of young stars, suggesting that they follow a similar evolutionary history as higher surface brightness galaxies, but at a slower rate (McGaugh & Bothun, 1994; van den Hoek et al., 2000; Bell et al., 2000). Most of their baryonic matter is in the form of HI gas, having amongst the highest gas mass fractions of any studied galaxy type (Schombert et al., 2001). Their central () and effective () surface brightness reach much lower values than regular High Surface Brightness (HSB) objects: although a strict definition of LSBs does not exist, the lower limit of 22-22.5 mag/arcsec2 is a reasonable operative value to discriminate these elusive galaxies from regular HSBs. Despite representing a significant component of the galaxy population, spanning a wide range of morphological types within different environments, their low makes them hard to detect. Only in the last decade have advances in technologies and instrumentation allowed the limit of discoveries of LSBs to be pushed to lower and lower magnitudes (Merritt et al., 2014; van Dokkum et al., 2015; Fliri & Trujillo, 2016; Trujillo & Fliri, 2016; Martínez-Delgado et al., 2010), unveiling a large population of LSB galaxies and opening a new window on their evolution and formation.
Further reinvigorating the interest for the LSB universe, is the recent discovery of a ubiquitous population of faint, ultra-LSB galaxies: initially identified within the Coma cluster (van Dokkum et al., 2015; Koda et al., 2015; Beasley & Trujillo, 2016), they have since then been found in the Virgo, Fornax and other low-z clusters (Mihos et al., 2015; Muñoz et al., 2015; van der Burg et al., 2016; Mancera Piña et al., 2018), as well as in the field and groups (Martínez-Delgado et al., 2016; Román & Trujillo, 2017; Trujillo et al., 2017). These objects, having the stellar mass of small dwarf galaxies, M⋆106.5-9M⊙, but the effective radius, Re, of large spirals, have been named Ultra-Diffuse Galaxies (UDGs), and their can be as low as 28-30 mag/arcsec2.
Initially referred to as a different category compared to ‘classical’ LSBs (see, however, the 20 years old definition of Very Low Surface Brightness objects, as compared to UDGs, in McGaugh 1996), the similarity between the two galaxy types has been recently recognized. Indeed, UDGs exists in various colours and environments, and, just like LSBs, can be extremely HI gas rich (e.g. Leisman et al., 2017; Spekkens & Karunakaran, 2018).
While there is not a clear consensus about the formation mechanism of UDGs, the two current leading scenarios are: i) formation through feedback-driven gas outflows, that are able to cause fluctuation in the potential at the center of the galaxy which, in turn, allows for an expanded and extended DM and stellar distribution (Di Cintio et al., 2017; Chan et al., 2018; Jiang et al., 2018) and ii) formation within the high-spin tail of DM haloes (Amorisco & Loeb, 2016). More recently, UDGs formation through galaxy interactions has been observationally suggested for UDGs that are found in dense environemnts (Bennet et al., 2018), highlighting how different channels can produce UDGs (see also Chilingarian et al. 2019; Carleton et al. 2019). Moreover, Yozin & Bekki (2015) showed that early accretion of faint galaxies into overdense regions can further quench star formation, producing UDGs.
Within a cosmological CDM context, the studies of Di Cintio et al. (2017); Chan et al. (2018), based respectively on the NIHAO (Wang et al., 2015) and FIRE (Hopkins et al., 2014) simulation suites, have been shown to be able to reproduce a realistic population of UDGs, without any fine-tuning of the simulation parameters themselves. However, no simulations have been explicitly shown, so far, to be able to reproduce a population of ‘classical’ LSBs, with M⋆109-10M⊙ (we note here the recent work of Zhu et al. 2018, that deals with a different, less common type of giant-LSB, which form through cooling of hot halo gas within their simulations).
At today, the formation mechanism of LSBs, and its eventual link to the one of UDGs, is largely undetermined and only marginally studied. Previous theoretical works agreeably suggest that high angular momentum haloes naturally form LSB discs, highlighting the importance of halo spin in the creation of LSBs (Dalcanton et al. 1997; Dutton et al. 2007, and references therein). Understanding how the broad population of LSBs form and evolve, how they are linked to their DM haloes, and, most importantly, how they fit within the current cosmological model of galaxy formation, is an issue that must be addressed in order to explain the ever increasing number of LSBs observed in our Universe.
In this paper, we make use of state-of-the-art, sophisticated hydrodynamical cosmological simulations, to answer these questions, pointing out the important role played by angular momentum in creating LSB galaxies. We select a sample of simulated galaxies within a narrow range of stellar masses but with a wide range of surface brightnesses. The main goal of this work is to find out what causes the variation in effective radius (or surface brightness) at a fixed stellar mass, or else, why some galaxies end up being lower surface brightness than other galaxies of similar M⋆.
The manuscript is structured as follows: in Section 2 we describe our simulation sample (§ 2.1) and the selection criteria of simulated LSB candidates (§ 2.2), and compare their HI gas content, M⋆ and Re with observational datasets in § 2.3; in Section 3 the properties of simulated LSBs and HSBs are presented, including their surface brightness profiles and Sérsic index (§ 3.1), photometric images (§ 3.2), rotation curves (§ 3.3) and star formation histories (§ 3.4); in Section 4 the formation and emergence of simulated LSBs is studied, addressing the role of DM haloes profiles, concentration and spin (§ 4.1,§ 4.2), mass accretion histories (§ 4.3), redshift of last major merger (§ 4.4), and finally orbital alignment at merger time and gas alignment at high (§ 4.5,§ 4.6); in Section 5 we offer some observational predictions which could be tested once spatially resolved star formation rates (SFR) in LSB would become accessible; finally in Section 6 we conclude our manuscript specifying the main findings on the formation of LSBs, and highlighting similarities and differences with respect to previously studied UDGs.
2 Simulation sample
2.1 The NIHAO simulations
The Numerical Investigation of a Hundred Astrophysical Objects (NIHAO) project (Wang et al., 2015), is a series of 125 cosmologically simulated, zoom-in galaxies, evolved using the SPH code Gasoline2.0 (Wadsley et al., 2017). The code includes a subgrid model for turbulent mixing of metals and energy (Wadsley et al., 2008), ultraviolet heating, ionization and metal cooling (Shen et al., 2010). Star formation and feedback follows the model used in the Making Galaxies In a Cosmological Context simulations (MaGICC) (Stinson et al., 2013), that for the first time reproduced galaxy scaling relations over a wide mass range (Brook et al., 2012), adopting a threshold for star formation of and a Chabrier (2003) IMF.
Stars feed energy back into the ISM via blast-wave supernova feedback (Stinson et al., 2006) and early stellar feedback from massive stars. Particle masses and force softenings of the NIHAO suite are chosen to resolve the mass profile to below 1 of the virial radius at all masses, ensuring that galaxy half-light radii are well resolved. The NIHAO galaxies are all centrals and isolated and cover a broad mass range, from dwarfs to Milky Way mass, and represent an unbiased sampling of merger histories, concentrations and spin parameters. All simulated galaxies lie on abundance matching predictions from =0 to =3 (Moster et al., 2013), having the expected M⋆ for each Mhalo. The NIHAO project satisfactorily reproduces realistic galaxies in terms of their M⋆, SFH, metals and DM distribution (e.g. Tollet et al., 2016; Obreja et al., 2016).
2.2 Selection of LSB candidates
We start by selecting, within the full sample of NIHAO galaxies, those objects whose M⋆ falls within the range of observed LSBs. Since the vast majority of known ‘classical’ LSB have stellar masses comprised between 109 and 1010M⊙, as reported in Impey & Bothun (1997), we focus on simulated galaxies within such range. Moreover, we note that diffuse, dwarf LSBs, with M⋆109M⊙(i.e. UDGs) have already been studied and analysed elsewhere (Di Cintio et al., 2017; Chan et al., 2018; Jiang et al., 2018).
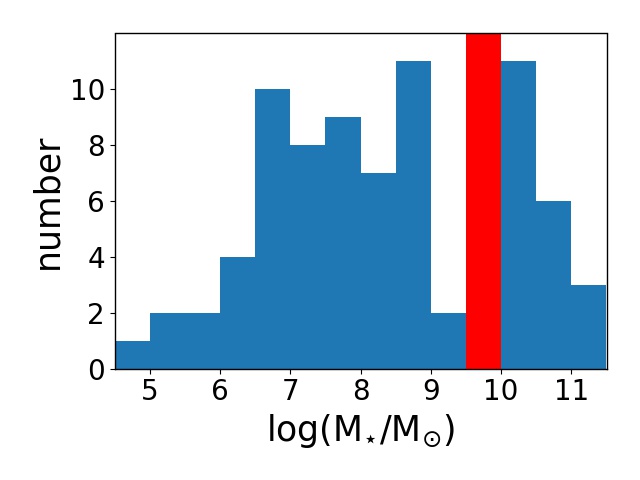
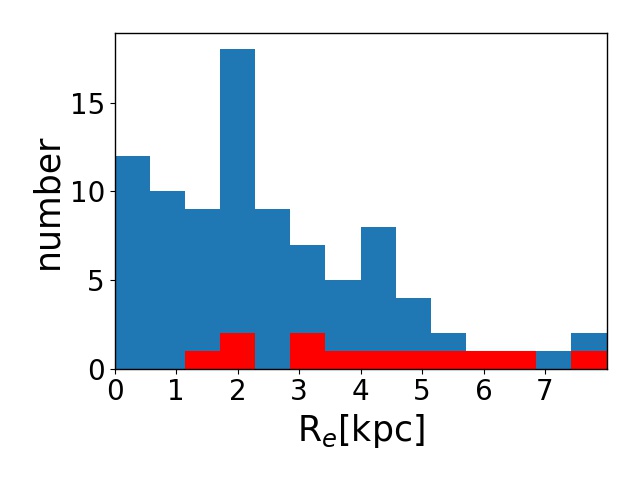
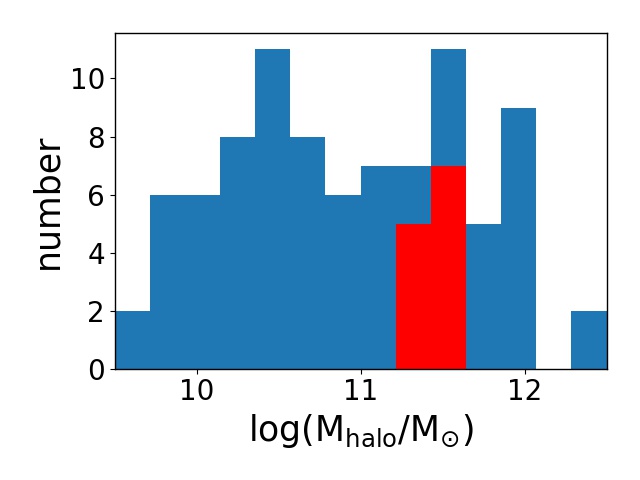
For this work, we specifically select 12 galaxies within a narrow stellar mass range, M⋆/<, in order to exclude possible mass-dependent effects on our results. Although having a very similar M⋆, this set of 12 simulated galaxies show an extreme variation in their effective radii, with the largest object having Re8 kpc and the less extended ones Re1.5 kpc. This is shown explicitly in Fig. 1, in which, from left to right, the stellar mass, effective radius and halo mass of our selected sample (red histograms) against the full sample of NIHAO galaxies (blue histograms), is shown.
In Fig. 2 we demonstrate that the effective radius is a good proxy for the effective surface brightness, given the definition = L/2R, in which L is the luminosity of the galaxy in the desired band. Through this paper, we will work in V-band. No dust attenuation is considered. Fig. 2 also demonstrates that several of this suite of simulated galaxies are within the LSB regime. Although a strict definition of minimum required to be classified as LSB does not exist, we observe that the vast majority of the LSB from the Impey & Bothun (1997) sample has a central surface brightness, in V-band, of 22.0-25.0 mag/arcsec2: we treat our galaxies as a continuum from HSB to LSB, and pay special attention to the lowest surface brightness objects with mag/arcsec2.


2.3 Comparison with observational data
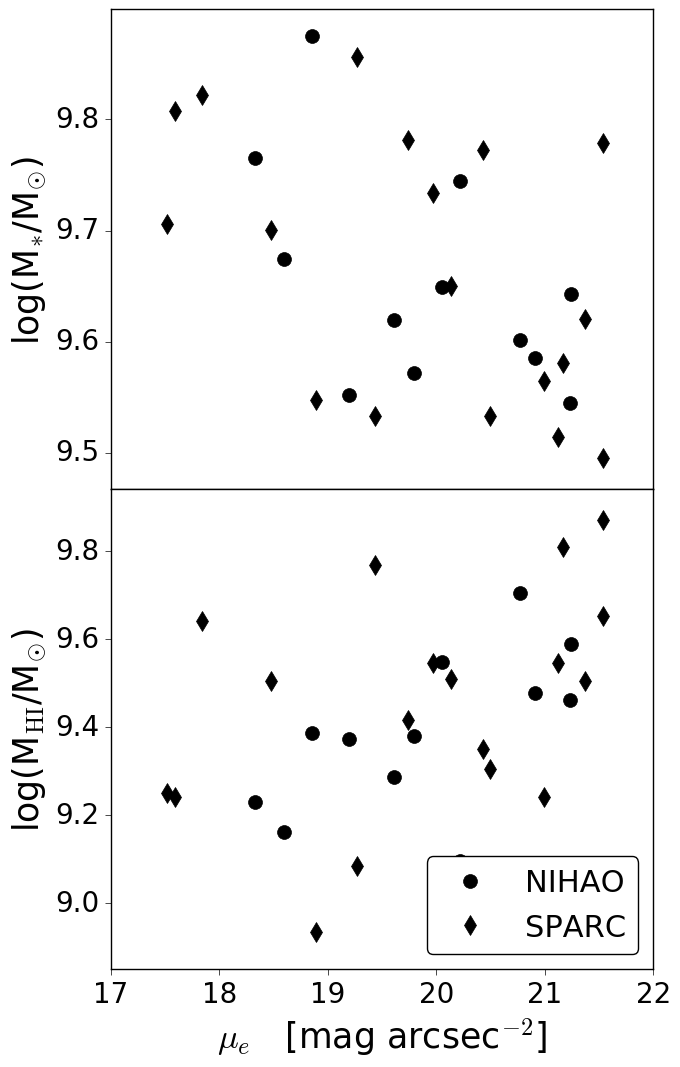
We firstly check that our simulated galaxies match the properties of the observed ones within a similar mass range. To this aim, we compare to galaxies form the SPARC (Spitzer Photometry and Accurate RCs) data set (Lelli et al., 2016). SPARC is a sample of 175 nearby galaxies with homogeneous Spitzer photometry at 3.6m and high-quality rotation curve data from previous HI/H studies. Though not a complete sample, it is representative of disc galaxies spanning a very wide range in surface brightnesses and luminosities, therefore ideal for our comparison.
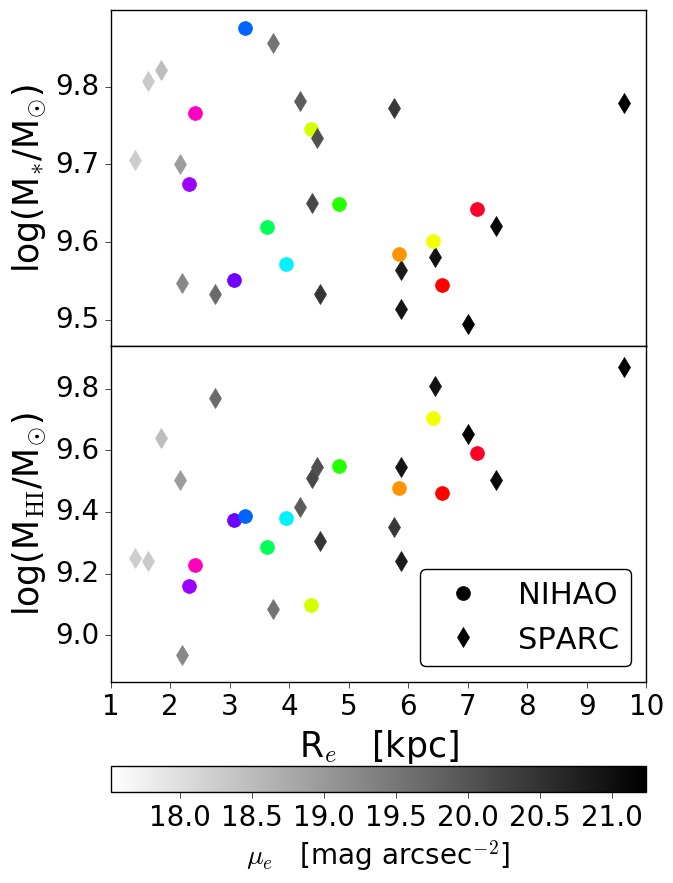
We select observed galaxies within the same M⋆ range as our selected simulated galaxies: within this mass range, the SPARC dataset contains both high and low-surface brightness objects, just like our simulations do. We show a comparison of NIHAO and SPARC data in Fig. 3: the top panel shows M⋆ vs Re while in the bottom MHI vs Re is represented. Amongst our available bands for analysing the simulations, the K-band is the closest match to the 3.6m Spitzer-IRAC: we therefore use this band to compare the effective radii of NIHAO and SPARC datasets. NIHAO galaxies are shown as circles and colour-coded as in Fig. 2, based on in V-band333We verified that the computed in K-band for NIHAO galaxies provides similar values as the ones observed in SPARC, i.e. 18-22 mag/arcsec2, and we showed this in Appendix A., while SPARC data are shown as diamonds and grey-shaded according to their at 3.6m. For SPARC, the stellar masses are computed assuming a constant stellar mass-to-light ratio of M/L[3.6]=0.5, which is consistent with a Chabrier (2003) initial mass function. In NIHAO, the neutral hydrogen mass fraction is computed using the post-processing methods from Rahmati et al. (2013) that account for the effects of self-shielding and radiation from local star forming regions (see Gutcke et al. 2016 for details).
A very good match between the observational and the simulated dataset can be appreciated in Fig. 3. The overlap in Re, M⋆, MHI and is quite remarkable, despite the narrow mass range selected: galaxies with a low have on average larger HI gas fractions, the sizes covered by our simulated NIHAO sample is in close agreement with the reported sizes of SPARC objects, and both sample span a range of 4 order of magnitudes in , from LSB to HSB. Interestingly, in this stellar mass range NIHAO can reproduce very well the full observed range of sizes, producing both compact as well as large objects, unlike in lower M⋆ ranges, where most of the present day simulations preferentially reproduce diffuse, large galaxies (e.g. Di Cintio et al., 2017; Chan et al., 2018; Jiang et al., 2018), but struggle at making more compact objects. Given the similar trends observed in SPARC and NIHAO within the range M⋆=109.5-9.9M⊙, we are confident that we are using a suitable simulation set for our study.
3 Properties of the sample
Some relevant properties of the 12 selected simulated galaxies are presented in this section.
3.1 Surface brightness profiles
The surface brightness profiles of the simulated galaxies are explicitly shown in Fig. 4, together with the results of performing a Sérsic fit between 0 and 2Re. As in previous figures, the galaxies are colour coded by their at =0. We firstly note that LSB galaxies in our sample tend to have a relatively flat central surface brightness profile, with a central value as low as 23 mag/arcsec2, while higher surface brightness objects show a peak in their central , indicative of the presence of a bulge. An exception to this is represented by the lowest galaxy, shown in red, which has an increase in its within the inner 2 kpc indicating that simulated LSB galaxies can form small bulges (the central is nevertheless lower than any HSB object in our sample).
The extent of the stellar discs can also be derived from this figure: at a fixed of 26 mag/arcsec2, for instance, LSBs reach a radius 10 kpc, while the stars of HSB galaxies are confined within 6-8 kpc. The Sérsic index ns of LSBs is, on average, less than one, while HSBs have a mean of ns1.
3.2 Photometric images
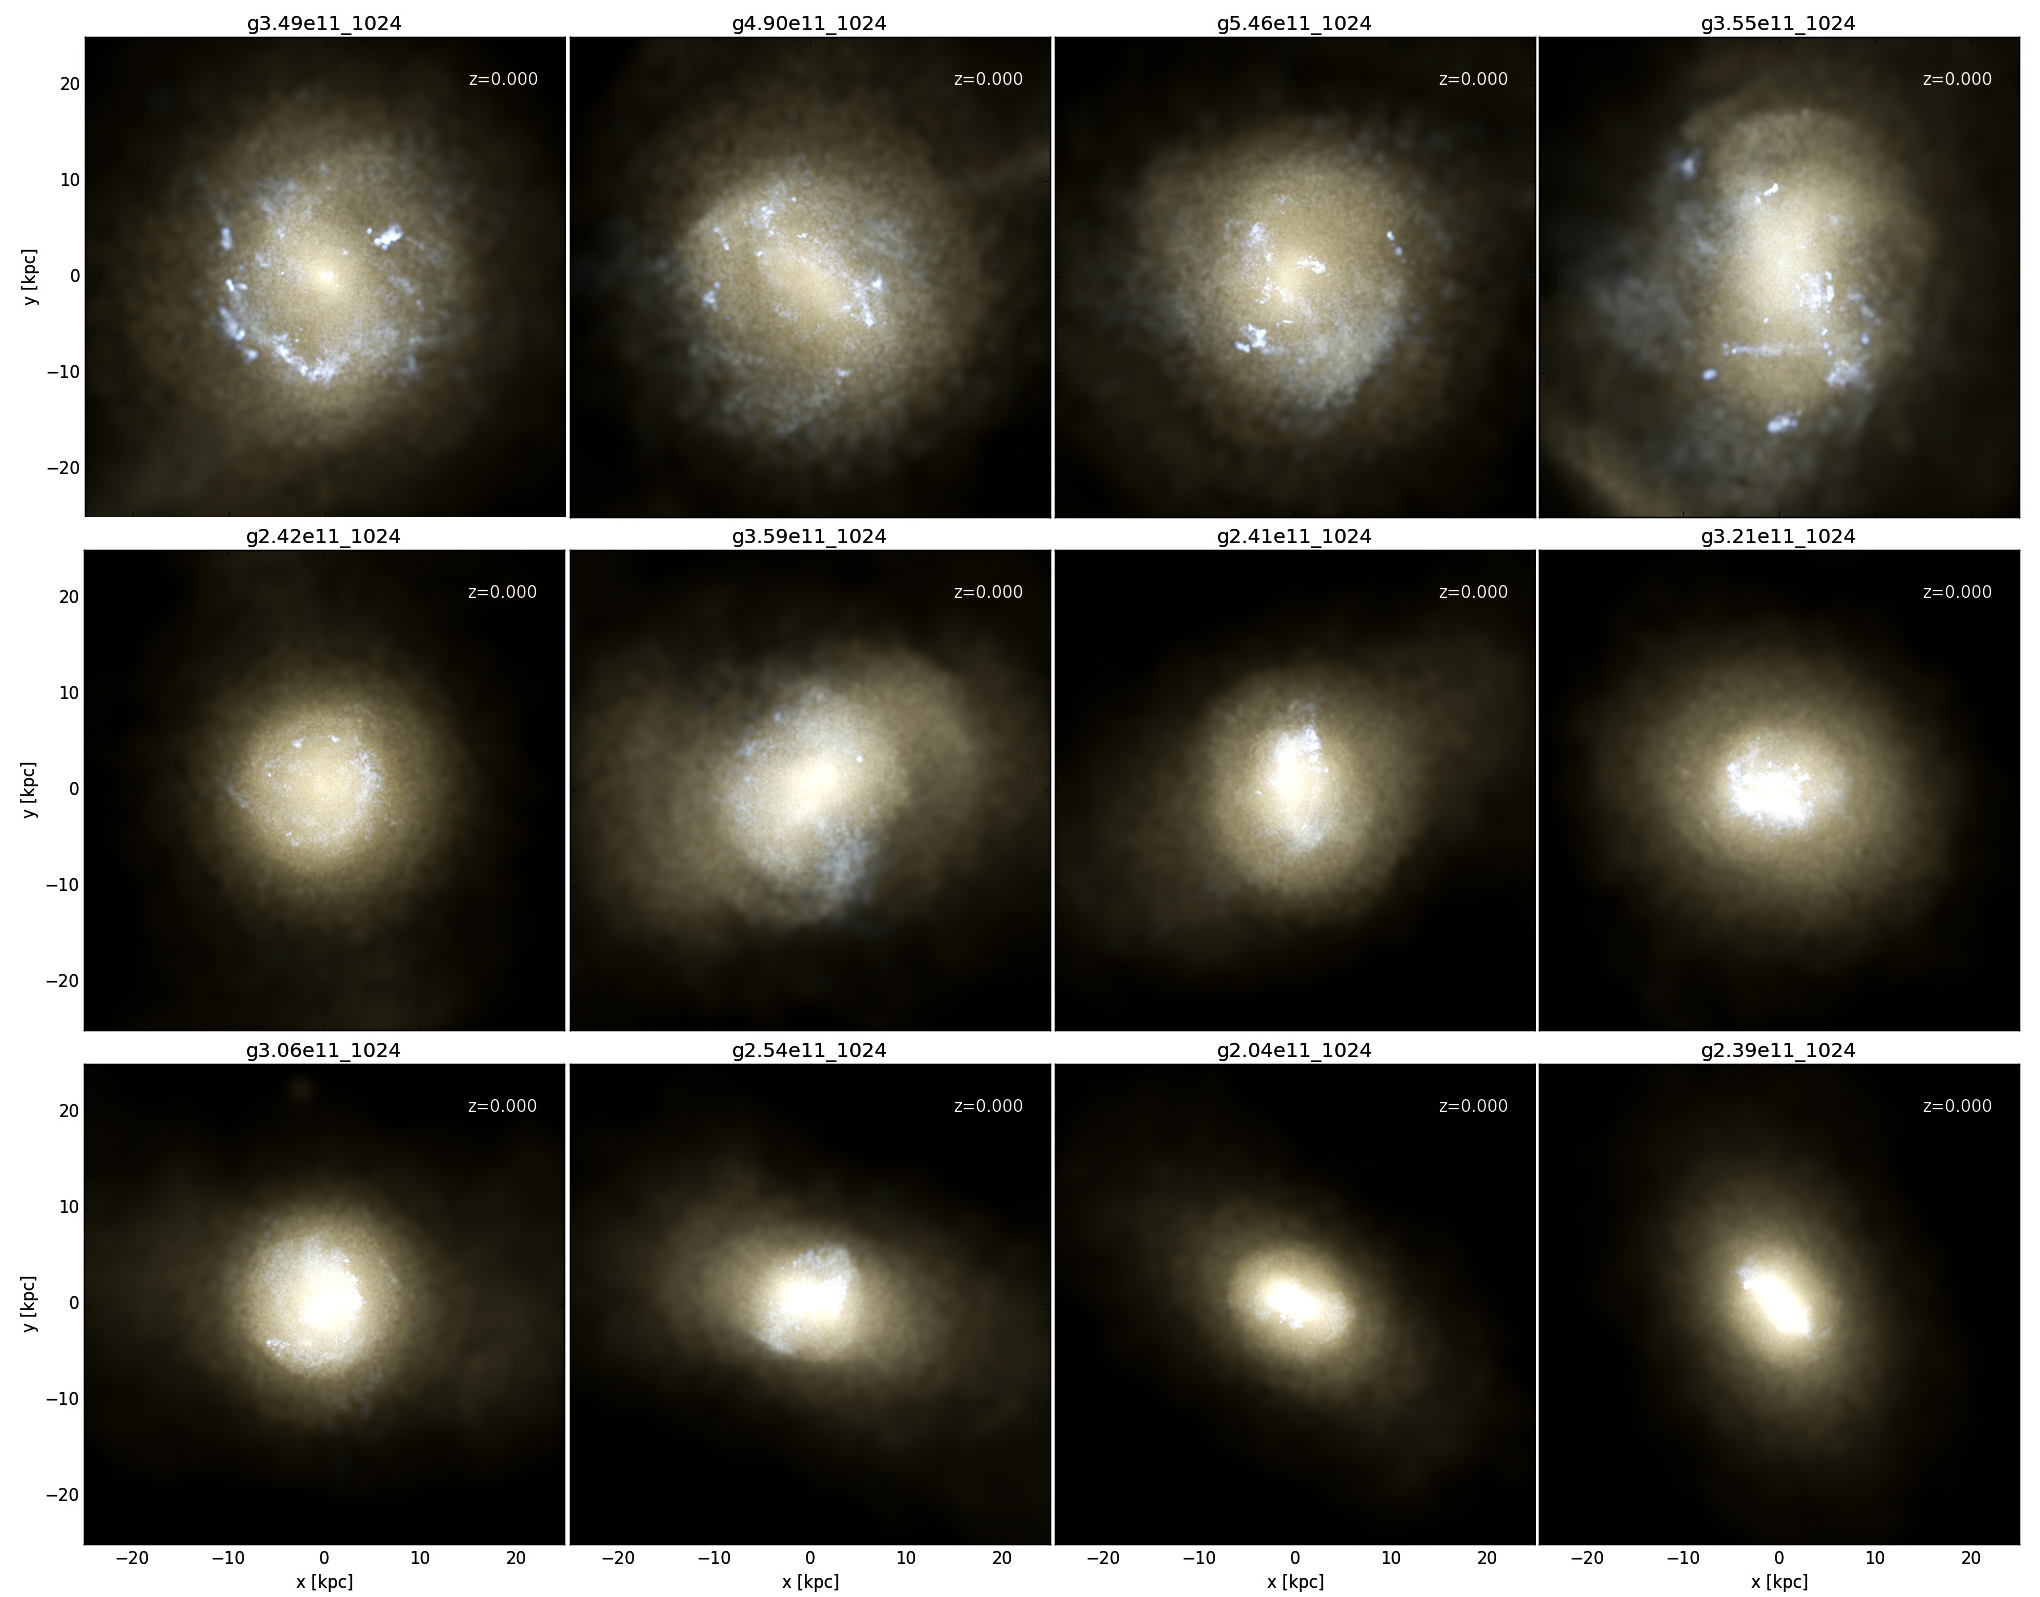
Fig. 5 shows IVU-bands images of stars at =0, for each galaxy inclined face-on, and ordered from the lowest surface brightness (top left) to the highest one (bottom right). What appears immediately clear is the morphological dependence on surface brightness: galaxies with a low show more extended stellar discs, small or no central bulges, and on-going star formation in the outskirts of the disc, while galaxies with increasingly high have less extended discs, a conspicuous central stellar bulge, and recent star formation mostly confined within the central few kpc.
3.3 Rotation curves
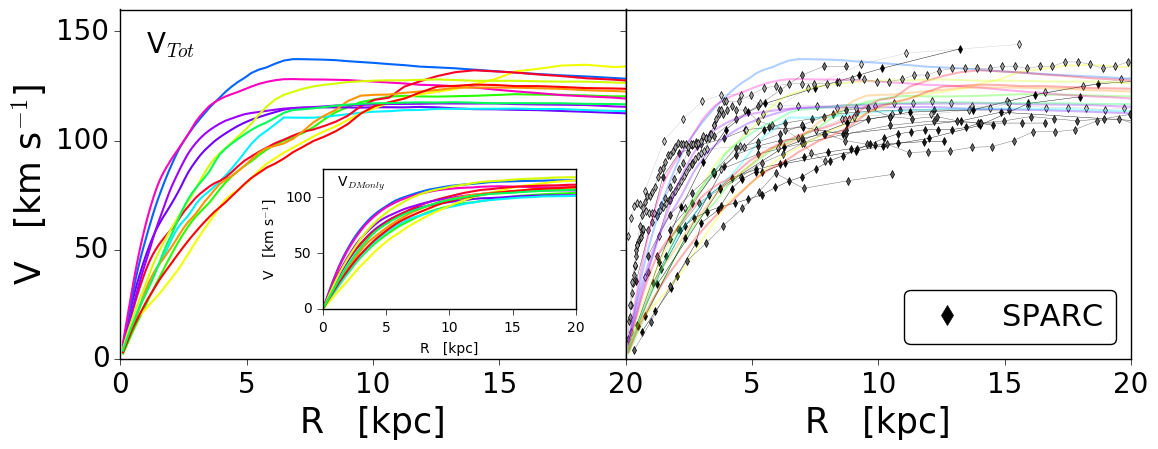
In this section we analyze the circular velocities Vcirc of simulated galaxies within our selected mass range, and compare them with the HI/H rotation velocities from the SPARC dataset (Lelli et al., 2016). SPARC RCs have been corrected for beam smearing, inclination and pressure support. In the observational sample, we apply the same selection cut as in the simulations, with M⋆ between 109.5-9.9M⊙. In Fig. 6, left panel, we show the total circular velocity of the 12 selected NIHAO galaxies, while the insert shows their DM-only rotation curves, colour coded by their as in previous figures, and out to a radius of 20 kpc, to highlight any difference in the inner region. As perhaps expected, LSBs show the most shallow total rotation curves, whilst HSB galaxies show clear signs of a centrally compact, baryonic dominated region within their inner radii, compatible with the morphology and surface brightness profiles explored in Section 3.2 and Section 3.1. On the contrary, the DM-only Vcirc are quite similar amongst galaxies with different surface brightnesses: this suggests that differences in are not to be attributed to differences in the DM distribution within galaxies, but rather to how the baryons are distributed in these objects (this aspect will be discussed later in Section 4.1).
That LSB galaxies generally have a slowly rising rotation velocity has been shown in several observational works (e.g. de Blok et al., 1996; de Blok et al., 2001; McGaugh et al., 2001; Katz et al., 2017). In Fig. 6, right panel, we explicitly show the comparison between observed and simulated rotation curves, indicating observations from the SPARC dataset as diamonds, with each observed rotation curve grey-shaded by its as in Fig. 3: in black the lowest surface brightness galaxies, in light grey the HSB ones. Just as in the case of the NIHAO simulations, the SPARC sample shows slowly rising rotation curves for LSB objects, while centrally steep velocities for higher surface brightness galaxies (see also Santos-Santos et al. 2018).
3.4 Star formation histories
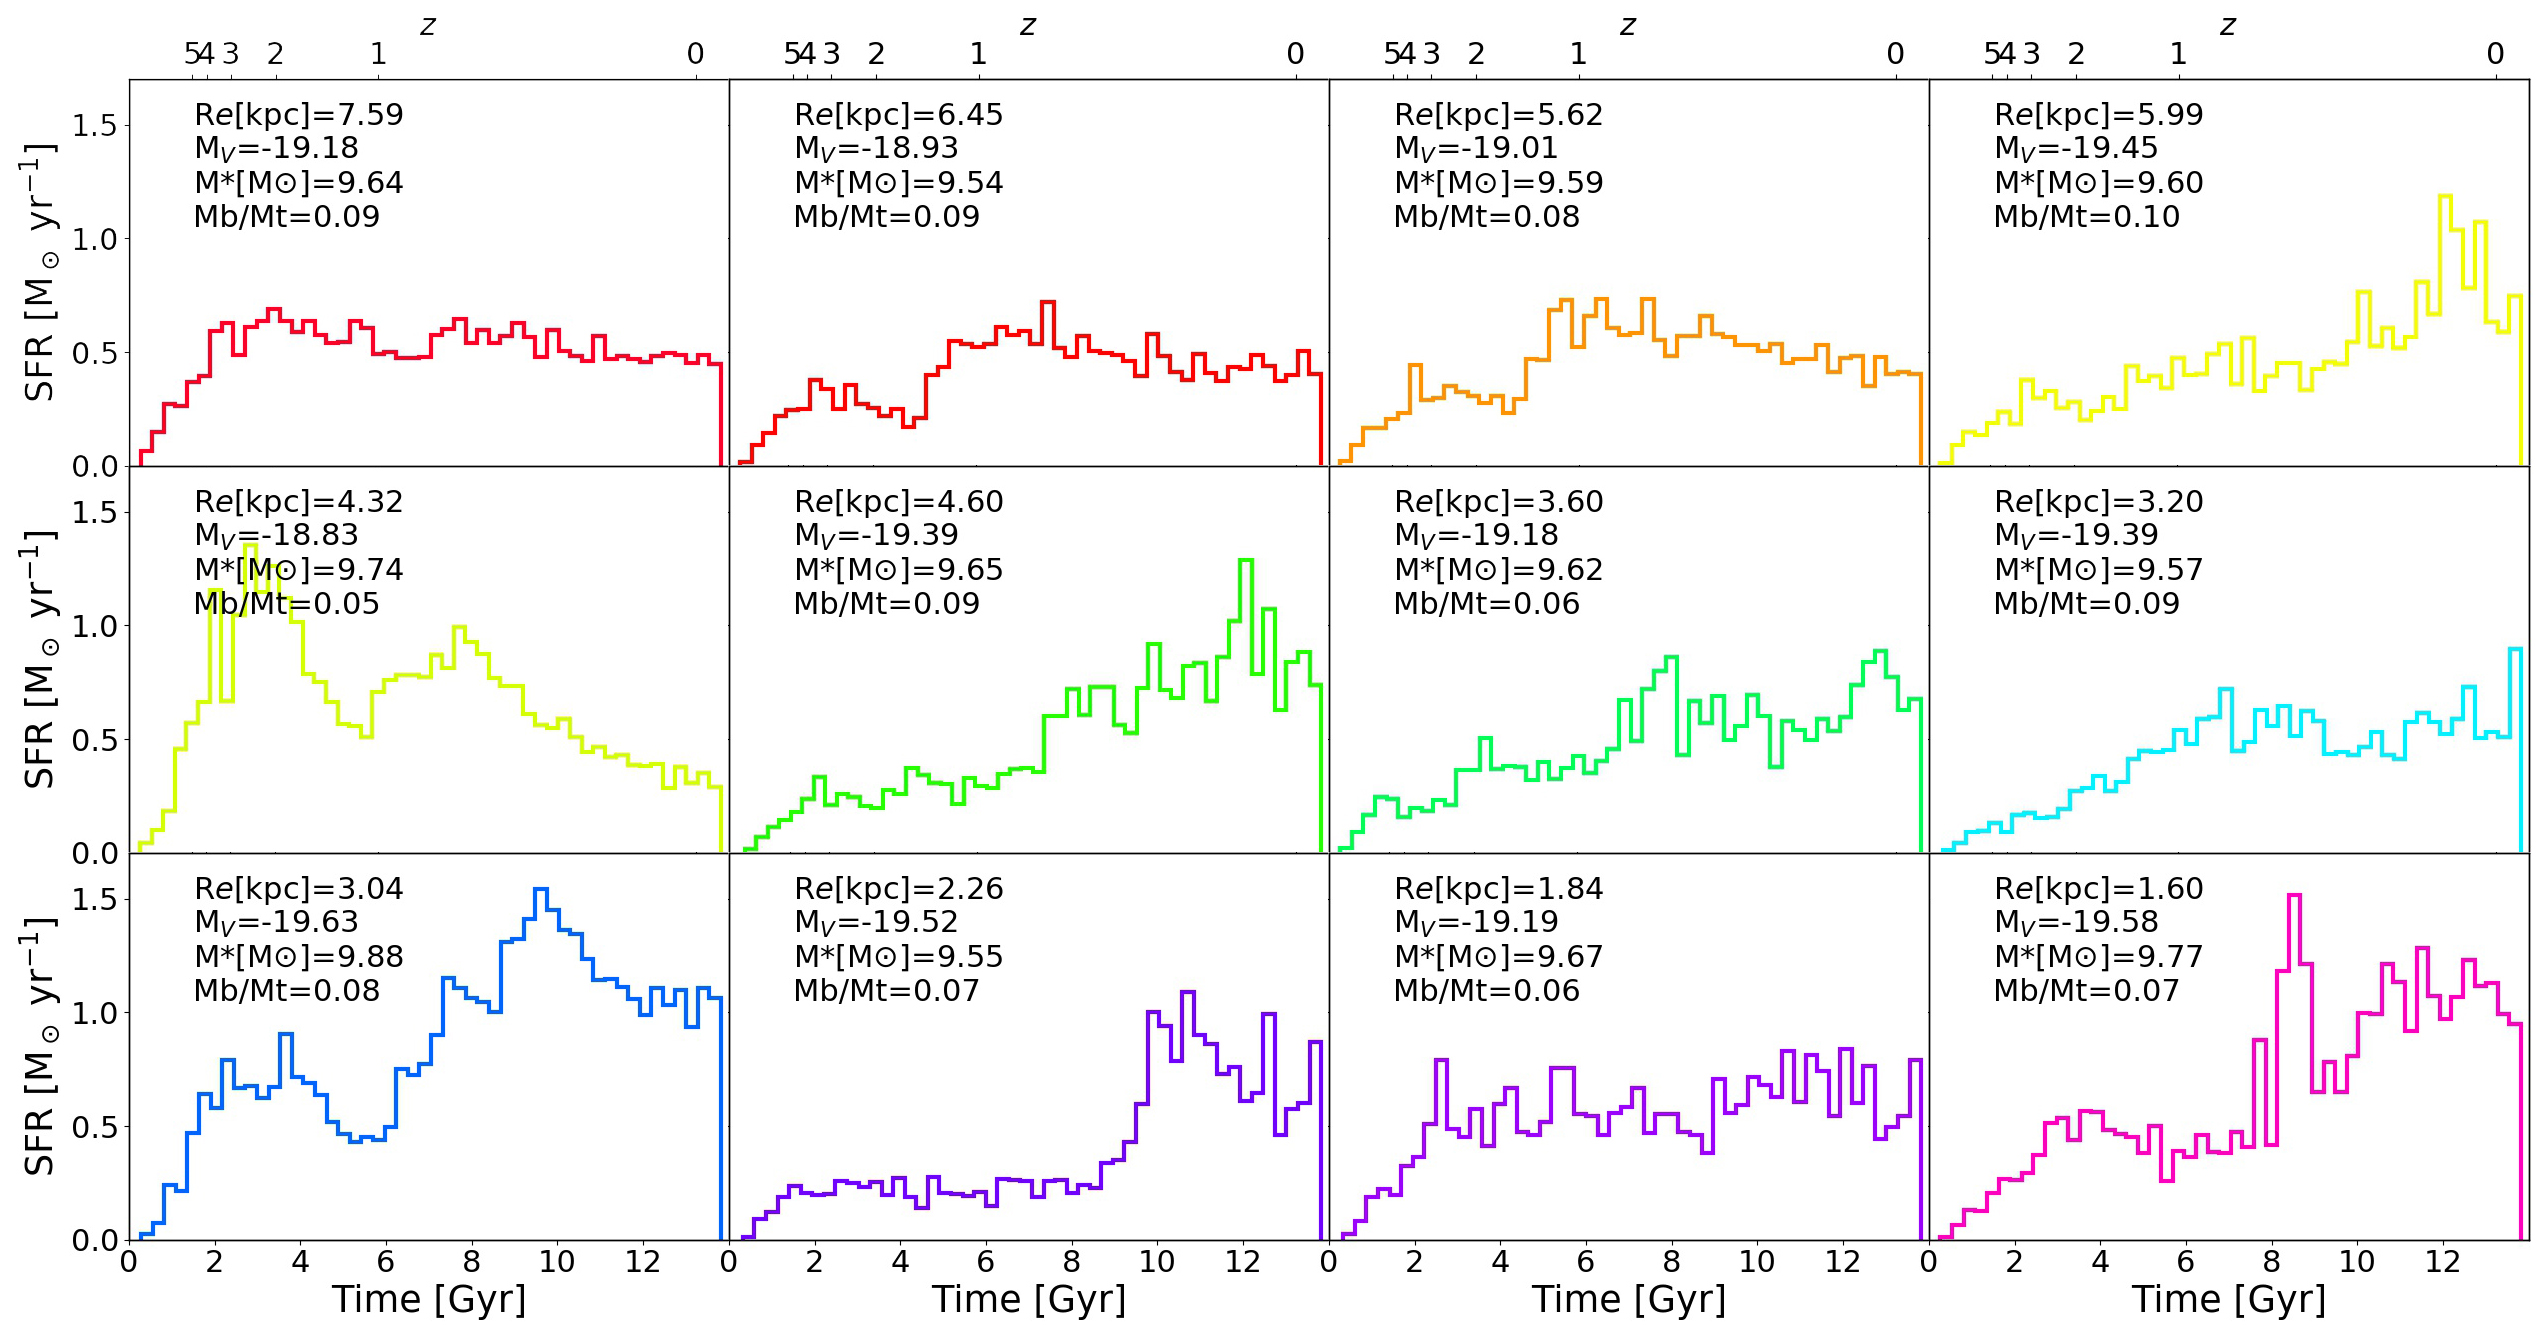
A close look to the SFHs of the simulated galaxies, ordered by their , is shown in Fig. 7. In each panel we highlight the Re, MV, stellar mass and baryon fraction at =0. It is interesting to note how the effective surface brightness does not correlate with the shape or extent of the SFHs: galaxies with very similar SFHs can end up being low or high objects. Similarly, we do not find any evident correlation between Re (or ) and the baryon fraction at =0.
This finding is crucial since it starts unveiling which processes are important in the formation of LSBs: if, as in the model proposed by Di Cintio et al. (2017) to explain lower M⋆ UDGs, the formation mechanism of LSBs would be mostly due to SNae feedback driven gas outflows that are able to modify both the central DM density and create extended stellar distribution, we should observe a clear signature of this effect in the SFHs of LSBs vs HSBs, the former having a more bursty and extended SFH than the latter. This signature of feedback-driven core creation has also been recently reported in observations of dwarf’s SFHs (Read et al., 2019) (see also Ruiz-Lara et al. 2018 for an attempt in UDGs). Moreover, larger galaxies should retain a higher baryon fraction than galaxies of similar M⋆, but with lower Re, since it is precisely the high amount of gas the element required to create potential fluctuations.
None of these correlations are observed in our sample of simulated galaxies with M⋆M⊙.


4 The formation mechanism of LSBs
4.1 Dark matter profiles
Motivated by our previous work on UDGs, and in order to verify whether LSBs share the same formation mechanism as their dwarfs counterpart, we plot the central DM slope, calculated by fitting a single power law between 1 and 2 of their respective virial radii, versus effective surface brightness at =0, in Fig. 8, left panel. We did not find any straightforward correlation, the majority of these galaxies having an expanded halo with inner slope of 0.4-0.8, in agreement with predictions from Di Cintio et al. (2014a, b); Tollet et al. (2016) for the expected DM profile of galaxies of such stellar mass (or, precisely, of such value of M⋆/Mhalo0.01-0.03). Indeed, they lie in the vs M⋆-Mhalo region in which DM haloes are still slightly expanded, but not at the peak of core formation, which instead happens for smaller objects of M⋆107-9M⊙, coinciding with the masses of UDGs.
The lack of a strong correlation between and corroborates our finding of Section 3.4 that feedback-driven gas outflows are not the primary driver of the formation of galaxies as large as 8 kpc, and thus can not be the only responsible for the emergence of LSBs.
4.2 Concentration and spin of DM haloes
We proceed to explore other possibilities in order to explain the emergence of LSBs in our simulations. One of the formation mechanism suggested for UDGs is the high-spin one, in which UDGs naturally form in the tail of the distribution of high spin DM haloes (Amorisco & Loeb, 2016). Although we did not find any correlation between halo spin and sizes in our simulations when studying small UDG galaxies, we wish to now verify that this finding holds true also for larger LSBs. In Fig. 8, central panel, we plot the =0 vs DM halo spin, defined as (Bullock et al., 2001), where is the total angular momentum of a sphere of radius containing mass and with circular velocity : surprisingly, unlike in the case of UDGs, we do find a tight correlation between the final surface brightness of LSBs and the DM halo spin from the corresponding DM only simulation-run. This finding indicates the importance of angular momentum in forming large LSBs, and also highlights once more how UDGs and LSBs seem to have different mechanisms of creation in our simulations.
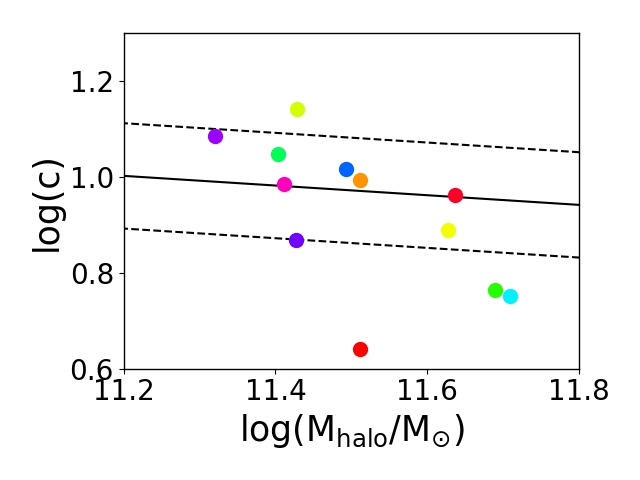
At last, we verify in Fig. 8, right panel, whether LSBs tend to form in particularly low concentration haloes. To do so, we used the DM-only simulated counterpart of our hydrodynamical galaxies, so excluding the effects of baryons on the DM. We did not find any evident correlation between and halo concentration. In Fig. 8, right panel, the colour scheme represents the , just like in previous figures, while the solid and dashed lines are the - relation in a Planck cosmology and its 1 scatter, respectively (Dutton & Macciò, 2014). Most of the galaxies studied here lie within the 1 of the - relation, and no trend is found to support the hypothesis that LSBs live in underdense haloes, compared to HSBs.
4.3 Evolution of with time and correlation with mass accretion history
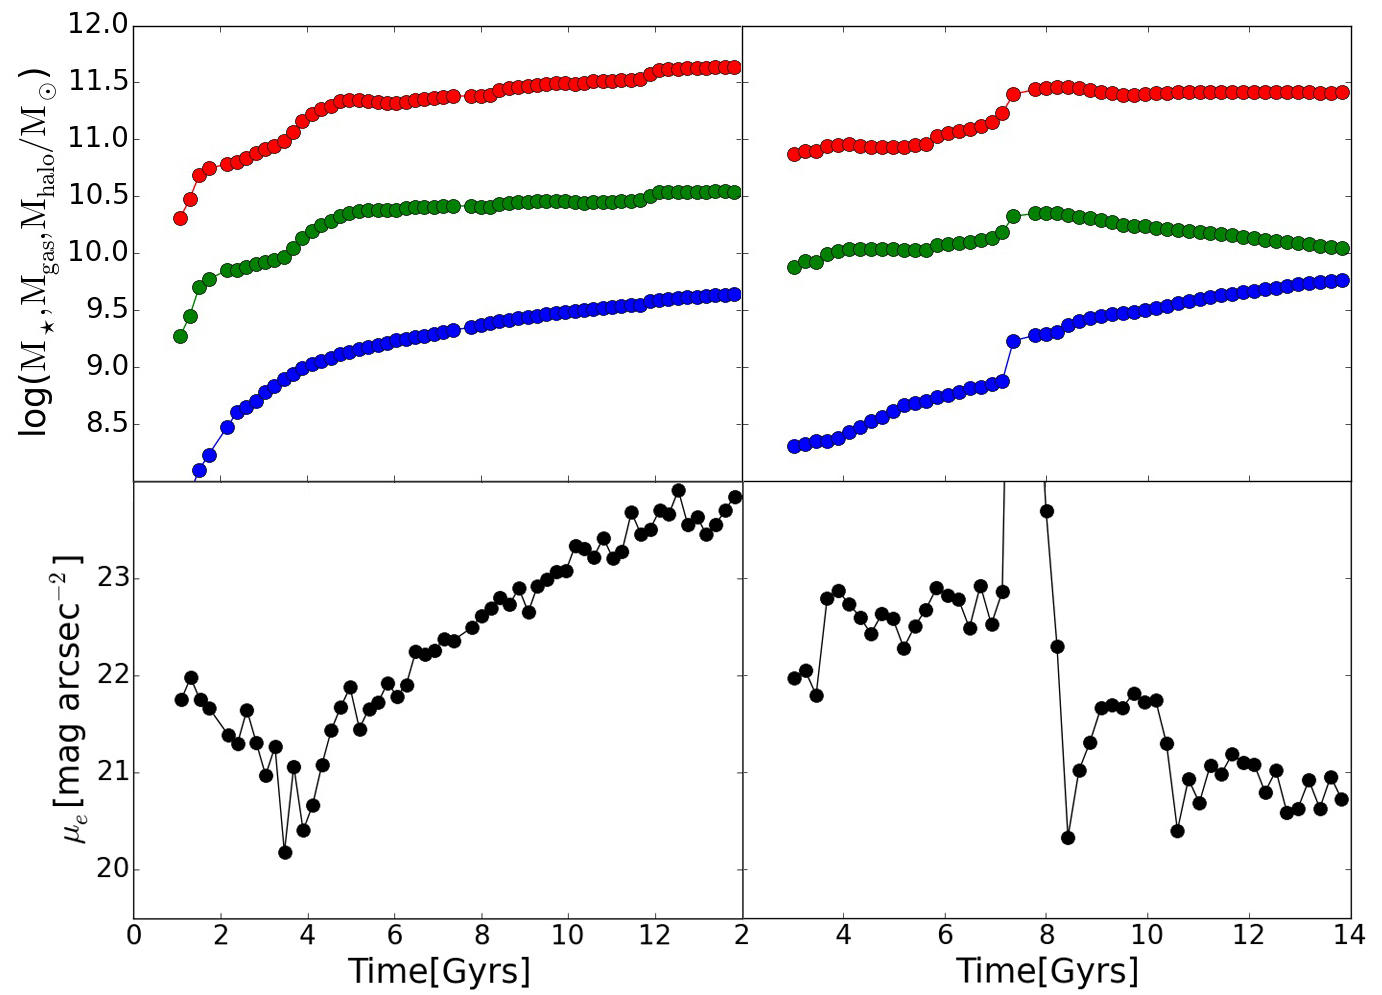
We proceed at examining the temporal evolution of the , together with the mass accretion history of the lowest and highest surface brightness galaxies in our sample. In the top panels of Fig. 9 we show the halo, gas and stellar mass versus time (in red, green and blue respectively), while the effective surface brightness vs time in shown in the bottom panels; the LSB is shown on the left side, while the HSB on the right side.
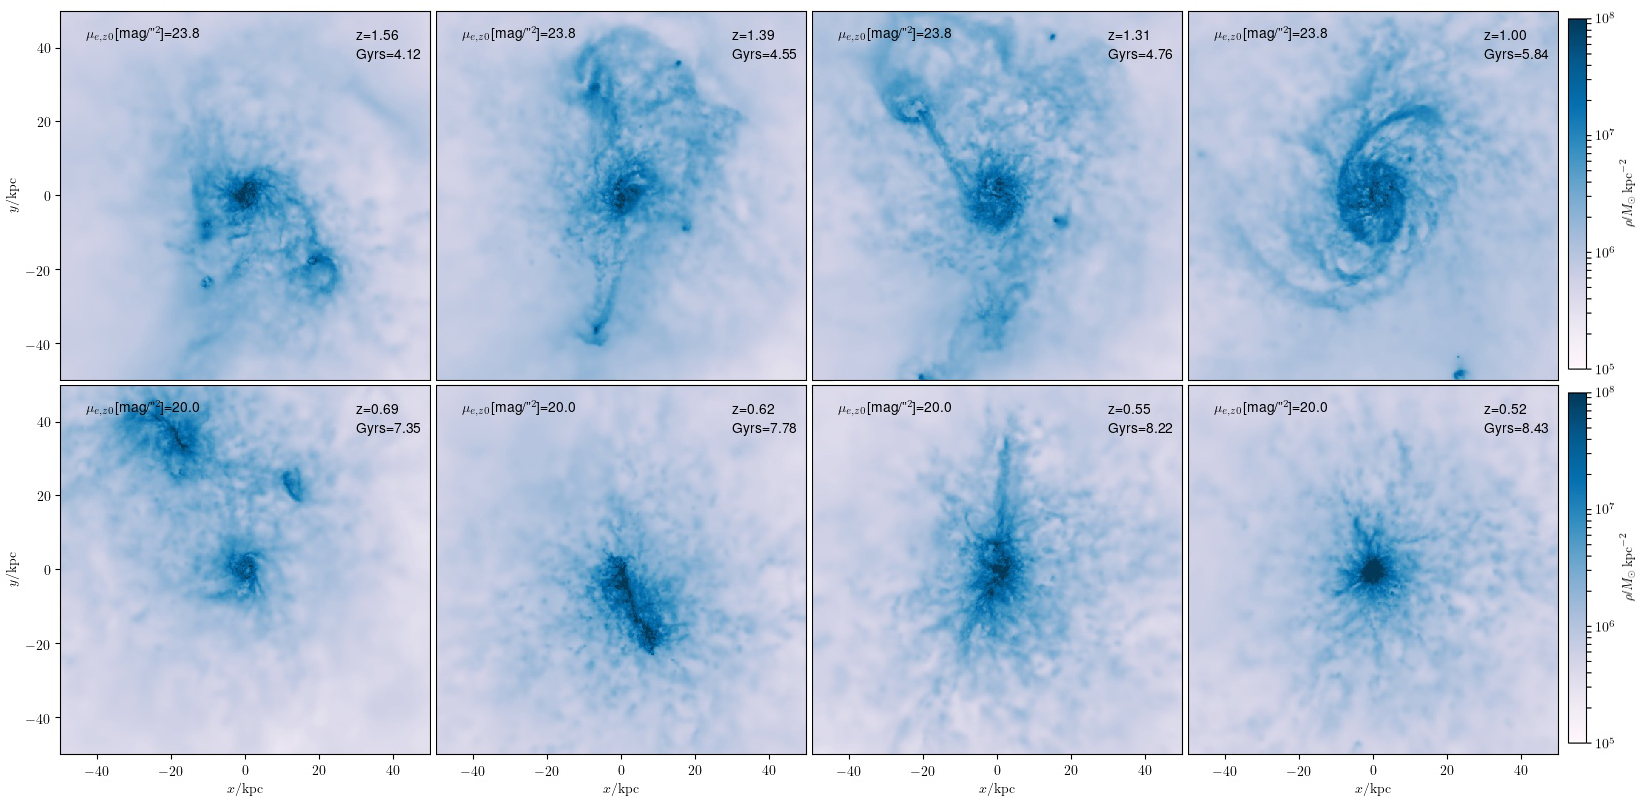
By inspecting the mass accretion history of the simulated LSB galaxy we can see a clear merger event at t3.5 Gyrs, in correspondence of which we observe an unequivocal decrease in surface brightness, moving from a value of 20.3 at t=3.5 Gyrs to 22 just after the merger, and finally reaching 24 by =0. In this particular case, the merger ratio between merging and primary galaxy is of the order of 20. Similarly, we can observe a merger at t7 Gyrs for the simulated HSB galaxy, with a merger ratio of about 60: unlike the LSB case, however, this galaxy starts increasing dramatically its surface brightness just after merger time, moving from an average of 22.6 within the first few Gyrs, to 21.6 just after the merger, to finally reach the HSB value of 20 that we observe today 444Note that the instantaneous decrease in at merger time is an artifact of the halo finder algorithm, that it is unable to differentiate the two galactic discs when they are too close to each other and about to merge.. Note that the larger the merger, the easier it is to identify by the sudden increase in the star formation rate just after merger time, see the corresponding SFHs in Fig. 7. The same LSB and HSB galaxies are shown in Fig. 13 in gas density evolution space.
Mergers thus seem to play a fundamental role in shaping the final surface brightness of galaxies, but while some of them are able to decrease the , others seem to act in the opposite way, causing an increase in . In the HSB case the SF rate is boosted just after the merger, and correspondingly the available gas is consumed, while in the LSB case the SFH and gas consumption proceed more gradually (see also Springel & Hernquist 2005, who found how during some gas-rich mergers not all the gas is necessarily rapidly consumed). In the next subsection, we aim to identify the mergers parameters and configurations that generate LSBs or HSBs, respectively.
4.4 The redshift of last major merger
It appears clear, by looking at Fig. 9, that we should focus on the mass accretion history of our sample galaxies: the importance of mergers in producing a variation in seems a crucial point to explore. Not all mergers, however, seem to be associated with a decrease in , as already mentioned in the previous section. Here, we will explore in detail the role of mergers in shaping the final surface brightness of simulated galaxies.
To this aim, we firstly identify the galaxies’ merger histories, by tracking each galaxy back in time: we consider as merging object the most massive structure that was entering within the virial radius of the primary galaxy at a certain time. We define the merger time as the time at which such structure was lastly found as isolated object (i.e. not yet a satellite of the main halo) by the halo finder algorithm. We used different merger ratio thresholds, with a minimum ratio of MMprim0.1, in which Mmerg and Mprim are the total mass of the merging and of the primary galaxy, at the last snapshot before infall. Moreover, we only consider mergers that happened after =2.5, since only a few snapshots are available before that time with the protogalaxy - and eventual merging structures - still containing a limited amount of particles. This is reasonable, considering that the vast majority of stars are born after this time in all cases.
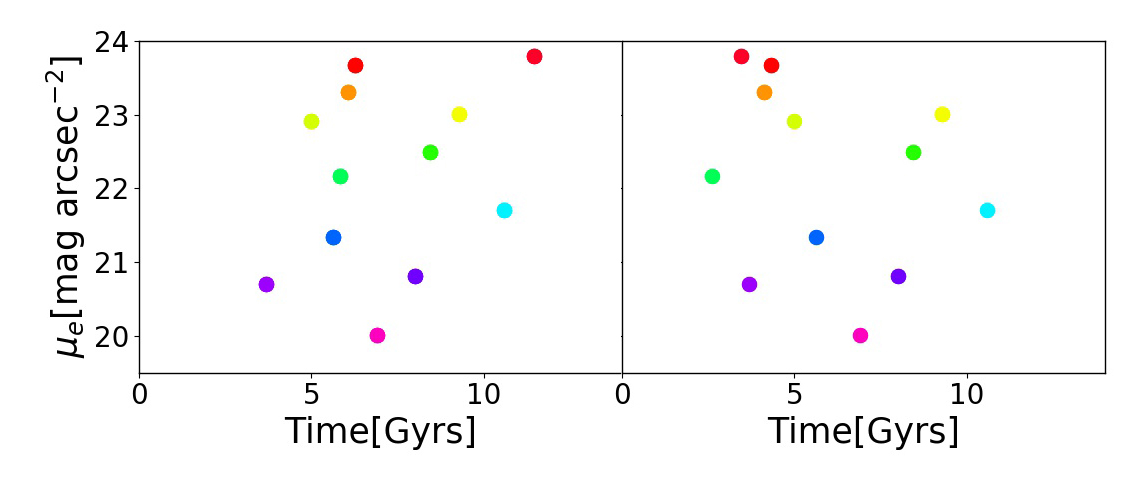
We firstly study the influence of the time of mergers of different sizes in producing higher or lower galaxies. No correlation between the redshift of last merger and the at =0 is found, as shown in Fig. 10, left panel, for a merger ratio of 0.1; we verify that this result holds true for several other merger ratios, between 0.05 and 0.6, though not shown here.
Additionally, we studied the time of the largest mergers since =2.5, without imposing a fixed merger ratio, such that each galaxy is now associated with its own largest merger with ratio of at least 10. Have galaxies with a low undergone preferentially through a late or early largest merger? We found a large variation in the strength of largest mergers, with sizes between 16 and 75. In the right panel of Fig. 10 we show the =0 vs time of largest merger for each galaxy: we do not observe any trend between the two quantities. In the next subsection, we investigate the structural parameters of the mergers.
4.5 The role of orbital alignment at merger time
Given that the time of mergers does not seem to play a role in determining the final of our galaxies, it is reasonable to assume that some particular merger orientation could be important. If certain mergers configurations are able to add angular momentum to the primary galaxy and, as a result, decrease its , we should find a signature of this by studying the orbital configuration of each primary-merging pair at merger time.
To determine the merger orientation, we define the angle which refers to the alignment of the orbit of the merging galaxy with respect to the primary galaxy, as:
| (1) |
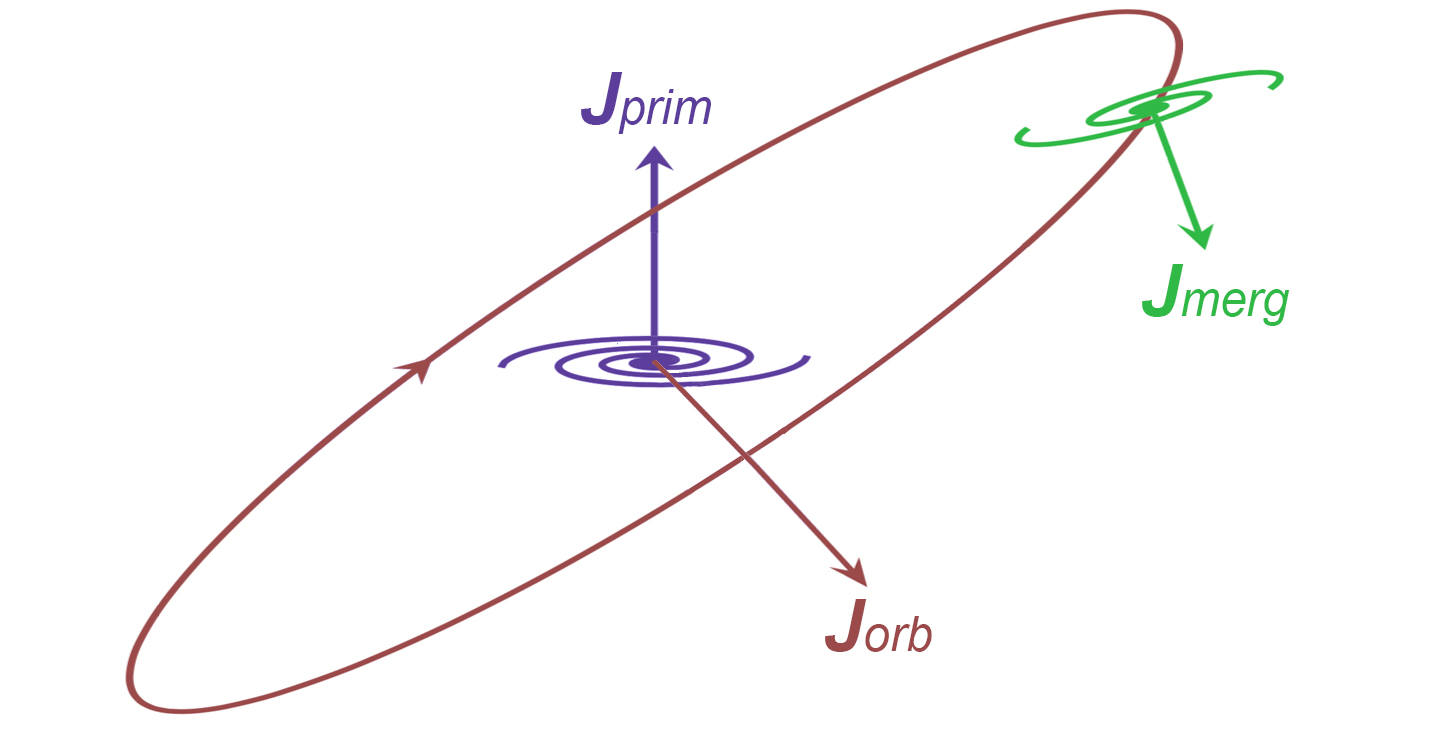
Here, is the angular momentum vector of the gas of the primary galaxy, while is the angular momentum of the orbit of the merging galaxy relatively to the primary one, with and being the position and velocity of the merging galaxy in the reference system of the main one. The vectors are all normalized and calculated at the last snapshot before merger. A schematic view of the orbital angular momentum during merger it is shown in Fig. 11.
We define the orbital orientation of the merger to be co-planar and co-rotating if the angle is , perpendicular if and co-planar counter-rotating if .
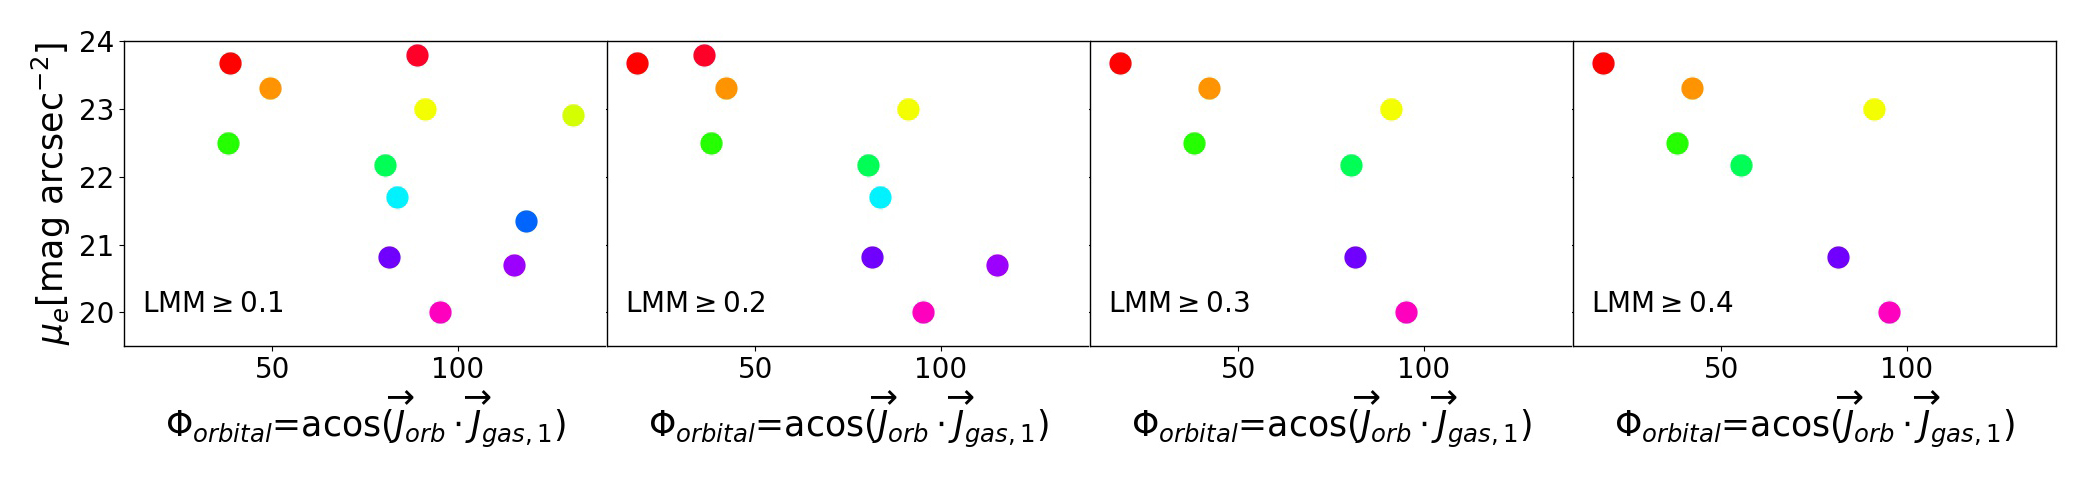
In Fig. 12 we show the correlation between the final =0 and at merger time, for different merger sizes: from left to right we show, respectively, a last major merger with size ratio of 10-20-30 and 40. That is, each point represents the orbital alignment at the latest time during which the galaxy underwent a merger of 10-20-30 or 40.
While for a low merger ratio (10) we observe little to no correlation between and , the dependence of final surface brightness from orbital angle at merger time becomes stronger as we move towards larger merger ratios: already at MMprim0.2 we observe a clear trend such that the lowest galaxies have undergone through a co-planar co-rotating merger (60), while the highest objects have experienced a perpendicular merger (60120)555We performed an extra test by defining the angle between the angular momenta of the primary and of the merging galaxy, irrespective of their orbital configuration, but we did not observe any correlation with . This demonstrate that the alignment of is more important than the relative alignment between and ..
This can be understood in terms of angular momentum: galaxies which had co-planar mergers had their total angular momentum increased, giving rise to large Re and LSB discs. Oppositely, a perpendicular merger configuration impacts the disc of the primary galaxy in the opposite direction to its rotation, removing efficiently angular momentum from the existing disc and creating a HSB galaxy. In general, the larger the merger the stronger the correlation with final .
In Fig. 13 we show explicitly time frames of the gas density during and after mergers for the lowest (top row) and highest (bottom row) galaxies in our sample, i.e. the same galaxies analyzed in Fig. 9. A co-planar merger can be identified for the LSB object at t4 Gyrs, which efficiently adds angular momentum to the disc and results in a large extended galaxy with high Re and low , just after the merger; the HSB galaxy, instead, shows a clear perpendicular merger at t7.5 Gyrs that gives rise to a compact, low Re, high object. The last temporal frame of Fig. 13 strikingly shows the differences in morphology between the LSB and HSB galaxies, in terms of their gas density and spatial extent, caused by the different orbital configuration during merger.
4.6 The impact of gas alignment at high
Asides from mergers, another factor that could potentially affect the morphology of simulated galaxies, and that should be therefore investigated in the study of LSB formation, is the alignment of angular momentum of accreting gas. As shown in Sales et al. (2012), indeed, the assembly history, and more precisely the coherent alignment of the angular momentum of baryons accreting into the galaxy through cosmic time, is a crucial quantity in determining the final galactic morphology, such that discs form out of gas flowing in with similar angular momentum as the already accreted material, while spheroids form from misaligned gas accretion.
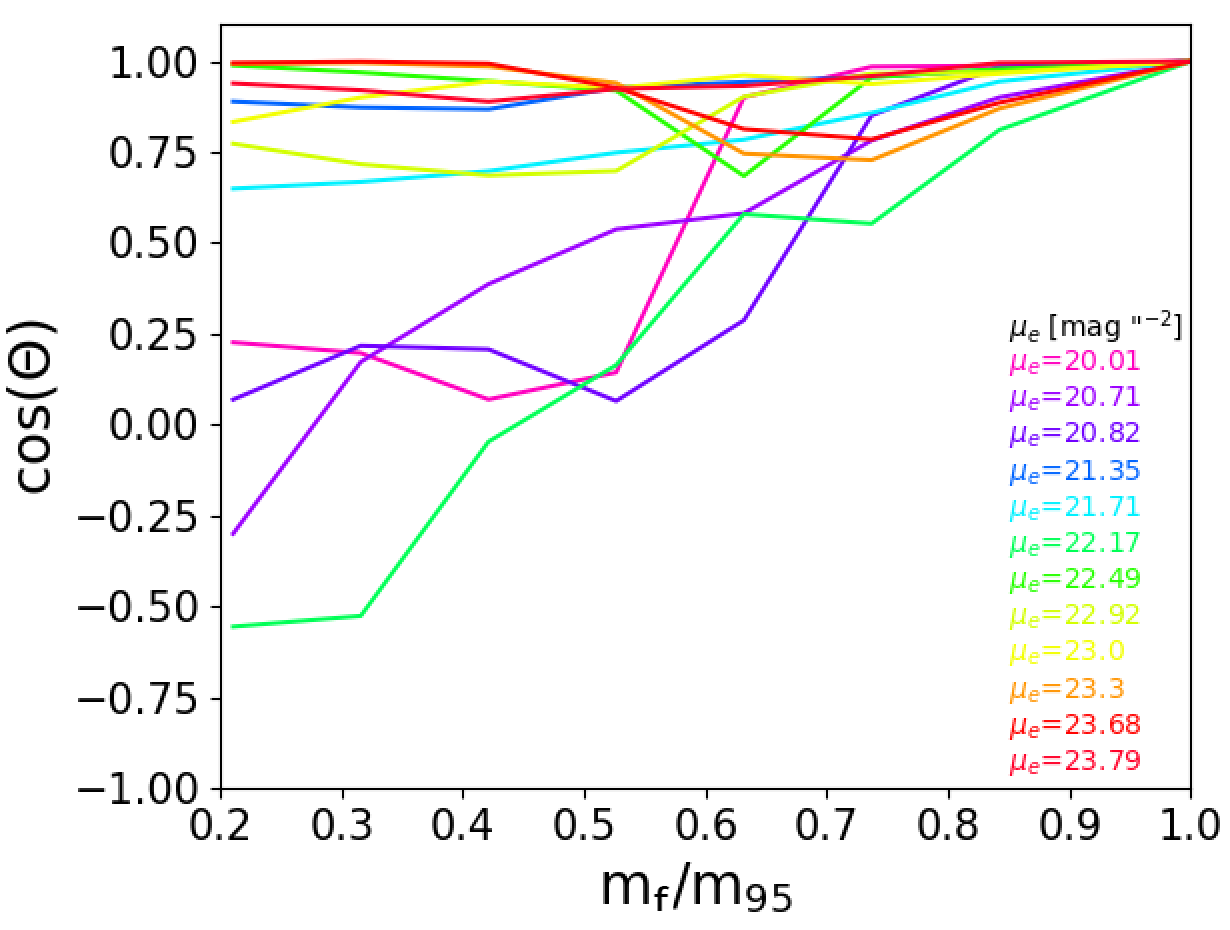
Following the analysis of Sales et al. (2012), in Fig. 14 we show the angle between the angular momentum of all the baryons that will eventually end up in the galaxy by =0, and the angular momentum of different interior subsets of such baryons, i.e. those enclosed within spheres containing a given mass fraction (mf) of such baryons: both angular momenta are measured at the time when half of the total halo (dark matter + gas + stars) mass of the galaxy was assembled, . So at , m20 represents the mass fraction of a shell within which 20 of the baryonic mass is found, whilst m95 represents the mass fraction of a shell that contains 95 of the baryonic mass. To this purpose we trace back cold gas and stars from =0 to the half-halo mass accretion time of each galaxy. The x-axis shows mf/m95, with all lines approaching unity as the enclosed baryonic mass reaches 95 of the mass that has been traced. The y-axis shows the cosine of the angle between the angular momentum vector of the baryons within the shell of mass fraction mf, and those within the shell of mass fraction m95. Lines that are close to unity for every value of mf/m95, are those galaxies whose inner and outer shells of accreting baryonic material have a well aligned angular momentum, at half-halo mass formation time. Galaxies whose accreting baryons are instead misaligned, compared to the central shells, will show up as cos() values 1. The colour scheme is the same used in all previous figures, indicating the of each galaxy.
A clear trend of LSBs having aligned angular momentum for most increasing baryonic shells can be observed; conversely, the highest galaxies show misaligned accretion of baryons at shells smaller than m95. Galaxies with a halfway values of show an in-between behaviour. This analysis demonstrates that asides form mergers, another important factor in creating LSB galaxies is the strong alignment of baryonic angular momentum that is infalling into the protogalaxy at high redshift, while misaligned, incoherent gas accretion at high results in a subsequent loss of angular momentum, producing HSBs.
The relative strength of the two processes, namely angular momentum acquired through merging galaxies and that gained through aligned inflows of gas, is difficult to assess, as some of the inflowing material into the main progenitor at high could also be part of a merger later on, and since both effects are inevitable in a hierarchical universe. Ultimately, the tidal field around a galaxy should influence both its smooth accretion as well as the orbital angular momentum of accreting galaxies (e.g. Maller et al., 2002).
5 Observational predictions
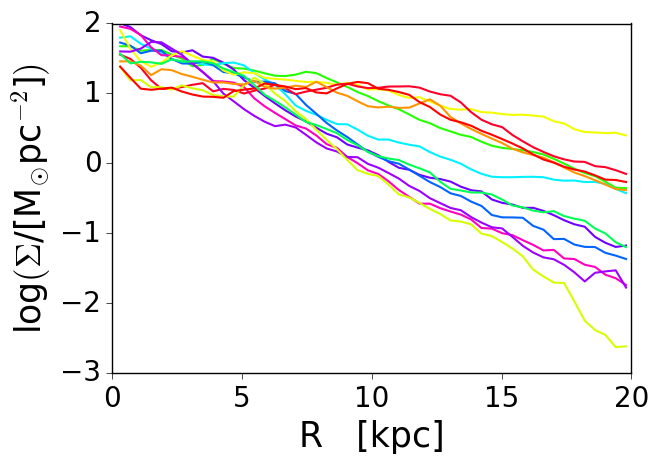
As shown in Fig. 3, LSB galaxies tend to have a larger HI gas fraction compared to HSB in the same mass range. But how is this gas distributed across the galaxy? We show this in Fig. 15, by plotting the projected HI gas surface density profile of our NIHAO sample, with the usual colour scheme: LSB have more extended and flat HI gas profile, with densities of 10M⊙/pc2 all the way to 13-15 kpc, while in HBSs the neutral gas falls below such density already at 4-5 kpc. Presumably, these differences will produce different signatures in the SFHs of low- vs high-surface brightness galaxies. Indeed, while the integrated SFHs of LSB and HSB look quite similar (Fig. 7), with mergers and accretion driving new episodes of star formation in both cases, it is reasonable to believe that there will be differences in the spatial location at which new stars are formed, given the different profiles of neutral gas in LSB/HBS, as in Fig. 15.
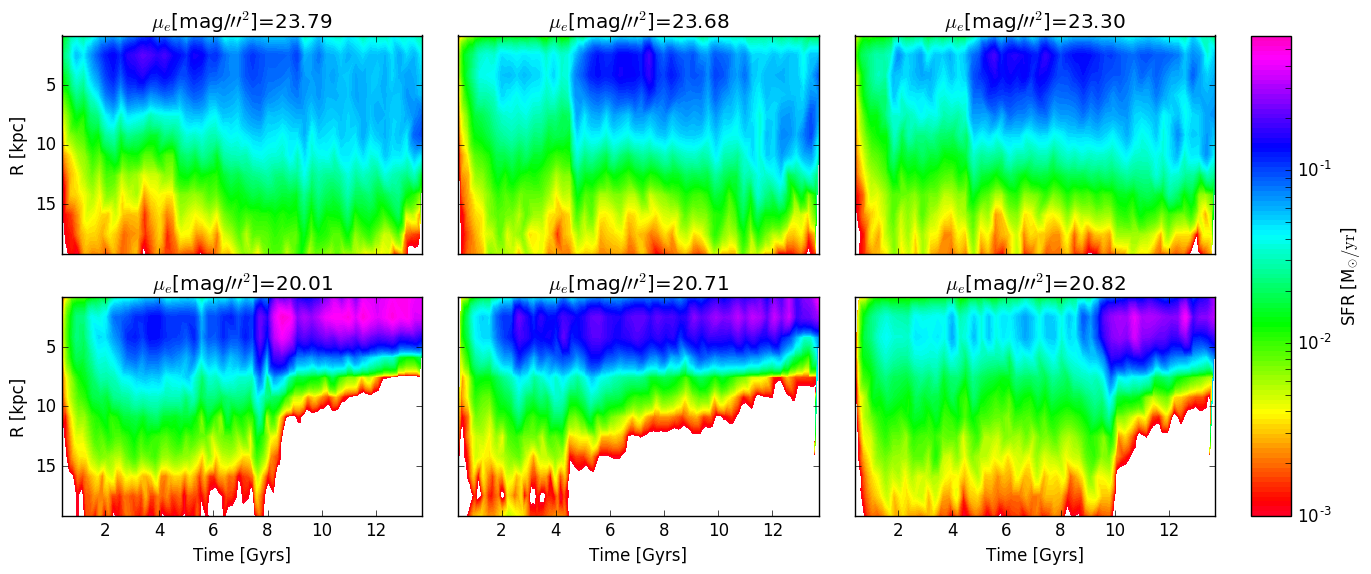
We show this explicitly in Fig. 16, by displaying a 2D histogram of the radial-SFH as a function of cosmic time, for the three lowest (top panels) and three highest (lower panels) surface brightness galaxies in our sample. Different colours represents different SF rates, out to a limiting radius of 20 kpc. HSBs tend to form most of their new, young stars (age4-5 Gyrs), in a spatial region confined within the inner 5 kpc from their galactic center, a result of perpendicular merger configuration and misaligned gas accretion, that give rise to a central high gas density, leading to localized SF. LSB, on the contrary, with their flat HI gas density profile translating into higher gas densities at larger radii, resulting from the high angular momentum acquired during co-planar mergers and aligned gas accretion, are able to sustain the formation of new stars through the disc, out to 20 kpc.
At the present time, obtaining spatially resolved SFR in such LSBs is still beyond current capabilities. Indeed, SFRs in LSB galaxies have been derived from models that take into account the photometric and chemical evolution of the galaxies (e.g. van den Hoek et al., 2000), or by measuring their H lines (e.g. McGaugh et al., 2017), or by adopting standard calibrations to convert the UV light into SFRs (e.g. Boissier et al., 2008): these techniques provide the mean or present-day SFR in LSBs, without any information about the radial dependence of this quantity.
In the future, however, new observations and improved technologies will hopefully make possible the derivation of detailed radial SFRs for these galaxies, validating our prediction.
6 Conclusions
We explore the formation of Low Surface Brightness (LSB) galaxies using cosmological hydrodynamical simulations from the NIHAO project (Wang et al., 2015; Dutton et al., 2016). For the first time, we show that simulations can reproduce LSBs in the range M⋆M⊙, coinciding with the galaxy mass where the majority of LSBs are found (Impey & Bothun, 1997; Bothun et al., 1997): the properties of simulated and observed LSBs agree remarkably. The main results of this work are as follows:
- •
-
•
they show an overall extended, continuous, steady, global SFHs, with current star formation rates 0.2SFR0.7 M⊙/yr (Figure 7);
-
•
they form preferentially in high spin dark matter (DM) haloes, 0.04, with average concentration parameters following the - relation (Figure 8) ;
-
•
they live in expanded DM haloes with inner slopes 0.4-0.6, as a result of baryonic outflows, although no relation between surface brightness and DM slope is observed in this mass range (Figure 8);
- •
-
•
LSBs form through a combination of i) co-planar, co-rotating mergers and ii) aligned infall of gas at early times.
- We showed the importance of merger parameters in determining galaxy surface brightness by studying the correlation of the angle , between the orbital angular momentum vector and the angular momentum of the primary galaxy at merger time, and the final of each galaxy: LSBs have undergone through co-planar mergers, which are able to add angular momentum to the disc and result in low , while HSBs have formed as a result of perpendicular mergers, which efficiently remove angular momentum from the existing galaxy (Figures 12 and 13); the larger is the merger, the strongest is the correlation between orbital configuration at merger time and final , while the specific time at which such mergers occur does not seem to play a role (Figure 10);
- We showed that the alignment of baryons at the time when the galaxy was half its total mass also affects the final surface brightness, by deriving the angle between the angular momentum of inner and outer shells of baryonic material infalling into the protogalaxy at half-halo mass formation time, : for LSBs, the inflowing gas that will compose the galaxy by =0 is well aligned with the protogalaxy already at , while HSBs preferentially form from accreting baryons that are misaligned with respect to the central object (Figure 14);
-
•
their young stellar population (tage4-5Gyrs) forms throughout the disc, from the inner regions to the outskirts, a result of the flat HI gas surface density extending to large radii (Figures 15 and 16). The formation of young stars in LSBs proceed at a similar rate of SFR0.1 M⊙/yr out to 10 Kpc in the disc, and at about 0.01 M⊙/yr out to 15 kpc, unlike HSB galaxies whose bulk of young stars is formed solely within the inner 5 kpc from the center, at a higher SFR (Figure 16).
The latter prediction is currently not testable with the present knowledge and facilities, indeed obtaining spatially resolved SFR in such low systems is still inaccessible. Should deeper observations and better methodologies be available in the future, that will make it feasible the validation of our prediction. Further, detailed predictions can be offered regarding the rotation vs dispersion support and axis-ratio of LSBs: this is indeed the focus of a forthcoming paper. Here, we anticipate that LSBs in the studied mass range, M⋆109.5-10M⊙, tend to be rotationally supported and to have an ellipticity between 0.60.8, when measured edge-on, compatibly with being typical disc galaxies, with large axis-ratio and no bulge component (e.g. Kautsch et al., 2006).
Unlike the scenario suggested by cosmological simulations for the formation of less massive LSB objects, i.e. Ultra-Diffuse galaxies, in which the expanded stellar distribution arises as the result of powerful stellar feedback-driven gas outflows (Di Cintio et al., 2017; Chan et al., 2018), these more massive, ‘classical’ LSBs, have a high enough mass to be in the realm where stellar feedback alone is not sufficient to create such large, extended galaxies (Governato et al., 2012; Di Cintio et al., 2014a; Chan et al., 2015; Tollet et al., 2016).
For M⋆M⊙ the role of angular momentum becomes predominant, as we move from a feedback-based to a angular momentum-based formation scenario. This extends upon previous theoretical work suggesting the importance of high-angular momentum in the formation of LSBs (e.g. Dalcanton et al., 1997; Dutton et al., 2007; Amorisco & Loeb, 2016). We remark that the proposed formation scenario for LSBs only applies to isolated galaxies in the selected mass range, M⋆109.5-10M⊙, most of which are discs in the Impey & Bothun (1997) sample and in our simulations. Lower mass dwarfs ellipticals and dwarf irregulars, with low , could result from a combination of strong feedback and environmental effects, though not studied here.
The present work implies that, although apparently dwarf and disc galaxies in the LSB domain share similar observational properties, their formation mechanism is intrinsically different, a reflection of the mass dependence of feedback and accretion phenomena across galaxy populations. Tentative signatures of this transition regime can already be found in observations of gas fractions and SFHs of dwarfs and disc LSBs, respectively.
Results from Schombert et al. (2001) and McGaugh & de Blok (1997) suggest that star formation in dwarf LSBs cannot evolve as smoothly and uniformly as it happens for LSB discs, perhaps pointing towards an intrinsic difference in the type of star formation within the two groups; moreover, LSBs dwarfs seem to have higher gas fractions than those of their more massive counterpart. Both these aspects are detected in our simulations, with low mass UDGs having bursty-like SFHs and high gas fractions, fg, up to 97 (Di Cintio et al. 2017, their Fig.4), while more massive LSBs, from this work, showing continuous SFHs and lower fg50. Schombert (2006) previously noted that the structural differences between gas-rich dwarfs and disc galaxies could be driven by kinematics, and Wheeler et al. (2017) subsequently showed that gas-rich dwarfs below M⋆M⊙ may form as dispersion-supported stellar systems, only mildly rotating.
Ultimately, the results of our work could indicate that we are facing the turning point between ordered rotating discs to more pressure-supported dwarfs systems. The details of this transition will be explored and confirmed in detail in a forthcoming work.
Acknowledgements
ADC acknowledges financial support from a Marie-Skłodowska-Curie Individual Fellowship grant, H2020-MSCA-IF-2016 Grant agreement 748213, DIGESTIVO. CBB thanks MINECO/FEDER grant AYA2015-63810-P and the Ramón y Cajal fellowship program. ADC acknowledges fruitful discussions with Julio Navarro, Laura Sales and Patricia Sánchez-Blázquez. This research was carried out on the High Performance Computing resources at New York University Abu Dhabi. Additional computational resources were provided by the theo cluster at MPIA and the hydra clusters at Rechenzentrum in Garching.
References
- Amorisco & Loeb (2016) Amorisco N. C., Loeb A., 2016, MNRAS, 459, L51
- Beasley & Trujillo (2016) Beasley M. A., Trujillo I., 2016, ApJ, 830, 23
- Bell et al. (2000) Bell E. F., Barnaby D., Bower R. G., de Jong R. S., Harper D. A., Hereld M., Loewenstein R. F., Rauscher B. J., 2000, MNRAS, 312, 470
- Bennet et al. (2018) Bennet P., Sand D. J., Zaritsky D., Crnojević D., Spekkens K., Karunakaran A., 2018, ApJ, 866, L11
- Boissier et al. (2008) Boissier S., et al., 2008, ApJ, 681, 244
- Bothun et al. (1987) Bothun G. D., Impey C. D., Malin D. F., Mould J. R., 1987, AJ, 94, 23
- Bothun et al. (1997) Bothun G., Impey C., McGaugh S., 1997, PASP, 109, 745
- Brook et al. (2012) Brook C. B., Stinson G., Gibson B. K., Wadsley J., Quinn T., 2012, MNRAS, 424, 1275
- Bullock et al. (2001) Bullock J. S., Dekel A., Kolatt T. S., Kravtsov A. V., Klypin A. A., Porciani C., Primack J. R., 2001, ApJ, 555, 240
- Carleton et al. (2019) Carleton T., Errani R., Cooper M., Kaplinghat M., Peñarrubia J., Guo Y., 2019, MNRAS, 485, 382
- Chabrier (2003) Chabrier G., 2003, PASP, 115, 763
- Chan et al. (2015) Chan T. K., Kereš D., Oñorbe J., Hopkins P. F., Muratov A. L., Faucher-Giguère C.-A., Quataert E., 2015, MNRAS, 454, 2981
- Chan et al. (2018) Chan T. K., Kereš D., Wetzel A., Hopkins P. F., Faucher-Giguère C.-A., El-Badry K., Garrison-Kimmel S., Boylan-Kolchin M., 2018, MNRAS, 478, 906
- Chilingarian et al. (2019) Chilingarian I. V., Afanasiev A. V., Grishin K. A., Fabricant D., Moran S., 2019, arXiv e-prints,
- Dalcanton et al. (1997) Dalcanton J. J., Spergel D. N., Summers F. J., 1997, ApJ, 482, 659
- Di Cintio et al. (2014a) Di Cintio A., Brook C. B., Macciò A. V., Stinson G. S., Knebe A., Dutton A. A., Wadsley J., 2014a, MNRAS, 437, 415
- Di Cintio et al. (2014b) Di Cintio A., Brook C. B., Dutton A. A., Macciò A. V., Stinson G. S., Knebe A., 2014b, MNRAS, 441, 2986
- Di Cintio et al. (2017) Di Cintio A., Brook C. B., Dutton A. A., Macciò A. V., Obreja A., Dekel A., 2017, MNRAS, 466, L1
- Dutton & Macciò (2014) Dutton A. A., Macciò A. V., 2014, MNRAS, 441, 3359
- Dutton et al. (2007) Dutton A. A., van den Bosch F. C., Dekel A., Courteau S., 2007, ApJ, 654, 27
- Dutton et al. (2016) Dutton A. A., et al., 2016, MNRAS, 461, 2658
- Fliri & Trujillo (2016) Fliri J., Trujillo I., 2016, MNRAS, 456, 1359
- Governato et al. (2012) Governato F., et al., 2012, MNRAS, 422, 1231
- Gutcke et al. (2016) Gutcke T. A., Stinson G. S., Macciò A. V., Wang L., Dutton A. A., 2016, MNRAS,
- Hopkins et al. (2014) Hopkins P. F., Kereš D., Oñorbe J., Faucher-Giguère C.-A., Quataert E., Murray N., Bullock J. S., 2014, MNRAS, 445, 581
- Impey & Bothun (1997) Impey C., Bothun G., 1997, ARA&A, 35, 267
- Impey et al. (1988) Impey C., Bothun G., Malin D., 1988, ApJ, 330, 634
- Jiang et al. (2018) Jiang F., Dekel A., Freundlich J., Romanowsky A. J., Dutton A., Maccio A., Di Cintio A., 2018, arXiv e-prints,
- Katz et al. (2017) Katz H., Lelli F., McGaugh S. S., Di Cintio A., Brook C. B., Schombert J. M., 2017, MNRAS, 466, 1648
- Kautsch et al. (2006) Kautsch S. J., Grebel E. K., Barazza F. D., Gallagher III J. S., 2006, A&A, 445, 765
- Knollmann & Knebe (2009) Knollmann S. R., Knebe A., 2009, ApJS, 182, 608
- Koda et al. (2015) Koda J., Yagi M., Yamanoi H., Komiyama Y., 2015, ApJ, 807, L2
- Leisman et al. (2017) Leisman L., et al., 2017, ApJ, 842, 133
- Lelli et al. (2010) Lelli F., Fraternali F., Sancisi R., 2010, A&A, 516, A11
- Lelli et al. (2016) Lelli F., McGaugh S. S., Schombert J. M., 2016, AJ, 152, 157
- Maller et al. (2002) Maller A. H., Dekel A., Somerville R., 2002, MNRAS, 329, 423
- Mancera Piña et al. (2018) Mancera Piña P. E., Peletier R. F., Aguerri J. A. L., Venhola A., Trager S., Choque Challapa N., 2018, MNRAS, 481, 4381
- Martínez-Delgado et al. (2010) Martínez-Delgado D., et al., 2010, AJ, 140, 962
- Martínez-Delgado et al. (2016) Martínez-Delgado D., et al., 2016, AJ, 151, 96
- McGaugh (1996) McGaugh S. S., 1996, MNRAS, 280, 337
- McGaugh & Bothun (1994) McGaugh S. S., Bothun G. D., 1994, AJ, 107, 530
- McGaugh & de Blok (1997) McGaugh S. S., de Blok W. J. G., 1997, ApJ, 481, 689
- McGaugh et al. (2001) McGaugh S. S., Rubin V. C., de Blok W. J. G., 2001, AJ, 122, 2381
- McGaugh et al. (2017) McGaugh S. S., Schombert J. M., Lelli F., 2017, ApJ, 851, 22
- Merritt et al. (2014) Merritt A., van Dokkum P., Abraham R., 2014, ApJ, 787, L37
- Mihos et al. (2015) Mihos J. C., et al., 2015, ApJ, 809, L21
- Moster et al. (2013) Moster B. P., Naab T., White S. D. M., 2013, MNRAS, 428, 3121
- Muñoz et al. (2015) Muñoz R. P., et al., 2015, ApJ, 813, L15
- Obreja et al. (2016) Obreja A., Stinson G. S., Dutton A. A., Macciò A. V., Wang L., Kang X., 2016, MNRAS, 459, 467
- Pizzella et al. (2008) Pizzella A., Corsini E. M., Sarzi M., Magorrian J., Méndez-Abreu J., Coccato L., Morelli L., Bertola F., 2008, MNRAS, 387, 1099
- Pontzen et al. (2013) Pontzen A., Roškar R., Stinson G., Woods R., 2013, pynbody: N-Body/SPH analysis for python, Astrophysics Source Code Library (ascl:1305.002)
- Rahmati et al. (2013) Rahmati A., Schaye J., Pawlik A. H., Raičevic M., 2013, MNRAS, 431, 2261
- Read et al. (2019) Read J. I., Walker M. G., Steger P., 2019, MNRAS,
- Román & Trujillo (2017) Román J., Trujillo I., 2017, MNRAS, 468, 703
- Ruiz-Lara et al. (2018) Ruiz-Lara T., et al., 2018, MNRAS, 478, 2034
- Sales et al. (2012) Sales L. V., Navarro J. F., Theuns T., Schaye J., White S. D. M., Frenk C. S., Crain R. A., Dalla Vecchia C., 2012, MNRAS, 423, 1544
- Santos-Santos et al. (2018) Santos-Santos I. M., Di Cintio A., Brook C. B., Macciò A., Dutton A., Domínguez-Tenreiro R., 2018, MNRAS, 473, 4392
- Schombert (2006) Schombert J. M., 2006, AJ, 131, 296
- Schombert & Bothun (1988) Schombert J. M., Bothun G. D., 1988, AJ, 95, 1389
- Schombert et al. (2001) Schombert J. M., McGaugh S. S., Eder J. A., 2001, AJ, 121, 2420
- Shen et al. (2010) Shen S., Wadsley J., Stinson G., 2010, MNRAS, 407, 1581
- Spekkens & Karunakaran (2018) Spekkens K., Karunakaran A., 2018, ApJ, 855, 28
- Springel & Hernquist (2005) Springel V., Hernquist L., 2005, ApJ, 622, L9
- Stinson et al. (2006) Stinson G., Seth A., Katz N., Wadsley J., Governato F., Quinn T., 2006, MNRAS, 373, 1074
- Stinson et al. (2013) Stinson G. S., Brook C., Macciò A. V., Wadsley J., Quinn T. R., Couchman H. M. P., 2013, MNRAS, 428, 129
- Tollet et al. (2016) Tollet E., et al., 2016, MNRAS, 456, 3542
- Trujillo & Fliri (2016) Trujillo I., Fliri J., 2016, ApJ, 823, 123
- Trujillo et al. (2017) Trujillo I., Roman J., Filho M., Sánchez Almeida J., 2017, ApJ, 836, 191
- Wadsley et al. (2008) Wadsley J. W., Veeravalli G., Couchman H. M. P., 2008, MNRAS, 387, 427
- Wadsley et al. (2017) Wadsley J. W., Keller B. W., Quinn T. R., 2017, MNRAS, 471, 2357
- Wang et al. (2015) Wang L., Dutton A. A., Stinson G. S., Macciò A. V., Penzo C., Kang X., Keller B. W., Wadsley J., 2015, MNRAS, 454, 83
- Wheeler et al. (2017) Wheeler C., et al., 2017, MNRAS, 465, 2420
- Yozin & Bekki (2015) Yozin C., Bekki K., 2015, MNRAS, 452, 937
- Zhu et al. (2018) Zhu Q., et al., 2018, MNRAS, 480, L18
- de Blok et al. (1996) de Blok W. J. G., McGaugh S. S., van der Hulst J. M., 1996, MNRAS, 283, 18
- de Blok et al. (2001) de Blok W. J. G., McGaugh S. S., Rubin V. C., 2001, AJ, 122, 2396
- van Dokkum et al. (2015) van Dokkum P. G., Abraham R., Merritt A., Zhang J., Geha M., Conroy C., 2015, ApJ, 798, L45
- van den Hoek et al. (2000) van den Hoek L. B., de Blok W. J. G., van der Hulst J. M., de Jong T., 2000, A&A, 357, 397
- van der Burg et al. (2016) van der Burg R. F. J., Muzzin A., Hoekstra H., 2016, A&A, 590, A20
Appendix A in NIHAO and SPARC
We show explicitely the match between the effective surface brightness of our sample of simulated galaxies versus the one of the reference SPARC dataset, in Fig. 17. The K-band is the closest match to the 3.6m Spitzer-IRAC band used by SPARC, we therefore use this band to compare the of NIHAO and SPARC datasets. NIHAO galaxies are shown as dark circles while SPARC data are shown as dark diamonds. The relation between M⋆ or MHI and is remarkably similar for observations and simulations, alike what shown already in Fig. 3.