Helium enrichment in intermediate-age Magellanic Clouds clusters: towards an ubiquity of multiple stellar populations?
Abstract
Intermediate-age star clusters in the Magellanic Clouds harbour signatures of the multiple stellar populations long thought to be restricted to old globular clusters. We compare synthetic horizontal branch models with Hubble Space Telescope photometry of clusters in the Magellanic Clouds, with age between 2 and 10 Gyr, namely NGC 121, Lindsay 1, NGC 339, NGC 416, Lindsay 38, Lindsay 113, Hodge 6 and NGC 1978. We find a clear signature of initial helium abundance spreads () in four out of these eight clusters (NGC 121, Lindsay 1, NGC 339, NGC 416) and we quantify the value of . For two clusters (Lindsay 38, Lindsay 113) we can only determine an upper limit for , whilst for the two youngest clusters in our sample (Hodge 6 and NGC 1978) no conclusion about the existence of an initial He spread can be reached. Our estimates are consistent with the correlation between maximum He abundance spread and mass of the host cluster found in Galactic globular clusters. This result strengthens the emerging view that the formation of multiple stellar populations is a standard process in massive star clusters, not limited to a high redshift environment.
keywords:
stars: abundances – stars: chemically peculiar – stars: horizontal branch – Hertzsprung-Russell and colour-magnitude diagrams – galaxies: individual: SMC – galaxies: individual: LMC1 Introduction
The multiple stellar populations (MPs) present in individual globular clusters (GCs) are characterised by star-to-star abundance anti-correlations of light elements (C-N, O-Na and Mg-Al to a certain extent) together with spreads of initial He abundances (e.g. Milone et al., 2018; Bastian & Lardo, 2018). It has been recently shown that massive intermediate-age clusters in the Magellanic Clouds (MCs) –with ages down to 2 Gyr– also display light element abundance patterns like GCs (e.g. Hollyhead et al., 2017; Niederhofer et al., 2017a, b). On the other hand, clusters younger than 2 Gyr seem to lack detectable MPs, suggesting that age (or stellar mass) play a major factor in the onset of this phenomenon in massive stellar clusters (Martocchia et al., 2018a).
An important question to be addressed is the following: Do the MCs massive clusters older than 2 Gyr also display He abundance spreads, like Galactic GCs? If this is the case, these intermediate-age clusters are the counterparts of Galactic GCs in terms of MPs, thus suggesting that the MP formation is not restricted to high redshift environments. This, in turn, implies that young stellar clusters can also be used to constrain the MP formation process.
In a very recent paper, Lagioia et al. (2019) determined the presence of He abundance spread in four SMC massive clusters, employing photometry of red giant branch (RGB) stars. They found small helium abundance spreads in NGC 121, NGC 339 and NGC 416, while no spread was found for Lindsay 1.
Here, we will investigate the presence of a He abundance spread in a sample of MC clusters by modelling the morphology of their Red Clump (RC) and red horizontal branch (HB) stars in the colour-magnitude-diagram (CMD) using synthetic HB (and RC) models. As is well known, the CMD morphology of the He-burning phase is very sensitive to the initial He abundance of the parent populations, and indeed synthetic HB models have been employed to determine He abundance spreads in Milky Way GCs such as NGC 104 (Gratton et al., 2013), NGC 2419 (di Criscienzo et al., 2011; Di Criscienzo et al., 2015), NGC 2808 (Dalessandro et al., 2011), NGC 5272 (Dalessandro et al., 2013), NGC 5904 (Gratton et al., 2013), NGC 6388 (Busso et al., 2007), and NGC 6441 (Busso et al., 2007; Caloi & D’Antona, 2007).
The massive, intermediate-age clusters investigated in this study are Lindsay 1, NGC 121, NGC 339, NGC 416, in common with Lagioia et al. (2019), plus Hodge 6, Lindsay 38, Lindsay 113 and NGC 1978. They are all younger than the average Milky Way GC, with ages ranging between 2 Gyr and 10 Gyr. Additionally, all clusters have had MP signatures detected within them either photometrically or spectroscopically, except Lindsay 38 and Lindsay 113 that are currently being investigated (Martocchia et al. 2019, in preparation).
Our study expands the sample of clusters in the MCs investigated for the presence of initial He abundance spreads. Also, our method is complementary to the technique employed by Lagioia et al. (2019). These latter authors model several colour differences –sensitive to He, C, N, O abundance spreads– between fiducial sequences that trace the RGB of the main populations of each cluster (for one cluster they also determine the He spread from the RGB bump, whose brightness is also sensitive to the initial He abundance). As such, their method tends to measure differences of mean He abundances between cluster subpopulations. Our HB modelling aims at reproducing the full colour and magnitude range of the observed HBs, and should estimate the maximum He spread amongst stars in individual clusters.
The paper is organised as follows. Sect. 2 that describes both stellar evolution models and observations employed in this paper. Section 3 describes briefly the synthetic HB models, how they can reveal the presence of initial variations, and the fitting procedure to observational data. In Sect. 4 we investigate the presence of variations in individual clusters in our sample, and in Sect. 5 we finally discuss and summarise our results.
2 Stellar models and observations
We employ non-rotating stellar evolution models and tracks computed with the code STAREVOL (e.g. Lagarde et al., 2012). Our calculations do not include atomic diffusion111All observed HBs and RCs investigated here are cool enough (10’000 K) to avoid strong effects of atomic diffusion (Hui-Bon-Hoa et al., 2000; Michaud et al., 2011).. For each assumed cluster metallicity and age, we have computed models –from the zero age main sequence to the end of the HB, following the evolution through the He-flash– with various values of the initial Helium mass fraction (), choosing appropriate initial main sequence masses to reach the cluster age at the beginning of the He-burning phase. Our calculations do not include the early-asymptotic giant branch phase following the exhaustion of central He. The values range from the value expected from Galactic chemical evolution (/) to the maximum values given in Table 1, that vary from cluster to cluster.
As for the metal distribution of our models, we assume a scaled solar distribution (Asplund et al. 2009, with an -enhancement for the case of NGC 104 and NGC 121, see next section). Also, the He-enhanced models (that in principle should have metal distributions with altered C, N, O, Na, Mg, Al abundances) are calculated for the same scaled solar (or -enhanced) metal mixture, given that stellar evolution is not affected by these abundance variations if the sum of the C+N+O abundance is kept constant at fixed metallicity (as generally observed, within the errors, in Galactic GCs, see e.g. Yong et al., 2015). In addition, we work on CMDs in the ACS and WFC3 F475W, F555W, and F814W photometric bands, that are insensitive to variations of these light elements (see e.g., Salaris et al., 2006; Sbordone et al., 2011).
Mass-loss during the red giant branch (RGB) evolution is accounted for by employing the Reimers formula (Reimers, 1975):
where L, M and R are the model luminosity, mass and radius in solar units. For each metallicity and abundances we have calculated tracks for various values of .
Bolometric corrections to the ACS and WFC3 filters are obtained by interpolation amongst the tables from the MIST database (Choi et al., 2016) 222http://waps.cfa.harvard.edu/MIST/model_grids.html.
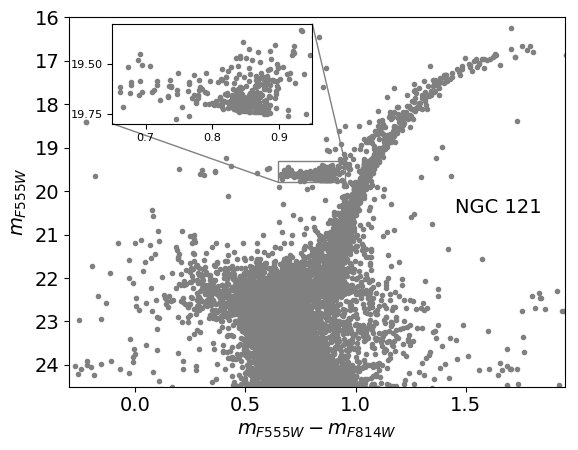
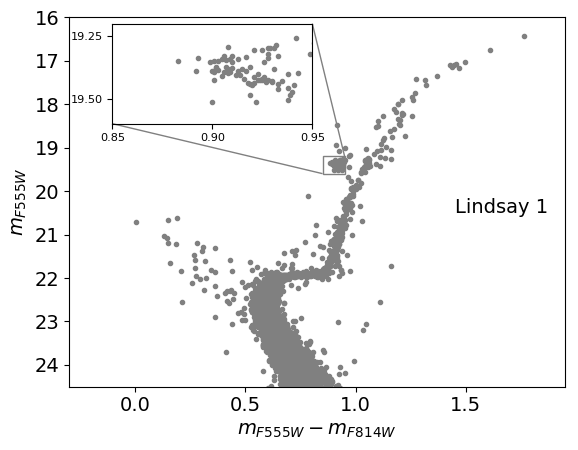
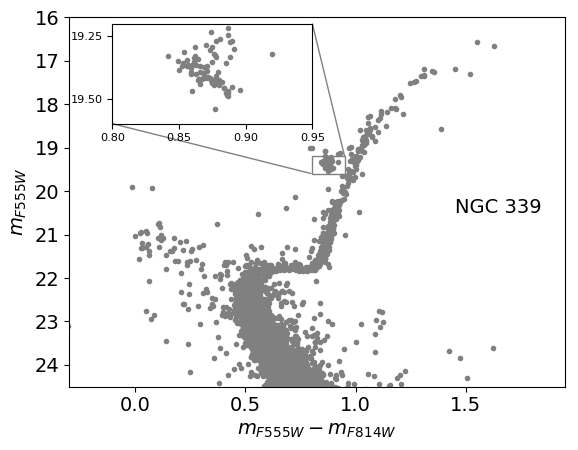
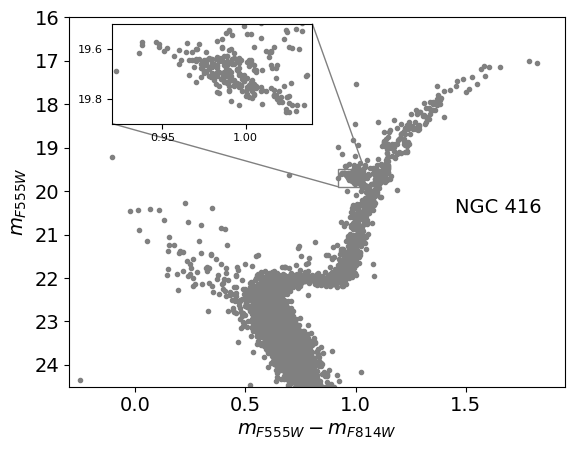
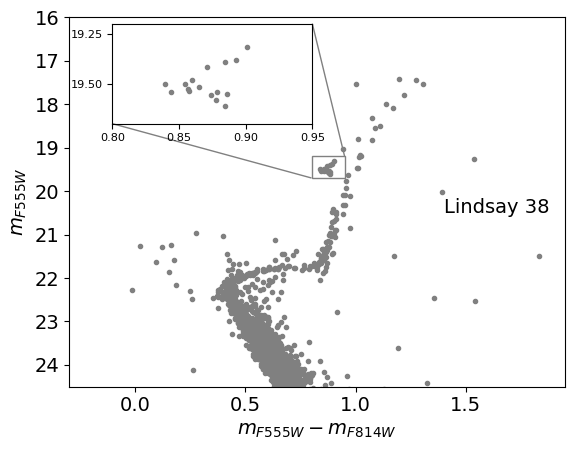
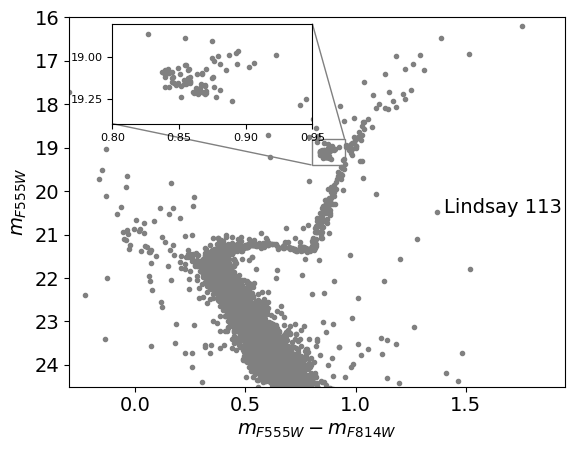
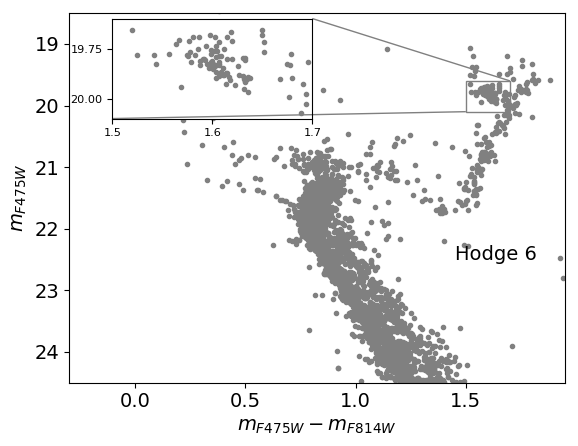
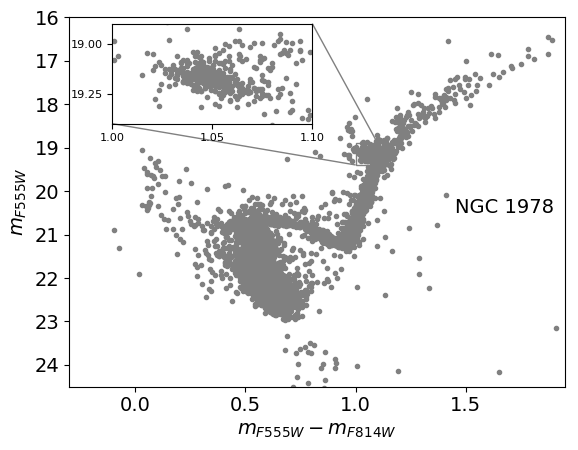
Clusters’ photometries are taken from the Hubble Space Telescope survey presented in Niederhofer et al. (2017a, b); Martocchia et al. (2018a) and Martocchia et al. (in prep.). In this study we use the ACS and optical filters, except for Hodge 6, for which we use WFC3 photometry in the and filters. The cluster CMDs are shown in Fig. 1, and the relevant cluster properties are listed in Table 1.
Niederhofer et al. (2017a, b); Martocchia et al. (2018a) and Martocchia et al. (in prep.) investigated these clusters for differential reddening and only NGC 416 is affected (we refer to these works for more details). Thus we use the data corrected for differential reddening for this cluster.
| Cluster | minimum models | maximum models | ||||||||||
| ID | [Fe/H] | Age (Gyr) | Ref. | Mass (M⊙) | Ref. | Ref. | Yini | Mini (M⊙) | Yini | Mini (M⊙) | ||
| NGC 104 | -0.72 | 12.0 | M15 | B18 | 13.37 | 0.04 | H96 | 0.251 | 0.905 | 0.291 | 0.84 | |
| NGC 121 | -1.30 | 10.5 | G8a,N17 | G11 | 19.00 | 0.03 | G8a,N17a | 0.248 | 0.89 | 0.288 | 0.83 | |
| Lindsay 1 | -1.14 | 7.50.5 | G8b | G11 | 18.78 | 0.02 | G8b | 0.249 | 0.97 | 0.279 | 0.92 | |
| NGC 339 | -1.12 | 60.5 | G8b | G11 | 18.80 | 0.02 | G8b | 0.250 | 1.04 | 0.290 | 0.97 | |
| NGC 416 | -1.00 | 60.5 | G8b | G11 | 18.90 | 0.08 | G8b | 0.250 | 1.045 | 0.330 | 0.905 | |
| Lindsay 38 | -1.50 | 60.5 | M19 | G11 | 19.10 | 0.02 | M19 | 0.249 | 1.02 | 0.269 | 0.985 | |
| Lindsay 113 | -1.40 | 4.50.5 | M19 | C10 | 18.85 | 0.02 | M19 | 0.249 | 1.11 | 0.269 | 1.07 | |
| Hodge 6 | -0.40 | 2.250.05 | P14,G14 | G14 | 18.77 | 0.09 | P14 | 0.258 | 1.53 | 0.318 | 1.37 | |
| NGC 1978 | -0.35 | 1.90.1 | M07 | W97 | 18.71 | 0.05 | M18b | 0.258 | 1.60 | 0.288 | 1.51 | |
3 Synthetic horizontal branch modelling
To determine the theoretical cluster HB (or RC) location and morphology in the CMD we need to fix a number of parameters, namely the cluster age, metallicity, initial He distribution, RGB mass loss efficiency (, that determines the actual mass of the synthetic HB stars for a given cluster age and initial chemical composition). For each cluster, we fix age and metallicity to the values estimated in previous studies, as reported in Table 1. Notice that variations of the age around the values in Table 1 will change the derived value of (because of a different HB progenitor mass) but not the overall results about the presence (or absence) of a He abundance spread in individual clusters. Also, the minimum value of (that we denote as the He abundance of the He-normal population) is fixed to the value given by where is the heavy element mass fraction. The primordial helium mass fraction Y0 chosen is equal to 0.2479 (Coc et al., 2004).
The free parameters that are left to be determined by fitting synthetic HBs to observed CMDs are the minimum and eventually maximum value of (if the observed HB is matched with a spread of mass loss instead of ), and the maximum value of (if a range of is required). For simplicity, we assume a uniform probability distribution for and , between the minimum and maximum values. We interpolate in and amongst our model grid to determine the HB track of our synthetic star for a given and . We then extract a random age with uniform probability between the zero age HB and the exhaustion of central He points, to fix the position of the synthetic stars in the CMD333The underlying standard assumptions is that stars are fed to the HB at a constant rate.. Magnitudes and colours of the synthetic stars are then perturbed by random Gaussian photometric errors, with 1 values taken from the mean photometric errors of the observations. We also checked these errors by comparing with the RGB width. We verticalised the RGB to determine the standard deviation of the (colour) distribution of RGB stars at the HB magnitude level. The standard deviation then derived is similar to the photometric errors of the observations, in addition this standard deviation can be considered as an upper limit since the He spread also affects the RGB width. Thus we are confident with these photometric errors. For each cluster we create the same number of synthetic stars as the one observed in a box delimiting the HB region of each cluster.
The procedure adopted to match the observed HB of a given cluster works as follows. For any given cluster we apply to the models distance modulus and reddening values listed in Table 1, using the extinction coefficient for the ACS and WFC3 filters from Goudfrooij et al. (2009); Goudfrooij et al. (2014). We then adjust to fit the cluster RGB with the track of the HB progenitor, and fix to match the reddest part of the observed HB with models calculated with the minimum value of . We then vary the maximum value of at fixed –or and fixed initial – to reproduce by eye the slope and full colour extension of the HB. Due to the strong sensitivity of the HB morphology to variations of (and ), we found with numerical tests that a simple fit by eye can give an accuracy on better than 0.01 (see Sect. 4).
We do not try to enforce the constraint of statistical agreement between the theoretical and observed star counts, because a perfect fit of star counts rests on the precise knowledge of, for example, the initial distribution among the cluster stars, that could be extremely complicated and/or discontinuous. The morphological constraints imposed on the matching synthetic HB are however sufficient to put strong bounds on , the maximum He abundance range, that is the main parameter discussed in this work. Obviously, our technique does not determine the exact number distribution of HB stars as a function of their initial .
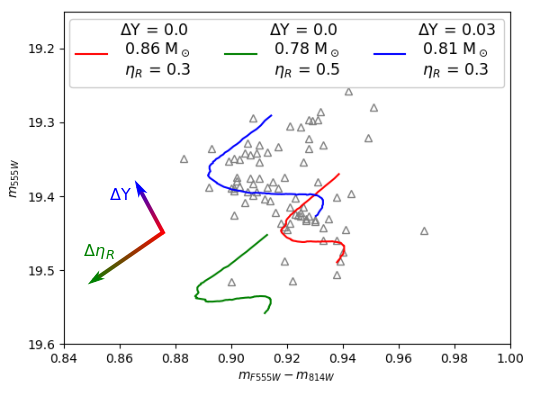
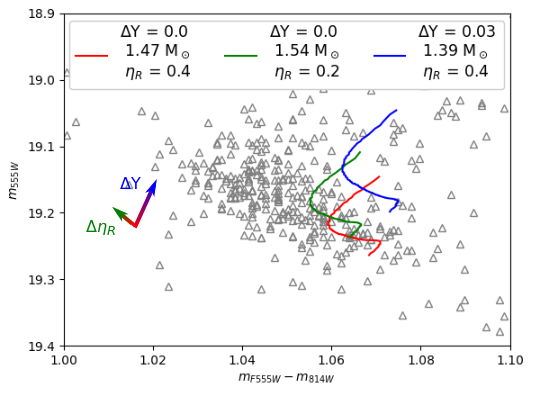
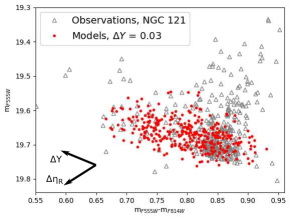
Figure 2 shows the case of two clusters, one (Lindsay 1) representative of intermediate-age and old clusters (initial mass of He-normal HB progenitors lower than 1.5 ), and one (NGC 1978) representative of younger clusters but still populated by RGB stars with electron degenerate cores. For the sake of clarity we display selected HB evolutionary tracks without photometric errors applied. The tracks shown do not represent the best fit models for these two clusters that will then be presented in Sect. 4, rather their purpose is just to highlight trends in the CMD.
In both cases a variation at fixed (and age) moves the HB tracks in an orthogonal direction with respect to the effect of varying ( ) at fixed (see also Fig. 1 in Salaris et al., 2016), although the directions of the and vectors change between the two age regimes. It is quite obvious even from this simple qualitative test shown in Fig. 2, that Lindsay 1 HB morphology can be matched only with 0. On the other hand, the HB morphology of NGC 1978 seems more likely to be shaped by a range of . We will see that the inclusion of photometric errors makes however difficult to draw firm conclusions for this cluster and the similar cluster Hodge 6.
We conclude this section with a test of our synthetic HB modelling on the well studied Galactic GC NGC 104 (total mass equal to , age 12 Gyr, [Fe/H] = 0.72, as summarized in Table 1) and compare with the synthetic HB modelling by Salaris et al. (2016), who found that a helium range =0.03 is needed to reproduce the observed HB morphology. Their result is in good agreement with several previous studies (Anderson et al., 2009; di Criscienzo et al., 2010; Milone et al., 2012; Gratton et al., 2013) who determined 0.02-0.03 for this GC.
We employed the same data ( photometry by Bergbusch & Stetson, 2009) used by Salaris et al. (2016), an apparent distance modulus = 13.37 and reddening = 0.04 (Harris, 1996, 2010 edition), and calculated -enhanced stellar models for [Fe/H] = -0.72, [/Fe]=+0.2, an age of 12 Gyr and various initial and . We use here for the extinction and . Following the procedure described before, we find = 0.34 ( M⊙) and = 0.03 from the match of the observed HB. Figure 3 compares the observed HB with synthetic HBs calculated with = 0.34 and both = 0 (left-hand panel) and = 0.03 (right-hand panel). A of only 0.025 produces a HB too short and =0.035 produces a HB slightly too extended compared to the observations,
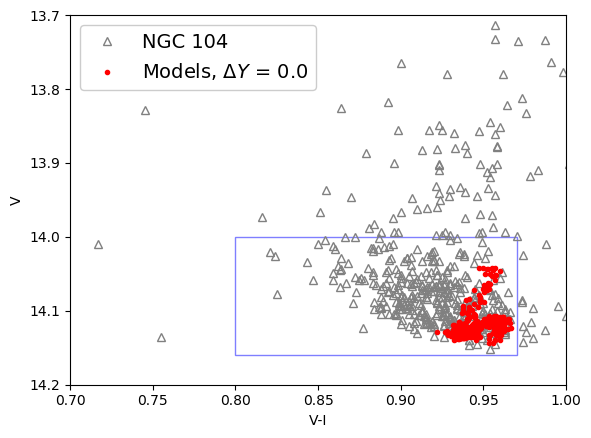
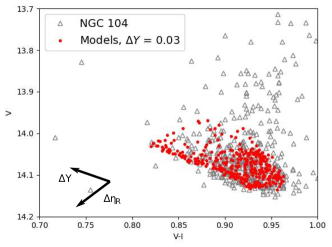
Our derived = 0.030.005 is in good agreement with what is found in the literature.
4 Analysis of the Magellanic Clouds’ cluster sample
4.1 NGC 121
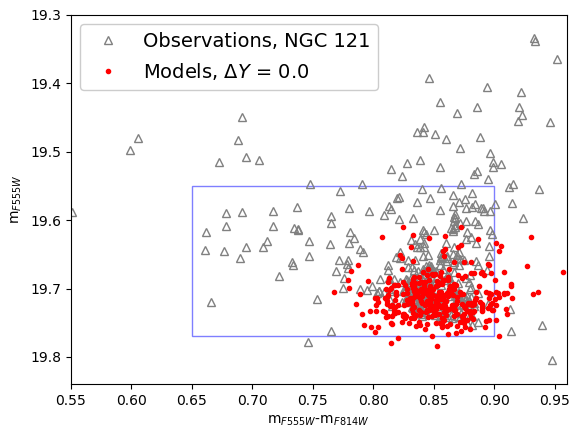
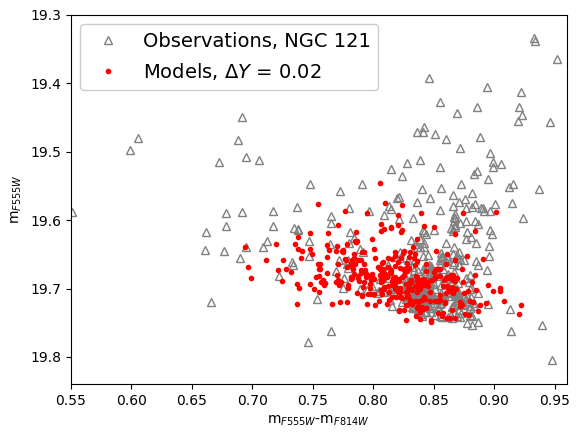
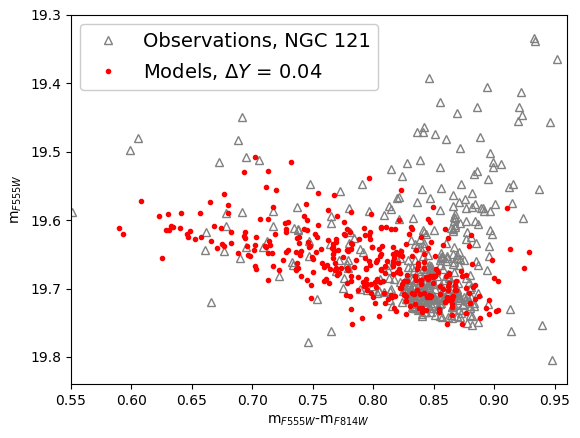
NGC 121 (SMC) has been investigated by Dalessandro et al. (2016) and Niederhofer et al. (2017a). The latter found two distinct populations from the analysis of the RGB with appropriate filter combinations, and they also concluded that a He abundance spread =0.0250.005 is needed to explain the morphology of the cluster HB. Therefore this cluster, with properties very similar to massive Milky Way GCs (total mass , age equal to 10.5 Gyr, and [Fe/H] = 1.30), allows us to compare again our results with previous independent results. We found that = 0.33 (corresponding to a total RGB mass loss M⊙, irrespective of the initial of the models) and 0.03 are required to match the colour extension and slope of the observed HB, as shown in Fig. 4. A variation of at constant initial would extend the synthetic HB orthogonally compared to the observations (see Fig. 2). The derived is consistent with Niederhofer et al. (2017a) result, based on a different set of HB stellar evolution models.
In the same Fig. 4 we display the effect of changing of the synthetic HBs by 0.01 around 0.03. It is obvious that in this case the colour extension of the observed HB is clearly not matched by the synthetic stars, implying that the error on our estimates of is lower than 0.01. This is the typical upper limit to the error in the values obtained for the other clusters in our sample.
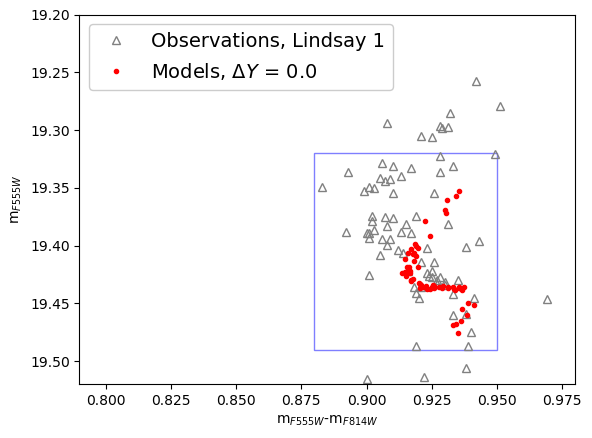
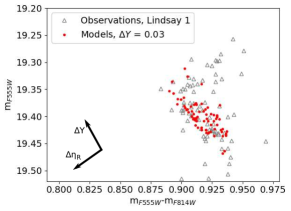
4.2 Lindsay 1
Lindsay 1 (SMC), has a mass and metallicity typical of a Galactic GC (, [Fe/H] =1.14 respectively) but a younger age (7.5 Gyr). Hollyhead et al. (2017) found a significant nitrogen abundance spread ([N/Fe] 1 dex) among stars located below the RGB bump, a signature of GC-like multiple stellar populations. Later, Niederhofer et al. (2017b) detected a photometric split of the RGB in suitable photometric filter combinations, a signature of a N spread among its stars.
We determine from our HB fitting procedure = 0.3 ( M⊙) and 0.03 (see Fig. 5).
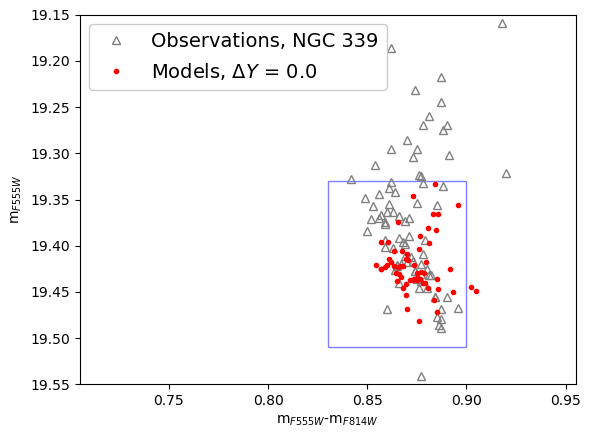
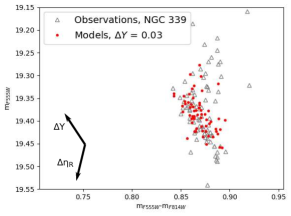
4.3 NGC 339
4.4 NGC 416
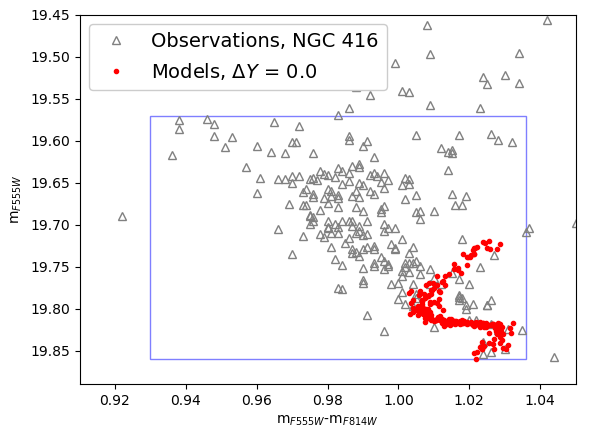
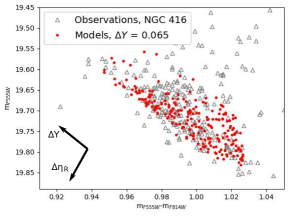
NGC 416 is a SMC cluster very similar to NGC 339, with a total mass equal to , an age 6 Gyr, and [Fe/H] =1.00. We use here the data from Niederhofer et al. (2017b) corrected for differential reddening, that affects this cluster. Niederhofer et al. (2017b) found also in this cluster a RGB splitting, signature of the presence of multiple stellar populations.
Our HB fitting provides = 0.4 ( M⊙) and = 0.065 (see Fig. 6). This range of initial is much larger than in the previous clusters, and might be at least slightly overestimated if there is some residual differential reddening not accounted for, given that the reddening vector is aligned with the HB slope.
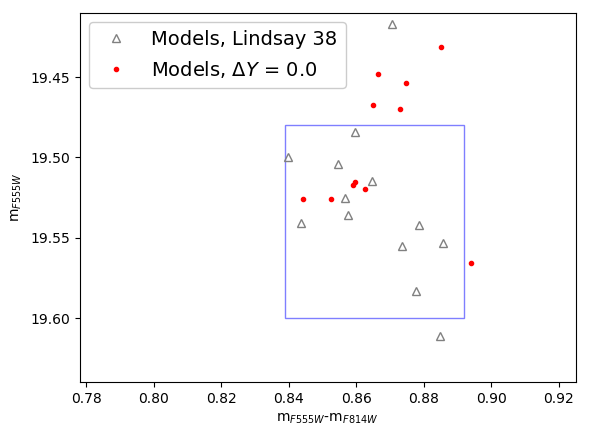
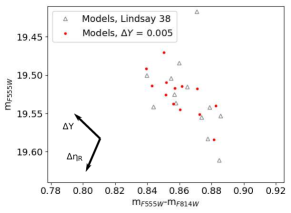
4.5 Lindsay 38
The SMC cluster Lindsay 38 has an age similar to NGC 416 and NGC 339 (6 Gyr), a lower mass () and a lower metallicity ([Fe/H] = 1.50). The HB fitting provides = 0.3 ( M⊙), but there is no strong indication of 0. Fig. 6 shows that =0.005 is probably an upper limit to the range of initial He in this cluster.
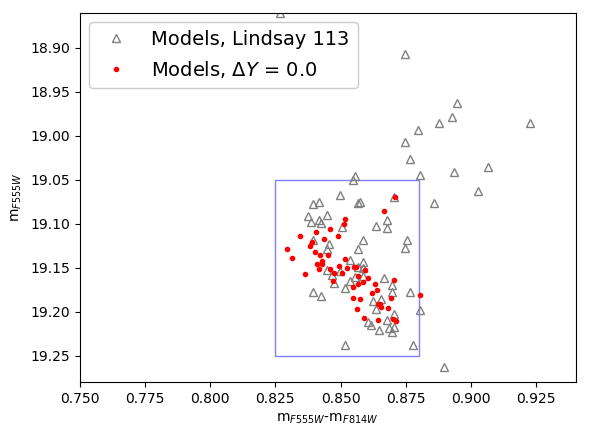
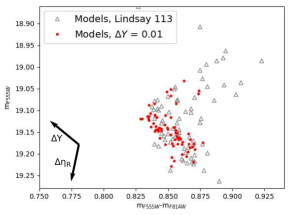
4.6 Lindsay 113
Lindsay 113 is the youngest SMC cluster in our sample (4.5 Gyr), the least massive one (), and metal-poor ([Fe/H] = 1.40). We derive from the HB fitting = 0.3 ( M⊙), and again no strong signature of a helium abundance spread. Figure 6 shows that 0.01 is very likely an upper limit to the possible spread amongst the cluster stars.
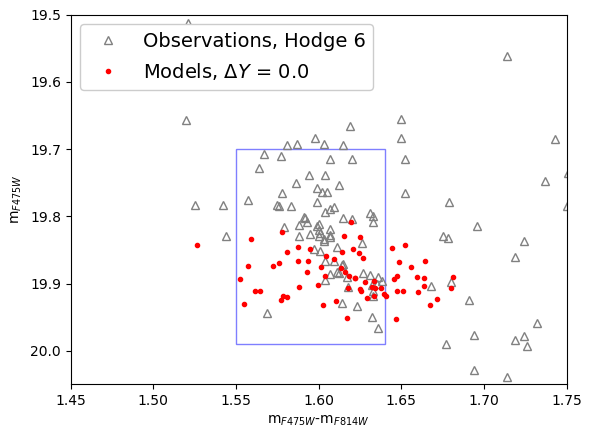
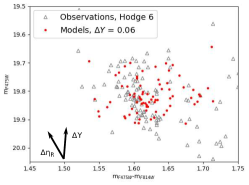
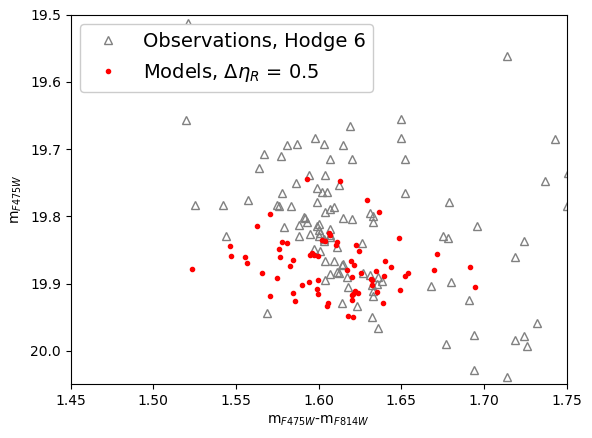
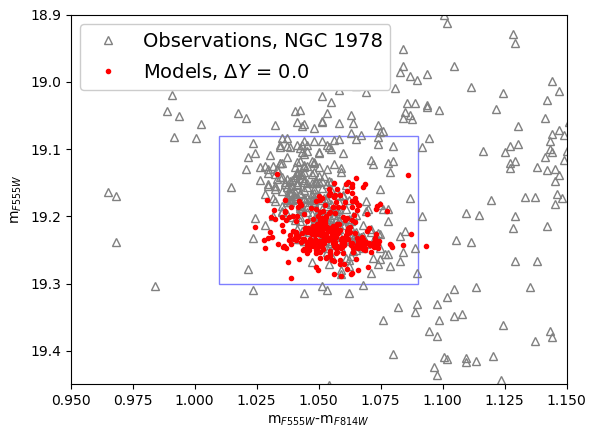
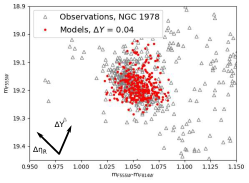
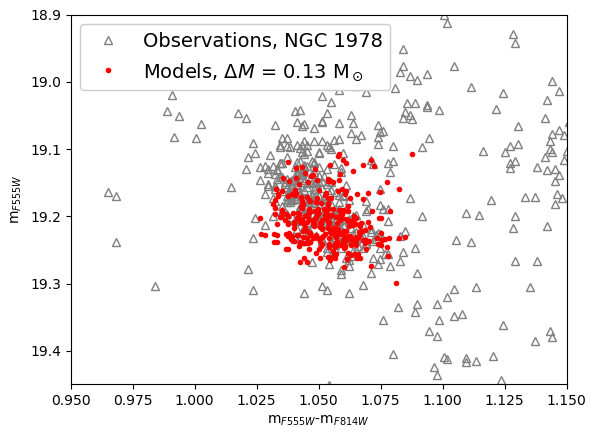
4.7 Hodge 6 and NGC 1978
These two LMC clusters are the youngest clusters in our sample, with ages equal to 2.25 (Hodge 6) and 1.9 Gyr (NGC 1978), and [Fe/H] around 0.40 (see Table 1). Multiple populations have been found in both clusters (Martocchia et al., 2018b, Hollyhead et al. submitted).
Due to their younger age, the direction of the and vectors is different compared to the case of the other clusters, as shown in Fig. 2. The different direction of these two vectors compared to the older clusters, coupled to the photometric error of these observations – of the order of 0.01-0.03 mag in magnitudes and colours– makes it difficult to reach a definitive conclusion about the existence of a 0 in these two clusters. Figure. 7 shows that an initial He spread (at fixed mass loss) or a mass loss spread (at fixed ) can similarly approximate the colour extension and slope of the observed CMD of core He burning stars.
If we make the assumption that must be constant, in agreement with the results for the other clusters in our sample, we would obtain 0.06 for Hodge 6, and 0.04 for NGC 1978. But without this assumption, the CMD analysis does not discriminate between a spread in or in for these two clusters. However, we also note that Hodge 6 has the largest photometric errors of any of the clusters in our sample, adding further uncertainty for this cluster.
5 Discussion
We have determined the total initial He abundance spread in a sample of intermediate-age, massive LMC and SMC clusters – and the old cluster NGC 121– by reproducing the shape and colour extension of their HB/RC stars with synthetic HB models. Our derived values are shown in Table 2. The typical error on these estimates of is below 0.01.
We can compare our results with the estimates by Lagioia et al. (2019). These authors found spreads of initial He abundances equal to 0.0090.006, 0.0070.004, 0.0100.003, 0.0000.004 for NGC 121, NGC 339, NGC 416 and Lindsay 1, respectively. These values are clearly smaller than our results in Table 2. But as mentioned already in the Introduction, the method employed by Lagioia et al. (2019) most likely determines mean abundance spreads among the cluster subpopulations, whereas our modelling tends to determine the maximum abundance spread, irrespective of the exact distribution of initial He abundances. This is quite clear by looking at the HB of NGC 121 in Fig. 4. The bulk of the HB population has ()0.8, consistent with a negligible with just a plume of stars extending towards bluer colors and brighter magnitudes, that is, with significantly different initial .
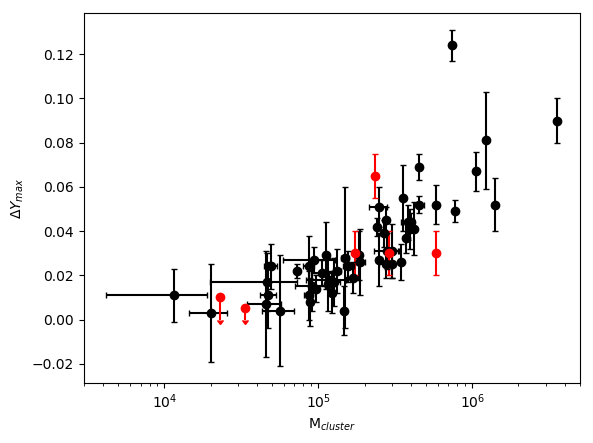
The values in Table 2 are also plotted in Fig. 8 as a function of the mass of the host cluster. In the same figure we display also the maximum initial spread determined for a sample of Galactic GCs by Milone et al. (2018). Milone et al. (2018) found a trend between and the mass of the host cluster, that is clearly visible in Fig. 8 and the results for our clusters follow this trend well. We found a Spearman rank-order correlation coefficient of 0.64 (p-value 0.17) between and the logarithm of the cluster mass. This result confirms the ubiquity of multiple stellar populations in massive intermediate-age clusters and GCs, questioning at the same time the distinction between these two classes of stellar systems. Interestingly, our very tentative determination of for NGC 1978 would fit the trend of Galactic GCs, whereas the for Hodge 6 would be much higher for its value of total mass (but note that this final measurement is highly uncertain due to the photometric errors and age of the cluster as discussed in Sec. 4.7).
We also searched for possible trends of with the cluster age amongst our cluster sample, but we did not find any statistically significant correlation (Spearman rank-order correlation coefficient of 0.35, p-value 0.49, between and Mcluster). This result is, to some degree, surprising given that the N abundance spreads has been found correlated with age in MCs intermediate-age clusters (Martocchia et al., 2018a, b), and may potentially shine a new light on the MP phenomenon.
| ID | |
|---|---|
| NGC 121 | 0.03 |
| Lindsay 1 | 0.03 |
| NGC 339 | 0.03 |
| NGC 416 | 0.065 |
| Lindsay 38 | 0.005 |
| Lindsay 113 | 0.01 |
| Hodge 6 | (0.06) |
| NGC 1978 | (0.04) |
Acknowledgements
We warmly thank E. Dalessandro for useful discussions. W. Chantereau acknowledges funding from the Swiss National Science Foundation under grant P2GEP2_171971. N.B. and W.C. gratefully acknowledge financial support from the European Research Council (ERC-CoG-646928, Multi-Pop). N.B. gratefully acknowledges financial support from the Royal Society (University Research Fellowship). Finally, we warmly thank the referee for the pertinent suggestions that have helped us improve the presentation of our results.
References
- Anderson et al. (2009) Anderson J., Piotto G., King I. R., Bedin L. R., Guhathakurta P., 2009, ApJ, 697, L58
- Asplund et al. (2009) Asplund M., Grevesse N., Sauval A. J., Scott P., 2009, ARA&A, 47, 481
- Bastian & Lardo (2018) Bastian N., Lardo C., 2018, ARA&A, 56, 83
- Baumgardt & Hilker (2018) Baumgardt H., Hilker M., 2018, MNRAS, 478, 1520
- Bergbusch & Stetson (2009) Bergbusch P. A., Stetson P. B., 2009, AJ, 138, 1455
- Busso et al. (2007) Busso G., et al., 2007, A&A, 474, 105
- Caloi & D’Antona (2007) Caloi V., D’Antona F., 2007, A&A, 463, 949
- Carretta et al. (2010) Carretta E., Bragaglia A., Gratton R. G., Recio-Blanco A., Lucatello S., D’Orazi V., Cassisi S., 2010, A&A, 516, A55
- Choi et al. (2016) Choi J., Dotter A., Conroy C., Cantiello M., Paxton B., Johnson B. D., 2016, ApJ, 823, 102
- Coc et al. (2004) Coc A., Vangioni-Flam E., Descouvemont P., Adahchour A., Angulo C., 2004, ApJ, 600, 544
- Dalessandro et al. (2011) Dalessandro E., Salaris M., Ferraro F. R., Cassisi S., Lanzoni B., Rood R. T., Fusi Pecci F., Sabbi E., 2011, MNRAS, 410, 694
- Dalessandro et al. (2013) Dalessandro E., Salaris M., Ferraro F. R., Mucciarelli A., Cassisi S., 2013, MNRAS, 430, 459
- Dalessandro et al. (2016) Dalessandro E., Lapenna E., Mucciarelli A., Origlia L., Ferraro F. R., Lanzoni B., 2016, ApJ, 829, 77
- Di Criscienzo et al. (2015) Di Criscienzo M., Tailo M., Milone A. P., D’Antona F., Ventura P., Dotter A., Brocato E., 2015, MNRAS, 446, 1469
- Glatt et al. (2008a) Glatt K., et al., 2008a, AJ, 135, 1106
- Glatt et al. (2008b) Glatt K., et al., 2008b, AJ, 136, 1703
- Glatt et al. (2011) Glatt K., et al., 2011, AJ, 142, 36
- Goudfrooij et al. (2009) Goudfrooij P., Puzia T. H., Kozhurina-Platais V., Chandar R., 2009, AJ, 137, 4988
- Goudfrooij et al. (2014) Goudfrooij P., et al., 2014, ApJ, 797, 35
- Gratton et al. (2013) Gratton R. G., et al., 2013, A&A, 549, A41
- Harris (1996) Harris W. E., 1996, AJ, 112, 1487
- Hollyhead et al. (2017) Hollyhead K., et al., 2017, MNRAS, 465, L39
- Hui-Bon-Hoa et al. (2000) Hui-Bon-Hoa A., LeBlanc F., Hauschildt P. H., 2000, ApJ, 535, L43
- Lagarde et al. (2012) Lagarde N., Decressin T., Charbonnel C., Eggenberger P., Ekström S., Palacios A., 2012, A&A, 543, A108
- Lagioia et al. (2019) Lagioia E. P., Milone A. P., Marino A. F., Dotter A., 2019, ApJ, 871, 140
- Martocchia et al. (2018a) Martocchia S., et al., 2018a, MNRAS, 473, 2688
- Martocchia et al. (2018b) Martocchia S., et al., 2018b, MNRAS, 477, 4696
- McDonald & Zijlstra (2015) McDonald I., Zijlstra A. A., 2015, MNRAS, 448, 502
- Michaud et al. (2011) Michaud G., Richer J., Richard O., 2011, A&A, 529, A60
- Milone et al. (2012) Milone A. P., et al., 2012, ApJ, 744, 58
- Milone et al. (2018) Milone A. P., et al., 2018, MNRAS, 481, 5098
- Mucciarelli et al. (2007) Mucciarelli A., Ferraro F. R., Origlia L., Fusi Pecci F., 2007, AJ, 133, 2053
- Niederhofer et al. (2017a) Niederhofer F., et al., 2017a, MNRAS, 464, 94
- Niederhofer et al. (2017b) Niederhofer F., et al., 2017b, MNRAS, 465, 4159
- Piatti et al. (2014) Piatti A. E., Keller S. C., Mackey A. D., Da Costa G. S., 2014, MNRAS, 444, 1425
- Reimers (1975) Reimers D., 1975, Memoires of the Societe Royale des Sciences de Liege, 8, 369
- Salaris et al. (2006) Salaris M., Weiss A., Ferguson J. W., Fusilier D. J., 2006, ApJ, 645, 1131
- Salaris et al. (2016) Salaris M., Cassisi S., Pietrinferni A., 2016, A&A, 590, A64
- Sbordone et al. (2011) Sbordone L., Salaris M., Weiss A., Cassisi S., 2011, A&A, 534, A9
- Westerlund (1997) Westerlund B. E., 1997, The Magellanic Clouds
- Yong et al. (2015) Yong D., Grundahl F., Norris J. E., 2015, MNRAS, 446, 3319
- di Criscienzo et al. (2010) di Criscienzo M., Ventura P., D’Antona F., Milone A., Piotto G., 2010, MNRAS, 408, 999
- di Criscienzo et al. (2011) di Criscienzo M., et al., 2011, MNRAS, 414, 3381