A New Generation of Cool White Dwarf Atmosphere Models. III. WD J2356209: Accretion of a Planetesimal with an Unusual Composition
Abstract
WD J2356209 is a cool metal-polluted white dwarf whose visible spectrum is dominated by a strong and broad sodium feature. Although discovered nearly two decades ago, no detailed and realistic analysis of this star had yet been realized. In the absence of atmosphere models taking into account the nonideal high-density effects arising at the photosphere of WD J2356209, the origin of its unique spectrum had remained nebulous. We use the cool white dwarf atmosphere code presented in the first paper of this series to finally reveal the secrets of this peculiar object and details about the planetesimal that polluted its atmosphere. Thanks to the improved input physics of our models, we find a solution that is in excellent agreement with the photometric observations and the visible spectrum. Our solution reveals that the photosphere of WD J2356209 has a number density ratio of , which is the highest ever found in a white dwarf. Since we do not know how long ago the accretion episode stopped (if it has), we cannot precisely determine the composition nor the mass of the accreted planetesimal. Nevertheless, all scenarios considered indicate that its composition is incompatible with that of chondrite-like material and that its mass was at least .
Subject headings:
planetary systems — stars: abundances — stars: atmospheres — stars: individual (WD J2356209) — white dwarfs1. Introduction
WD J2356209111Also known as WD 2354211 in the electronic version of of the Catalog of Spectroscopically Identified White Dwarfs (McCook & Sion, 1999), was discovered by Oppenheimer et al. (2001) as part of their search for cool white dwarfs in the galactic halo. Since its spectrum shows a broad asymmetric feature around 6000 Å, it was described as having a "bizarre spectrum, incomparable to any other known object".
Using only photometry, Bergeron (2003) attempted the first atmospheric parameter determination of WD J2356209. It was found that it must have an effective temperature of the order of : the best photometric solution was at if a hydrogen-rich atmosphere was assumed and at in the case of a helium-rich composition. Note that because of the absence of Balmer lines at such low temperatures, the atmospheric composition of this object remained unknown.
Shortly after, Salim et al. (2004) reobserved WD J2356209 and confirmed the measurements of Oppenheimer et al. (2001). In particular, in a color-color diagram, it appears as a strong outlier with an excessively blue and an extremely red . Salim et al. (2004) suggested that these peculiar colors may be the result of a very broad Na I D doublet, implying that WD J2356209 is a metal-polluted white dwarf (i.e., a DZ star).
Then, Bergeron et al. (2005) obtained new photometric observations of WD J2356209 in the and bands. They picked up the interpretation proposed by Salim et al. (2004) and analyzed WD J2356209 with atmosphere models that included Na. Their solution ( and ) yields a satisfactory fit both to their photometric measurements and to the spectrum of Oppenheimer et al. (2001) in the 5000–9000 Å region. However, in the absence of any spectrum below 5000 Å they could not detect any other metal than Na, and thus Na and He were the only atomic species included in their atmosphere model. In retrospect, this was an unrealistic assumption. With the discovery of dozens of circumstellar debris discs around metal-polluted white dwarfs (e.g., Zuckerman & Becklin, 1987; Gänsicke et al., 2006; Farihi et al., 2009; Melis et al., 2010; Rocchetto et al., 2015) and the detection of planetary transits in the light curve of WD 1145+017 (Vanderburg et al., 2015; Gänsicke et al., 2016; Croll et al., 2017) it is now clear that the presence of heavy elements in white dwarfs is the consequence of the accretion of tidally disrupted rocky bodies (Jura, 2003; Farihi et al., 2010; Jura & Young, 2014). Therefore, all elements representative of the composition of rocky planetesimals should be included in DZ atmosphere models.
Moreover, the analysis of Bergeron et al. (2005) was based on models that did not take into account the nonideal high-density effects that are known to arise under the physical conditions met in the atmospheres of cool white dwarfs. In particular, their models relied on the ideal gas law, which is inappropriate for the high pressures of cool white dwarfs (e.g., Saumon et al., 1995; Becker et al., 2014); nonideal effects affecting the chemical equilibrium (Kowalski et al., 2007; Blouin et al., 2018a) were neglected; and simple Lorentzian line profiles, which poorly reproduce the spectral lines observed in cool DZ white dwarfs (Allard et al., 2016, 2018; Hollands et al., 2017), were assumed.
An independent analysis of WD J2356209 was performed by Homeier et al. (2005, 2007) using the PHOENIX general-purpose stellar atmosphere code (Hauschildt et al., 1997; Baron & Hauschildt, 1998; Hauschildt & Baron, 1999) and the spectrum obtained by Oppenheimer et al. (2001). The first results identified an apparent overabundance of Na relative to Ca and suggested that WD J2356209 has a hydrogen-rich atmosphere (Homeier et al., 2005). An important limitation of this first analysis was that line profiles implemented in their atmosphere models were limited to perturber densities not exceeding (Allard et al., 2003), which is about three orders of magnitude below the density at the photosphere of a helium-rich DZ white dwarf (Blouin et al., 2018a). In a second analysis (Homeier et al., 2007), improved line profiles appropriate for larger densities were employed and a helium-rich composition was favored. Homeier et al. (2005, 2007) were also the first to point out that metal hydrides (namely, MgH and CaH) should form under the conditions encountered in the atmosphere of WD J2356209. However, these preliminary analyses were exploratory in nature and no quantitative fit to the spectroscopic and photometric data was attempted. Furthermore, as in Bergeron et al. (2005), their models did not include the nonideal effects that are known to affect the chemical equilibrium and the equation of state.
In this paper, the third of a series, we present the most detailed analysis to date of WD J2356209. Our models, which include an accurate description of the high-pressure physics relevant to the modeling of cool DZ stars (see Blouin et al. 2018a, b, hereafter Papers I and II), make it possible for the first time to obtain a satisfactory fit to the photometric data and to the entire visible spectrum. In Section 2, we present the observations on which our analysis of WD J2356209 is based. A few new improvements brought to our model atmosphere code are detailed in Section 3. Section 4 contains our analysis of WD J2356209, where we find that the sodium to calcium ratio is the highest ever encountered in a white dwarf photosphere. Finally, Section 5 provides a discussion on the origins of the peculiar abundances measured in WD J2356209 and our conclusions are given in Section 6.
2. Observations
Our analysis of WD J2356209 makes use of and photometry from Bergeron et al. (2005), photometry from Pan-STARRS (Chambers et al., 2016) and the Gaia DR2 parallax measurement (Gaia Collaboration, 2016, 2018). The parallax indicates that WD J2356209 is located at a distance from the Earth, which is in good agreement with the estimation obtained by Salim et al. (2004) using color-magnitude relations ().
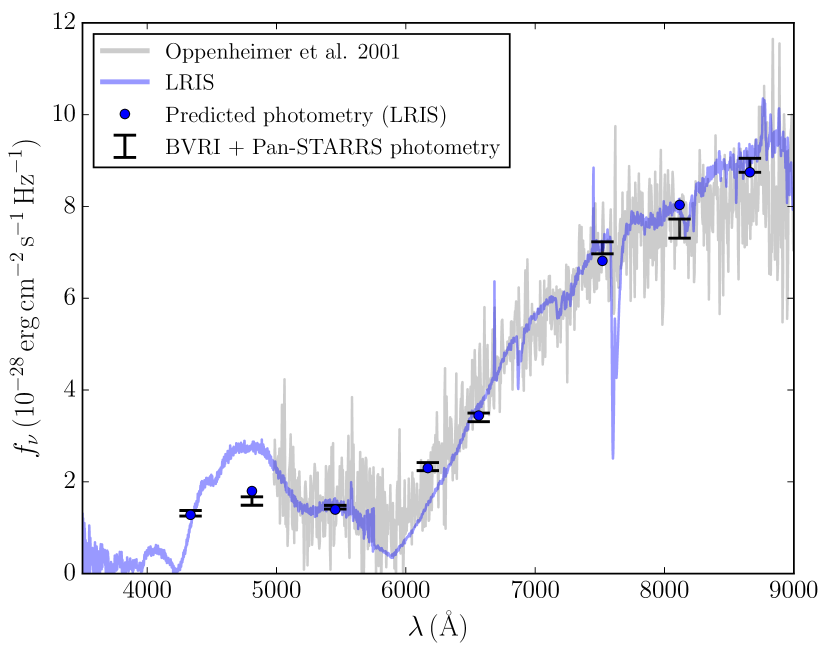
For the spectroscopy, we rely on data obtained with LRIS (Oke et al., 1995) on Keck I telescope on 2002 September 14. A 300/5000 grating was used for both the blue and the red spectra, together with a 1 arcsec slit, giving an effective resolution of 10.3 Å. D560 dichroic was used to split the beams, giving useful wavelength coverage of 50009000 Å on the red side and 35005800 Å on the blue side. Each of the blue and red spectra were obtained with a total exposure time of 45 minutes. Standard arc spectra were taken for wavelength calibration. Only one standard star was available for flux calibration, while there were no suitable observations for the removal of the telluric absorption. The observations of the standard star may have been affected by detector non-linearity. Therefore, we correct the flux calibration by scaling the spectrum so that the photometry extracted from the joined blue/red spectrum agrees with the broad-band photometry. As shown in Figure 1, the scaled LRIS spectrum agrees very well with the low-resolution shallow spectrum of Oppenheimer et al. (2001) in the region where they overlap (Å).
3. Atmosphere models
The atmosphere models used in this work are described at length in Paper I. Our models are uniquely suited for the analysis of such a very cool DZ star, since they are the only ones to include both a state-of-the-art description of the ionization equilibrium of heavy elements (Paper I) and unified line profiles (Allard et al., 1999) for the strong Na and Ca spectral lines that characterize the spectrum of WD J2356209.
Compared to the models used in Papers I and II, two changes were made to our code. First, we have improved our collisional profiles of the resonance line of neutral calcium perturbed by helium using the ab initio CaHe potential energies of M. Krośnicki reported in Hernando et al. (2008). It is a significant improvement in the description of CaHe singlet potential energies, but only at close range (i.e., only for radiator-perturber separations of to 11 Å). To predict the impact core shift and width, the long-range part of the potential energies needs to be accurately determined. Moreover, our approach requires prior knowledge of the variation of the radiative dipole moments with atom-atom separation for each molecular state. As this variation is unknown at present, the dipole moments were assumed to remain constant throughout the collision. In order to obtain more accurate line profiles, intensive ab initio calculations are being performed to obtain both the ground and first excited potential energy curves (PECs) and the transition dipole moments for the CaHe system (N. F. Allard et al., in preparation).
The second change made to our atmosphere model code was to add the opacity due to the rovibrational transitions of the MgH and CaH molecules. The MgH opacities are computed using the linelists of GharibNezhad et al. (2013) for the the X A and X B transitions, which are available on the ExoMol website222http://exomol.com (Tennyson & Yurchenko, 2012; Tennyson et al., 2016). For CaH, the X A and X B transitions are computed using the Kurucz linelists333http://kurucz.harvard.edu, which rely on molecular data from Weck et al. (2003) and Shayesteh et al. (2013).
4. Analysis of WD J2356209
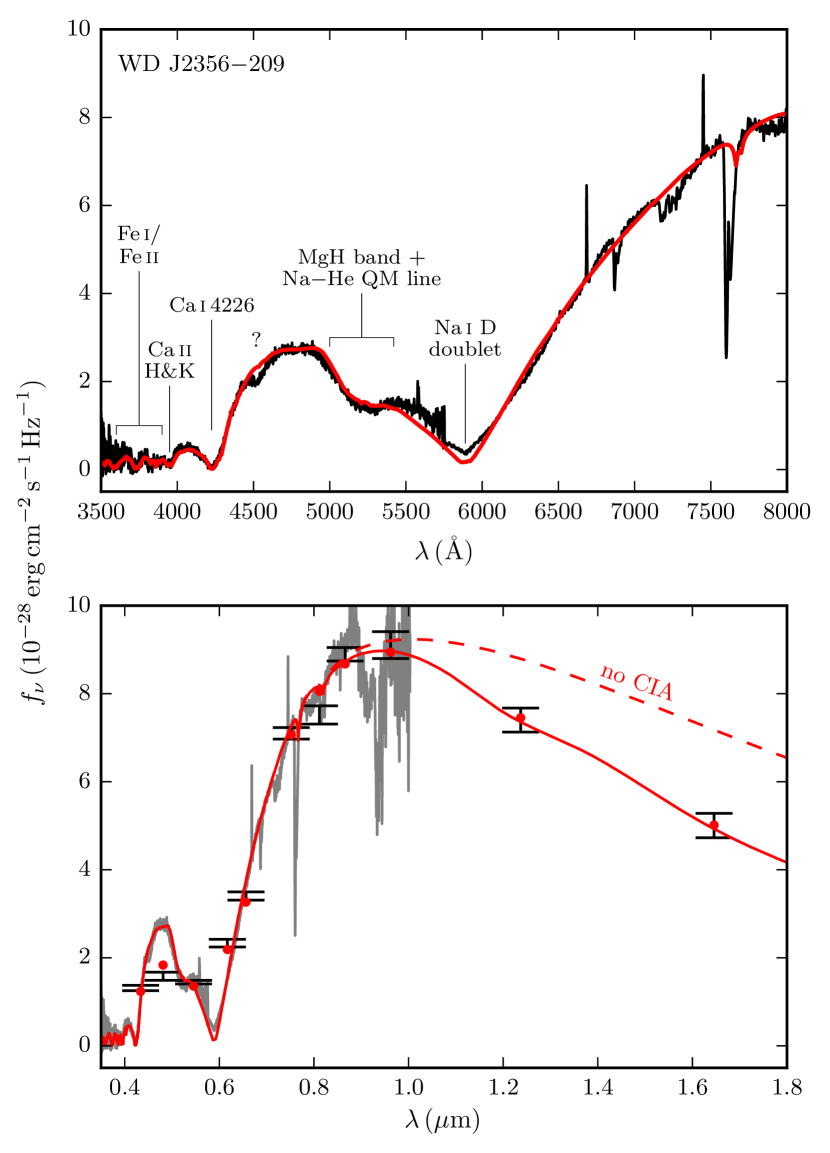
We rely on the and photometry of WD J2356209 to find its effective temperature, surface gravity and H/He abundance ratio. More specifically, the solid angle and are found by fitting the model fluxes to the spectral energy distribution. Since the distance is already known from the Gaia parallax, we can obtain the radius from the solid angle. The mass of the white dwarf (and the corresponding surface gravity) are then found using the evolutionary models of Fontaine et al. (2001) with C/O cores, and , which are representative of helium-atmosphere white dwarfs. The H/He abundance ratio is inferred from the infrared photometric measurements, which are affected by the presence of HHe collision-induced absorption (CIA, Jørgensen et al., 2000; Blouin et al., 2017). Once a photometric solution is found, we use the spectroscopic data to constrain the abundances of Na, Ca, Fe and Mg. In particular, the Na I D doublet is used to derive the Na/He ratio, the Ca I 4226 Å and Ca II H & K lines for Ca/He, Fe I and Fe II lines in the 3600–3800 Å region for Fe/He, and the MgH rovibrational bands between 5000 and 5300 Å for Mg/He. Once the heavy element abundance ratios are found, the whole fitting procedure – including the photometric fit – is repeated until internal consistency is reached.
Figure 2 compares our best solution to the photometric and spectroscopic data. Except for the core of the Na I D doublet and an unknown feature near 4500 Å, our fit is in excellent agreement with the observations across all wavelengths. In particular, our spectroscopic fit closely matches the Fe lines at small wavelengths, the Ca II H & K and Ca I 4226 Å lines, the blue and red wings of the Na I D doublet, and the flux depletion between 5000 and 5500 Å. Note that due to strong telluric absorption we could not use the Na I doublet at 8200 Å to validate the sodium abundance inferred from the Na I D doublet. Regarding the photometric fit, we found that a mix H/He atmosphere has to be assumed to produce the HHe CIA that is required to properly match the and bands.
The atmospheric parameters of WD J2356209 are given in Table 1. Its very cool temperature of makes it – to our knowledge – the oldest known DZ star, with a cooling age of .444Note that Giammichele et al. (2012) found a greater cooling age () for WD 2251070. However, their analysis was based on a model atmosphere code (Dufour et al., 2007) that did not include a detailed description of the high-density effects arising at the photosphere of such a cool object. Our reanalysis of WD 2251070 (Section 4.3) suggests that it has an effective temperature and a surface gravity , which corresponds to a cooling age of .
Table 1 also lists the constraints on metal abundance ratios in the atmosphere of WD J2356209. Apart from the sodium abundance, which is further discussed in Section 5, all abundances are close to the average values measured in metal-polluted atmospheres. In particular, in a ternary diagram of Ca, Mg and Fe abundances (e.g., Hollands et al., 2018, Figure 2), WD J2356209 would be close to the bulk of DZ stars. The constraints on Al, K, Ti, Cr, Mn and Ni, for which no feature is observed in the spectrum of WD J2356209, were found by raising their abundances up to the point where a spectral line should be visible. Note that the constraint on the K/He ratio was found using the spectrum of Oppenheimer et al. (2001) instead of the LRIS spectrum, since the latter shows strong telluric features near the K I 7665/7699 Å lines (see Figure 1). The constraint on C/He was established using the C2 rovibrational bands instead of the atomic carbon lines, since the former require a smaller carbon abundance before being visible in the spectrum. Finally, no firm constraints could be found for the abundances of O and Si, since even the addition of a very large amount of these elements does not result in any visible spectral lines. The limits for O/He and Si/He given in Table 1 are therefore lower-bound estimates of the maximum abundance of these elements that is compatible with the spectroscopic observations of WD J2356209.
| Parameter | Value |
|---|---|
| aaAll abundances are reported as ratios of number densities | |
| bbThe abundances in parentheses are not firm limits (see text) | |
Our excellent fit to the wings of the broad Ca and Na spectral lines of WD J2356209 (Figure 2) was made possible thanks to the improved lines profiles implemented in our models (Allard & Alekseev, 2014; Allard et al., 2014). This good agreement indicates that our model predicts the right physical conditions in the line-forming regions of the atmosphere. In particular, it suggests that the total number density is accurate, since it is the parameter that governs the broadening of the spectral lines. At the photosphere of WD J2356209, the pressure is high enough () that deviations from the ideal gas law begin to be important (see Figure 4 of Paper I). If the ideal gas law was assumed, would be 20% higher and the line profiles would be slightly broader (particularly the Na I D doublet). Note though that WD J2356209 cannot be used to validate our implementation of pressure ionization, since its photospheric density () is too small to induce significant deviations from the ideal Saha equation (Kowalski et al., 2007, Paper I).
4.1. Collision-induced absorption
Figure 3 compares the HHe CIA profiles obtained by different authors for physical conditions that are representative of the photosphere of WD J2356209. Differences between the profiles imply that the H/He ratio derived from the photometry depends on the choice of the CIA profiles implemented in our models. In particular, if the profiles of Jørgensen et al. (2000) were assumed, a smaller hydrogen abundance would be found. In fact, as already noted in Paper II, the profiles of Jørgensen et al. (2000) predict a too strong absorption in the region, possibly because the potential energy and induced dipole surfaces used to derive those profiles were computed with a smaller atomic orbital basis set.
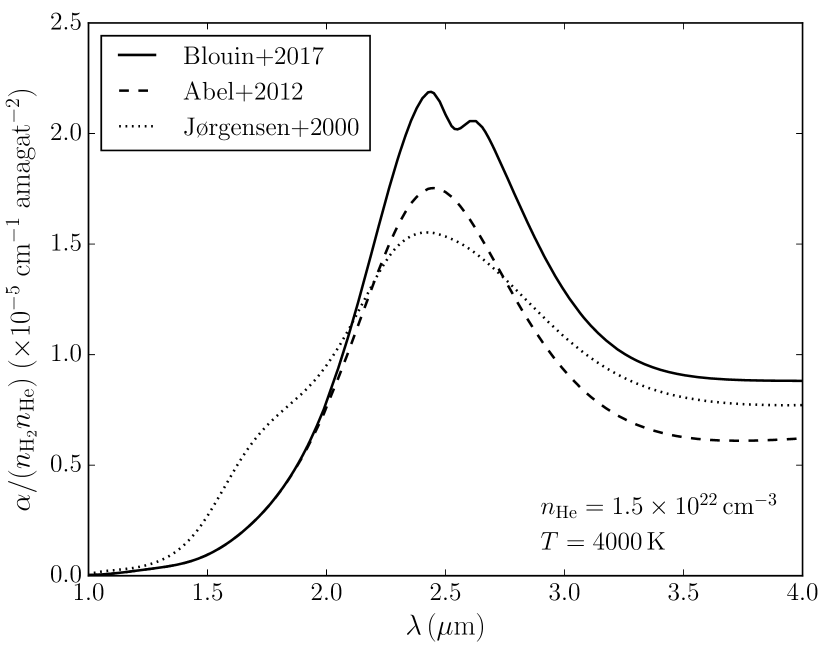
Furthermore, Figure 3 shows that significant differences between the profiles of Abel et al. (2012) and Blouin et al. (2017) appear above (particularly near the maximum of the fundamental band at ). Those differences are due to many-body collisions (which are only included in the profiles of Blouin et al.) that lead to an enhancement and a distortion of the absorption profile. The only photometric measurements available beyond the band are those from the Wide-field Infrared Survey Explorer (WISE, Wright et al., 2010) for the 3.4 and 4.6 m bands. Our best fit is compatible with those measurements, but their large uncertainties do not allow us to explicitly confirm that the CIA is indeed enhanced by many-body effects.
4.2. The NaHe satellite and the MgH bands
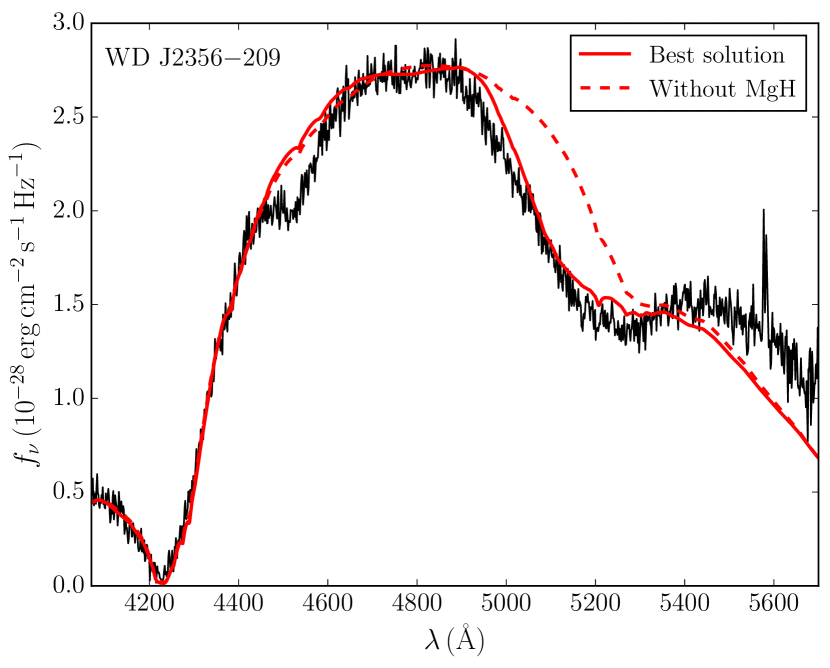
The wide absorption feature in the blue wing of the Na I D doublet proved particularly challenging to model. Allard et al. (2014) suggested that it could be the result of the quasi-molecular satellite feature arising from the NaHe interaction. Our detailed analysis reveals that it is only part of the explanation and that MgH rovibrational bands must be included to fully explain this absorption feature. Figure 4 compares our best fit to the 5000–5500 Å absorption feature with and without the MgH bands. Clearly, the NaHe satellite visible in the fit that omits the MgH bands (dashed line) is not sufficient to explain the whole absorption feature and MgH absorption bands must be invoked.
We emphasize that including MgH in our models is physically motivated. Given the temperature of WD J2356209, its hydrogen abundance (independently constrained from the HHe CIA) and the presence of magnesium (which is given by a Mg/Ca ratio that is very close to the value expected for chondrite-type material), MgH has to be present at the photosphere of WD J2356209. To our knowledge, this is the first detection of MgH molecular features in a white dwarf. MgH bands were proposed by Dufour et al. (2006) to explain the asymmetry of the Mg I 5175 Å line in G1657, but it was later shown that improved line profiles – beyond the impact approximation – are enough to explain this asymmetry (Allard et al., 2016). Finally, note that for our derived atmospheric parameters CaH is not sufficiently abundant to produce visible bands around 7000 Å.
4.3. The unknown absorption feature near 4500 Å
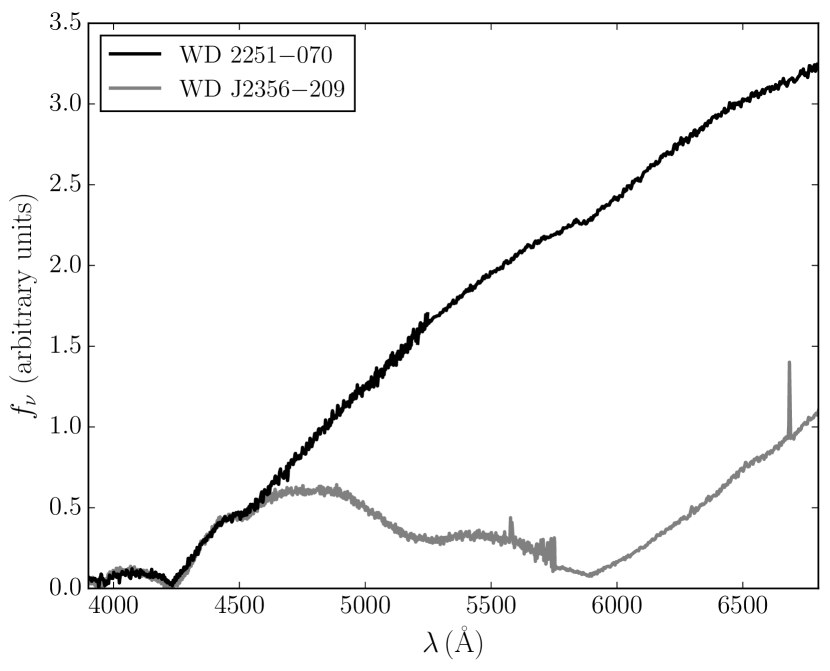
Our fit of WD J2356209 does not reproduce the small asymmetric absorption feature near 4500 Å (Figure 4). Technically, boosting the Ti/Ca ratio by a factor of with respect to chondritic abundances allows the Ti I multiplet (centered at 4535 Å) to be strong enough to reasonably match the absorption feature near 4500 Å. However, another cool DZ star, WD 2251070, offers good reasons to be suspicious of this interpretation.
Indeed, WD 2251070 also shows a strikingly similar absorption feature in that region (Figure 5). Using photometric and spectroscopic data reported in Bergeron et al. (1997) and Dufour et al. (2007), we analyzed WD 2251070 with our cool DZ grid. Our preliminary fit yields , , , and (an in-depth analysis of this object will be presented in N. F. Allard et al., in preparation). Given the strong similarities between WD 2251070 and WD J2356209 (i.e., same feature near 4500 Å, similar Ca abundances and virtually identical effective temperatures), it is very likely that the origins of the 4500 Å absorption feature are the same for both objects. If it is the case, then there is a good reason to reject Ti as the explanation for this feature. Boosting the Ti ratio to produce a sufficiently strong Ti I multiplet also implies that the similarly important multiplet (centered around 5020 Å) should be visible. By adjusting the Mg abundance, our fit of WD J2356209 could accommodate the additional opacity resulting from the Ti I multiplet. However, the spectrum of WD 2251070 clearly rules out the presence of any absorption feature around 5020 Å and thus suggests that Ti cannot be the explanation of the 4500 Å absorption feature.
Still, since we rely on Lorentzian line profiles for all Ti spectral lines, we need to be careful before completely ruling out Ti as the source of the 4500 Å feature. In principle, it is possible that accurate line profile calculations will show that the multiplet is flattened out under the density conditions encountered at the photosphere of WD 2251070 (). However, there is a second argument against the Ti scenario. We constrained the Na abundance in WD 2251070 to , implying that it has a ratio smaller than . This ratio is vastly different from the ratio found for WD J2356209 and we therefore expect the abundance pattern of WD 2251070 to be quite different from that of WD J2356209. In particular, it would be surprising if WD 2251070 and WD J2356209 had similar Ti/Ca ratios but significantly different Na/Ca ratios. All things considered, it is unlikely that the feature near 4500 Å is due to Ti.
Alternatively, since it is observed in two white dwarfs with similar Ca abundances, it is tempting to explain the 4500 Å feature as being due to Ca. In a dense helium medium, it turns out that the Ca II H & K profile can show a quasi-molecular feature near 4500 Å (Allard & Alekseev, 2014). However, for the physical conditions in the atmosphere of WD 2251070 and WD J2356209, this quasi-molecular line is predicted to be too weak to explain the shape of the spectrum around 4500 Å. We are therefore unable to identify the origin of this feature at the moment.
5. How to explain the high sodium abundance?
As it is well above the chondritic value of (Lodders, 2003), the ratio measured in WD J2356209 is surprising and needs to be explained. Note that this extreme abundance ratio is not only supported by our excellent fit to the observations (Figure 2), but also by the direct comparison of WD J2356209 to WD 2251070. While both objects have a very similar calcium abundance and a virtually identical effective temperature, their spectra are drastically different in the region affected by the Na I D doublet (as seen in Figure 5).
5.1. Comparison to other sodium-rich stars
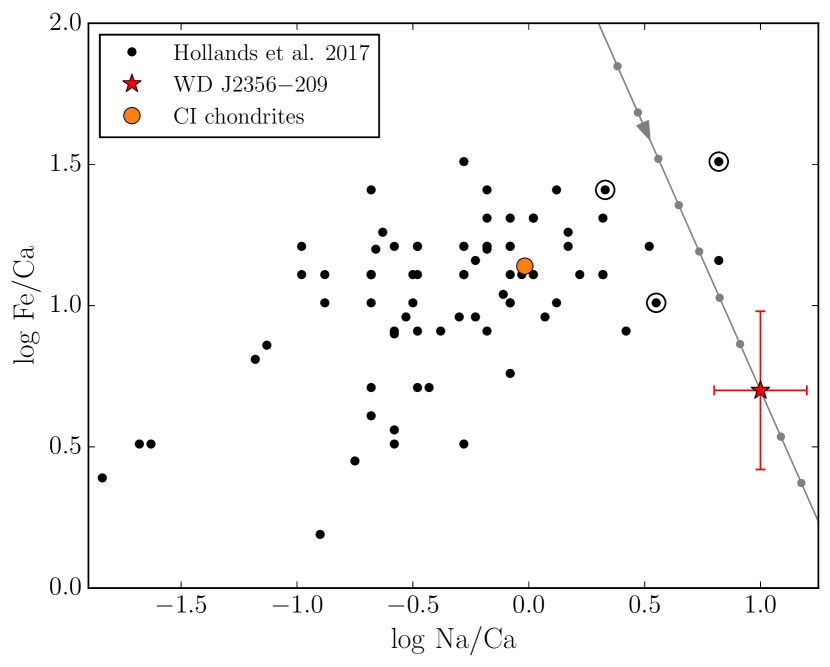
WD J2356209 is not the only white dwarf to have a high Na/Ca abundance ratio. A few objects with were identified by Hollands et al. (2017) and are shown in Figure 6. However, because of the very noisy spectra of many of those objects, the derived abundances are often highly uncertain. Using our own atmosphere model grid, we performed a reanalysis of this sample and we found that, within the uncertainties, most of those objects are compatible with a chondritic abundance ratio of (a detailed analysis will be presented in S. Coutu et al., in preparation). In fact, we found compelling evidence of a high Na/Ca abundance ratio only for three objects (SDSS J095645.14+591240.6, SDSS J164939.23+223807.2 and SDSS J212312.20+001653.5). Another potentially sodium-rich white dwarf, G7750, was analyzed by Farihi et al. (2011). They found a abundance ratio, but this result should also be taken with a grain of salt as the magnetism of this object complicates its analysis and the authors explicitly noted that their sodium abundance measurement is uncertain.
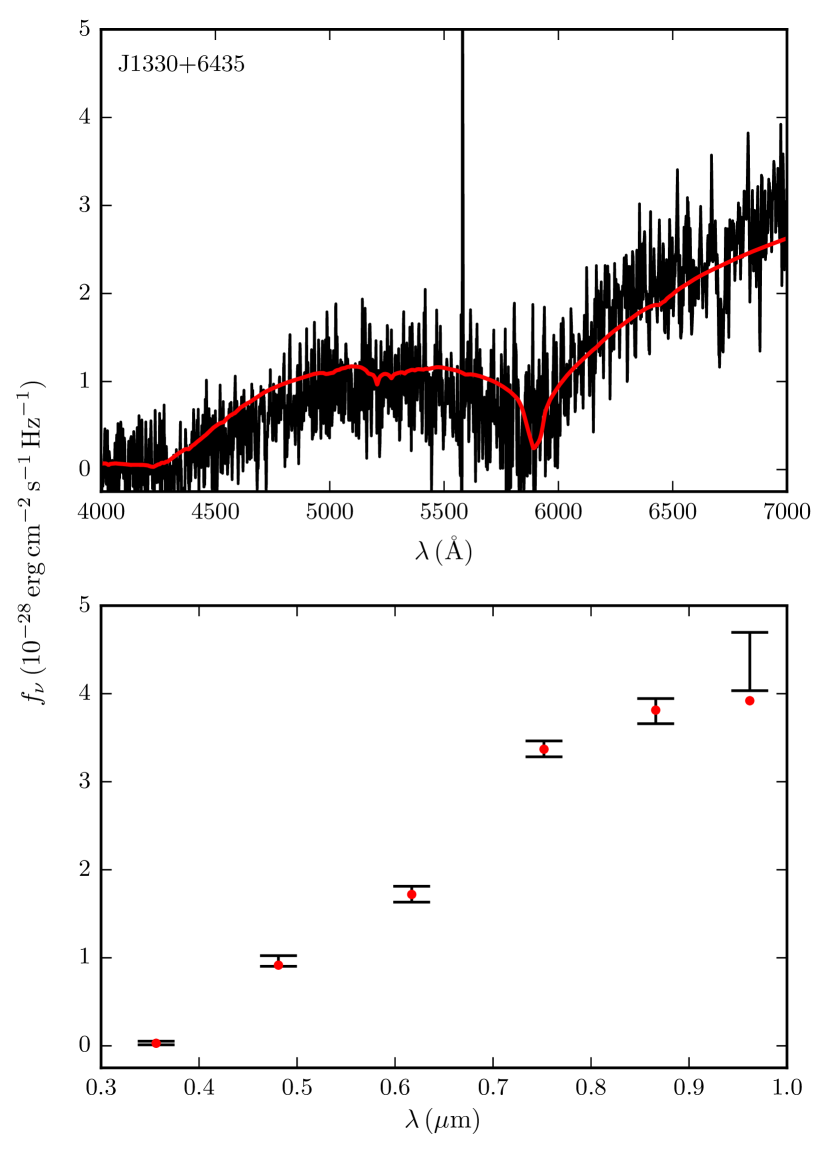
Furthermore, Harris et al. (2003) identified a faint () DZ star in the Sloan Digital Sky Survey (SDSS) that has a spectrum that also appears to show a broad Na line. As WD J2356209, the visible spectrum of SDSS J133001.13+643523.7 (J1330+6435) is dominated by a strong and broad Na I D doublet. Figure 7 shows our best solution for this star and Table 2 lists its derived atmospheric parameters. Note that a hydrogen-free atmosphere was assumed, since we do not have any infrared photometry to fit the H/He ratio to an eventual infrared flux depletion.555In any case, the addition of a moderate amount of hydrogen (up to ) does not change our conclusions on the Na/Ca abundance ratio of this object. The SDSS spectrum being noisy, the Ca/He and Na/He abundance ratios are subject to considerable uncertainties. Nonetheless, it is clear that the Na/Ca ratio of J1330+6435 is higher than average, but well below the extreme ratio found for WD J2356209. While there are some objects with a Na/Ca abundance ratio above the chondritic value, WD J2356209 is the most extreme case ever encountered.
| Parameter | Value |
|---|---|
5.2. Constraints on the accreted planetesimal
The abundances of heavy elements in a DZ star are indicative of the nature of the accreted parent body and can be used to infer its composition (Zuckerman et al., 2007; Koester et al., 2011; Dufour et al., 2012; Hollands et al., 2018; Harrison et al., 2018). Such studies have highlighted the existence of a great diversity of accreted bodies, ranging from Kuiper-Belt-Object analogs (Xu et al., 2017) to differentiated rocky bodies (Zuckerman et al., 2011; Melis & Dufour, 2017) and water-bearing planetesimals (Farihi et al., 2013; Raddi et al., 2015). Can we relate the high Na/Ca ratio of WD J2356209 to any solar system counterpart?
Table 3 lists the Na/Ca ratio of a few solar system objects. The only measurements compatible with the composition of WD J2356209 are those obtained for the dust of the comet 67P/Churyumov-Gerasimenko (67P). Those measurements were obtained by the COmetary Secondary Ion Mass Analyzer (COSIMA, Kissel et al. 2007) onboard the Rosetta spacecraft while it followed comet 67P at close distances for two years. Additionally, with the exception of Mn and Fe, the abundances of the other heavy elements in WD J2356209 are compatible with those measured in the dust of comet 67P (Figure 8).
| Object | aaRatio of number densities | Reference |
|---|---|---|
| WD J2356209 | This paper | |
| CI chondrites | Lodders (2003) | |
| Bulk Earth | Wang et al. (2018) | |
| Earth’s mantle | Wang et al. (2018) | |
| Earth’s crust | 0.00 | Rumble (2018) |
| Halley | Jessberger et al. (1988) | |
| 67P | Bardyn et al. (2017) |
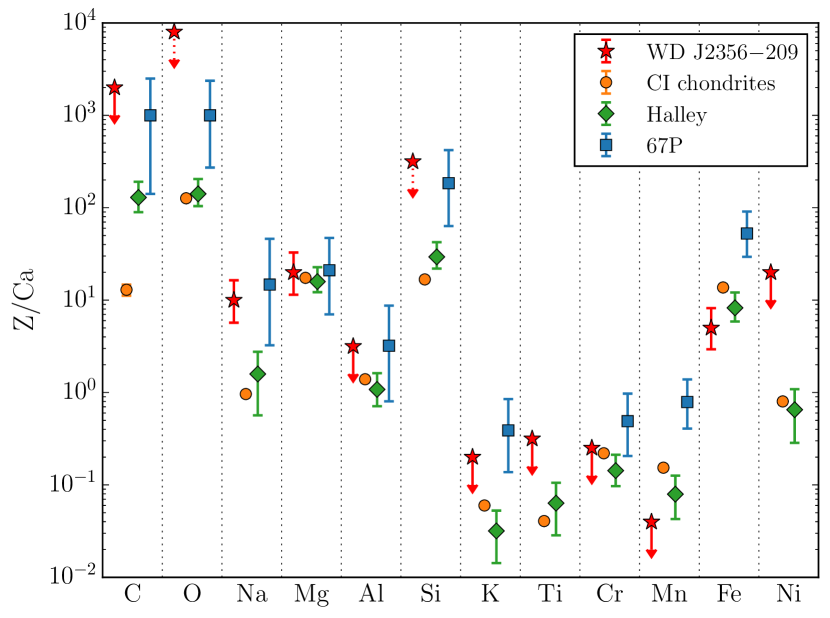
That being said, the total mass accreted by WD J2356209 is incompatible with the mass of a comet. By estimating the mass of metals currently in the convection zone, we can obtain a lower limit on the total accreted mass (it is a lower limit since diffusion might already have evacuated heavy elements from the convection zone). Using the envelope model code of Rolland et al. (2018), we find that the fractional mass of the convection zone is for a white dwarf with and . With this value, we find that the total mass in the convection zone of the four heavy elements clearly detected in WD J2356209 (Ca, Mg, Na and Fe) is . This value could significantly underestimate the total mass of metals currently in the convection zone, since it does not include C, O and Si, three elements that are expected to be particularly abundant (Figure 8). A higher estimate can be obtained by assuming that the accreted planetesimal had a chondritic composition relative to Ca and computing its total mass from the abundance of Ca detected in WD J2356209. Using the values published in Lodders (2003), this yields a mass of . This mass is significantly higher than the mass of comet 67P (, Pätzold et al., 2016) and that of the most massive comets of the solar system (Hale-Bopp has a mass of , Weissman, 2007), suggesting that a single comet cannot be the cause of the pollution of the atmosphere of WD J2356209. As the lower limit on the accreted mass is times higher than the mass of the largest comets, any scenario in which several comets were accreted can safely be rejected.
5.3. Relative diffusion
Alternatively, it is possible that the accreted planetesimal did not have an unusual composition and the extreme Na/Ca abundance ratio could simply be due to the different diffusion timescales of Na and Ca. In fact, for a cool helium-rich white dwarf like WD J2356209, diffusion-accretion equilibrium cannot be assumed (Koester et al., 2011; Hollands et al., 2018). This follows from the fact that the diffusion times are of the order of a few Myr (Paquette et al., 1986; Koester, 2009; Hollands et al., 2017), while the typical duration of an accretion episode is only of years (Jura, 2008; Kilic et al., 2008; Melis et al., 2011; Girven et al., 2012). It is therefore possible that WD J2356209 has stopped accreting and that the difference between the diffusion timescales of Na and Ca has led to a composition that is not representative of the accreted planetesimal.
Once the accretion episode has stopped, relative diffusion implies that a change will be accompanied by a variation of the Na/Ca abundance ratio given by (Hollands et al., 2018, Equation 3),
| (1) |
In WD J2356209, the diffusion timescale of Na is longer by a factor of than the diffusion timescale of Ca ( and ).666To estimate the diffusion timescales, we use the values given by Hollands et al. (2017) for SDSS J163601.33+161907.1, as this star has similar atmospheric parameters to WD J2356209. From Equation 1, it follows that every 1 dex decrease in is accompanied by a 0.4 increase in . If we assume for a moment that the accreted planetesimal had a chondritic composition with , it implies that the Ca abundance in the atmosphere of WD J2356209 was when the accretion episode stopped, some ago (Kawka & Vennes, 2016, Equation 4). This would raise our lower limit on the total accreted mass to , which corresponds to the mass of a very large asteroid (Vesta has a mass of , Russell et al., 2012). However, this scenario appears unlikely. Cool DZ stars are known to be much less polluted than hotter objects (Dufour et al., 2007; Koester et al., 2011; Hollands et al., 2017), possibly because the largest planetesimals are gradually scattered away from the planetary system (Veras et al., 2013, 2016; Hollands et al., 2018). In fact, according to the Montreal White Dwarf Database (Dufour et al., 2017), no known DZ star cooler than has a calcium abundance higher than .
More importantly, assuming that WD J2356209 accreted a planetesimal with a chondritic composition might not be a realistic hypothesis. Figure 6 shows how the composition of WD J2356209 is expected to have evolved given the diffusion timescales of Hollands et al. (2017). This evolution rules out the possibility that the accreted planetesimal had a chondrite-like composition. A more realistic hypothesis would probably be to assume that the accreted planetesimal had a sodium abundance ratio of , which corresponds to the region where the chemical evolution track of WD J2356209 intersects the middle of the distribution of objects plotted in Figure 6. In that case, the Ca abundance in the atmosphere of WD J2356209 when the accretion episode stopped ago (i.e., or ) would have been a less extreme and the lower limit on the accreted mass is decreased to . Assuming a typical asteroid density of , the accreted planetesimal had a radius of at least 100 km.
6. Conclusion
We presented a detailed analysis of WD J2356209, a very cool DZ star whose spectrum is dominated by a strong sodium feature. Thanks to our improved atmosphere models (Papers I and II), we find an excellent fit to the photometry and the visible spectrum, allowing the first reliable atmospheric parameter determination of this object. We found that WD J2356209 has a record sodium abundance with a number density ratio .
A possible explanation for this high sodium content is that WD J2356209 has accreted a planetesimal with an abnormally high sodium abundance and a total mass . However, we were unable to identify a solar system analog to this hypothetical planetesimal, since none of the examined candidates simultaneously matched the constraints on the sodium abundance and the total mass. Alternatively, the high sodium abundance in the atmosphere of WD J2356209 could be explained by the slower diffusion of Na with respect to Ca. According to this scenario, the accreted object would have had a less extreme composition but a larger total mass ().
This paper concludes the observational validation of our improved cool white dwarf model atmosphere code. The excellent fit obtained for this extreme object is a clear demonstration of the capacity of our models to properly take into account the nonideal effects that prevail in the atmospheres of cool white dwarfs. In the next paper of this series, we will use our improved models to analyze a large sample of cool white dwarfs and revisit their spectral evolution.
References
- Abel et al. (2012) Abel, M., Frommhold, L., Li, X., & Hunt, K. L. 2012, J. Chem. Phys., 136, 044319
- Allard et al. (1999) Allard, N., Royer, A., Kielkopf, J., & Feautrier, N. 1999, Phys. Rev. A, 60, 1021
- Allard & Alekseev (2014) Allard, N. F., & Alekseev, V. A. 2014, Advances in Space Research, 54, 1248
- Allard et al. (2003) Allard, N. F., Allard, F., Hauschildt, P. H., Kielkopf, J. F., & Machin, L. 2003, A&A, 411, L473
- Allard et al. (2014) Allard, N. F., Homeier, D., Guillon, G., Viel, A., & Kielkopf, J. 2014, Journal of Physics: Conference Series, 548, 012006
- Allard et al. (2018) Allard, N. F., Kielkopf, J. F., Blouin, S., et al. 2018, A&A, 619, A152
- Allard et al. (2016) Allard, N. F., Leininger, T., Gadéa, F. X., Brousseau-Couture, V., & Dufour, P. 2016, A&A, 588, A142
- Bardyn et al. (2017) Bardyn, A., Baklouti, D., Cottin, H., et al. 2017, MNRAS, 469, S712
- Baron & Hauschildt (1998) Baron, E., & Hauschildt, P. H. 1998, ApJ, 495, 370
- Becker et al. (2014) Becker, A., Lorenzen, W., Fortney, J. J., et al. 2014, ApJS, 215, 21
- Bergeron (2003) Bergeron, P. 2003, ApJ, 586, 201
- Bergeron et al. (2005) Bergeron, P., Ruiz, M. T., Hamuy, M., et al. 2005, ApJ, 625, 838
- Bergeron et al. (1997) Bergeron, P., Ruiz, M. T., & Leggett, S. K. 1997, ApJS, 108, 339
- Blouin et al. (2018a) Blouin, S., Dufour, P., & Allard, N. F. 2018a, ApJ, 863, 184
- Blouin et al. (2018b) Blouin, S., Dufour, P., Allard, N. F., & Kilic, M. 2018b, ApJ, 867, 161
- Blouin et al. (2017) Blouin, S., Kowalski, P. M., & Dufour, P. 2017, ApJ, 848, 36
- Chambers et al. (2016) Chambers, K. C., Magnier, E. A., Metcalfe, N., et al. 2016, ArXiv e-prints, arXiv:1612.05560
- Croll et al. (2017) Croll, B., Dalba, P. A., Vanderburg, A., et al. 2017, ApJ, 836, 82
- Dufour et al. (2006) Dufour, P., Bergeron, P., Schmidt, G. D., et al. 2006, ApJ, 651, 1112
- Dufour et al. (2017) Dufour, P., Blouin, S., Coutu, S., et al. 2017, in Astronomical Society of the Pacific Conference Series, Vol. 509, 20th European White Dwarf Workshop, ed. P.-E. Tremblay, B. Gaensicke, & T. Marsh, 3
- Dufour et al. (2012) Dufour, P., Kilic, M., Fontaine, G., et al. 2012, ApJ, 749, 6
- Dufour et al. (2007) Dufour, P., Bergeron, P., Liebert, J., et al. 2007, ApJ, 663, 1291
- Farihi et al. (2010) Farihi, J., Barstow, M. A., Redfield, S., Dufour, P., & Hambly, N. C. 2010, MNRAS, 404, 2123
- Farihi et al. (2011) Farihi, J., Dufour, P., Napiwotzki, R., & Koester, D. 2011, MNRAS, 413, 2559
- Farihi et al. (2013) Farihi, J., Gänsicke, B. T., & Koester, D. 2013, Science, 342, 218
- Farihi et al. (2009) Farihi, J., Jura, M., & Zuckerman, B. 2009, ApJ, 694, 805
- Fontaine et al. (2001) Fontaine, G., Brassard, P., & Bergeron, P. 2001, PASP, 113, 409
- Gaia Collaboration (2016) Gaia Collaboration. 2016, A&A, 595, A1
- Gaia Collaboration (2018) —. 2018, A&A, 616, A1
- Gänsicke et al. (2006) Gänsicke, B. T., Marsh, T. R., Southworth, J., & Rebassa-Mansergas, A. 2006, Science, 314, 1908
- Gänsicke et al. (2016) Gänsicke, B. T., Aungwerojwit, A., Marsh, T. R., et al. 2016, ApJ, 818, L7
- GharibNezhad et al. (2013) GharibNezhad, E., Shayesteh, A., & Bernath, P. F. 2013, MNRAS, 432, 2043
- Giammichele et al. (2012) Giammichele, N., Bergeron, P., & Dufour, P. 2012, ApJS, 199, 29
- Girven et al. (2012) Girven, J., Brinkworth, C. S., Farihi, J., et al. 2012, ApJ, 749, 154
- Harris et al. (2003) Harris, H. C., Liebert, J., Kleinman, S. J., et al. 2003, AJ, 126, 1023
- Harrison et al. (2018) Harrison, J. H. D., Bonsor, A., & Madhusudhan, N. 2018, MNRAS, 479, 3814
- Hauschildt & Baron (1999) Hauschildt, P. H., & Baron, E. 1999, Journal of Computational and Applied Mathematics, 109, 41
- Hauschildt et al. (1997) Hauschildt, P. H., Baron, E., & Allard, F. 1997, ApJ, 483, 390
- Hernando et al. (2008) Hernando, A., Barranco, M., Mayol, R., Pi, M., & Krośnicki, M. 2008, Phys. Rev. B, 77, 024513
- Hollands et al. (2018) Hollands, M. A., Gänsicke, B. T., & Koester, D. 2018, MNRAS, 477, 93
- Hollands et al. (2017) Hollands, M. A., Koester, D., Alekseev, V., Herbert, E. L., & Gänsicke, B. T. 2017, MNRAS, 467, 4970
- Homeier et al. (2005) Homeier, D., Allard, N., Allard, F., et al. 2005, in Astronomical Society of the Pacific Conference Series, Vol. 334, 14th European Workshop on White Dwarfs, ed. D. Koester & S. Moehler, 209
- Homeier et al. (2007) Homeier, D., Allard, N., Johnas, C. M. S., Hauschildt, P. H., & Allard, F. 2007, in Astronomical Society of the Pacific Conference Series, Vol. 372, 15th European Workshop on White Dwarfs, ed. R. Napiwotzki & M. R. Burleigh, 277
- Jessberger et al. (1988) Jessberger, E. K., Christoforidis, A., & Kissel, J. 1988, Nature, 332, 691
- Jørgensen et al. (2000) Jørgensen, U. G., Hammer, D., Borysow, A., & Falkesgaard, J. 2000, A&A, 361, 283
- Jura (2003) Jura, M. 2003, ApJ, 584, L91
- Jura (2008) —. 2008, AJ, 135, 1785
- Jura & Young (2014) Jura, M., & Young, E. D. 2014, Annual Review of Earth and Planetary Sciences, 42, 45
- Kawka & Vennes (2016) Kawka, A., & Vennes, S. 2016, MNRAS, 458, 325
- Kilic et al. (2008) Kilic, M., Farihi, J., Nitta, A., & Leggett, S. K. 2008, AJ, 136, 111
- Kissel et al. (2007) Kissel, J., Altwegg, K., Clark, B. C., et al. 2007, Space Sci. Rev., 128, 823
- Koester (2009) Koester, D. 2009, A&A, 498, 517
- Koester et al. (2011) Koester, D., Girven, J., Gänsicke, B. T., & Dufour, P. 2011, A&A, 530, A114
- Kowalski et al. (2007) Kowalski, P. M., Mazevet, S., Saumon, D., & Challacombe, M. 2007, Phys. Rev. B, 76, 075112
- Lodders (2003) Lodders, K. 2003, ApJ, 591, 1220
- McCook & Sion (1999) McCook, G. P., & Sion, E. M. 1999, ApJS, 121, 1
- Melis & Dufour (2017) Melis, C., & Dufour, P. 2017, ApJ, 834, 1
- Melis et al. (2011) Melis, C., Farihi, J., Dufour, P., et al. 2011, ApJ, 732, 90
- Melis et al. (2010) Melis, C., Jura, M., Albert, L., Klein, B., & Zuckerman, B. 2010, ApJ, 722, 1078
- Oke et al. (1995) Oke, J. B., Cohen, J. G., Carr, M., et al. 1995, PASP, 107, 375
- Oppenheimer et al. (2001) Oppenheimer, B. R., Hambly, N. C., Digby, A. P., Hodgkin, S. T., & Saumon, D. 2001, Science, 292, 698
- Paquette et al. (1986) Paquette, C., Pelletier, C., Fontaine, G., & Michaud, G. 1986, ApJS, 61, 197
- Pätzold et al. (2016) Pätzold, M., Andert, T., Hahn, M., et al. 2016, Nature, 530, 63
- Raddi et al. (2015) Raddi, R., Gänsicke, B. T., Koester, D., et al. 2015, MNRAS, 450, 2083
- Rocchetto et al. (2015) Rocchetto, M., Farihi, J., Gänsicke, B. T., & Bergfors, C. 2015, MNRAS, 449, 574
- Rolland et al. (2018) Rolland, B., Bergeron, P., & Fontaine, G. 2018, ApJ, 857, 56
- Rumble (2018) Rumble, J. R. 2018, CRC Handbook of Chemistry and Physics, 99th edn. (Boca Raton, FL: CRC Press/Taylor & Francis)
- Russell et al. (2012) Russell, C. T., Raymond, C. A., Coradini, A., et al. 2012, Science, 336, 684
- Salim et al. (2004) Salim, S., Rich, R. M., Hansen, B. M., et al. 2004, ApJ, 601, 1075
- Saumon et al. (1995) Saumon, D., Chabrier, G., & van Horn, H. M. 1995, ApJS, 99, 713
- Shayesteh et al. (2013) Shayesteh, A., Ram, R. S., & Bernath, P. F. 2013, Journal of Molecular Spectroscopy, 288, 46
- Tennyson & Yurchenko (2012) Tennyson, J., & Yurchenko, S. N. 2012, MNRAS, 425, 21
- Tennyson et al. (2016) Tennyson, J., Yurchenko, S. N., Al-Refaie, A. F., et al. 2016, Journal of Molecular Spectroscopy, 327, 73
- Vanderburg et al. (2015) Vanderburg, A., Johnson, J. A., Rappaport, S., et al. 2015, Nature, 526, 546
- Veras et al. (2013) Veras, D., Mustill, A. J., Bonsor, A., & Wyatt, M. C. 2013, MNRAS, 431, 1686
- Veras et al. (2016) Veras, D., Mustill, A. J., Gänsicke, B. T., et al. 2016, MNRAS, 458, 3942
- Wang et al. (2018) Wang, H. S., Lineweaver, C. H., & Ireland, T. R. 2018, Icarus, 299, 460
- Weck et al. (2003) Weck, P. F., Stancil, P. C., & Kirby, K. 2003, J. Chem. Phys., 118, 9997
- Weissman (2007) Weissman, P. R. 2007, in IAU Symposium, Vol. 236, Near Earth Objects, our Celestial Neighbors: Opportunity and Risk, ed. G. B. Valsecchi, D. Vokrouhlický, & A. Milani, 441–450
- Wright et al. (2010) Wright, E. L., Eisenhardt, P. R. M., Mainzer, A. K., et al. 2010, AJ, 140, 1868
- Xu et al. (2017) Xu, S., Zuckerman, B., Dufour, P., et al. 2017, ApJ, 836, L7
- Zuckerman & Becklin (1987) Zuckerman, B., & Becklin, E. E. 1987, Nature, 330, 138
- Zuckerman et al. (2011) Zuckerman, B., Koester, D., Dufour, P., et al. 2011, ApJ, 739, 101
- Zuckerman et al. (2007) Zuckerman, B., Koester, D., Melis, C., Hansen, B. M., & Jura, M. 2007, ApJ, 671, 872