Steady streaming viscometry of Newtonian liquids in microfluidic devices
Abstract
We report a novel technique capable of measuring the kinematic shear viscosity of Newtonian liquids with steady streaming in microfluidic devices. This probe-free microrheological method utilizes sub-kilohertz liquid oscillation frequencies around a cylindrical obstacle, ensuring that the inner streaming layer is comparable in size to the cylinder radius. To calibrate the viscometer, the evolution of the inner streaming layer as a function of oscillation frequency for a liquid of known viscosity is characterized using standard particle tracking techniques. Once calibrated, we show how the steady streaming viscometer can be used to measure low-viscosity liquids and volatile liquids.
Steady streaming flows have received a renewed interest over the past decade due to their numerous applications in microfluidic devices Friend and Yeo (2011); Wiklund et al. (2012). Here, steady streaming refers to the rectified flow Riley (2001) that occurs near the boundary of a rigid body of length-scale , oscillating with frequency and small-amplitude (), in a stationary incompressible fluid of kinematic viscosity . The magnitude of the characteristic streaming velocity scales as , where is the dimensionless amplitude and is the angular frequency. At small scales, these rectified flows have been shown to be useful in non-contact manipulation Amit et al. (2016), trapping Marmottant and Hilgenfeldt (2003); Lutz et al. (2006a); Lieu et al. (2012); Yazdi and Ardekani (2012), and sorting Wang et al. (2011); Thameem et al. (2017) of particles and cells as well as in enhancing pumping Girardo et al. (2008) and mixing Sritharan et al. (2006); Lutz et al. (2006b); Ahmed et al. (2009) at low Reynolds numbers. There are opportunities to use steady streaming for the rheology of liquids as well Vlassopoulos and Schowalter (1993).
Microrheology aims at measuring local material properties of small quantities of fluids by studying the relationship between deformation and stress. Optical microrheology techniques rely on the tracking of flow tracers under passive thermal fluctuations or active external forcing Waigh (2005); Squires and Mason (2010); Wilson and Poon (2011); Zia (2018). The development of microrheological methods for complex fluids and soft materials (Pipe and McKinley, 2009; Waigh, 2016) has been motivated by the advantages offered by microfluidic devices compared to conventional bulk techniques, such as small sample volume, reduction of free-surface effects, direct visualization of the underlying microstructure, and the ability to quantify low-viscosity and weakly viscoelastic solutions Giudice et al. (2017a, b). These specialized methods have been shown to measure material properties such as the steady shear viscosity Gupta et al. (2016), the most widely characterized material property, as well as the extensional viscosity Galindo-Rosales and Alves (2013); Haward (2016), and the longest relaxation time Giudice et al. (2015); Zilz et al. (2014) of various fluids.
Here, we aim to measure local material properties at the microscale, subject to independently controlled strain amplitude and frequency. We investigate the application of steady streaming for microrheology and experimentally demonstrate the measurement of kinematic shear viscosity of Newtonian liquids in microfluidic devices. The steady streaming regime of an oscillating cylinder Wang (1968); Chong et al. (2013); Coenen (2016) is dictated by the magnitude of the Reynolds number, , and the streaming Reynolds number, . Microscale streaming flows and applications have previously focused on ultrasonic frequencies and above ( kHz), typically induced by the interaction between a liquid and surface acoustic waves generated by piezoelectric transducers Friend and Yeo (2011); Yeo and Friend (2009). The streaming regime associated with high frequencies and streaming Reynolds numbers greater than unity () is that of a double streaming layer; an inner driving layer and an outer driven layer of the opposite sense. At high frequencies, the inner streaming region is confined to a thin layer near the cylinder surface making experimental studies of the inner region challenging and therefore less common Coenen (2016). By utilizing sub-kHz oscillation frequencies, our experiments constrain the streaming Reynolds number to always be less than unity (), ensuring that the inner streaming layer is comparable in size to the cylinder radius. Because the inner boundary layer thickness scales as , our approach characterizes the evolution of the inner streaming boundary layer as a function of oscillation frequency with standard particle tracking techniques.
Experiments were performed in microfluidic devices molded in PDMS, consisting of a straight channel mm long, mm wide, and m tall. Fixed cylindrical posts with radii of and m were manufactured along the center of the straight channel. An electroacoustic transducer was used to externally drive the liquid in a microfluidic device. An oscillatory flow field, , was setup in the channel over a range of frequencies Hz. The oscillation amplitude was independently controlled over a range of m such that all experiments were in the small-amplitude regime . The Reynolds number and the streaming Reynolds number correspond to a range of and , respectively, for deionized water ( m2/s) over the entire frequency range investigated here.
Tracer particles, m in diameter, were observed at the mid-height of the straight channel using bright field microscopy at and magnification. Images were acquired using CMOS cameras at sampling frequencies greater than (high-speed) or at frequencies that are perfect divisors (stroboscopic) of the oscillatory flow frequency. High-speed imaging provided high fidelity observation of the oscillatory flow component while stroboscopic imaging was used to characterize the secondary streaming flow component. Experiments were performed at room temperature, maintained at C.
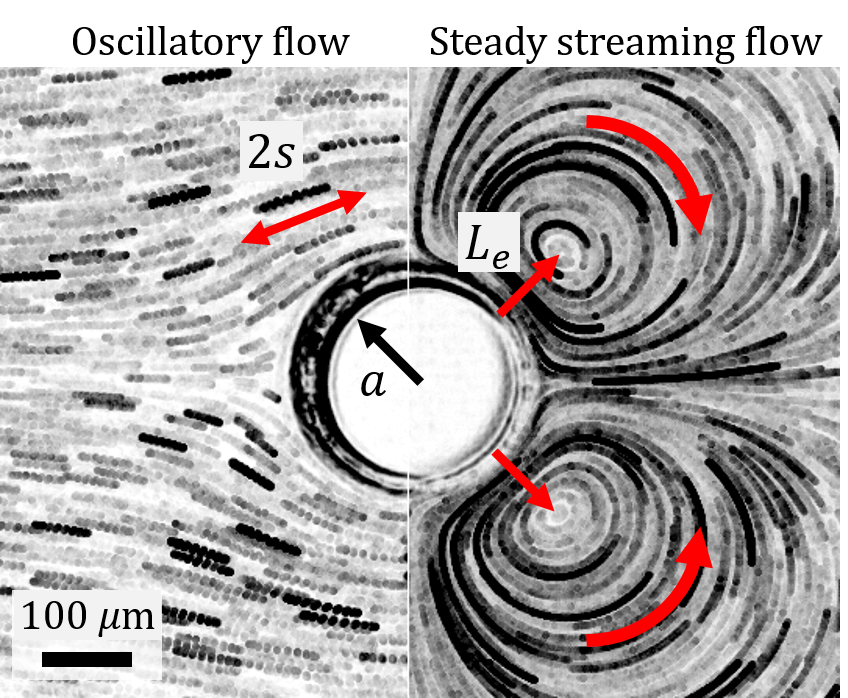
The oscillatory and steady streaming flow field of an incompressible Newtonian liquid near a PDMS cylinder of radius is illustrated in Figure 1. The oscillation amplitude is determined from the pathlines of individual tracer particles undergoing a single period of oscillation located far from the cylinder, approximately , where the flow is uniform. An example of a minimum projection image, captured with high-speed imaging, shows the pathlines of tracer particles near the cylinder (Fig. 1, left). When viewed stroboscopically, the secondary steady streaming flow component, rather than the oscillatory flow component, is observed. The steady streaming flow has a quadrupolar structure, consisting of four counter-rotating vortices centered a distance normal to the cylinder surface (Fig. 1, right). Flow is directed toward the cylinder boundary parallel to the oscillation direction and away from the cylinder boundary perpendicular to the oscillation direction (see supplementary movie).
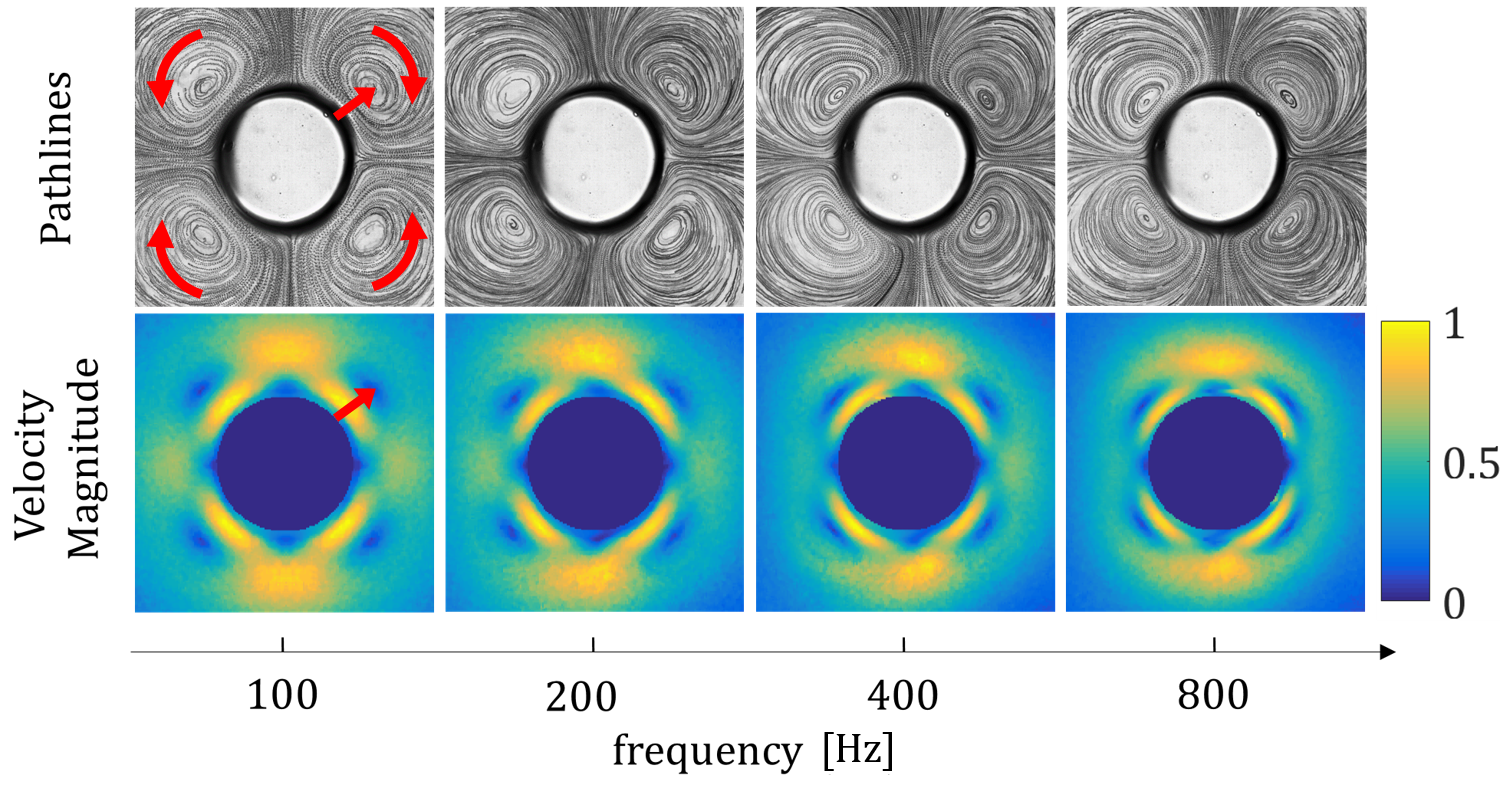
The evolution of the steady streaming flow profile with increasing frequency for water is shown in Figure 2. The four counter rotating vortices are identified with tracer particle pathlines (Fig. 2, top row). The magnitude of the 2D velocity field, obtained using standard particle tracking velocimetry (PTV) routines Ouellette et al. (2006), clearly shows the location of the central vortices with respect to the cylinder boundary (Fig. 2, bottom row). The eddy center location, , decreases in magnitude and approaches the cylinder surface as the oscillation frequency is increased.
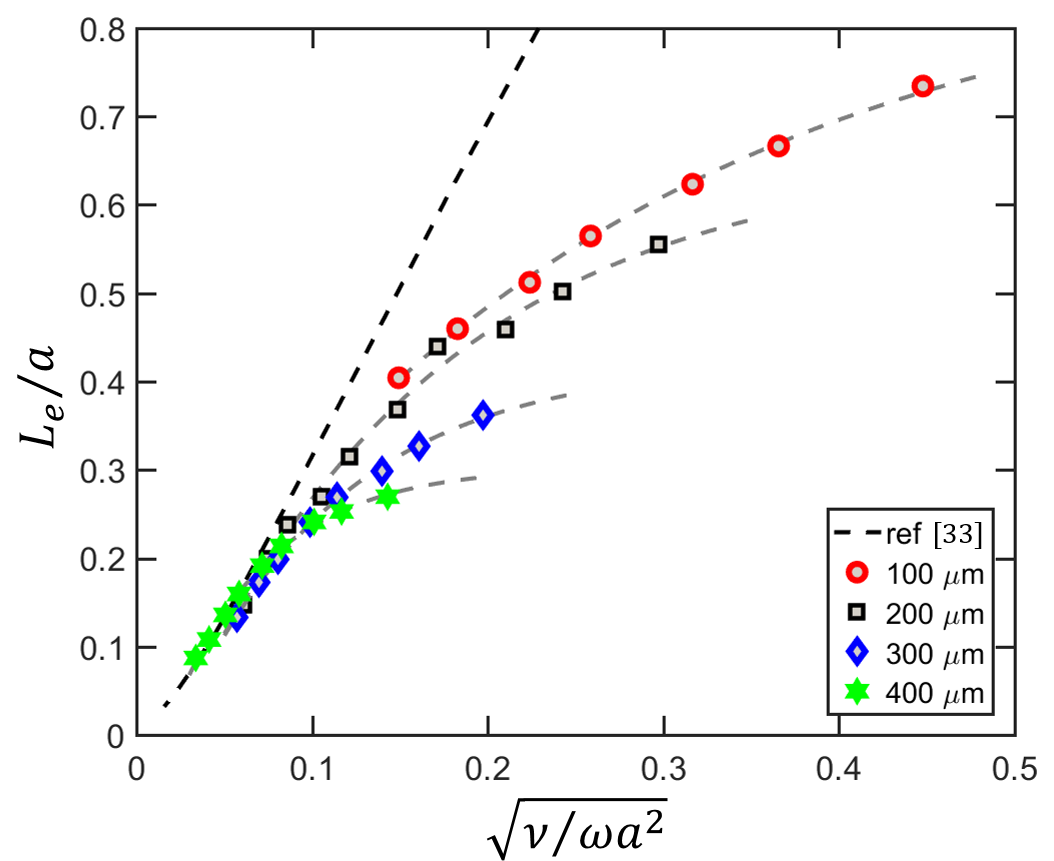
The dimensionless eddy center location increases monotonically with increasing dimensionless Stokes length (Fig. 3). In this case, the Newtonian liquid used was deionized water with m2/s. For small Stokes lengths (), the dimensionless eddy center increases linearly, in good agreement with the theoretical treatment by Holtsmark et al. Holtsmark et al. (1954) (Fig. 3, black dashed line). For larger Stokes lengths (), the location of the dimensionless eddy center diverges from the linear behavior and approaches a fixed value of . The plateauing behavior, for values of , is attributed to the singular growth in the size of the dimensionless inner streaming layer Bertelsen (1974). As a consequence, the confinement effect of the device boundaries are felt very close to the cylinder, even for channel width to cylinder radii ratios of greater than . The plateau behavior is related to the channel width (in our case is fixed) to cylinder radius ratio and therefore largest for the m cylinder and smallest for the m cylinder.
Since the behavior was consistent for cylinders of different radii, calibration curves were generated by fitting an exponential function, , to the experimental data, where is approximately unity (Fig. 3, grey dashed lines). Therefore, the kinematic viscosity of a Newtonian liquid can be determined by measuring the location of the dimensionless eddy center for given microfluidic device with cylinder radius and angular frequency . Microfluidic devices with a m cylinder radius provided the largest dynamic range in measurements of for the range of operation frequencies. Therefore, the m radius cylinder was utilized for the measurements of the kinematic viscosity of Newtonian liquids.
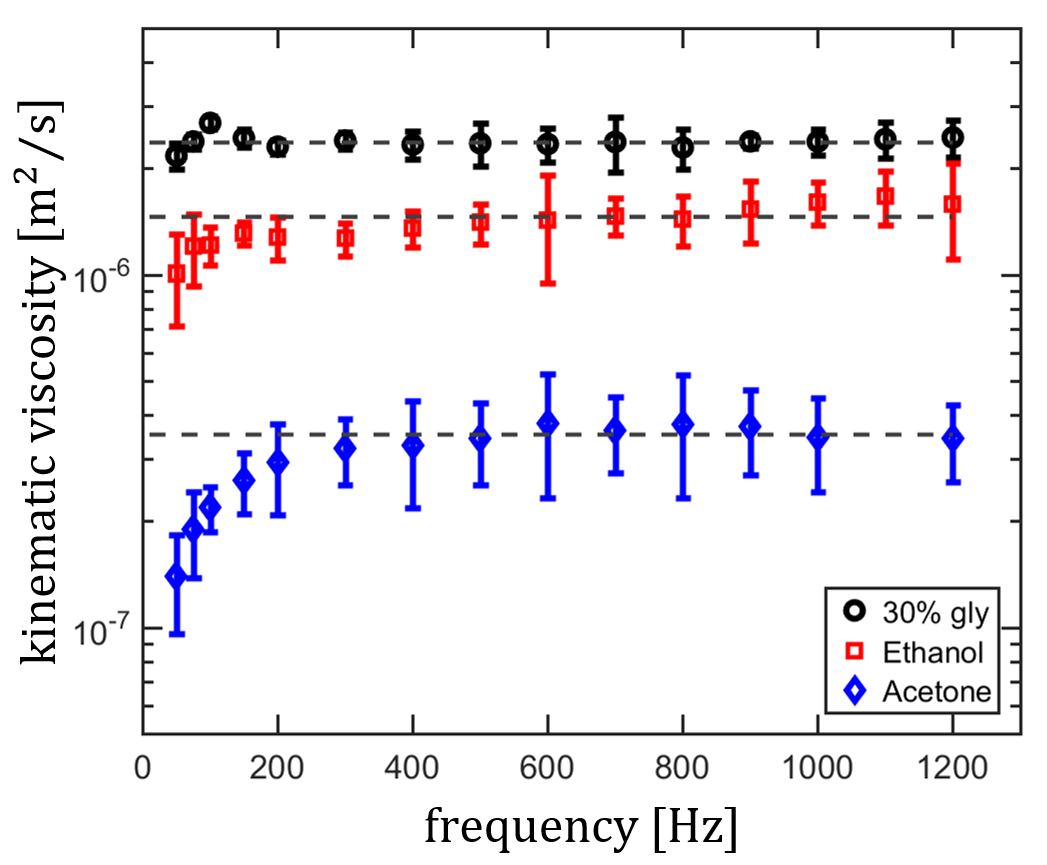
The kinematic viscosity of three different Newtonian liquids was determined from the steady streaming profiles in microfluidic devices (Fig. 4). The Newtonian liquids used were acetone, ethanol, and an aqueous solution of glycerol by weight. For frequencies greater than Hz, the reported measurements of kinematic viscosity are approximately constant, or independent of oscillation frequency. Therefore, to obtain a single value of the kinematic viscosity, measurements for frequencies of Hz and greater were averaged together.
The average values of kinematic viscosity are represented by grey dashed lines in Figure 4. The kinematic viscosity of acetone was measured to be m2/s, which is within of the expected value Howard and Pike (1959). The kinematic viscosity of ethanol was measured to be m2/s, which is within of the expected value Soliman and Marschall (1990). Finally, the kinematic viscosity of the glycerol (w/w) solution was measured to be m2/s, which is within of the expected value Gly (1963).
The performance of our technique was compared against tabulated values of kinematic viscosity under similar temperature conditions Howard and Pike (1959); Soliman and Marschall (1990); Gly (1963). The accuracy of our measurements ranged from within to , even for volatile liquids, such ethanol and acetone. The largest discrepancy, in the case of acetone, was primarily due to evaporation and consequent bubble formation at the interface with the external driving mechanism. This caused secondary flows that interfered and distorted the inner streaming vortices resulting in relatively large error, particularly at frequencies less than Hz.
In this work, we have demonstrated the use of steady streaming for microfluidic viscometry of Newtonian liquids. This optical microrheological technique implements independent and precise control of the liquid oscillation amplitude and frequency to maintain the streaming Reynolds number to be less than unity (). By utilizing sub-kHz frequencies, we characterize the evolution of the inner boundary layer as function of oscillation frequency with standard particle tracking and flow visualization techniques of different Newtonian liquids. For a given calibrated device, the kinematic viscosity is inferred.
Like other microrheological techniques, our method has similar advantages such as small sample volume, reduced surface effects, and a well-defined channel geometry. One additional advantage is a reduced measurement time due to the short transient associated with the steady streaming viscometer, which is less than one second. While we used high-speed imaging and particle tracking techniques, they are not required to characterize the evolution of the inner streaming layer. Measurement of the eddy center location, , can be determined from visualization of the tracer particle pathlines obtained from stroboscopic imaging (Fig. 1, right and Fig. 2, top row). making this technique accessible to those without a high-speed camera. Finally, a major advantage of this technique is the ability to quantify volatile and low-viscosity liquids that could be problematic with conventional bulk rheoglogical methods. This technique could be useful in active microrheology of non-Newtonian fluids and further extended to investigate rate-dependent material properties and aging materials, such as viscoelastic liquids and biological fluids.
We want to thank Gwynn J. Elfring and Saverio E. Spagnolie for the invitation to present this work at the Banff International Research Station workshop, “Complex Fluids in Biological Systems”. We also want to thank Paulo E. Arratia for useful discussions and Jonathan B. Freund for feedback on the manuscript.
References
- Friend and Yeo (2011) J. Friend and L. Y. Yeo, Reviews of Modern Physics 83, 647 (2011).
- Wiklund et al. (2012) M. Wiklund, R. Green, and M. Ohlin, Lab on a Chip 12, 2438 (2012).
- Riley (2001) N. Riley, Annual Review of Fluid Mechanics 33, 43 (2001).
- Amit et al. (2016) R. Amit, A. Abadi, and G. Kosa, Biomedical Microdevices 18, 39 (2016).
- Marmottant and Hilgenfeldt (2003) P. Marmottant and S. Hilgenfeldt, Nature 423, 153 (2003).
- Lutz et al. (2006a) B. R. Lutz, J. Chen, and D. D. T. Schwartz, Analytical Chemistry 78, 5429 (2006a).
- Lieu et al. (2012) V. H. Lieu, T. A. House, and D. T. Schwartz, Analytical Chemistry 84, 1963 (2012).
- Yazdi and Ardekani (2012) S. Yazdi and A. M. Ardekani, Biomicrofluidics 6, 044114 (2012).
- Wang et al. (2011) C. Wang, S. V. Jalikop, and S. Hilgenfeldt, Applied Physics Letters 99, 034101 (2011).
- Thameem et al. (2017) R. Thameem, B. Rallabandi, and S. Hilgenfeldt, Physical Review Fluids 2, 052001 (2017).
- Girardo et al. (2008) S. Girardo, M. Cecchini, F. Beltram, R. Cingolani, and D. Pisignano, Lab on a Chip 8, 1557 (2008).
- Sritharan et al. (2006) K. Sritharan, C. J. Strobl, M. F. Schneider, A. Wixforth, and Z. Guttenberg, Applied Physics Letters 88, 054102 (2006).
- Lutz et al. (2006b) B. R. Lutz, J. Chen, and D. T. Schwartz, Analytical Chemistry 78, 1606 (2006b).
- Ahmed et al. (2009) D. Ahmed, X. Mao, J. Shi, B. K. Juluri, and T. J. Huang, Lab on Chip 9, 2738 (2009).
- Vlassopoulos and Schowalter (1993) D. Vlassopoulos and W. R. Schowalter, Journal of Non-Newtonian Fluid Mechanics 49, 205 (1993).
- Waigh (2005) T. A. Waigh, Reports on Progress in Physics 68, 685 (2005).
- Squires and Mason (2010) T. M. Squires and G. Mason, Annual Review of Fluid Mechanics 42, 413 (2010).
- Wilson and Poon (2011) L. G. Wilson and W. C. K. Poon, Physical Chemistry Chemical Physics 13, 10617 (2011).
- Zia (2018) R. N. Zia, Annual Review of Fluid Mechanics 50, 371 (2018).
- Pipe and McKinley (2009) C. J. Pipe and G. H. McKinley, Mechanics Research Communications 36, 110 (2009).
- Waigh (2016) T. A. Waigh, Reports on Progress in Physics 79, 074601 (2016).
- Giudice et al. (2017a) F. D. Giudice, S. J. Haward, and A. Q. Shen, Journal of Rheology 61, 327 (2017a).
- Giudice et al. (2017b) F. D. Giudice, M. Tassieri, C. Oelschlaeger, and A. Q. Shen, Macromolecules 50, 2951 (2017b).
- Gupta et al. (2016) S. Gupta, W. S. Wang, and S. A. Vanapalli, Biomicrofluidics 10, 043402 (2016).
- Galindo-Rosales and Alves (2013) F. J. Galindo-Rosales and M. A. Alves, Microfluidics and Nanofluidics 14, 1 (2013).
- Haward (2016) S. J. Haward, Biomicrofluidics 10, 043401 (2016).
- Giudice et al. (2015) F. D. Giudice, G. D’Avino, F. Greco, I. D. Santo, P. A. Netti, and P. L. Maffettone, Lab on a Chip 15, 783 (2015).
- Zilz et al. (2014) J. Zilz, C. Schäfer, C. Wagner, R. J. Poole, M. A. Alves, and A. Lindner, Lab on a Chip 14, 351 (2014).
- Wang (1968) C.-Y. Wang, Journal of Fluid Mechanics 32, 55 (1968).
- Chong et al. (2013) K. Chong, S. D. Kelly, S. Smith, and J. Eldredge, Physics of Fluids 25, 033602 (2013).
- Coenen (2016) W. Coenen, Proceedings of the Royal Society A 472, 20160522 (2016).
- Yeo and Friend (2009) L. Y. Yeo and J. R. Friend, Biomicrofluidics 3, 012002 (2009).
- Holtsmark et al. (1954) J. Holtsmark, I. Johnsen, T. Sikkeland, and S. Skavlem, The Journal of the Acoustical Society of America 26, 26 (1954).
- Ouellette et al. (2006) N. T. Ouellette, H. Xu, and E. Bodenschatz, Experiments in Fluids 40, 301 (2006).
- Bertelsen (1974) A. F. Bertelsen, Journal of Fluid Mechanics 64, 589–598 (1974).
- Howard and Pike (1959) K. S. Howard and F. P. Pike, Journal of Chemical and Engineering Data 4, 331 (1959).
- Soliman and Marschall (1990) K. Soliman and E. Marschall, Journal of Chemical and Engineering Data 35, 375 (1990).
- Gly (1963) Physical properties of glycerine and its solutions (Glycerine Producers’ Association, New York, 1963).