Compositional differences between the component stars of eclipsing close binary systems showing chemical peculiarities
Abstract
A spectroscopic study was carried out on the surface chemical abundances of CNO and several heavier elements in the primary and secondary components of 5 eclipsing close binaries around A-type (AR Aur, Aur, YZ Cas, WW Aur, and RR Lyn), in order to investigate the nature of chemical differences between both components (being comparatively slow rotators alike due to tidal synchronization). Regarding the systems comprising similar components, Aur and WW Aur were confirmed to exhibit no compositional difference between the primary and secondary both showing almost the same Am anomaly, though the chemical peculiarities seen in the component stars of AR Aur show distinct differences (HgMn star and Am star). In contrast, as to the systems (YZ Cas and RR Lyn) consisting of considerably different (A and early-F) components, the surface abundances are markedly different between the primary (Am) and secondary (normal). These observational results may indicate -dependent characteristics regarding the chemical anomalies of non-magnetic stars on the upper main sequence: (1) In the effective temperature range of , rotational velocity is the most important factor for determining the extent of Am peculiarity. (2) However, the emergence of Am phenomenon seems to have a lower limit at K, below which no abundance anomaly is observed regardless of stellar rotation. (3) The transition from Am anomaly (mild deficiency in CNO) to HgMn anomaly (unusually large N depletion) is likely to take place as increases from 10000 K to 11000 K.
keywords:
stars: abundances — stars: atmospheres — stars: binaries: eclipsing — stars: chemically peculiar — stars: early-type1 Introduction
The nature and origin of chemically peculiar stars (CP stars) seen in late B
through early F type stars of upper main sequence, which are divided into
several subgroups according to the type of peculiarity (e.g., Preston 1974),
has long been a matter of debate. Among these, commonly observed CP phenomena
among non-magnetic stars111This term “non-magnetic stars” is used to discriminate
them from those CP stars showing strong magnetic fields (up to –104
gauss) as well as specific abundance anomalies (e.g., overabundances of
Cr, Sr, or Eu). Recent high-precision polarimetric observations revealed that
weak magnetic fields do exist even in Am or HgMn stars. are HgMn stars
(mostly seen in late B dwarfs) and Am stars (metallic-lined A stars,
which are widely seen in early-A through early-F main-sequence stars).
Takeda et al. (2018c; hereinafter referred to as Paper I) very recently carried
out an extensive study of C, N, and O abundances for 100 sample stars (comprising
normal stars as well as Am/HgMn stars), motivated by the situation that
systematic investigation on these important light elements had been lacking,
and arrived at the following results:
— (1) Almost all stars (irrespective of being classified as peculiar or normal,
though with a tendency of larger anomaly for the former) show more or less CNO
deficits typically in the range of [C,N,O/H] ; i.e., no stars
turned out to show normal CNO abundances. Besides, distinctly large deficiencies
as much as dex are also shown for C or N by some CP stars ([C/H] for
late Am stars or [N/H] for HgMn stars of late B-type).
— (2) More useful information could be extracted by concentrating on the
homogeneous sample of 16 A-type stars belonging to the Hyades cluster, which must
have the same age and the same initial composition. In this way, we could confirm
the systematic increase of abundance peculiarity with a decrease in
(projected rotational velocity), which manifestly indicates that rotation is
the key factor responsible for controlling the extent of Am anomaly.
Therefore, result (1) suggests that CNO abundances are useful indicators for judging the degree of chemical peculiarity, which are applicable to wide variety of late B through early F stars regardless of whether or not being classified as peculiar. Besides, we learn from result (2) that studying and comparing the abundances of stars sharing homogeneous character (e.g., born at the same time with the same composition) is quite an effective approach for clarifying the nature of chemical anomaly.
It thus occurred to us to pay attention to the behavior of CNO abundances in the components of double-line spectroscopic binaries, which must have formed concurrently from the same gas such as the case of cluster stars. Distinct merits are also accompanied especially with eclipsing close binary systems, because stellar parameters (mass , radius , orbital inclination , etc) are well defined. In addition, since similar rotational velocities are realized for both components due to tidal synchronization, we would be able to check whether any other factor (apart from stellar rotation) affecting the chemical anomaly exists. Unfortunately, it is not an easy task to establish the abundances for both components of a spectroscopic binary, because lines of two stars are overlapped in a complex time-variable way depending on the orbital phase. Actually, such abundance studies of direct analyzing double-line spectra, which have occasionally been carried out since old days, are not regarded as sufficiently reliable, especially when weak lines are to be measured in a crowded spectrum.
However, the situation has dramatically changed nowadays thanks to progress of spectrum disentangling222 Some authors prefer to use the term “disentangling” to specifically imply iterative determination of orbital elements, which requires reliable radial velocities based on appropriately isolated spectra of both components, while simply using “separation” if only spectrum reconstruction of each component is involved. Note, however, that we use “disentangling” in the latter meaning in this paper. technique (e.g., Ilijić 2004 and the references therein), by which the genuine spectra of primary/secondary can be separately extracted from a set of double-line spectra sufficiently covering various orbital phases, making precise abundance determinations feasible for both components. Nevertheless, past applications of this technique to studying compositional differences of spectroscopic binaries comprising CP stars of late B through early F-type under question (Am stars, HgMn stars) are still only a few in number to our knowledge; e.g., Folsom et al. (2010) for AR Aur (B9V+B9.6V), Pavlovski et al. (2014) for YZ Cas (A2IV+F2V), and Torres et al. (2015) for V501 Mon (A6m+F0); and besides these studies do not seem to have paid much attention to CNO abundances of our interest.
Motivated by this situation, we decided to investigate the abundances of CNO (as well as several other elements derived as by-products) and how they differ between the components for 5 eclipsing binary systems comprising CP stars (AR Aur, Aur, YZ Cas, WW Aur, and RR Lyn), based on the adequately disentangled spectra of the primary and secondary, in essentially the same manner as done in Paper I. These 5 systems, which were selected because sufficient observational data covering various phases (necessary for spectrum disentangling) are available, can be divided into two groups: “similar-component” group (AR Aur with late-B stars, Aur with early-A stars, and WW Aur with mid-A stars) and “different-component” group (YZ Cas with early-A and early-F stars, RR Lyn with late-A and early-F stars). In what follows are the check points we would like to elucidate in this study.
-
•
All the component stars of our targets (with spectral types of late B through early F) are slow rotators ( 10–40 km s-1) because rotation and orbital motion are almost synchronized in such close binary systems (orbital period is 3–10 day). Then, according to our knowledge, we may expect that all these stars would more or less exhibit chemical peculiarities. Could we really confirm this?
-
•
Regarding the systems of “similar-component” group, almost the same abundances should be observed for both components according to our naive expectation because differences in stelar parameters (including rotational velocities) are fairly small. What about the observational results on this point?
-
•
As to the binary systems belonging to “different-component” group, the primary and secondary stars have distinctly different from each other. Could we detect any compositional differences between the two? If so, this may provide us with useful information regarding -dependence of chemical peculiarities.
2 Observational data
2.1 Observations
The observations of our 5 program stars (AR Aur, Aur, YZ Cas, WW Aur, and RR Lyn; cf. Table 1 for the basic data) were carried out on 2010 December 14, 15, 16, 18, and 20 by using BOES (Bohyunsan Observatory Echelle Spectrograph) attached to the 1.8 m reflector at Bohyunsan Optical Astronomy Observatory. Using 2k4k CCD (pixel size of 15 m 15 m), this echelle spectrograph enabled us to obtain spectra of wide wavelength coverage (from 3800 Å to 9200 Å). We used 200m fiber corresponding to the resolving power of . The total integration time for one observation (consisting of 2–3 successive frames to be co-added) was chosen to be 10–60 minutes depending on the brightness of a target. Each of the program stars were observed 1–3 times in a night with an interval of a few hours, though the actual frequency differed from star to star. Thus, as a result of 5-night observations, we could obtain 53 spectra for these 5 targets, which consist of 9–11 spectra per each star corresponding to different observational times. The fundamental information (spectrum code and observational time in Julian day) for each of the 53 spectra is presented in Table 2.
The reduction of the echelle spectra (bias subtraction, flat fielding, spectrum extraction, wavelength calibration, and continuum normalization) was carried out by using the software package IRAF (Image Reduction and Analysis Facility).333 IRAF is distributed by the National Optical Astronomy Observatories, which is operated by the Association of Universities for Research in Astronomy, Inc. under cooperative agreement with the National Science Foundation.
2.2 Spectrum disentangling
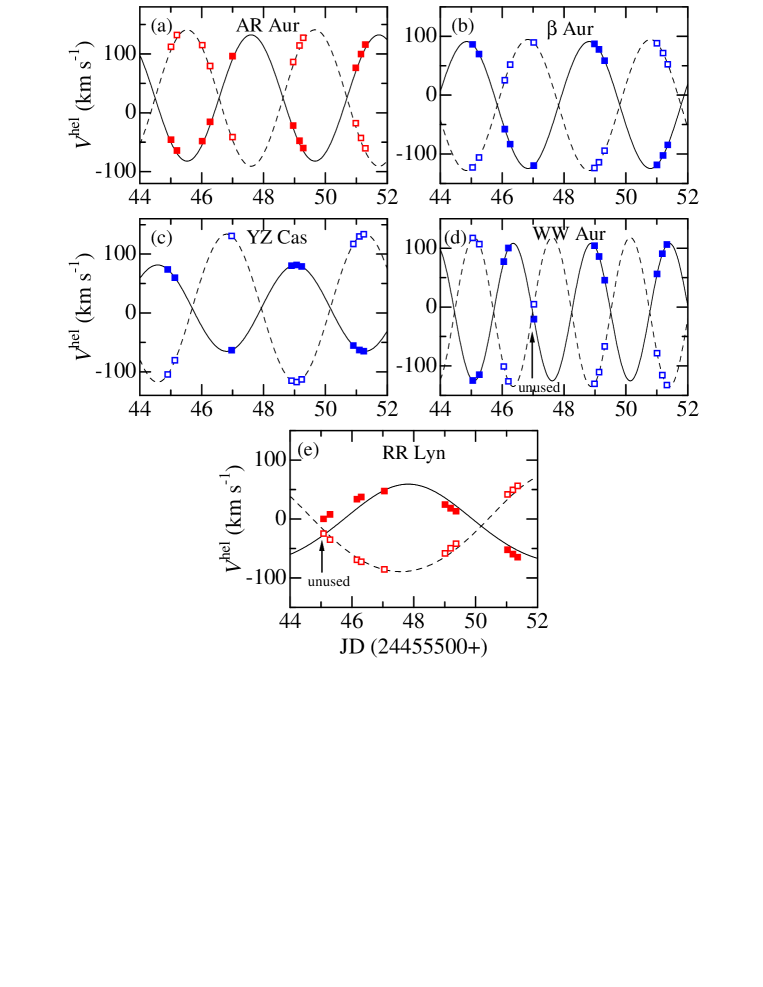
It is essential to correctly specify the local radial velocities for the primary () and the secondary () corresponding to each spectrum, in order to successfully obtain the disentangled spectra of both components. For this purpose, we first evaluated the predicted and at each relevant observational time as presented in Table 2 (7th and 8th columns), where we employed the ephemeris data of primary minimum (taken from the web site of General Catalogue of Variable Stars444Available at http://www.sai.msu.su/gcvs/gcvs/index.htm.; Samus et al. 2017) and the orbital elements (taken from the compilation of Eker et al. 2014) summarized in Table 1. Then, we simulated the theoretical double-line profile of O i 7771–5 triplet corresponding to such evaluated and by using the spectrum-synthesis technique, which was further compared with the observed profile in order to check whether both agree well with each other. While a satisfactory consistency was confirmed for Aur, YZ Cas, and WW Aur, small systematic differences (due to slight variation of system velocity?) were seen for AR Aur and appreciable phase-dependent disagreements (likely to be caused by inadequately computed phases) were observed for RR Lyn.555 Although we refrain from discussing the reason for the discrepancy, possible anomalies of radial velocity curves have occasionally been mentioned for these two stars. See, e.g., Wilson & Van Hamme (2014; Sect. 8 and the references therein) for AR Aur and Tomkin & Fekel (2006; Sect. 6.1 and the references therein) for RR Lyn. Therefore, we estimated the empirical radial velocities ( and ) by directly comparing the theoretical O i 7771–5 line profiles (simulated for various combinations of and ) with the observed one. These various kinds of radial velocities evaluated for each of the spectra are summarized in Table 2. The radial velocities of both components finally adopted for disentangling ( and for Aur, YZ Cas, and WW Aur; and for AR Aur and RR Lyn) are graphically depicted by symbols (converted to the heliocentric scale) in Fig. 1, where the predicted radial velocity curves are also shown for comparison. Note that 2 spectra for WW Aur (20101216A) and RR Lyn (20101214A) corresponding to eclipse phases were eventually not used, as indicated in Fig. 1 (by arrows) as well as in Table 2 (by parentheses).
We selected four wavelength regions of 50–60 Å width, for which disentangled spectra of both components are to be extracted: 5350–5400 Å, 6130–6180 Å, 7440–7500 Å, and 7750–7800 Å. The first three are obvious because we intend to determine the abundances of C, N, and O based on C i 5380, N i 7468, and O i 6156–8 lines, closely following Paper I. The inclusion of 7750–7800 Å region is to make use of the O i 7771–5 triplet lines, which are so strong and saturated as to be applied to checking (microturbulence) and to precisely determining (cf. Sect. 4.1). Another parameter necessary to specify for spectrum disentangling is the luminosity ratio of the primary and secondary () relevant for each wavelength region. We computed this ratio by using the emergent continuum fluxes ( and ) computed from Kurucz’s (1993) ATLAS9 program (corresponding to and for each star) and the stellar radii ( and ) as , where the stellar parameters were taken from Table 1. The resulting luminosity ratios are summarized in Table 3.
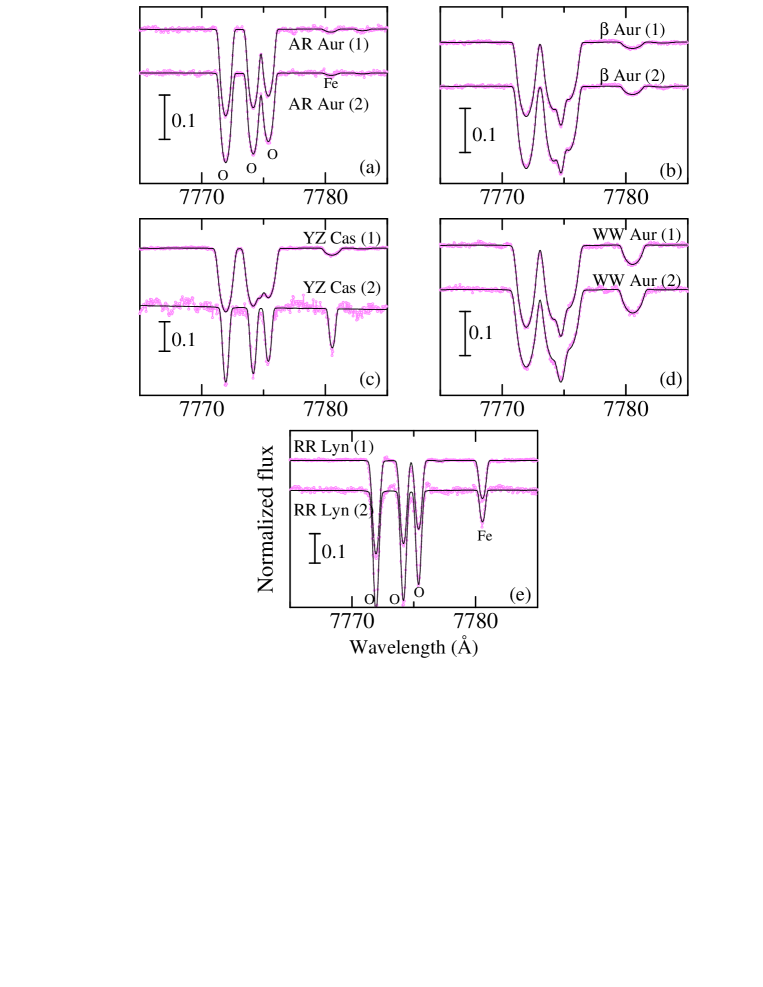
Regarding the software tool for spectrum disentangling, we made use of the public-domain program CRES666http://sail.zpf.fer.hr/cres/ written by S. Ilijić, as employed by Takeda, Hashimoto & Honda (2018b) for their study of Capella’s photospheric abundances. See Sect. 3 of their paper for more details of the procedures we adopted. We confirmed that the resulting disentangled spectra turned out quite satisfactory. The accomplished S/N ratios are sufficiently high ( 300–700), except for RR Lyn (2) ( 100–200) and YZ Cas (2) ( 70–90), as summarized in Table 4. Fig. 2 demonstrates how the pure primary and secondary spectra could be successfully extracted from a set of original spectra in the neighborhood of O i 7771–5. All these disentangled spectra (for 10 stars and 4 regions) used in this study are presented as on-line material (file name: all_spectra).
Finally, it should be remarked that our application of the spectrum disentangling method implicitly assumed that the line spectra and the brightness of each component did not show any time variability during the observed period, despite that the existence of small intrinsic spectrum variability (caused by chemical inhomogeneity on the surface?) has been reported for some of our program stars; e.g., for WW Aur (cf. Kitamura, Kim & Kiyokawa 1976) and AR Aur (cf. Folsom et al. 2010 and the references therein).
3 Abundance determination
3.1 Atmospheric parameters
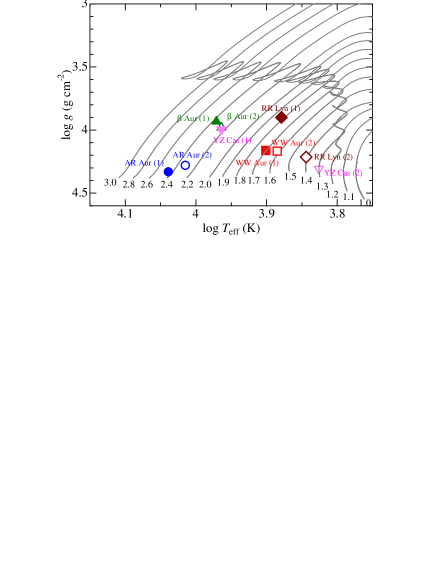
Regarding and necessary to specify the model atmosphere for each star, we adopted the values compiled by Eker et al. (2014) in this study (cf. Table 1). Here, we should note that, while these values are regarded as fairly precise (quoted errors are only 0.01–0.03 dex) for these eclipsing binary stars because and are well established, ’s are the photometry-based values and may not be so accurate. In Fig. 3 are plotted our 10 program stars on the vs. plane, where theoretical evolutionary tracks of solar-metallicity stars computed for various values are also depicted. We can see from this figure that the track-based is not consistent with the real for some cases (e.g., for WW Aur or RR Lyn), for which errors even larger than the nominal values ( 100–400 K) may be possible. The microturbulent velocities () were derived from by using the empirical relation [Eq. (1) in Takeda et al. (2008)] as done in Paper I, though appreciable ambiguities may be involved with them (cf. Sect. 4.1). In estimating abundance errors due to uncertainties in atmospheric parameters, we tentatively assume in this study K in , dex in , and % in . for all stars (which may be regarded rather as upper limits of actual errors).
3.2 Procedures
The determination of CNO abundances (synthetic spectrum fitting, evaluation of equivalent widths, error estimation) was done in essentially the same manner as adopted in Paper I, which should be consulted for the details (cf. Sect. 4 therein). We here remark only some differences specific to this study.
-
•
The O i 7771–5 triplet lines are also analyzed based on the 7750–7800 Å fitting, in a similar manner to the case of O i 6156–8, though this is mainly for the derivation of as well as for checking (rather than for O-abundance determination).
-
•
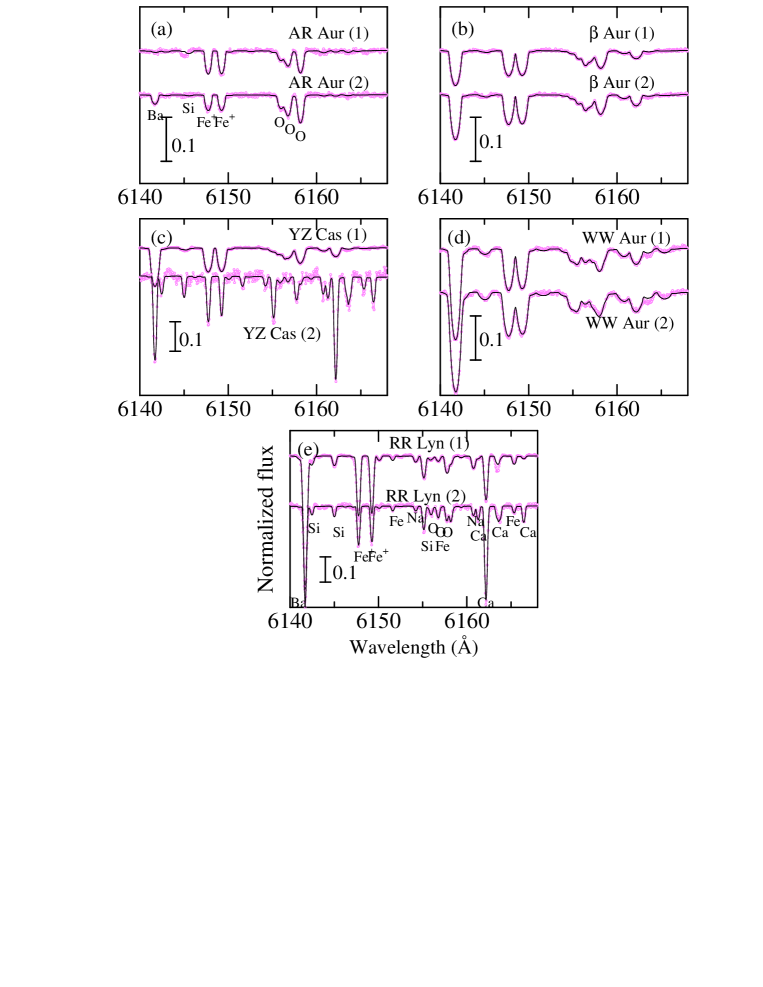
The wavelength range of spectrum fitting targeting O i 6156–8 lines was extended somewhat shortwards to include Ba ii 6141 line, in order to get information of Ba abundance.
-
•
We make use of the abundances of various elements other than CNO (specifically, Na, Si, Ca, Ti, Fe, and Ba), which are derived as by-products of spectrum fitting (though under the assumption of LTE), since they also serve as useful indicators of chemical peculiarities.
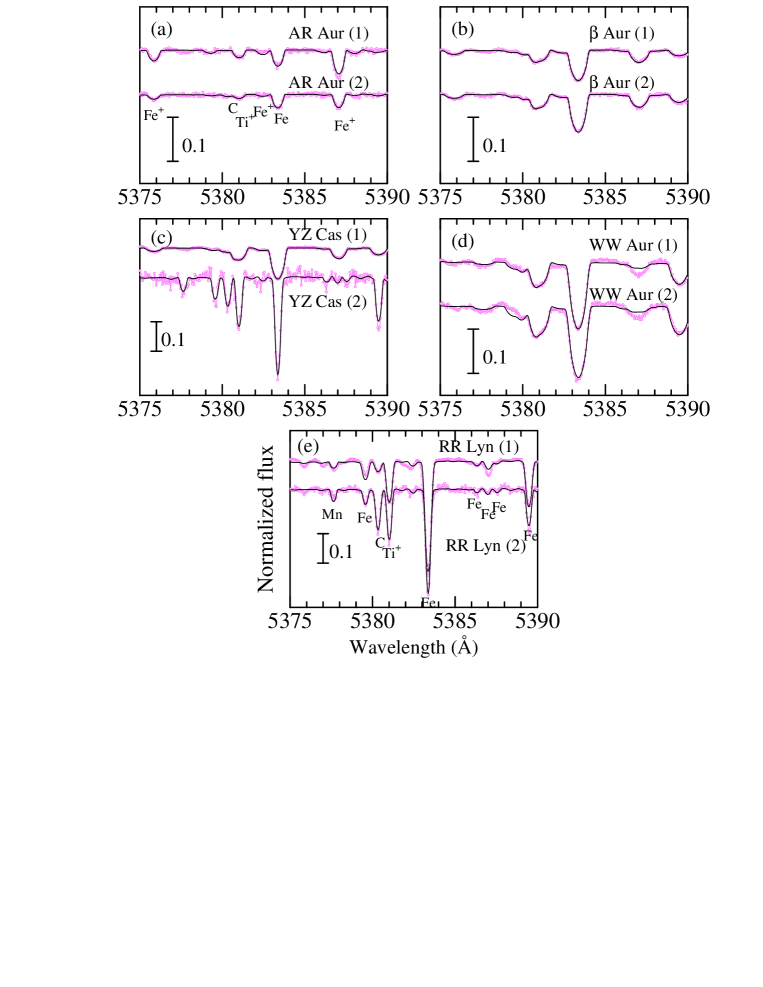
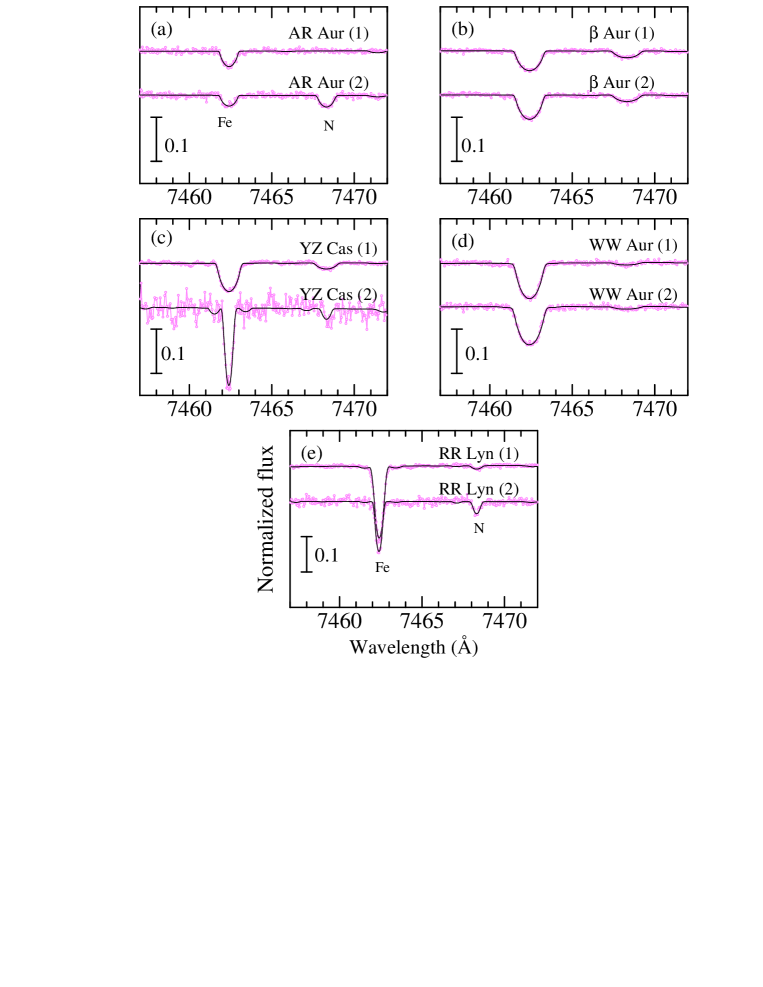
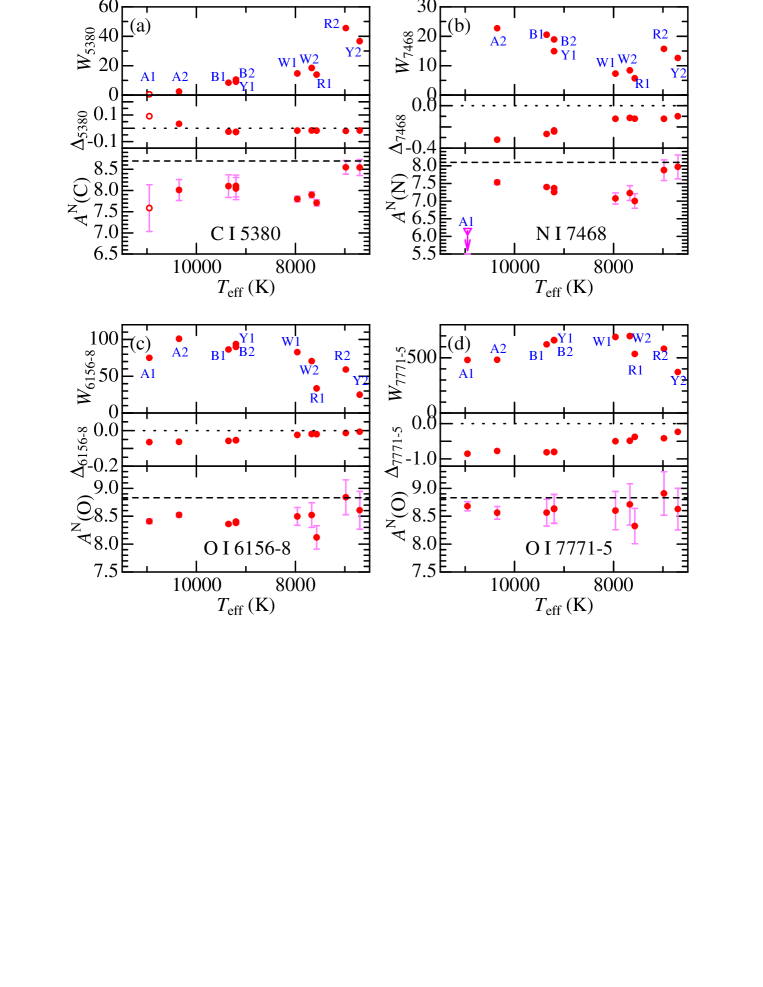
The details of spectrum fitting analysis (wavelength range, source of line data, varied abundances) done for four regions are presented in Table 5, and the basic atomic data of C i 5380, N i 7468, O i 6156–8, and O i 7771–5 lines are summarized in Table 6. The accomplished consistency between the theoretical spectrum (for the converged solutions) and the observed spectrum as a result of our fitting analysis is displayed in Fig. 4–7 for each region. In Fig. 8 are plotted the resulting equivalent width (), non-LTE correction (), and non-LTE abundance () for each of these CNO lines against , just like Fig. 5–7 of Paper I. More complete results of these CNO abundances (including errors and related quantities) and the abundances of other elements (Na, Si, Ca, Ti, Fe, and Ba) resulting from spectrum fitting as by-products are presented as online material (filename: abundances.dat). Besides, the abundances of Na, Si, Ca, and Ti for 100 A-type main-sequence stars targeted in Paper I, which were not published therein because the main focus was placed only on CNO, are also given as online material (filename: paperI_suppl.dat) for reference.
3.3 Impact of errors in the luminosity ratio
Here, as an additional error source specific to this study, it may be worth mentioning the effect of uncertainties in the luminosity ratio adopted for spectrum disentangling (cf. Sect. 2.2), since the emergent flux () would suffer some ambiguities due to errors in (typically by a few hundred K; cf. Sect. 3.1), although the radii () of both stars are precisely determined. Since is changed by 20–30% for an increase in by 1000 K, errors of several to % may be possible in the computed luminosity. As a test trial, we carried out spectrum disentangling in the 6130–6180 Å region by increasing the ratio by 10% (e.g., 0.542:0.458 instead of 0.518:0.482 for AR Aur or 0.793:0.207 instead of 0.777:0.223 for RR Lyn), and determined the abundances of O, Na, Si, Ca, Fe, and Ba in the same manner based on such specially reconstructed spectra with intentionally increased . Comparing the resulting abundances with the standard values, we found that the differences are generally insignificant (typically several hundredths dex), except for the strong/deep line cases of Ba or Ca (cf. Fig 6) where more appreciable abundance changes of 0.1–0.15 dex are seen (especially for YZ Cas (2) and RR Lyn (2)). This may be interpreted as due to the fact that an error in the zero-point level of the residual intensity, which is caused by inappropriately chosen luminosity ratio, significantly affects deep/strong lines but not shallow/weak lines (see footnote 12 in Takeda, Hashimoto, & Honda 2018b). Accordingly, as far as the abundances of C, N, and O derived from C i 5380, N i 7468, and O i 6156–8 lines (our main objective which we will discuss in Sect. 4.2) are concerned, this kind of error is of negligible importance, because these lines are sufficiently weak.
4 Discussion
4.1 Microturbulence and rotation
We start by mentioning about the stellar parameters ( and ) related to O i 7771–5 triplet, which was specially analyzed in this study.
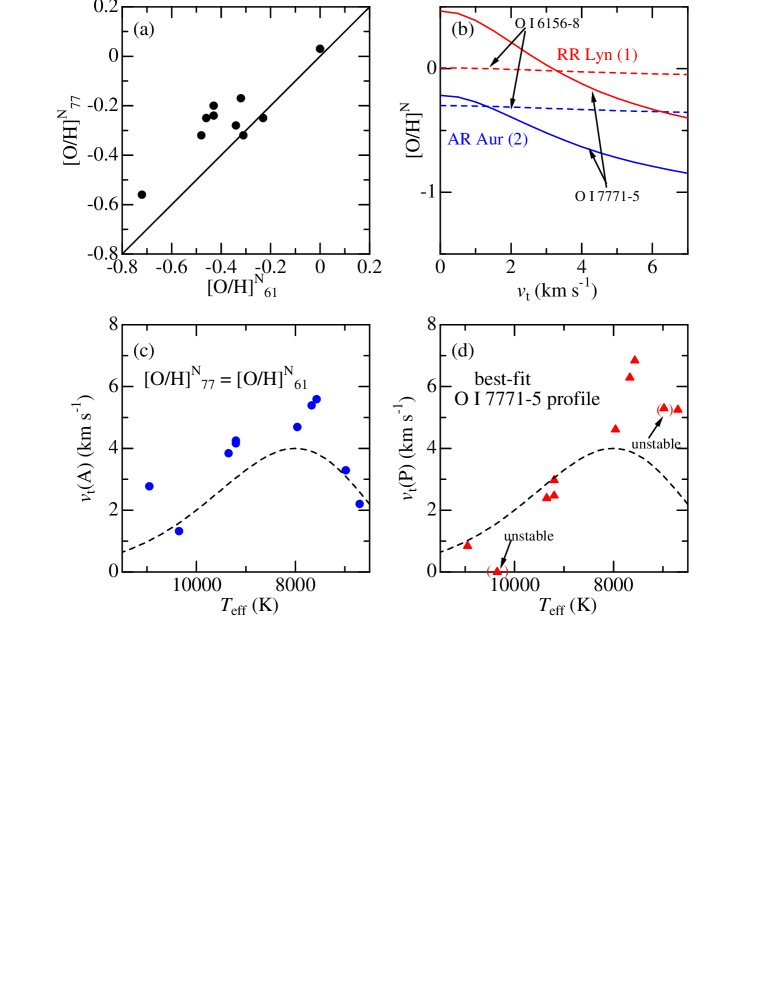
Regarding the microturbulence, we simply applied the empirical -dependent analytical formula proposed by Takeda et al. (2008), as done in Paper I. A useful test for examining the adequacy of such assumed is to check whether the non-LTE oxygen abundances derived from strong O i 7771–5 lines () and weak O i 6156–8 lines () agree with each other, because the former is appreciably -sensitive while the latter is not. Such a comparison is displayed in Fig. 9a, indicating that tends to be somewhat larger than (this difference is also recognized by comparing Fig. 8c and Fig. 8d). We can determine the “abundance-matched” microturbulence (A) by requiring the abundance equality (; cf. Fig 9b). These (A) values are plotted against in Fig. 9c, which shows that these values are somewhat larger than the analytical relation we adopted (as expected). For reference, we also derived the “profile-based” microturbulence (P), which was so determined as to accomplish the best-fit O i 7771–5 triplet line profile (cf. Sect. 5 in Takeda, Jeong & Han 2018a). Such obtained (P) results are depicted in Fig. 9d, where we see that (P) tends to become higher than the adopted relation at K. Taking all these results into consideration, we conservatively assumed that uncertainties of % may be involved with the values adopted in this study, as mentioned in Sect. 3.1. Fortunately, the CNO abundances derived from C i 5380, N i 7468, and O i 6156–8 lines (which are all quite weak) are hardly affected by any choice of , though abundances from stronger saturated lines (e.g., Ba abundance from Ba ii 6141 line) are considerably -dependent.
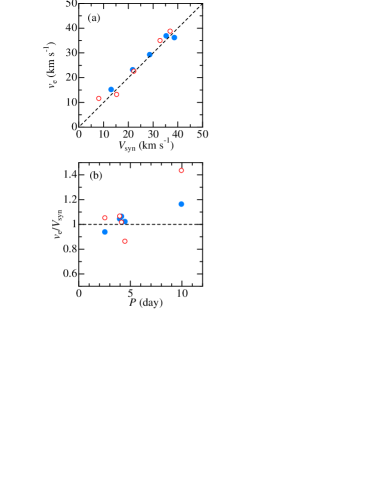
Since the O i 7771–5 triplet is almost free from blending with other lines and shows a characteristic profile comprising three component lines (which sometimes show a complex substructure by merging of rotationally broadened profiles; see, e.g., Fig. 7b or Fig. 7d), precise determination of may be expected if successful fitting between theoretical and observed profiles could be accomplished. Such spectroscopically established values (presented in Table 1) can be used to check whether the expected synchronization of rotational and orbital motions are actually realized in these close binary systems. Assuming the alignment of orbital and rotational axes, we can derive the observed equatorial rotation velocity () by dividing by the sinus of orbital inclination (). The comparison of such obtained with (: synchronized rotation velocity) is shown in Fig. 10a, where can see that the agreement is mostly satisfactory. This suggests that synchronization is almost realized in these close binary systems, which lends support to the result of Kitamura & Kondo (1978) who arrived at practically the same conclusion. However, the situation is indefinite regarding the comparatively longer period case of RR Lyn ( day), where is apparently larger than by 20–40% (cf. Fig. 10b). This might indicate that co-rotation has not yet been realized in this system. Alternatively, we can not rule out a possibility of overestimated for such a sharp-lined star ( km s-1) due to our neglect of some significant broadening component (e.g., macroturbulence), although the effect of instrumental broadening (corresponding to the spectrum resolving power of ) was taken into consideration in deriving .
4.2 Abundance characteristics
We now discuss the abundances of 10 stars (primary and secondary of 5 systems)
resulting from our analysis. Regarding oxygen, we exclusively use the abundance derived from
O i 6156–8 lines (as done in Paper I), because the abundance from
O i 7771–5 is sensitive to and suffers a large non-LTE effect.
The differential abundances relative to the standard star Procyon777
The surface composition of this star is known to be almost the same as that of the Sun.
See the references quoted in Sect. IV(c) of Takeda et al. (2008). ([X/H]; X is any of
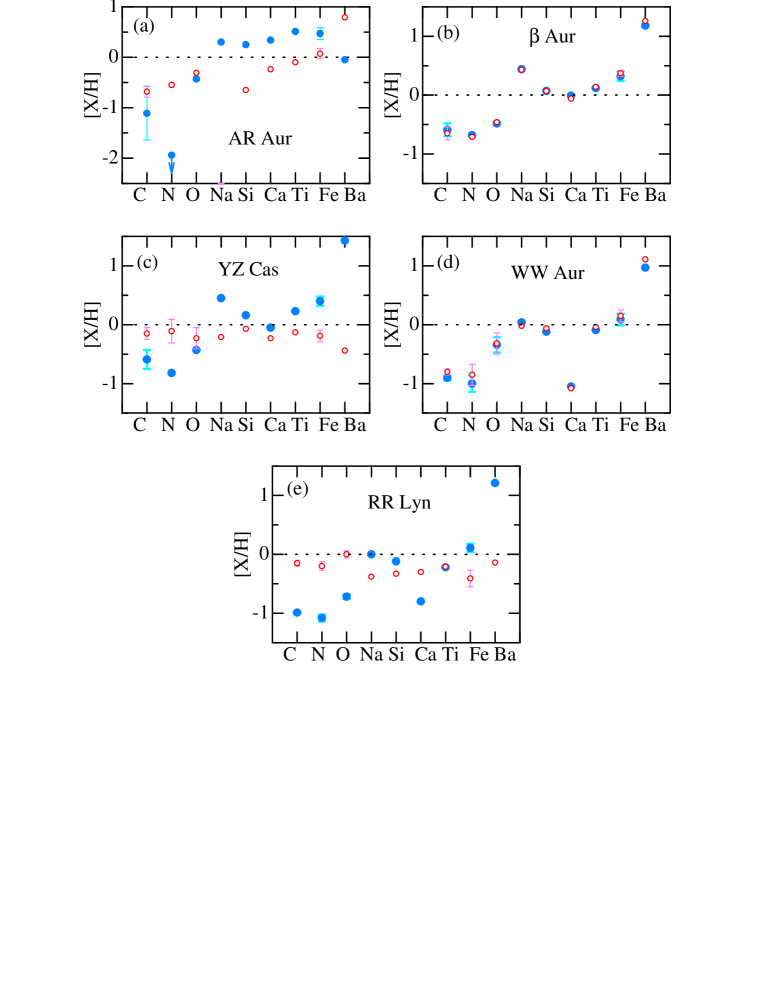
C, N, O, Na, Si, Ca, Ti, Fe, and Ba) for each star are summarized in Table 7 and
graphically plotted in Fig. 11. We can read from this figure several characteristic
trends in terms of the check points set up in Sect. 1.
— Regarding the systems belonging to “similar component” group (AR Aur, Aur,
WW Aur), the abundances of the primary and secondary components are very similar and
hardly discernible for Aur and WW Aur, while those for AR Aur are apparent different.
More precisely, both components of Aur and WW Aur show the characteristics of
Am phenomena: C/N/O are deficient by several tenths to dex (cf. Paper I),
Si/Na/Ti/Fe are normal/enriched, Ca is normal/underabundant, and Ba is
conspicuously overabundant (see, e.g., Fig. 9 in Varenne & Monier 1999).
In contrast, the primary component of AR Aur shows a clear characteristics of HgMn stars
(this star is actually known to be of this type) in the sense that N is drastically
depleted by dex, whereas the secondary appears to exhibit some weak Am phenomenon
as seen from moderate deficiencies of CNO and large overabundance of Ba.
— As for YZ Cas and RR Lyn belonging to “different-component” systems, the surface
composition of the hotter primary is appreciably different from that of the cooler secondary.
That is, the former shows clear Am-type peculiarities mentioned above, while the latter
is nearly normal within a few tenths dex without showing any conspicuous anomaly
despite of slow rotators. It is worth noting that these normal-composition secondary
stars of YZ Cas and RR Lyn are at K.
Combining these observational facts, we can draw the following consequences regarding the appearance and properties of chemical peculiarities in late B through early F stars.
-
•
The fact that essentially the same Am peculiarities are observed between the similar primary and secondary (quite similar and only small difference of 200–300 K) for both Aur and WW Aur means that Am phenomenon is mainly determined by and not very sensitive to as far as the range of is concerned. This is a reconfirmation of the primary importance of rotational velocity in the appearance of Am anomalies, though their extents show moderate -dependences (e.g., tendency of larger CNO deficiency towards lower ).
-
•
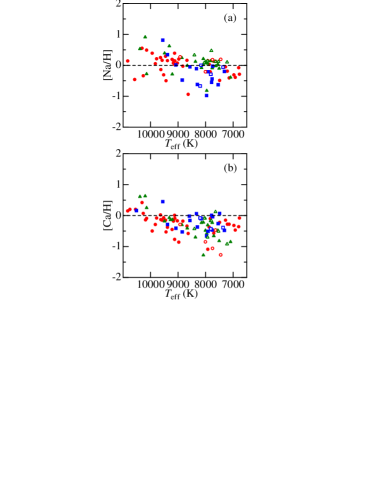
In the context of essentially same chemical compositions between the primary and secondary for Aur and WW Aur, it is interesting to note that these two systems show markedly different Na as well as Ca abundances from each other (cf. Fig. 11b,d). We consider that this discrepancy is mainly due to the difference in (by K), since [Na/H] and [Ca/H] tend to decrease with a lowering of as can be recognized in Fig. 12, where the [Na/H] and [Ca/H] values of 100 A-type stars studied in Paper I are plotted against . Likewise, diffusion calculation predicts the similar tendency at least for Ca (see, e.g., Fig. 14 in Richer, Michaud & Turcotte 2000). Although these two stars have distinctly different ages, 450–500 Myr for Aur (Southworth, Bruntt & Buzasi 2007) and Myr for WW Aur (Southworth et al. 2005), it seems rather unlikely that this has caused the abundance difference, because Ca is considerably deficient in younger WW Aur while nearly normal in older Aur (i.e., in conflict with the naive expectation that chemical anomaly would develop with time).
-
•
The apparent abundance difference between AR Aur (1) (HgMn star) and AR Aur (2) (weak Am star) despite their similarity in stellar parameters (essentially the same rotational velocity and only a small difference of 600 K) is somewhat strange. It may be possible that a rather distinct transition occurs somewhere in-between 10000–11000 K regarding the chemical peculiarity of slow rotators; i.e., from Am-type to HgMn-type as is increased.
-
•
The chemical composition difference between the primary (Am) and the secondary (normal) seen in YZ Cas ( = 9200 K/6700 K) and RR Lyn (7570 K/6980 K) provides us with important information concerning the -dependence for the appearance of Am stars. Especially, the distinct transition from Am to normal over a small difference of K for the case of RR Lyn is significant. We can state from these facts that the advent of Am phenomenon is confined to K, below which chemical peculiarities do not appear no matter how slowly a star rotates. Actually, we can see from Fig. 8e–8g of Paper I that the large spread of C, N, and O abundance deficiencies tend to quickly shrink at K. This is presumably related to the thickening of surface convection zone counteracting the formation of chemical anomaly.
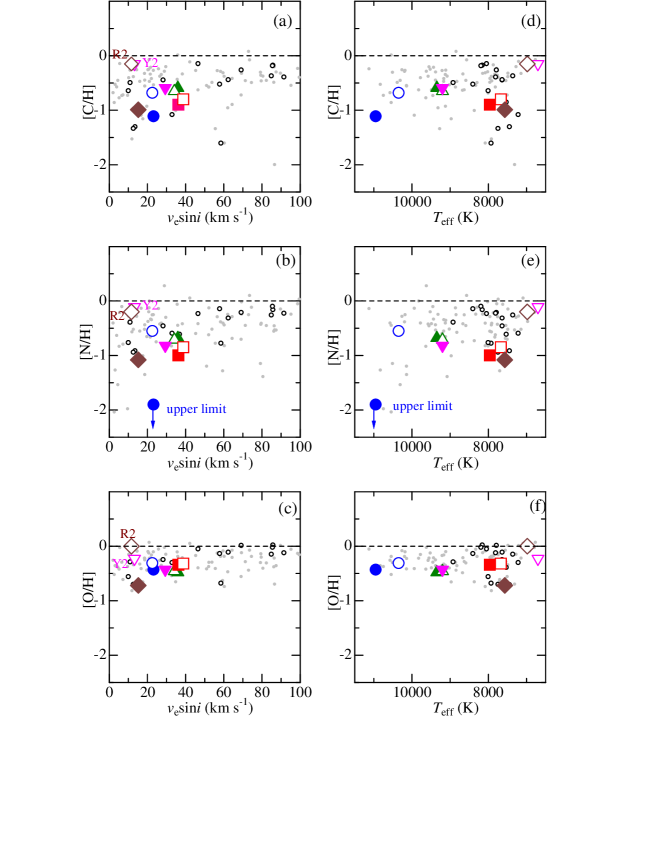
Further, in order to visualize these abundance characteristics summarized above, we plot in Fig. 13 the values of [C/H], [N/H], and [O/H] for the 10 program stars as well as those of 100 stars (Hyades stars and field stars) taken from Paper I altogether against and . It can be recognized from this figure that the CNO abundances of the close binary stars are more or less consistent with the results for general A-type stars. Especially, our results (except for YZ Cas (2) and RR Lyn (2), which are normal abundance stars at K) reasonably follow the systematic [X/H] vs. trend established by Hyades stars (small open circles) despite the narrow range of ( 10–40 km s-1), which reaffirms the importance of rotational velocity for the build-up of Am peculiarity.
4.3 Comparison with previous studies
Finally, we briefly comment on how the results derived from our spectroscopic analysis of 5 binary systems are compared with similar chemical abundance studies published so far. Here, focus of attention is placed on whether or not these previous investigations are consistent with our consequences.
4.3.1 AR Aur
Khokhlova et al. (1995) concluded in their chemical abundance study of AR Aur for 18 elements (based on the line strengths of each component carefully measured from the double-lined spectra of various phases) that the primary is a typical HgMn star while the secondary is also abnormal but with different type of peculiarity. Similarly, according to Folsom et al.’s (2010) more recent investigation based on the disentangled spectra of AR Aur, the surface chemical compositions of the primary and secondary are apparently different, indicating that the former is a HgMn star and the latter is a weak Am star (cf. Fig. 4 therein). Therefore, our conclusion is almost consistent with these past studies. Although Folsom et al. (2010) reported that the C and O abundances are nearly solar for both components (in contrast to our result of mild but definite deficiency), this may be partly due to their neglect of the non-LTE effect.
4.3.2 Aur
Lyubimkov, Rachkovskaya & Rostopchin (1996) determined the chemical compositions of the primary and secondary stars of Aur by analyzing the double-lined spectra, and concluded that the abundances of both components are quite similar and show the characteristics of Am stars. The abundance characteristics of various elements (including CNO) reported by them are in satisfactory agreement with our results.
4.3.3 YZ Cas
Pavlovski et al. (2014) recently carrird out chemical abundance determinations separately for each of the components of YZ Cas based on the disentangled spectra. They reported that the primary is an Am star with supersolar abundances (except for Sc) while the composition of secondary is nearly solar, which is almost consistent with our conclusion. However, their results of “supersolar” C and O abundances (like other heavier elements) for the Am primary are in serious conflict with the general trend of CNO deficiency confirmed in Paper I as well as in this study. Unfortunately, since they did not publish any details of their analysis (e.g., used lines, equivalent widths), we have no idea about the reason for this discrepancy.
4.3.4 WW Aur
To our knowledge, no chemical abundance study for this binary system has ever been published so far. Although Pavlovski, Southworth & Tamajo (2008) once reported their accomplishment of spectrum disentangling applied to WW Aur, stating that the related abundance analysis was in progress, their successive paper does not seem to have come out yet.
4.3.5 RR Lyn
Several spectroscopic investigations have already been published since old days regarding the chemical abundances of RR Lyn (Popper 1971; Kondo 1976; Burkhart & Coupry 1991; Lyubimkov & Rachkovskaya 1995; Hui-Bon-Hoa 2000), although all these are based on the direct analysis of double-lined spectra. According to these previous studies, the primary component is an Am star and more metal-rich than the secondary, which is in reasonable consistency with our consequence. However, none of them mentioned about the CNO abundances of this binary system.
5 Conclusion
Spectroscopically investigating the chemical compositions separately for the primary and secondary components of a double-line eclipsing binary showing characteristic chemical peculiarities (typically seen in A-tye stars in the upper main sequence) is of profound significance, since it may provide us with information regarding how the appearance of chemical anomaly depends upon stellar physical parameters.
We conducted a spectroscopic study to determine the surface chemical abundances of CNO and other heavier elements in the primary and secondary components of selected 5 eclipsing close binaries around A-type (AR Aur, Aur, YZ Cas, WW Aur, and RR Lyn). Our aim was to investigate whether any chemical difference exists between two components, and how the situation depends upon stellar parameters.
For this purpose, we extracted the individual spectra of the primary and secondary for each target in 4 wavelength regions by applying the spectrum disentangling method to a set of time-series spectra sufficiently covering the orbital phases, which were obtained by using the high-dispersion echelle spectrograph attached to the 1.8 m reflector of Bohyunsan Optical Astronomy Observatory.
The abundances of C, N, and O were determined by using C i 5380, N i 7468, and O i 6156–8 lines in essentially the same manner (spectrum-synthesis analysis by taking into account the non-LTE effect) as done in Paper I. Besides, we could also derive the abundances of Na, Si, Ca, Ti, Fe, and Ba as by-products of spectrum fitting.
In addition, we also analyzed the O i 7771–5 triplet lines in the same way, with an aim to check the adopted and to determine for each star. We could confirm that synchronization between rotation and orbital motion is accomplished for almost all systems, except for RR Lyn for which the situation is unclear.
Regarding the “similar-component” systems, Aur and WW Aur were confirmed to exhibit the characteristics of Am anomaly (deficiency in CNO, overabundance of heavy elements such as Ba) with essentially the same compositions for both the primary and secondary.
However, distinct compositional differences were found between the primary and secondary of AR Aur, another “similar-component” system, in the sense that they show chemical anomalies of different types (HgMn star and Am star, respectively).
In contrast, as to YZ Cas and RR Lyn, both of which are the “different-component” systems consisting of A-type and early-F stars, the surface abundances turned out markedly different between the primary (Am star) and secondary (chemically normal).
These observational results may indicate the -dependent nature in the chemical
anomalies of non-magnetic stars on the upper main sequence, as summarized below.
—(i) In the effective temperature range of ,
slow rotation is considered to be the key factor for the appearance of Am anomaly.
Thus, the components of close binaries (slow rotators due to tidal braking)
naturally exhibit very similar Am anomalies under the same rotational velocities
( Aur and WW Aur).
—(ii) However, the emergence of Am peculiarity seems to have a distinct lower
limit at K, below which abundance anomaly can hardly be
produced regardless of stellar rotation (secondary components of RR Lyn and YZ Cas).
—(iii) On the other hand, as seen from the abundance differences between the components
of AR Aur, the transition from Am anomaly to HgMn anomaly is likely to take place
(with an increase in ) somewhere between 10000 K and 11000 K.
Acknowledgments
We express our cordial thanks to Dr. S. Ilijić for kindly making the useful spectrum disentangling software CRES open to the public. Data reduction and analysis were in part carried out by using the common-use data analysis computer system at the Astronomy Data Center (ADC) of the National Astronomical Observatory of Japan.
References
- [] Bressan A., Marigo P., Girardi L., Salasnich B., Dal Cero C., Rubele S., Nanni A., 2012, MNRAS, 427, 127
- [] Burkhart C., & Coupry M. F., 1991, A&A, 249, 205
- [] Eker Z., Bilir S., Soydugan F., Yaz Gökçe E., Soydugan E., Tüysüz M., Şenyüz T., Demircan O., 2014, PASA, 31, e024
- [] Folsom C. P., Kochukhov O., Wade G. A., Silvester J., Bagnulo S., 2010, MNRAS, 407, 2383
- [] Hui-Bon-Hoa A., 2000, A&AS, 144, 203
- [] Ilijić S. 2004, in Spectroscopically and Spatially Resolving the Components of Close Binary Stars, ASP Conf. Ser. Vol. 318, ed. R. W. Hilditch, H. Hensberge, & K. Pavlovski (San Francisco: Astronomical Society of the Pacific), 107
- [] Khokhlova V. L., Zverko Yu.,Zhizhnovskii I., Griffin R. E. M., 1995, Astron. Lett., 21, 818
- [] Kitamura M., Kim T.-H., Kiyokawa M., 1976, Ann. Tokyo Astron. Obs. 2nd. Ser., 16, 22
- [] Kitamura M., Kondo M., 1978, Ap&SS, 56, 341
- [] Kondo M., 1976, Ann. Tokyo Astron. Obs. 2nd. Ser., 16, 1
- [] Kurucz R. L., 1993, Kurucz CD-ROM, No. 13, ATLAS9 Stellar Atmosphere Program and 2 km/s Grid (Cambridge, MA: Harvard-Smithsonian Center for Astrophysics)
- [] Kurucz R. L., Bell B., 1995, Kurucz CD-ROM, No. 23, Atomic Line Data (Cambridge, MA: Harvard-Smithsonian Center for Astrophysics)
- [] Lyubimkov L. S., Rachkovskaya, T. M., 1995 Astron. Rep., 39, 63
- [] Lyubimkov L. S., Rachkovskaya T. M., Rostopchin S. I., 1996, Astron. Rep., 40, 802
- [] Pavlovski K., Southworth J., Kolbas V., Smalley B., 2014, MNRAS, 438, 590
- [] Pavlovski K., Southworth J., Tamajo E., 2008, Contrib. Astron. Obs. Skalnaté Pleso, 38, 437
- [] Popper D. M., 1971, ApJ, 169, 549
- [] Preston G. W., 1974, ARA&A, 12, 257
- [] Richer J., Michaud G., Turcotte S., 2000, ApJ, 529, 338
- [] Samus N. N., Kazarovets E. V., Durlevich O. V., Kireeva N. N., Pastukhova E. N., 2017, Astron. Rep., 61, 80
- [] Southworth J., Smalley B., Maxted P. F. L., Claret A., Etzel P. B., 2005, MNRAS, 363, 529
- [] Southworth J., Bruntt H., Buzasi D. L., 2007, A&A, 467, 1215
- [] Takeda Y., Han I., Kang D.-I., Lee B.-C., Kim K.-M., 2008, JKAS, 41, 83
- [] Takeda Y., Hashimoto O., Honda S., 2018b, ApJ, 862, 57
- [] Takeda Y., Jeong G., Han I., 2018a, PASJ, 70, 8
- [] Takeda Y., Kawanomoto S., Ohishi N., Kang D.-I., Lee B.-C., Kim K.-M., Han I., 2018c, PASJ, 70, 91 (Paper I)
- [] Takeda Y., Sadakane K., 1997, PASJ, 49, 571
- [] Tomkin J., Fekel F. C., 2006, AJ, 131, 2652
- [] Torres G., Lacy C. H. S., Pavlovski K., Fekel F. C., Muterspaugh M. W., 2015, ApJ, 150, 154
- [] Varenne O., Monier R., 1999, A&A, 351, 247
- [] Wilson R. E., Van Hamme W., 2014, ApJ, 780, 151
| AR Aur | Aur | YZ Cas | WW Aur | RR Lyn | Remark | ||
| [Basic data] | |||||||
| HD | 34364 | 40183 | 4161 | 46052 | 44691 | ||
| HIP | 24740 | 28360 | 3572 | 31173 | 30651 | ||
| (mag) | 6.14 | 1.89 | 5.65 | 5.82 | 5.55 | ||
| (m.a.s.) | 8.19 | 40.21 | 10.75 | 12.41 | 13.34 | ||
| Sp | B9V+B9.6V | A1Vm+A1Vm | A2IV+F2V | A4m+A5m | A6IV+F0V | ||
| [Orbital elements] | |||||||
| JD(min I) | (day) | 2452501.392 | 2452500.573 | 2454509.297 | 2452501.814 | 2433153.862 | from GCVS |
| (day) | 4.134651 | 3.960036 | 4.467222 | 2.52501936 | 9.945079 | from GCVS | |
| (km s-1) | 107.20 | 107.75 | 73.35 | 116.81 | 66.00 | ||
| (km s-1) | 115.90 | 111.25 | 125.70 | 126.49 | 84.00 | ||
| (km s-1) | 25.10 | 8.14 | |||||
| 0.000 | 0.002 | 0.000 | 0.000 | 0.079 | |||
| (deg) | 88.52 | 76.91 | 88.30 | 87.55 | 87.45 | ||
| [Stellar parameters] | |||||||
| () | 2.480 | 2.376 | 2.310 | 1.964 | 1.927 | ||
| () | 2.294 | 2.291 | 1.350 | 1.814 | 1.507 | ||
| () | 1.781 | 2.762 | 2.530 | 1.927 | 2.570 | ||
| () | 1.816 | 2.568 | 1.350 | 1.841 | 1.590 | ||
| (K) | 10950 | 9350 | 9200 | 7960 | 7570 | ||
| (K) | 10350 | 9200 | 6700 | 7670 | 6980 | ||
| (dex) | 4.331 | 3.932 | 3.995 | 4.162 | 3.900 | ||
| (dex) | 4.280 | 3.979 | 4.307 | 4.167 | 4.214 | ||
| (km s-1) | 1.0 | 2.9 | 3.0 | 4.0 | 3.8 | formula | |
| (km s-1) | 1.6 | 3.0 | 2.6 | 3.9 | 3.1 | formula | |
| (km s-1) | 23.2 | 35.9 | 29.3 | 36.2 | 15.2 | O i 7771–5 fitting | |
| (km s-1) | 22.6 | 34.1 | 13.2 | 38.8 | 11.6 | O i 7771–5 fitting | |
The data of JD(min I) and were taken from the web site of General Catalogue of Variable Stars (Samus et al. 2017). The values of and (microturbulence) were estimated by using the -dependent relation derived by Takeda et al. (2008) [cf. Eq. (1) therein], while and (projected rotational velocity) are the results of O i 7771–5 fitting. All other data were adopted from the compilation of Ecker et al. (2014), which should be consulted for more details (e.g., original references, involved errors, etc.).
| Spectrum label | JD(+2400000) | Phase | |||||||
|---|---|---|---|---|---|---|---|---|---|
| (1) | (2) | (3) | (4) | (5) | (6) | (7) | (8) | (9) | (10) |
| araur_20101214A | 55545.010 | 0.125 | 50.6 | 107.0 | 0.6 | 50.1 | 107.6 | 45.1 | 112.6 |
| araur_20101214B | 55545.201 | 0.171 | 69.2 | 127.0 | 1.0 | 68.1 | 128.0 | 63.1 | 133.0 |
| araur_20101215A | 55546.022 | 0.370 | 53.2 | 109.8 | 1.1 | 52.1 | 110.9 | 47.1 | 115.9 |
| araur_20101215B | 55546.272 | 0.430 | 20.5 | 74.4 | 1.7 | 18.8 | 76.1 | 13.8 | 81.1 |
| araur_20101216A | 55546.999 | 0.606 | 91.2 | 46.4 | 1.6 | 92.8 | 44.8 | 97.8 | 39.8 |
| araur_20101218A | 55548.961 | 0.080 | 26.8 | 81.2 | 2.6 | 24.2 | 83.8 | 19.2 | 88.8 |
| araur_20101218B | 55549.163 | 0.129 | 52.7 | 109.2 | 3.0 | 49.6 | 112.2 | 44.6 | 117.2 |
| araur_20101218C | 55549.284 | 0.159 | 64.9 | 122.4 | 3.3 | 61.6 | 125.7 | 56.6 | 130.7 |
| araur_20101220A | 55550.982 | 0.569 | 70.3 | 23.7 | 3.7 | 73.9 | 20.1 | 79.9 | 14.1 |
| araur_20101220B | 55551.152 | 0.610 | 93.6 | 48.9 | 4.0 | 97.6 | 44.9 | 103.6 | 38.9 |
| araur_20101220C | 55551.295 | 0.645 | 109.8 | 66.5 | 4.3 | 114.1 | 62.1 | 120.1 | 56.1 |
| betaur_20101214A | 55545.043 | 0.798 | 86.1 | 122.9 | 3.7 | 82.4 | 126.6 | ||
| betaur_20101214B | 55545.255 | 0.852 | 69.6 | 106.0 | 3.3 | 66.4 | 109.3 | ||
| betaur_20101215A | 55546.087 | 0.062 | 57.8 | 25.2 | 3.1 | 60.9 | 22.1 | ||
| betaur_20101215B | 55546.261 | 0.106 | 83.4 | 51.7 | 2.7 | 86.1 | 49.0 | ||
| betaur_20101216A | 55547.023 | 0.298 | 119.7 | 89.3 | 2.7 | 122.5 | 86.6 | ||
| betaur_20101218A | 55548.984 | 0.793 | 87.0 | 123.9 | 1.8 | 85.2 | 125.7 | ||
| betaur_20101218B | 55549.129 | 0.830 | 77.6 | 114.3 | 1.5 | 76.1 | 115.8 | ||
| betaur_20101218C | 55549.314 | 0.877 | 58.4 | 94.6 | 1.2 | 57.3 | 95.8 | ||
| betaur_20101220A | 55551.005 | 0.304 | 118.5 | 88.0 | 0.8 | 119.3 | 87.3 | ||
| betaur_20101220B | 55551.203 | 0.354 | 102.7 | 71.3 | 0.4 | 103.1 | 70.9 | ||
| betaur_20101220C | 55551.356 | 0.393 | 84.6 | 52.3 | 0.2 | 84.7 | 52.2 | ||
| yzcas_20101214A | 55544.903 | 0.823 | 73.9 | 104.5 | 5.9 | 79.8 | 98.5 | ||
| yzcas_20101214B | 55545.136 | 0.875 | 59.9 | 80.5 | 6.1 | 66.0 | 74.4 | ||
| yzcas_20101216A | 55546.968 | 0.286 | 63.4 | 130.7 | 6.5 | 56.9 | 137.2 | ||
| yzcas_20101218A | 55548.906 | 0.719 | 80.1 | 115.2 | 6.9 | 87.0 | 108.4 | ||
| yzcas_20101218B | 55549.071 | 0.756 | 81.4 | 117.5 | 7.0 | 88.5 | 110.4 | ||
| yzcas_20101218C | 55549.233 | 0.793 | 78.9 | 113.1 | 7.1 | 85.9 | 106.0 | ||
| yzcas_20101220A | 55550.905 | 0.167 | 55.4 | 117.1 | 7.4 | 48.1 | 124.5 | ||
| yzcas_20101220B | 55551.101 | 0.211 | 63.0 | 130.0 | 7.5 | 55.5 | 137.5 | ||
| yzcas_20101220C | 55551.241 | 0.242 | 65.1 | 133.7 | 7.5 | 57.6 | 141.2 | ||
| wwaur_20101214A | 55545.053 | 0.234 | 124.7 | 117.4 | 7.5 | 132.3 | 109.9 | ||
| wwaur_20101214B | 55545.262 | 0.317 | 115.0 | 106.9 | 7.1 | 122.1 | 99.9 | ||
| wwaur_20101215A | 55546.054 | 0.631 | 77.1 | 101.1 | 7.0 | 70.1 | 108.1 | ||
| wwaur_20101215B | 55546.204 | 0.690 | 100.2 | 126.2 | 6.7 | 93.5 | 132.8 | ||
| (wwaur_20101216A) | 55547.028 | 0.017 | 20.7 | 4.7 | 6.6 | (27.2) | (1.8) | ||
| wwaur_20101218A | 55548.987 | 0.793 | 104.2 | 130.4 | 5.6 | 98.6 | 136.0 | ||
| wwaur_20101218B | 55549.134 | 0.851 | 85.8 | 110.5 | 5.3 | 80.5 | 115.8 | ||
| wwaur_20101218C | 55549.318 | 0.924 | 45.5 | 66.9 | 4.9 | 40.6 | 71.8 | ||
| wwaur_20101220A | 55551.009 | 0.593 | 56.1 | 78.4 | 4.5 | 51.6 | 83.0 | ||
| wwaur_20101220B | 55551.179 | 0.661 | 90.5 | 115.6 | 4.2 | 86.3 | 119.8 | ||
| wwaur_20101220C | 55551.326 | 0.719 | 106.1 | 132.6 | 3.8 | 102.3 | 136.4 | ||
| (rrlyn_20101214A) | 55545.084 | 0.487 | 27.0 | 18.6 | 5.2 | 32.2 | 23.8 | (5.0) | (30.0) |
| rrlyn_20101214B | 55545.292 | 0.508 | 18.8 | 29.1 | 4.9 | 23.7 | 33.9 | 3.0 | 40.0 |
| rrlyn_20101215A | 55546.163 | 0.596 | 17.7 | 65.5 | 4.6 | 13.1 | 70.1 | 29.0 | 74.0 |
| rrlyn_20101215B | 55546.303 | 0.610 | 23.4 | 69.9 | 4.4 | 19.0 | 74.3 | 33.0 | 77.0 |
| rrlyn_20101216A | 55547.051 | 0.685 | 48.9 | 86.1 | 4.4 | 44.5 | 90.4 | 43.0 | 90.0 |
| rrlyn_20101218A | 55549.010 | 0.882 | 35.9 | 64.3 | 3.5 | 32.3 | 67.8 | 21.0 | 62.0 |
| rrlyn_20101218B | 55549.193 | 0.901 | 29.1 | 57.7 | 3.3 | 25.8 | 61.0 | 15.0 | 53.0 |
| rrlyn_20101218C | 55549.368 | 0.918 | 22.2 | 50.8 | 3.0 | 19.2 | 53.8 | 10.0 | 45.0 |
| rrlyn_20101220A | 55551.032 | 0.086 | 43.7 | 33.5 | 2.6 | 46.4 | 30.9 | 55.0 | 39.0 |
| rrlyn_20101220B | 55551.206 | 0.103 | 49.0 | 42.1 | 2.4 | 51.4 | 39.8 | 62.0 | 47.0 |
| rrlyn_20101220C | 55551.361 | 0.119 | 53.4 | 49.4 | 2.1 | 55.5 | 47.2 | 67.0 | 54.0 |
(1) Spectrum label (e.g., araur_20101218C is the 3rd spectrum of AR Aur observed on 2010 December 18). (2) Heliocentric Julian day. (3) Orbital phase calculated from the and JD(min I) values given in Table 1. (4) Predicted heliocentric radial velocity (in km s-1) for the primary calculated with the orbital elements given in Table 1. (5) Predicted heliocentric radial velocity for the secondary. (6) Heliocentric correction (km s-1) computed by the “rvcorrect” task of IRAF. (7) Predicted local topocentric radial velocity (km s-1) for the primary. (8) Predicted local topocentric radial velocity (km s-1) for the secondary. (9) Empirically determined radial velocity of the primary directly measured from the spectrum by comparing the simulated double-line profile of O i 7771–5 triplet with the observed one. (10) Empirically determined radial velocity of the secondary. Note that and were used for spectrum disentangling for AR Aur and RR Lyn, because predicted and did not satisfactorily reproduce the actual spectra for these two stars. Otherwise, and were used for the other 3 stars, which were confirmed to well match the observed spectra at each of the phases. Two spectra (wwaur_20101216A and rrlyn_20101214A, indicated by parentheses) were not used for disentangling, because they correspond to phases during the eclipse.
| Star | 5350–5400 Å | 6130–6180 Å | 7440–7500 Å | 7750–7800 Å |
|---|---|---|---|---|
| AR Aur | 0.520 : 0.480 | 0.518 : 0.482 | 0.515 : 0.485 | 0.515 : 0.485 |
| Aur | 0.545 : 0.455 | 0.544 : 0.456 | 0.543 : 0.457 | 0.543 : 0.457 |
| YZ Cas | 0.917 : 0.083 | 0.903 : 0.097 | 0.883 : 0.117 | 0.879 : 0.121 |
| WW Aur | 0.559 : 0.441 | 0.553 : 0.447 | 0.546 : 0.454 | 0.545 : 0.455 |
| RR Lyn | 0.788 : 0.212 | 0.777 : 0.223 | 0.764 : 0.236 | 0.761 : 0.239 |
| Star | Å | Å | Å | Å |
|---|---|---|---|---|
| AR Aur (1) | 400 | 500 | 350 | 400 |
| AR Aur (2) | 400 | 400 | 300 | 350 |
| Aur (1) | 700 | 600 | 450 | 600 |
| Aur (2) | 600 | 600 | 400 | 500 |
| YZ Cas (1) | 600 | 700 | 500 | 600 |
| YZ Cas (2) | 80 | 90 | 70 | 70 |
| WW Aur (1) | 400 | 450 | 350 | 400 |
| WW Aur (2) | 400 | 400 | 300 | 400 |
| RR Lyn (1) | 500 | 600 | 350 | 600 |
| RR Lyn (2) | 150 | 200 | 150 | 200 |
| Main purpose | Fitting range (Å) | Abundances varied∗ | Atomic data source | Figure |
|---|---|---|---|---|
| C abundance from C i 5380 | 5375–5390 | C, Ti, Fe | KB95m1 | Fig. 4 |
| N abundance from N i 7468 | 7457–7472 | N, Fe | KB95m2 | Fig. 5 |
| O abundance from O i 6156–8 | 6140–6168 | O, Na, Si, Ca, Fe, Ba | KB95 | Fig. 6 |
| determination from O i 7771–5 | 7765–7785 | O, Fe | KB95m3 | Fig. 7 |
∗ The abundances of all other elements than these were fixed in the fitting.
KB95m1 — All the atomic line data presented in Kurucz & Bell (1995) were used,
excepting that the contribution of Fe i 5382.474 ( eV)
was neglected (because we found its value to be erroneously too large).
KB95m2 — All the atomic line data were taken from Kurucz & Bell (1995), excepting
that the contribution of S i 7468.588 ( eV) was neglected
(because we found its value to be erroneously too large).
KB95 — All the atomic line data given in Kurucz & Bell (1995) were used unchanged.
KB95m3 — All the atomic line data were taken from Kurucz & Bell (1995), except for
the value of Fe i 7780.552 ( eV), for which
we adopted (cf. Takeda & Sadakane 1997).
| Line | Multiplet | Equivalent | Gammar | Gammas | Gammaw | |||
| No. | Width | (Å) | (eV) | (dex) | (dex) | (dex) | (dex) | |
| C i 5380 | (11) | 5380.337 | 7.685 | (7.89) | 4.66 | (7.36) | ||
| N i 7468 | (3) | 7468.312 | 10.336 | 8.64 | 5.40 | (7.60) | ||
| O i 6156–8 | (10) | 6155.961 | 10.740 | 7.60 | 3.96 | (7.23) | ||
| (9 components) | 6155.971 | 10.740 | 7.61 | 3.96 | (7.23) | |||
| 6155.989 | 10.740 | 7.61 | 3.96 | (7.23) | ||||
| 6156.737 | 10.740 | 7.61 | 3.96 | (7.23) | ||||
| 6156.755 | 10.740 | 7.61 | 3.96 | (7.23) | ||||
| 6156.778 | 10.740 | 7.62 | 3.96 | (7.23) | ||||
| 6158.149 | 10.741 | 7.62 | 3.96 | (7.23) | ||||
| 6158.172 | 10.741 | 7.62 | 3.96 | (7.23) | ||||
| 6158.187 | 10.741 | 7.61 | 3.96 | (7.23) | ||||
| O i 7771–5 | (1) | 7771.944 | 9.146 | +0.324 | 7.52 | 5.55 | (7.65) | |
| (3 components) | 7774.166 | 9.146 | +0.174 | 7.52 | 5.55 | (7.65) | ||
| 7775.388 | 9.146 | 0.046 | 7.52 | 5.55 | (7.65) |
Following columns 3–5 (laboratory wavelength, lower excitation potential,
and value), three kinds of damping parameters are presented in columns 6–8:
Gammar is the radiation damping width (s-1) [],
Gammas is the Stark damping width (s-1) per electron density (cm-3)
at K [], and
Gammaw is the van der Waals damping width (s-1) per hydrogen density
(cm-3) at K [].
All the data were taken from Kurucz & Bell (1995), except for
the parenthesized damping parameters (unavailable in their compilation),
for which the default values computed by Kurucz’s (1993) WIDTH9 program were assigned.
| Star | [C] | [N] | [O] | [Na] | [Si] | [Ca] | [Ti] | [Fe] | [Ba] |
|---|---|---|---|---|---|---|---|---|---|
| (1) | (2) | (3) | (4) | (5) | (6) | (7) | (8) | (9) | (10) |
| AR Aur (1) | 1.11: | 0.43 | +0.30 | +0.25 | +0.34 | +0.51 | +0.47 | 0.05 | |
| AR Aur (2) | 0.68 | 0.55 | 0.31 | 0.65 | 0.24 | 0.10 | +0.07 | +0.79 | |
| Aur (1) | 0.59 | 0.68 | 0.48 | +0.44 | +0.07 | 0.01 | +0.12 | +0.32 | +1.18 |
| Aur (2) | 0.65 | 0.71 | 0.46 | +0.43 | +0.07 | 0.06 | +0.14 | +0.37 | +1.26 |
| YZ Cas (1) | 0.59 | 0.82 | 0.43 | +0.45 | +0.16 | 0.05 | +0.23 | +0.40 | +1.43 |
| YZ Cas (2) | 0.15 | 0.11 | 0.23 | 0.21 | 0.07 | 0.23 | 0.13 | 0.19 | 0.44 |
| WW Aur (1) | 0.90 | 1.00 | 0.34 | +0.04 | 0.12 | 1.05 | 0.09 | +0.09 | +0.97 |
| WW Aur (2) | 0.80 | 0.85 | 0.32 | 0.02 | 0.06 | 1.08 | 0.04 | +0.15 | +1.11 |
| RR Lyn (1) | 0.99 | 1.08 | 0.72 | +0.00 | 0.12 | 0.80 | 0.22 | +0.11 | +1.21 |
| RR Lyn (2) | 0.15 | 0.20 | +0.00 | 0.38 | 0.33 | 0.30 | 0.21 | 0.41 | 0.14 |
All the results given here are the differential abundances relative to Procyon
(see ReadMe of the online material for the detailed reference abundances of Procyon determined
in the same manner).
(2) Non-LTE C abundance from C i 5380. (3) Non-LTE N abundance from N i 7468.
(4) Non-LTE O abundance from O i 6156–8. (5) LTE Na abundance derived from
6140–6168 Å fitting. (6) LTE Si abundance derived from 6140–6168 Å fitting.
(7) LTE Ca abundance derived from 6140–6168 Å fitting.
(8) LTE Ti abundance derived from 5375–5390 Å fitting.
(9) Mean of the 4 LTE Fe abundances derived from the fittings of 5375–5390 Å,
6140–6168 Å, 7457–7472 Å, and 7765–7785 Å.
(10) LTE Ba abundance derived from 6140–6168 Å fitting.
Regarding the data given for the primary of AR Aur, the parenthesized value for N
is the upper limit, while the value for C with colon (:) is considered to suffer
a large uncertainty.