X-Ray Spectral Variability of Ultraluminous X-Ray Sources in Extragalactic Globular Clusters
Abstract
A number of ultraluminous X-ray sources (ULXs) are physically associated with extragalactic globular clusters (GCs). We undertake a systematic X-ray analysis of eight of the brightest of these sources. We fit the spectra of the GC ULXs to single power law and single disk models. We find that the data never require that any of the sources change between a disk and a power law across successive observations. The GC ULXs best fit by a single disk show a bimodal distribution: they either have temperatures well below 0.5 keV, or variable temperatures ranging above 0.5 keV up to 2 keV. The GC ULXs with low kT have significant changes in luminosity but show little or no change in kT. By contrast, the sources with higher kT either change in both kT and together, or show no significant change in either parameter. Notably, the X-ray characteristics may be related to the optical properties of these ULXs, with the two lowest kT sources showing optical emission lines.
keywords:
accretion – X-rays:binaries – globular clusters – galaxies:individual: NGC 1399, NGC 4649, NGC 44721 INTRODUCTION
Ultraluminous X-ray sources (ULXs) are non-nuclear X-ray sources with luminosities significantly greater than the Eddington limit or a 10 black hole (BH). erg s-1 is often adopted as a general guideline for being well above this limit and therefore a ULX. This implies the accreting object in a ULX is either a black hole, or a neutron star (NS) with super-Eddington accretion and/or emission beamed along our line of sight. The most well studied ULX population is that in star forming galaxies (e.g. review by Kaaret et al. 2017). The ULXs with luminosities lower than 3 erg s-1 are typically fit best by a singly peaked, broadened disk. The higher luminosity ULXs are fit by a two component disk and power law model, and are either “soft" or “hard", depending on the slope of the power law. The slope differentiates between Eddington and super-Eddington models (Gladstone et al., 2009; Sutton et al., 2013). These ULXs show strong luminosity variability that are often accompanied by significant changes in states/spectral shapes (Sutton et al., 2013; Bachetti et al., 2013; Walton et al., 2013; Feng et al., 2016). A third group of ULXs have also been identified, with luminosities below 3 erg s-1 and soft blackbody dominated emission and are known as of “supersoft” ULXs (Urquhart & Soria, 2016).
Some optical counterparts have been identified for ULXs in star forming regions. These are primarily OB type giants or supergiants (Pintore et al., 2018, and references therein). High mass companion stars could provide an explanation for the high mass transfer rates which drive the high luminosities and account for their connection to star-forming regions (see Gladstone et al. 2009 and references therein).
Of the many sources confirmed as ULXs, a number of those associated with star forming galaxies have been found to have pulsations, implying that the compact object is a neutron star (e.g., Bachetti et al. 2014 to Pintore et al. 2018). Although ULXs in star forming galaxies have been studied extensively, ULXs also exist in a completely different environment: globular clusters (GCs). Since 2007, five globular cluster ULX sources have been studied in some depth: XMMUJ122939.7+075333 (RZ2109; Maccarone et al., 2007), CXOJ0338318-352604 (Irwin et al., 2010), CXOKMZJ033831.7353058 (Shih et al., 2010), CXOU 1229410+0757442 (Maccarone et al., 2011), and CXOUJ1243469+113234 (Roberts et al., 2012). Some of these sources are proposed to have black hole primaries due to their highly variable ULX emission and other properties (Maccarone et al., 2007; Shih et al., 2010).
Interestingly, nebular emission is observed from some of these GC ULXs. Such emission is likely associated with the ULX, since it is extremely rare in globular clusters, which lack young stars and are known to have few planetary nebulae (Peacock et al., 2012b, and references therein). Their forbidden optical emission lines limit beaming to a factor of a few or less for some of these GC sources. While geometric beaming has been proposed as a mechanism for producing the super-Eddington X-ray emission from accreting neutron stars (King et al., 2001), Peacock et al. (2012a) find that the optical emission from the GC ULX sources are too luminous to accommodate a large beaming factor and should be isotropically emitting. (See also Pakull & Mirioni (2002), and Binder et al. (2018) for a discussion of beaming in ULX sources.)
The presence of black holes in globular clusters, and if so, the properties the globular cluster black holes has been debated for many decades (see Spitzer 1969, Chatterjee et al. 2017, Park et al. 2017). While black holes are initially expected to form in globular clusters (Ivanova et al., 2010), early numerical simulations indicated that dynamical interactions within the globular cluster would cause the black holes to be ejected (Kulkarni et al., 1993; Sigurdsson & Hernquist, 1993). However, more recent work, (e.g., Morscher et al. 2013, 2015; Heggie & Giersz 2014; Sippel & Hurley 2013) show that the ejection time scales are much longer, and that stellar mass black holes remain well mixed in the cluster. In addition to this, globular clusters are prime environments for black hole mergers, and if black holes are retained in globular clusters, then globular clusters could be the progenitors of recent LIGO detections of merging black holes (see Abbott et al., 2016; Rodriguez et al., 2016). Studying GC ULX sources could shed some light on the nature of black holes in globular clusters.
It is interesting to compare the ULX population in star forming regions to those in globular clusters, which are two very different environments. Firstly, the dense globular cluster environment is conducive to dynamical formation of binary systems, thus, GC ULXs are likely dynamically formed (Ivanova et al., 2010). The large interaction cross-section in this environment means that it is unlikely that the current binary partner of any compact object in a GC was a binary with the object when the stars initially formed and evolved. In contrast, ULX sources in star forming regions likely evolved from primordial binaries, and that the two objects in the binary evolved at the same time.
The donor stars in the two types of ULXs are also likely to be very different; due to the ages of globular clusters, 13 Gyr or so, the BHs and NSs were born from the massive stars in these GCs many Gyr ago. This very old age for these primordial BH and NS populations differs greatly from the young ages of the NSs and BHs formed from massive stars in currently star forming regions. For example, one such GC ULX source likely has a white dwarf as its donor star (Steele et al., 2014), but the ULXs in star-forming regions should have high mass donor stars, as mentioned previously.
One other difference between these ULX populations is that those in star forming regions have hydrogen emission present in their optical spectra (e.g., Fabrika et al., 2015), while at least three of the globular cluster ULXs have no hydrogen emission (Zepf et al., 2008; Irwin et al., 2010; Roberts et al., 2012). The most well studied GC ULX, RZ2109, also has very different X-ray behaviour from ULXs in star forming regions; it varies by more than an order of magnitude in X-ray luminosity between many different observations, but exhibits little or no variation in kT over those same observations (Shih et al., 2008; Dage et al., 2018).
Several studies have considered the nature of the GC ULX sources and their optical emission, although most of them tend to focus on the source RZ2109 (e.g., Zepf et al., 2008; Steele et al., 2011a; Peacock et al., 2012a, b; Steele et al., 2014). There are also studies of the optical spectrum of the GC ULX CXOJ0338318-352604 in the galaxy NGC 1399 (Irwin et al., 2010). The emission lines of RZ2109 have been variously modelled as a mass black hole tidally disrupting a horizontal branch star (Clausen et al., 2012) and as the ejecta from a R Corona Borealis star being photoionised by an unrelated X-ray source elsewhere in the cluster Maccarone & Warner (2011). The goal of this paper is to consider all known GC ULX sources to better understand their nature and constrain these models.
In this paper, we undertake an analysis of the eight known globular cluster ULXs with L erg s-1 to broaden our understanding of these sources. As noted above, three of these sources have been studied previously, while five are new to this paper. Section 2 discusses the Chandra observations and analysis, the results are presented in Section 3. The major results of the paper are discussed further in Section 4.
2 Data and Analysis
2.1 Globular Cluster ULX Sample
We consider low mass X-ray binaries (LMXBs) in the sample of seven local early-type galaxies as presented in Peacock et al. (2014). The galaxies studied are all within 20 Mpc and have deep Chandra observations of ksec. We select the targets that are located in GCs in these galaxies and that have X-ray luminosities greater than erg s-1. The X-ray fluxes of the point sources in these galaxies are published by Paolillo et al. 2011 (NGC 1399), Brassington et al. 2008 (NGC 3379), Brassington et al. 2009 (NGC 4278), Joseph 2013 (NGC 4472), Li et al. 2010 (NGC 4594), Luo et al. 2013 (NGC 4649), and Sivakoff et al. 2008 (NGC 4697). Globular cluster X-ray sources were then identified from these catalogues by matching to optical counterparts in aligned HST optical images (see Peacock et al., 2014; Luo et al., 2013, for details). The resulting catalogue of high probability GC LMXB candidates is used to select ULX sources.
Sivakoff et al. (2007) predict that the X-ray luminosity of bright GC sources is dominated by a single high luminosity object and not from multiple fainter sources with a combined high luminosity. Many of the sources in our sample are also highly variable in X-ray, which also implies that most or all of the luminosity comes from a single source (see Maccarone et al. 2007 and Section 2.3 for further discussion of source variability). See Table 1 for source coordinates and optical cluster properties. We present new data and analysis of three of the previously studied sources (Irwin et al. 2010; Maccarone et al. 2011; Roberts et al. 2012), and new analysis of five GC ULXs which have not yet been previously studied in depth.
2.2 Spectral Fitting
We use archival Chandra data of NGC 1399, NGC 4472 and NGC 4649 (See Tables 2. For these observations, we use ciao-4.9111http://cxc.harvard.edu/ciao/’s (Fruscione et al., 2006) specextract function to extract the spectra, with approximately 2.5′′ circular regions on the sources, and set a series of 5-10 similarly shaped regions in source-less areas around the sources to select the background regions. We follow Dage et al. (2018) for all fitting of Chandra spectra. Observations with counts greater than 100 were binned by 20, those with less were binned by 1. We fit the spectra with with xspec222https://heasarc.gsfc.nasa.gov/xanadu/xspec/ (Arnaud, 1996), using statistics for the more detailed spectra and C-statistics333https://heasarc.gsfc.nasa.gov/xanadu/xspec/manual/XSappendixStatistics.html (Cash, 1979) for the spectra which were binned in counts of 1. We set the abundance of elements to Wilms (Wilms et al., 2000), and freeze the value of the equivalent hydrogen column absorption (nH) to the value for that galaxy444http://cxc.harvard.edu/toolkit/colden.jsp. We use the “ignore bad" command to remove bad channels.
All of the data were fit with two separate single component models. The first is a multi-temperature blackbody disk (tbabs*diskbb) (Mitsuda et al., 1984). The second is a pegged power law model (tbabs*pegpwrlw) with the normalisation pegged from 0.5-8.0 keV. We also fit the high count (>100 counts) data with a two component model tbabs*(diskbb+pegpwrlw), and used F-test to determine if any improvement was statistically significant. Lastly, we determine to what extent (if any) there is intrinsic absorption in these systems by fitting a second absorbing column to the high count data (tbabs*tbabs*pegpwrlw and tbabs*tbabs*diskbb.)
The pegpwrlw model is normalised such that the best fit to the power law norm is the unabsorbed flux from 0.5-8.0 keV. To determine the unabsorbed flux in the models fit by diskbb,we multiply the models by cflux, with the energy range between 0.5 and 8 keV and fit. To calculate the luminosities, we use the distances of 20.0 Mpc for NGC 1399 (Blakeslee et al., 2001), 16.8 Mpc for NGC 4472 (Macri et al., 1999) and 16.5 Mpc for NGC 4649 (Blakeslee et al., 2009).
| Object | RA | Dec | Host Galaxy (Distance) | ||
|---|---|---|---|---|---|
| RZ2109 | 12:29:39.9 | +07:53:33.3 | 20.4 555Converted from V to by using the relation V = - 0.39() + 0.07 (Peacock et al., 2010). | 0.84 666 conversion from B-R used the following relationship: = 1.305(B-R) - 0.543 (Peacock et al., 2010). | NGC 4472 (16.8 Mpc)777Distance from Macri et al. 1999 |
| GCU1 | 12:29:41.0 | +07:57:44.2 | 20.8 \@footnotemark | 1.59 888 conversion from V-I used the following relationship: = 1.518(V-I) - 0.443 (Peacock et al., 2010). | NGC 4472 (16.8 Mpc)\@footnotemark |
| GCU2 | 12:29:34.5 | +08:00:32.1 | 22.1 | 0.92 | NGC 4472 (16.8 Mpc)\@footnotemark |
| GCU3 | 12:29:42.3 | +08:00:08.1 | 19.5 | 1.42 | NGC 4472 (16.8 Mpc)\@footnotemark |
| GCU4 | 12:29:34.5 | +07:58:51.6 | 20.1 | 1.11 | NGC 4472 (16.8 Mpc)\@footnotemark |
| GCU5 | 12:43:46.9 | +11:32:34 | 20.3 | 1.55 | NGC 4649 (16.5 Mpc)999Distance from Blakeslee et al. 2009 |
| GCU6 | 12:43:44.5 | +11:31:50 | 22.2 | 1.60 | NGC 4649 (16.5 Mpc)\@footnotemark |
| GCU7 | 03:38:31.8 | -35:26:04 | 20.7 | 1.98 | NGC 1399 (20.0 Mpc)101010Distance from Blakeslee et al. 2001 |
| GCU8 | 03:38:32.6 | -35:27:05.7 | 19.9 | 2.24 | NGC 1399 (20.0 Mpc)\@footnotemark |
2.2.1 NGC 4472 GC ULXs
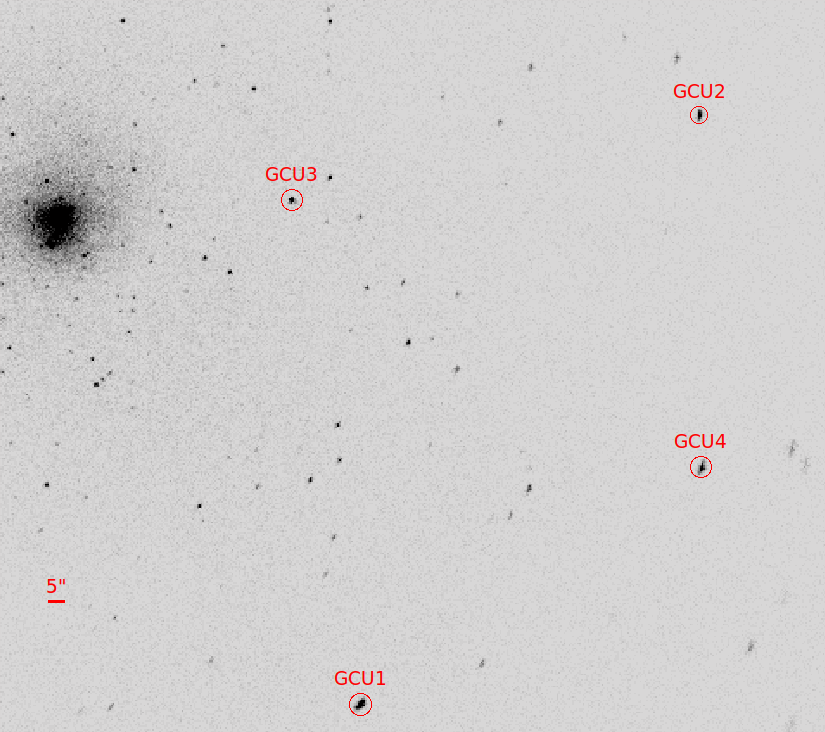
There are five globular cluster ULX sources in NGC 4472 with erg s-1. The brightest of these, RZ2109 has been previously well studied in both X-ray and optical (Maccarone et al. 2007, Zepf et al. 2008, Shih et al. 2008, Steele et al. 2011b, Dage et al. 2018). A second globular cluster ULX, CXOU 1229410+0757442, hereafter GCU1, has also been studied in some detail by Maccarone et al. (2011). There are three other GC ULXs, CXOU 1229345+08003209, (hereafter GCU2), CXOU 1229423+08000808 (hereafter GCU3), CXOU1229345+07585155 (hereafter GCU4), which have not yet been studied in depth (see Figure 1 for a Chandra image of the source locations.). At least 10 different Chandra observations exist for these sources spanning from the year 2000 to 2016 (see Table 2), enabling a study of their spectral properties and behaviour on the scale of years to decades. Below, we discuss the spectral fitting results for all sources.
| ObsID | Date | ObsLen | GCU1 | GCU2 | GCU3 | GCU4 |
|---|---|---|---|---|---|---|
| (ks) | Cts | Cts | Cts | Cts | ||
| 322 | 2000-03-19 | 10.36 | 42 | 34 | 15 | 41 |
| 321 | 2000-06-12 | 39.59 | 134 | 142 | 178 | 196 |
| 8095 | 2008-02-23 | 5.09 | 31 | 11 | 11 | 21 |
| 11274 | 2010-02-27 | 39.67 | 458 | 115 | 196 | 180 |
| 12978 | 2010-11-20 | 19.78 | 12 | - | 2 | * |
| 12889 | 2011-02-14 | 135.59 | 1067 | 492 | 491 | 488 |
| 12888 | 2011-02-21 | 159.31 | 1559 | 506 | 644 | 641 |
| 16260 | 2014-08-04 | 24.74 | 6 | * | * | 50 |
| 16261 | 2015-02-24 | 22.76 | 58 | 42 | * | * |
| 16262 | 2016-04-30 | 24.73 | 136 | 50 | 89 | 52 |
2.2.1.1 CXOU 1229410+0757442 (GCU1)
For GCU1, Maccarone et al. (2011) have previously examined earlier data through ObsID 11274, and could not find a statistical difference between an absorbed power law model versus an absorbed disk model, preferring the disk model for physical reasons. While the lower count spectra were ambiguous as to whether a single disk model is a better fit than a single power law model, statistics for the deep observations (ObsIDs 12888 & 12889) indicate that the disk model alone is a much better fit than a single power law. Values for both models are presented in Table 3.
We fit a power law with a second absorbing column (tbabs*tbabs*pegpwrlw) to observations with greater than 100 source counts. We find that the nH is not inconsistent with zero in three of these observations. By comparison, fitting tbabs*tbabs*diskbb resulted in the second absorbing column consistent with zero that had significantly better values in all cases.
We also find that adding a power law component to the single component disk is not a statistically significant improvement to the fit of GCU1. Specifically, we used xspec’s F-test tool 111111https://heasarc.gsfc.nasa.gov/xanadu/xspec/manual/node83.html which found no statistically significant improvement in the fit from adding the second component. We compare the statistics of the two component model to both single component models; these values are presented in Table 4. We note that while ObsID 11274 seems to favor a two component model, the best fit two-component power law photon index is 6.8, which is not typical for X-ray binaries. We do not report the best fit values for the two-component models as they are not physically realistic or statistically significant.
2.2.1.2 CXOU 1229345+08003209 (GCU2)
GCU2 had consistently better fit statistics for a single component disk model (Table 3). The F-test values (Table 4) again indicate that a single component disk model is the best fit for this source.
We rule out the necessity of a second absorbing column for GCU2 by again fitting tbabs*tbabs*pegpwrlw and tbabs*tbabs*diskbb to the source. Only ObsIDs 11274 and 12888 have a second absorption component for the power law model that is non-zero, however, the disk model,which has the best fit second absorbing column consistent with zero, has significantly better fit statistics than the intrinsically absorbed power law.
2.2.1.3 CXOU 1229423+08000808 (GCU3)
We fit a power law model to longer observations of GCU3 with a second absorbing column, but found the best fit absorption to be consistent with zero in all cases. We fit GCU3 with both single component models (as reported in Table 3), as well as a two component model. The statistics generally favour a single component disk fit, or are inconclusive. The two component model only showed a significant statistical improvement in one observation (Table 4), however, the best fit two-component power law for that had a very high index of 5.7, which again is unphysical and much steeper than the typical value for X-ray binaries.
2.2.1.4 CXOU1229345+07585155 (GCU4)
We found that the best fit value for the second absorbing column of this source was consistent with zero across all of the longer observations. GCU4 was statistically better fit by tbabs*pegpwrlw (Table 3). The F-test values generally do not favour a two component model (Table 4), except for ObsID 12889. However, it again has an unphysical power law of 5.0.
| GCU1 | |||||||
| tbabs*pegpwrlw | tbabs*diskbb | ||||||
| ObsID/Date | /d.o.f. | PL Flux | Disk Norm | /d.o.f. | Disk Flux | ||
| or (C-stat) | ( erg cm-2 s | (keV) | () | or (C-stat) | ( erg cm-2 s | ||
| 322 (2000-03-19) | 1.7 ( 0.5) | (22.74/36) | 4.5 ( | 0.75 ( | 136.13∗∗ | (26.83/36) | 2.9 ( |
| 321 (2000-06-12) | 1.7 ( 0.2) | 3.41/5 | 2.6 ( 0.6) | 0.98 ( | 12.9 ( | 1.51/5 | 2.3 ( |
| 11274 (2010-02-27) | 1.3 ( 0.1) | 1.77/22 | 12.8 ( 1.4) | 1.7 ( | 7.7 ( | 1.74/22 | 11.1 () |
| 12889 (2011-02-14) | 1.6 ( 0.10) | 2.25/49 | 6.8 ( 0.5) | 1.13 () | 18.5 ( | 1.25/49 | 5.8() |
| 12888 (2011-02-21) | 1.5 ( 0.1) | 1.71/69 | 8.8 ( 0.5) | 1.29 () | 14.1 ( | 1.10/69 | 7.6( |
| 16261 (2015-02-24) | 2.0 ( 0.4) | (47.61/51) | 3.3 () | 0.87 () | 64.01∗∗ | (41.04/51) | 2.7( |
| 16262 (2016-04-30) | 1.8 () | 0.73/5 | 5.9 ( 1.0) | 0.98 ( | 26.9( | 0.55/5 | 4.9() |
| GCU2 | |||||||
| ObsID/Date | /d.o.f. | PL Flux | Disk Norm | /d.o.f. | Disk Flux | ||
| or (C-stat) | ( erg cm-2 s | (keV) | () | or (C-stat) | ( erg cm-2 s | ||
| 322 (2000-03-19) | 1.4 (0.5) | (35.31/32) | 3.9 ( | 1.29 ( | 24.2 ∗∗ | (31.83/32) | 3.2 ( |
| 321 (2000-06-12) | 1.3 ( 0.2) | 3.11/6 | 3.0 ( 0.7) | 1.36 ( | 3.8 ( | 0.70/6 | 2.5 ( |
| 11274 (2010-02-27) | 1.4 ( 0.3) | 3.27/5 | 2.9 ( 0.7) | 1.45 ( | 7.89∗∗ | 1.35/5 | 2.5 () |
| 12889 (2011-02-14) | 1.4 ( 0.1) | 9.29/24 | 3.5 ( 0.4) | 1.37 () | 4.5( | 1.11/24 | 3.0( ) |
| 12888 (2011-02-21) | 1.6 ( 0.1) | 965459.3/24 | 3.2 ( 0.3) | 1.16 () | 7.3 ( | 1.36/24 | 2.6( |
| 16261 (2015-02-24) | 1.6 ( 0.5) | (38.69/37) | 2.5 () | 1.25 () | 5.67∗∗ | (36.00/37) | 2.1( |
| 16262 (2016-04-30) | 1.9 ( 0.5) | (36.02/49) | 2.91 () | 1.10 () | 32.0∗∗ | (37.53/49) | 2.40 () |
| GCU3 | |||||||
| ObsID/Date | /d.o.f. | PL Flux | Disk Norm | /d.o.f. | Disk Flux | ||
| or (C-stat) | ( erg cm-2 s | (keV) | () | or (C-stat) | ( erg cm-2 s | ||
| 321 (2000-06-12) | 1.3 () | 0.75/8 | 3.7 ( 0.7) | 1.41 ( | 4.1 ( | 0.43/8 | 3.2 ( |
| 11274(2010-02-27) | 1.4 0.2) | 2.56/8 | 4.5 ( | 1.19 ( | 9.5( | 1.36/8 | 3.6() |
| 12889 (2011-02-14) | 1.4 (0.1) | 0.90/23 | 3.3 ( 0.4) | 1.39 ( | 3.9 ( | 0.95/23 | 2.9 ( |
| 12888 (2011-02-21) | 1.5 (1.0) | 1.64/30 | 3.6 ( 0.3) | 1.31 () | 5.4( | 0.92/30 | 3.1( |
| 16262 (2016-04-30) | 1.5 ( 0.4) | (81.63/77) | 4.4 | 1.27 () | 20.9∗∗ | (78.08/77) | 3.6( |
| GCU4 | |||||||
| ObsID/Date | /d.o.f. | PL Flux | Disk Norm | /d.o.f. | Disk Flux | ||
| or (C-stat) | ( erg cm-2 s | (keV) | () | or (C-stat) | ( erg cm-2 s | ||
| 322 (2000-03-19) | 1.9( | (220.21/38) | 4.3 ( | 1.20 ( | 10.6 ( | (30.64/38) | 4.2 ( |
| 321 (2000-06-12) | 1.6 ( | 0.64/7 | 5.3 ( | 0.98 ( | 20.9 ( | 1.32/7 | 3.7 ( |
| 8095 (2008-02-23) | 1.4 () | (25.54/22) | 3.8 ( | 1.2 ( | 10.6∗∗ | (24.54/22) | 3.0 ( |
| 11274 (2010-02-27) | 1.5 ( | 0.82/7 | 4.4() | 1.52 ( | 3.7 ( | 1.69/7 | 3.8 ( 0.9) |
| 12889 (2011-02-14) | 1.5 () | 1.42/25 | 3.63 ) | 1.28 ( | 5.9 ( | 1.48/25 | 3.0 ( 0.4) |
| 12888 (2011-02-21) | 1.5 () | 1.20/33 | 4.0 ( | 1.39 ( | 4.7 ( | 1.82/33 | 3.3 ( 0.4) |
| 16260 (2014-08-04) | 1.5 ( ) | (41.84/48) | 2.5( | 1.4 ( | 2.7 ( | (43.73/48) | 2.2 ( |
| 16261 (2015-02-24) | 1.5 () | (43.75/58) | 4.1( | 1.46( | 13.8∗∗ | (44.97/58) | 3.6 ( |
| 16262 (2016-04-30) | 1.5 ( | (48.88/50) | 3.5() | 1.5 ( | 15.5∗∗ | (48.94/50) | 3.0 ( |
| GCU1 | GCU2 | GCU3 | GCU4 | |||||
|---|---|---|---|---|---|---|---|---|
| ObsID | Disk | PL | Disk | PL | Disk | PL | Disk | PL |
| 321 | 1 | 0.31 | 1 | 0.06 | 0.01 | 0.99 | 0.15 | 0.99 |
| 11274 | 0.07 | 0.06 | ||||||
| 12889 | 0.18 | 5.65e-8 | 0.10 | 0.17 | 2.31e-3 | 4.07e-3 | 0.06 | 0.01 |
| 12888 | 0.14 | 1.37e-7 | 0.36 | 5.83e-4 | 0.10 | 6.01e-6 | 1.35e-3 | 1 |
2.2.2 NGC 4649 GC ULXs
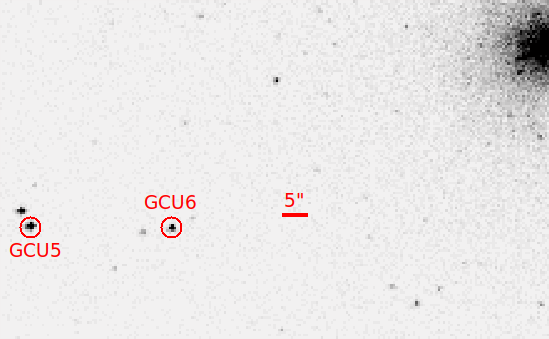
NGC 4649 hosts two GC ULXs, CXOUJ1243469+113234 (hereafter GCU5) (Roberts et al., 2012) and CXOU1243445+113150 (hereafter GCU6) (see Figure 2 for a Chandra image of the source locations.).
| ObsID | Date | ObsLen | GCU5 | GCU6 |
|---|---|---|---|---|
| (ks) | Cts | Cts | ||
| 785 | 2000-04-20 | 38.11 | 65 | 135 |
| 8182 | 2007-01-30 | 52.37 | 468 | 196 |
| 8507 | 2007-02-01 | 17.52 | 111 | 45 |
| 12976 | 2011-02-24 | 101.04 | 773 | 265 |
| 12975 | 2011-08-08 | 84.93 | 505 | 260 |
| 14328 | 2011-08-12 | 13.97 | 84 | 39 |
2.2.2.1 CXOUJ1243469+113234 (GCU5)
As noted in Roberts et al. (2012), GCU5 shows better fit statistics for the single power law component. ObsID 12975 is an exception here; the single disk component had much better fit statistics than the single power law. However, Roberts et al. (2012) found that this observation had a second intrinsic absorbing column that was significant. We do not account for such a component here, but it could explain why in this particular instance, a disk was a better fit than a single power law, when a power law has typically a better fit than a disk in previous observations. The F-test values for comparison between a single component model and a two component model are listed in Table 6 and the best fit values for either single component models are listed in Table 8.
2.2.2.2 CXOU1243445+113150 (GCU6)
GCU6 is ambiguous as to whether a single disk model or a single power law model is a better fit. See Table 6 for a comparison of the single disk versus power law model.The F-test values for GCU6 (Table 7) indicate that the two component model is not a better fit to the data. We find that this source has a significant (non-zero) second absorbing column for ObsIDs 8182 and 12975. When comparing these observations to a disk model with a best fit second absorbing column that is consistent with zero, we find that it is statistically ambiguous as to which model is a better fit. We present these fits in Table 8.
| GCU5 | |||||||
| tbabs*pegpwrlw | tbabs*diskbb | ||||||
| ObsID/Date | /d.o.f. | PL Flux | Disk Norm | /d.o.f. | Disk Flux | ||
| or (C-stat) | ( erg cm-2 s | (keV) | () | or (C-stat) | ( erg cm-2 s | ||
| 785 (2000-04-20) | 1.6 (0.3) | (61.54/59) | 1.3 ( | 1.08 ( | 12.5∗∗ | (65.99/59) | 1.1 ( |
| 8182 (2007-01-30) | 1.2 ( 0.1) | 1.47/21 | 9.3 ( 1.1) | 2.02( | 2.9( | 1.68/21 | 8.6 ( |
| 8507 (2007-02-01) | 1.5 ( 0.3) | 2.52/4 | 5.3 ( | 1.27 ( | 9.2( | 2.00/4 | 4.6( |
| 12976 (2011-02-24) | 1.6 ( 0.1) | 1.50/36 | 6.2 ( 0.6) | 1.09 ( | 19.4( | 1.93/36 | 5.3 ( ) |
| 12975 (2011-08-08) | 1.1 ( 0.1) | 1.20/23 | 7.0 ( 0.7) | 2.18 ( | 1.6 ( | 0.74/23 | 6.2( |
| 14328 (2011-08-12) | 1.2 ( 0.3) | (48.53/77) | 7.02( | 2.1 ( | 7.20∗∗ | (49.51/76) | 6.4( |
| GCU6 | |||||||
| ObsID/Date | /d.o.f. | PL Flux | Disk Norm | /d.o.f. | Disk Flux | ||
| or (C-stat) | ( erg cm-2 s | (keV) | () | or (C-stat) | ( erg cm-2 s | ||
| 785 (2000-04-20) | 1.3 (0.2) | 0.95/5 | 3.2 ( | 1.32 ( | 10.3∗∗ | 1.71/5 | 2.3 ( |
| 8182 (2007-01-30) | 1.3 ( 0.2) | 1.41/8 | 3.7 ( 0.6) | 1.28( | 5.5 ( | 0.95/8 | 2.9 ( |
| 8507 (2007-02-01) | 1.5 ( 0.4) | (35.81/43) | 2.4( | 1.27 ( | 13.6∗∗ | (43.23/44) | 2.0 ( |
| 12976 (2011-02-24) | 1.6 ( 0.2) | 1.34/12 | 2.2 ( 0.3) | 1.12 ( | 5.7 ( | 2.04/12 | 5.3( |
| 12975 (2011-08-08) | 1.1 ( 0.2) | 1.96/12 | 3.6 (0.5) | 2.15 ( | 0.9 ( | 1.67/12 | 3.2() |
| 14328 (2011-08-12) | 2.0 ( 0.5) | (27.63/37) | 2.1 ( 0.2) | 0.65 ( | 64.5∗∗ | (31.03/37) | 1.6 ( |
| GCU5 | GCU6 | |||
| ObsID | Disk | PL | Disk | PL |
| 785 | - | - | 0.33 | 0.80 |
| 8182 | 0.09 | 0.31 | 0.65 | 0.20 |
| 12976 | 2.72 | 0.19 | 0.12 | 1 |
| 12975 | 0.99 | 6.41 | 1 | 0.47 |
| ObsID/Date | PL /d.o.f. | PL Flux | Disk /d.o.f. | |||
|---|---|---|---|---|---|---|
| ( cm-2) | ( erg cm-2 s -1) | |||||
| 8182 (2007-01-30) | 0.17 | 1.8 ( 0.4) | 0.84/7 | 3.7 ( 0.6) | 1.1/7 | |
| 12975 (2011-08-08) | 0.25 | 1.5 ( 0.4) | 1.85/11 | 3.7 (0.5) | 1.82/11 |
2.2.3 NGC 1399 GC ULXs
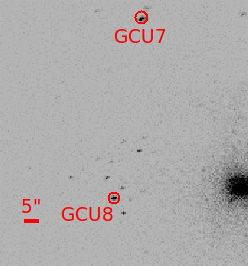
NGC 1399 hosts three GC ULXs. One, CXOKMZJ033831.7353058 (Shih et al., 2010) has faded beyond detection by 2005, and we do not study it here. CXOJ0338318-352604, (hereafter GCU7) has been previously studied by Irwin et al. (2010), while the third, CXOU0338326-35270567 (hereafter GCU8) is bright but has not been previously extensively studied in X-ray. We present new analysis on both old and new data (Table 9). see Figure 3 for a Chandra image of the source locations and any nearby sources.
| ObsID | Date | ObsLen | GCU7 | GCU8 |
|---|---|---|---|---|
| (ks) | Cts | Cts | ||
| 320 | 1999-10-18 | 3.38 | 12 | 23 |
| 319 | 2000-01-18 | 56.04 | 448 | 629 |
| 239 | 2000-01-19 | 3.60 | 14 | 22 |
| 240 | 2000-06-16 | 43.53 | 12 | 44 |
| 2389 | 2001-05-08 | 14.67 | 13 | 10 |
| 4172 | 2003-05-26 | 44.50 | 114 | 294 |
| 9530 | 2008-06-08 | 59.35 | 248 | 366 |
| 14527 | 2013-07-01 | 27.79 | 136 | 230 |
| 16639 | 2014-10-12 | 29.67 | 171 | 162 |
| 14529 | 2015-11-06 | 31.62 | 132 | 226 |
2.2.3.1 CXOJ0338318-352604 (GCU7)
GCU7 shows better fit statistics for the single component disk model (Table 10). The F-test values indicate that the two component model is not necessary, except perhaps for ObsID 319 (Table 11). However, the two component model has a best fit power law index of 5.7. Fitting this source with a second absorption component plus power law gives an absorption that is consistent with zero in almost all cases, and for all fits of tbabs*tbabs*pegpwrlw, the power law index is between 3-4, which implies that the spectrum is very soft and unlikely to be fit by a power law model of any sort.
Clausen et al. (2012) model this system as the tidal disruption of a horizontal giant branch star by an intermediate mass black hole, while Maccarone & Warner (2011) model this as a R Corona Borealis star illuminated by a bright X-ray source. Neither scenario is ruled out by the observed shallow decline of the . Other binary system models might also be consistent with these data.
2.2.3.2 CXOU0338326-35270567 (GCU8)
We find that there is no evidence for a second absorbing column of any sort for this source.The F-test values for GCU8 rule out a two component model (Table 11), and the statistics indicate that a single power law component is the best fit model for this source. (Table 10). Note that the best fit values of the disk norms for GCU8 are upper limits, even in the higher count observations binned by 20 and fit with statistics, most likely because the single disk fit for this source was not a good fit to the point where xspec had difficulty fitting the normalisations to these spectra.
GCU8 was marginally detected in ObsID 2389. We used the WebPIMMS tool to estimate an upper limit on the unabsorbed flux using a count rate of 6.8 ct/s, and a fixed powerlaw index of 1.7, with the fixed to frozen to 1.34 cm-2 .
| GCU7 | |||||||
| tbabs*pegpwrlw | tbabs*diskbb | ||||||
| ObsID/Date | /d.o.f. | PL Flux | Disk Norm | /d.o.f. | Disk Flux | ||
| or (C-stat) | ( erg cm-2 s | (keV) | () | or (C-stat) | ( erg cm-2 s | ||
| 320 (1999-10-18) | 3.1 ( | (10.91/12) | 2.1 ( | 0.28 ( | 46.8∗∗ | (8.50/12) | 4.8 ( |
| 319 (2000-01-18) | 2.4 ( 0.1) | 8.32/24 | 2.9 ( 0.3) | 0.39 ( | 7.3 ( | 1.70/24 | 2.5( |
| 239 (2000-01-19) | 3.1 ( | (14.53/13) | 2.5 ( | 0.27 ( | 288.4∗∗ | (12.36/13) | 2.3 ( |
| 240 (2000-06-16) | 2.7 ( | (24.99/17) | 1.6( | 0.52 ( | 1.3 ( | (22.28/17) | 1.5( |
| 2389 (2001-05-08) | 3.8 ( | (10.30/12) | 4.1 ( | 0.21 ( | 1272∗∗ | (8.94/12) | 4.3( |
| 4172 (2003-05-26) | 2.9 () | 0.76/5 | 2.1 ( 0.3) | 0.36 () | 7.7( | 0.96/5 | 1.7( |
| 9530 (2008-06-08) | 2.6 ( 0.2) | 2.64/12 | 2.4 ( 0.3) | 0.34 () | 11.9( | 1.25/12 | 2.0() |
| 14527 (2013-07-01) | 2.7 ( 0.3) | 3.71/6 | 3.2 () | 0.39 () | 7.9( | 0.98/6 | 2.7() |
| 16639 (2014-10-12) | 2.7 () | 1.99/7 | 4.0 ( 0.6) | 0.43 () | 6.6( | 0.94/7 | 3.4() |
| 14529 (2015-11-06) | 3.0 () | 3.23/5 | 3.2 () | 0.35 () | 14.2( | 1.65/5 | 2.7() |
| GCU8 | |||||||
| ObsID/Date | /d.o.f. | PL Flux | Disk Norm | /d.o.f. | Disk Flux | ||
| or (C-stat) | ( erg cm-2 s | (keV) | () | or (C-stat) | ( erg cm-2 s | ||
| 320 (1999-10-18) | 1.3 () | (18.87/20) | 8.8 ( | 1.8 | 4.09∗∗ | (19.54/18) | 7.8 ( |
| 319 (2000-01-18) | 1.4 ( | 1.37/31 | 8.3 ( | 1.27( | 13.5 ( | 1.84/31 | 6.7 ( 0.9) |
| 240 (2000-06-16) | 1.5 ( | (51.46/48) | 5.9 ( 1.7) | 1.8 ( | 3.14∗∗ | (53.01/48) | 5.5( |
| 2389 (2001-05-08) | - | - | - | - | - | - | 0.5 121212Upper limit calculated using http://cxc.harvard.edu/toolkit/pimms.jsp |
| 4172 (2003-05-26) | 1.1 () | 1.24/12 | 9.5( | 2.6 ( | 3.78∗∗ | 1.74/12 | 8.7 ( |
| 9530 (2008-06-08) | 1.5 () | 0.66/16 | 5.6( | 1.28 ( 0.30) | 8.7 ( | 1.25/16 | 4.5 ( 0.8) |
| 14527 (2013-07-01) | 1.3 () | 0.42/9 | 9.7() | 1.36( | 11.0 ( | 0.28/9 | 7.2 ( |
| 16639 (2014-10-12) | 1.1 () | 0.78/6 | 8.0 | 2.0( | 9.09∗∗ | 0.96/6 | 6.3 ( |
| 14529 (2015-11-06) | 1.2 () | 0.52/9 | 10.2( | 2.0( | 9.46∗∗ | 0.67/9 | 8.4 ( |
| GCU7 | GCU8 | |||
| ObsID | Disk | PL | Disk | PL |
| 319 | 0.08 | 7.63 | 6.14 | 0.44 |
| 4172 | 0.22 | 0.46 | 0.19 | 1 |
| 9530 | 0.56 | 0.04 | 0.01 | 1 |
| 14527 | 0.54 | 0.11 | 0.51 | 0.12 |
| 16639 | 0.11 | 0.03 | 0.65 | 1 |
| 14529 | 0.54 | 0.37 | 0.42 | 0.99 |
2.3 Long and Short-term X-ray Variability
RZ2109 has been shown to vary both long and short term (see Maccarone et al. 2007, for example; Shih et al. 2010, for example; Dage et al. 2018, for example), which is leading evidence for its compact object being a black hole accretor. Other GC ULXs show some significant long-term variability, and quantifying the variability of these sources on either long or short timescales can shed light on the nature of the objects that make up these ULX systems.
2.3.1 Long-Term Variability
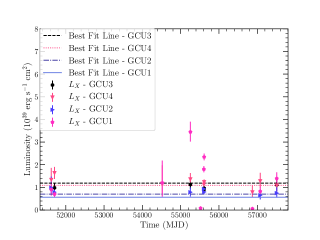
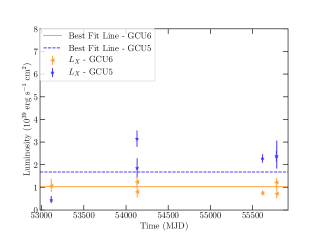
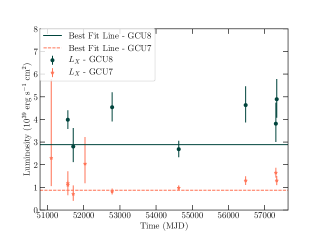
We found the average luminosity comparing the data to a range of 5000 luminosities drawn from the lowest to the highest for the source and computing the reduced in each case. We plot the luminosity with the closest to 1.0 as the mean luminosity. This is plotted for all the sources in Figure 4.
To quantify the variability of these sources, we do a minimisation fit of the data using scipy131313https://docs.scipy.org/doc/scipy/reference/generated/scipy.stats.chisquare.html with a model of constant luminosity, using the best fit luminosity from above as the mean value. We find that GCU2, GCU3, GCU4 and GCU6 have values less than 1 (e.g., no evidence for long-term variability), while GCU1, GCU5, GCU6 and GCU7 have very large values, indicating that they are much more variable. These values are presented in Table 12.
| Source | GCU1 | GCU2 | GCU3 | GCU4 | GCU5 | GCU6 | GCU7 | GCU8 |
|---|---|---|---|---|---|---|---|---|
| 26.33 | 0.22 | 0.17 | 0.55 | 3.00 | 0.30 | 5.22 | 4.12 |
2.3.2 Short-term (inter-observational) variability
Two GC ULXs (Maccarone et al., 2007; Shih et al., 2010) show variability on short time scales. We extracted light curves of GC ULXs from our sample in any observations that had 500 source counts or greater (see Tables 2, 5, and 9). The source GCU1 shows interesting behaviour in ObsIDs 12888 and 12889. These observations were taken a week apart, and were each near 150ks in length. The fluxes in each observation were significantly different (see Table 3), and yet within the observation, no clear variability was observed.
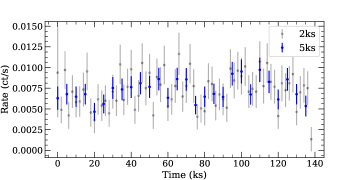
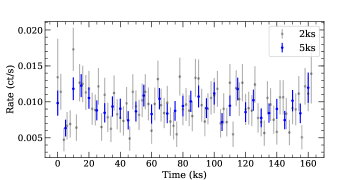
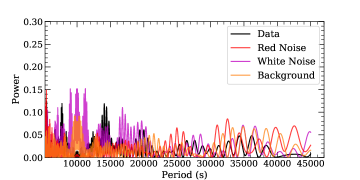
We also search for inter-observational variability or periodicities in any Chandra light curves with greater than 500 source counts (See Tables 2, 5, 9). We implement a generalized Lomb-Scargle periodogram algorithm 141414http://www.astroml.org/modules/generated/astroML.time_series.lomb_scargle.html (Lomb, 1976; Scargle, 1982) on combined long observations of the four sources in NGC 4472 and two in NGC 4649 to search for any trends within the observation. The background subtracted light curves as well as the background were extracted from event files filtered to 0.5-8.0 keV using CIAO’s dmextract tool, and binned by 2 ksec and 5 ksec.
To determine how significant (if at all) any periods identified in the periodogram are, we computed the periodograms of red noise, white noise and the background and compare them to the periodogram of the data for bins of 2 ksec and 5 ksec. We use the DELCgen package (Connolly, 2016) to generate red noise simulations of the Chandra light curves (Timmer & Koenig, 1995). We also extract background light curves and compute the Lomb-Scargle periodogram in the same manner. For white noise, we shuffle151515https://docs.scipy.org/doc/numpy-1.15.0/reference/generated/numpy.random.shuffle.html our original light curves and re-compute the periodogram.
We find that there are no clear significant periods in this data and that white noise is the main cause of spurious signals in the Lomb-Scargle periodogram (see Figure 5, (lower panel) for the various contributions of noise to the detected signals in the data).
3 RESULTS
We fit a sample of eight GC ULXs located in NGC 1399, NGC 4472 and NGC 4649 (see Table 1) with two different single component models, an absorbed disk or an absorbed power law, and take data from the literature for a ninth (Dage et al., 2018). We also consider a power law with intrinsic absorption, but find that for almost all the sources, the intrinsic absorption component was either consistent with zero, or not a statistical improvement over a disk model.
We also consider a two component model, however, it was not enough of a statistical improvement over the single component model. In the few cases where the two component model was a statistical improvement, the power law index was always unphysical. The statistics for the single component models either indicated that one model was a better fit than the other, or the statistics were comparable, except in the case of GCU6, which was ambiguous.
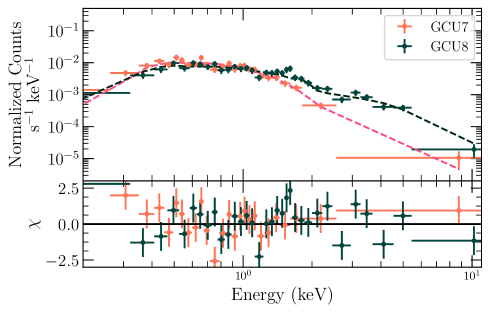
Figure 6 shows the best fit models and residuals for spectra from GCU7 and GCU8. GCU8 was consistently brighter than GCU7 (see Table 9), and the best fit model was a power law with no intrinsic absorption. The lower luminosity source, GCU7, was best fit by a diskbb model. In this case specifically, the system producing the emission in GCU8 is physically different than that of GCU7.
The data never require that the sources change between a disk to a power law between observations, although it is difficult to [strongly] rule out the possibility. The ninth GC ULX source, RZ2109 is the only source that is clearly a two component model (Shih et al., 2008); however its power law indices were not well constrained (Dage et al., 2018). Like these other GC ULX sources, RZ2109 also shows no strong evidence for changes in spectral state.
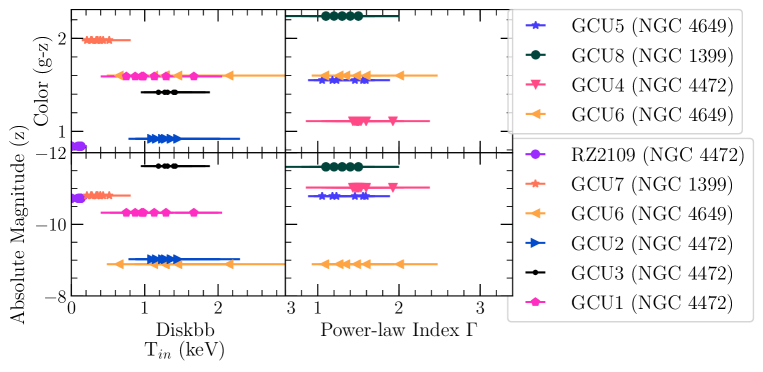
We also compare optical cluster colour (g-z) and magnitude (z) to the best fit spectral index in Figure 7. There does not appear to be clear correlation between optical colour and X-ray behaviour of the sources.
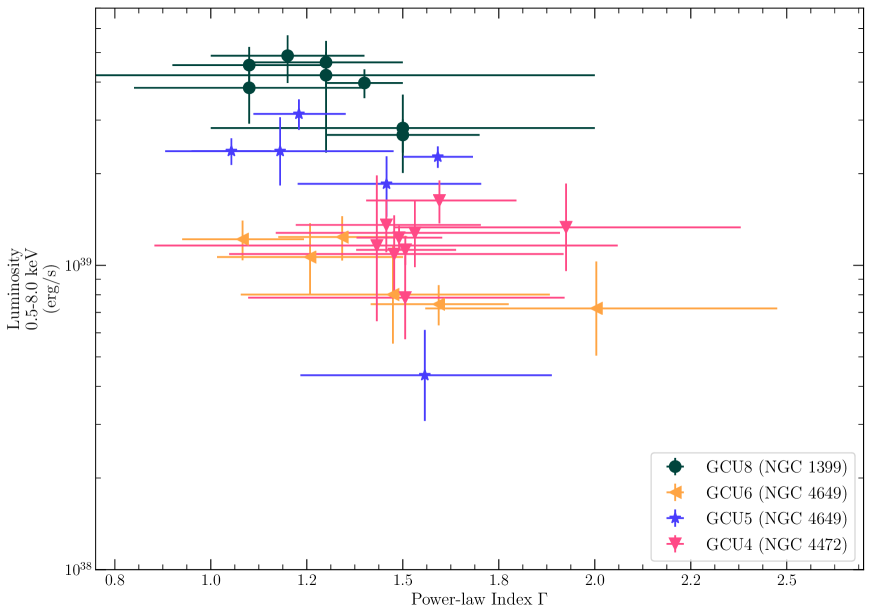
The ultimate aim of this paper is to study the behaviour of the brightest ( erg s-1) GC ULXs. To quantify how the spectral parameters of these sources change with their luminosity, we plot the values of the spectral component versus luminosity in Figures 9 and 10. Any GC ULX with largely better statistics for a power law was plotted in Figure 9; any source with consistently better statistics for a disk is plotted in Figure 10. GCU6 was ambiguous as to whether a disk or a power law was a better fit, so we therefore present it on both plots.
The power law sources show little variability in either or luminosity. Within uncertainties, both GCU8 and GCU4 have similar luminosity and power law index values across all of their own observations, with GCU4 at a lower luminosity than GCU8. GCU6 also does not vary significantly in either parameter. GCU5 seems to follow the same behaviour, except for ObsID 785 (2000-04-20), the first observation taken of this source. It seems as though it begins with a low luminosity, then brightens and stays fairly consistent at that luminosity/.
The disk sources appear to be bimodal: they are either sources with greater than 0.5 keV, or much less than that temperature. Of the sources with 0.5 keV, GCU1 shows the most variability. GCU6 shows some variability in and . GCU2 and GCU3 do not show significant variability in either luminosity or disk temperature.
Finally, the two sources with nearly steady disk temperatures below 0.5 keV, RZ2109 at 0.15 keV and GCU7 at 0.4 keV do show significant variability in luminosity while having no large change in . It is of note that the only sources that vary significantly with but not visibly with the spectral parameter are RZ2109 and GCU7. Interestingly, both RZ2109 and GCU7 show optical emission lines (Zepf et al., 2008; Irwin et al., 2010).
To determine the extent to which variations in luminosity and variations in spectral fit parameter (either kT or ) are correlated and estimate the correlation slope, we determine the best fit line to the data for each individual source. To carry out this fit, we use linmix161616Python port by J. Meyers: https://github.com/jmeyers314/linmix (Kelly, 2007) which uses Bayesian inferences, and develops MCMC sampling to allow linear fits while accounting for uncertainties in both variables. However, this implementation does not allow asymmetric parameter uncertainties which typically rise in X-ray spectral fits. Thus, we conservatively chose the larger uncertainty value on each parameter for both lower and upper values. We fit the correlation with as a function of , which allows a simple test for lack of correlation for systems which luminosity seems to vary independent of disk temperature (RZ2109 and GCU7).
| Object | Slope |
|---|---|
| RZ2109 | 0.0 0.02 |
| GCU1 | |
| GCU7 |
We used this method to fit the slopes of RZ2109, GCU1, and GCU7. The best fit slopes and uncertainties are reported in Table 13. We did not fit slopes for GCU2, GCU3, or GCU6 as they do not appear to vary significantly in either kT or . The difference in slopes between the sources below 0.5 keV (RZ2109 and GCU7) and the sources above 0.5 keV (GCU1) is suggestive of a dichotomy between low kT and high kT sources, with the low kT sources having a slope that is likely consistent with zero, and some high kT sources having a non-zero slope. See Figure 8 for the best fit slopes and errors of RZ2109, GCU1 and GCU7.
4 CONCLUSIONS
We consider a total sample of nine ultraluminous X-ray sources ( erg s-1) physically associated with globular clusters for which we do new data analysis for eight and rely on our previous study of RZ2109 for the ninth. We find that the sources are best fit by a single component - either an absorbed disk or an absorbed power law. Two component absorbed disk plus power law model is not statistically required for any of these sources. The two component fits also give unphysical power law indices.
When we compare the luminosity to the spectral parameters of the sources, we find that sources best fit as power laws have either no clear variability in either power law index or luminosity, or only show mild variability in each parameter. When comparing luminosity to inner disk temperature, the sources split into two temperature ranges, one group with temperatures above 0.5 keV, and the other with low . The part of the sample best fit by disks with temperatures below 0.5 keV and show strong variability in luminosity with no clear variability in disk temperature. The disk sources with temperatures below 0.5 keV are the only ones to show variability only in luminosity, without significant corresponding spectral changes.
Prior work (Angelini et al., 2001; Kundu et al., 2002; Sarazin et al., 2003; Jordán et al., 2004) has shown that more luminous (and presumably more massive) globular clusters are more likely to contain low mass X-ray binaries. Beyond that, our GC ULX sample does not show any clear correspondence of X-ray behaviour or luminosity to the optical photometric properties of the cluster. However, some aspects of the X-ray behaviour appear to correlate with the presence of optical emission lines. RZ2109, GCU7 and GCU5 all have published optical spectra. RZ2109 shows bright and broad [OIII] emission lines beyond the globular cluster continuum, with no hydrogen emission detected (Zepf et al., 2008). GCU7 has narrow [OIII] and [NII] emission lines beyond the cluster continuum, also with no hydrogen emission (Irwin et al., 2010). RZ2109 and GCU7 both have similar behaviours in X-ray, with consistent, low disk temperatures and luminosity variability.
GCU5 shows no optical emission lines at all, including no hydrogen emission lines. GCU5 has very different X-ray behaviour, as it has a better fit as a single power law model that does not show the same kind of luminosity variability seen in the other two sources. Additionally, when it is fit as a single disk component, it has temperatures greater than 1 keV (Roberts et al., 2012). We note that none of the three sources has hydrogen emission present.
We postulate that X-ray behaviour may be linked with optical emission, as the sources with low disk temperatures both have optical emission, but the source with no optical emission has a vastly different behaviour in X-ray. However, optical follow-up on other sources in our sample is necessary to confirm such a claim.
5 Acknowledgments
KCD, SEZ, and MBP acknowledge support from Chandra grant GO4-15089A and NASA grant number HST-AR-13923.001-A from the Space Telescope Science Institute, which is operated by AURA, Inc., under NASA contract NAS 5-26555. SEZ and MBP also acknowledge support from the NASA ADAP grant NNX15AI71G. This research has made use of data obtained from the Chandra Data Archive and the Chandra Source Catalog. We also acknowledge use of NASA’s Astrophysics Data System and Arxiv. The authors thank Claire Kopenhafer, Jay Strader and Ryan Urquhart for helpful discussion. We also thank the anonymous referee for their suggestions to improve the paper.
The following softwares and packages were used for analysis: ciao, software provided by the Chandra X-ray Center (CXC), heasoft obtained from the High Energy Astrophysics Science Archive Research Center (HEASARC), a service of the Astrophysics Science Division at NASA/GSFC and of the Smithsonian Astrophysical Observatory’s High Energy Astrophysics Division, SAOImage DS9, developed by Smithsonian Astrophysical Observatory, astroML (Vanderplas et al., 2012), linmix (Kelly, 2007), numpy (Van Der Walt et al., 2011), DELCgen (Connolly, 2016), matplotlib (Hunter, 2007), Palettable171717https://jiffyclub.github.io/palettable/, scipy (Jones et al., 2001), and astropy (Astropy Collaboration et al., 2013).
References
- Abbott et al. (2016) Abbott B. P., et al., 2016, ApJ, 818, L22
- Angelini et al. (2001) Angelini L., Loewenstein M., Mushotzky R. F., 2001, ApJ, 557, L35
- Arnaud (1996) Arnaud K. A., 1996, in Jacoby G. H., Barnes J., eds, Astronomical Society of the Pacific Conference Series Vol. 101, Astronomical Data Analysis Software and Systems V. p. 17
- Astropy Collaboration et al. (2013) Astropy Collaboration et al., 2013, A&A, 558, A33
- Bachetti et al. (2013) Bachetti M., et al., 2013, ApJ, 778, 163
- Bachetti et al. (2014) Bachetti M., et al., 2014, Nature, 514, 202
- Binder et al. (2018) Binder B. A., Levesque E. M., Dorn-Wallenstein T., 2018, preprint, p. arXiv:1807.05309 (arXiv:1807.05309)
- Blakeslee et al. (2001) Blakeslee J. P., Lucey J. R., Barris B. J., Hudson M. J., Tonry J. L., 2001, MNRAS, 327, 1004
- Blakeslee et al. (2009) Blakeslee J. P., et al., 2009, ApJ, 694, 556
- Brassington et al. (2008) Brassington N. J., et al., 2008, The Astrophysical Journal Supplement Series, 179, 142
- Brassington et al. (2009) Brassington N. J., et al., 2009, The Astrophysical Journal Supplement Series, 181, 605
- Cash (1979) Cash W., 1979, ApJ, 228, 939
- Chatterjee et al. (2017) Chatterjee S., Rodriguez C. L., Kalogera V., Rasio F. A., 2017, ApJ, 836, L26
- Clausen et al. (2012) Clausen D., Sigurdsson S., Eracleous M., Irwin J. A., 2012, MNRAS, 424, 1268
- Connolly (2016) Connolly S. D., 2016, DELightcurveSimulation: Light curve simulation code, Astrophysics Source Code Library (ascl:1602.012)
- Dage et al. (2018) Dage K. C., Zepf S. E., Bahramian A., Kundu A., Maccarone T. J., Peacock M. B., 2018, preprint, p. arXiv:1806.01848 (arXiv:1806.01848)
- Fabrika et al. (2015) Fabrika S., Ueda Y., Vinokurov A., Sholukhova O., Shidatsu M., 2015, Nature Physics, 11, 551
- Feng et al. (2016) Feng H., Tao L., Kaaret P., Grisé F., 2016, ApJ, 831, 117
- Fruscione et al. (2006) Fruscione A., et al., 2006, in Society of Photo-Optical Instrumentation Engineers (SPIE) Conference Series. p. 62701V, doi:10.1117/12.671760
- Gladstone et al. (2009) Gladstone J. C., Roberts T. P., Done C., 2009, MNRAS, 397, 1836
- Heggie & Giersz (2014) Heggie D. C., Giersz M., 2014, MNRAS, 439, 2459
- Hunter (2007) Hunter J. D., 2007, Computing in Science and Engineering, 9, 90
- Irwin et al. (2010) Irwin J. A., Brink T. G., Bregman J. N., Roberts T. P., 2010, ApJ, 712, L1
- Ivanova et al. (2010) Ivanova N., Chaichenets S., Fregeau J., Heinke C. O., Lombardi Jr. J. C., Woods T. E., 2010, ApJ, 717, 948
- Jones et al. (2001) Jones E., Oliphant T., Peterson P., et al., 2001, SciPy: Open source scientific tools for Python, http://www.scipy.org/
- Jordán et al. (2004) Jordán A., et al., 2004, ApJ, 613, 279
- Joseph (2013) Joseph T., 2013, PhD thesis, University of Southampton, https://eprints.soton.ac.uk/354111/
- Kaaret et al. (2017) Kaaret P., Feng H., Roberts T. P., 2017, Annual Review of Astronomy and Astrophysics, 55, 303
- Kelly (2007) Kelly B. C., 2007, ApJ, 665, 1489
- King et al. (2001) King A. R., Davies M. B., Ward M. J., Fabbiano G., Elvis M., 2001, ApJ, 552, L109
- Kulkarni et al. (1993) Kulkarni S. R., Hut P., McMillan S., 1993, Nature, 364, 421
- Kundu et al. (2002) Kundu A., Maccarone T. J., Zepf S. E., 2002, ApJ, 574, L5
- Li et al. (2010) Li Z., et al., 2010, ApJ, 721, 1368
- Lomb (1976) Lomb N. R., 1976, Ap&SS, 39, 447
- Luo et al. (2013) Luo B., et al., 2013, The Astrophysical Journal Supplement Series, 204, 14
- Maccarone & Warner (2011) Maccarone T. J., Warner B., 2011, MNRAS, 410, L32
- Maccarone et al. (2003) Maccarone T. J., Kundu A., Zepf S. E., 2003, ApJ, 586, 814
- Maccarone et al. (2007) Maccarone T. J., Kundu A., Zepf S. E., Rhode K. L., 2007, Nature, 445, 183
- Maccarone et al. (2011) Maccarone T. J., Kundu A., Zepf S. E., Rhode K. L., 2011, MNRAS, 410, 1655
- Macri et al. (1999) Macri L. M., et al., 1999, ApJ, 521, 155
- Mitsuda et al. (1984) Mitsuda K., et al., 1984, Publications of the Astronomical Society of Japan, 36, 741
- Morscher et al. (2013) Morscher M., Umbreit S., Farr W. M., Rasio F. A., 2013, ApJ, 763, L15
- Morscher et al. (2015) Morscher M., Pattabiraman B., Rodriguez C., Rasio F. A., Umbreit S., 2015, ApJ, 800, 9
- Pakull & Mirioni (2002) Pakull M. W., Mirioni L., 2002, preprint, pp astro–ph/0202488 (arXiv:astro-ph/0202488)
- Paolillo et al. (2011) Paolillo M., Puzia T. H., Goudfrooij P., Zepf S. E., Maccarone T. J., Kundu A., Fabbiano G., Angelini L., 2011, ApJ, 736, 90
- Park et al. (2017) Park D., Kim C., Lee H. M., Bae Y.-B., Belczynski K., 2017, MNRAS, 469, 4665
- Peacock et al. (2010) Peacock M. B., Maccarone T. J., Kundu A., Zepf S. E., 2010, MNRAS, 407, 2611
- Peacock et al. (2012a) Peacock M. B., Zepf S. E., Maccarone T. J., 2012a, ApJ, 752, 90
- Peacock et al. (2012b) Peacock M. B., et al., 2012b, ApJ, 759, 126
- Peacock et al. (2014) Peacock M. B., Zepf S. E., Maccarone T. J., Kundu A., Gonzalez A. H., Lehmer B. D., Maraston C., 2014, ApJ, 784, 162
- Pintore et al. (2018) Pintore F., et al., 2018, MNRAS, 477, L90
- Roberts et al. (2012) Roberts T. P., et al., 2012, ApJ, 760, 135
- Rodriguez et al. (2016) Rodriguez C. L., Chatterjee S., Rasio F. A., 2016, Phys. Rev. D, 93, 084029
- Sarazin et al. (2003) Sarazin C. L., Kundu A., Irwin J. A., Sivakoff G. R., Blanton E. L., Randall S. W., 2003, ApJ, 595, 743
- Scargle (1982) Scargle J. D., 1982, ApJ, 263, 835
- Shih et al. (2008) Shih I. C., Maccarone T. J., Kundu A., Zepf S. E., 2008, MNRAS, 386, 2075
- Shih et al. (2010) Shih I. C., Kundu A., Maccarone T. J., Zepf S. E., Joseph T. D., 2010, ApJ, 721, 323
- Sigurdsson & Hernquist (1993) Sigurdsson S., Hernquist L., 1993, Nature, 364, 423
- Sippel & Hurley (2013) Sippel A. C., Hurley J. R., 2013, MNRAS, 430, L30
- Sivakoff et al. (2007) Sivakoff G. R., et al., 2007, ApJ, 660, 1246
- Sivakoff et al. (2008) Sivakoff G. R., Jordán A., Juett A. M., Sarazin C. L., Irwin J. A., 2008, preprint, p. arXiv:0806.0626 (arXiv:0806.0626)
- Spitzer (1969) Spitzer Jr. L., 1969, ApJ, 158, L139
- Steele et al. (2011a) Steele M. M., Zepf S. E., Kundu A., Maccarone T. J., Rhode K. L., Salzer J. J., 2011a, ApJ, 739, 95
- Steele et al. (2011b) Steele M. M., Zepf S. E., Kundu A., Maccarone T. J., Rhode K. L., Salzer J. J., 2011b, ApJ, 739, 95
- Steele et al. (2014) Steele M. M., Zepf S. E., Maccarone T. J., Kundu A., Rhode K. L., Salzer J. J., 2014, ApJ, 785, 147
- Strader et al. (2012) Strader J., et al., 2012, ApJ, 760, 87
- Sutton et al. (2013) Sutton A. D., Roberts T. P., Middleton M. J., 2013, MNRAS, 435, 1758
- Timmer & Koenig (1995) Timmer J., Koenig M., 1995, A&A, 300, 707
- Urquhart & Soria (2016) Urquhart R., Soria R., 2016, MNRAS, 456, 1859
- Van Der Walt et al. (2011) Van Der Walt S., Colbert S. C., Varoquaux G., 2011, preprint, (arXiv:1102.1523)
- Vanderplas et al. (2012) Vanderplas J., Connolly A., Ivezić Ž., Gray A., 2012, in Conference on Intelligent Data Understanding (CIDU). pp 47 –54, doi:10.1109/CIDU.2012.6382200
- Walton et al. (2013) Walton D. J., et al., 2013, ApJ, 779, 148
- Wilms et al. (2000) Wilms J., Allen A., McCray R., 2000, ApJ, 542, 914
- Zepf et al. (2007) Zepf S. E., Maccarone T. J., Bergond G., Kundu A., Rhode K. L., Salzer J. J., 2007, ApJ, 669, L69
- Zepf et al. (2008) Zepf S. E., et al., 2008, ApJ, 683, L139