The HxLi1-xTaWO6.nH2O trirutile
structure characterization through Raman and
IR spectra comparison:
The non-center symmetric case
Abstract
We have performed the LiTaWO6 vibrational studies for both Raman and infrared actives modes. Although we do not have crystalline samples, the study was conducted qualitatively, firstly comparing the sample with similar compounds in the literature, and secondly comparing both Raman and infrared spectra of the LiTaWO6 compound. Although the procedure is limited, we can assign 8 of the 10 Raman-IR active modes expected by Group Theory.
Keywords Trirutile Non-center Symmetric Raman actives modes IR actives modes
1 Introduction
We can understand the trirutile structure like a normal rutile superlattice[1]. The standart composition is or where cations and where in under the condition of equation. The possible combinations for and are , and , . For this cases, the difference of three charge units() is enough to ionic ordering three times the normal rutile c axis. The trirutile Space Group is the same as simple rutile (), . In this Group A and B cations occupy and Wyckoff positions, respectively, while there two non-equivalent Wyckoff positions for 4f(xx0) and 8j(xxz) of oxygens. A distorted trirutile structure (P), whose is a P subgroup, was found for SnO2, CrTa2O6 [2, 3, 4, 5] and CuSb2O6 compounds[6].
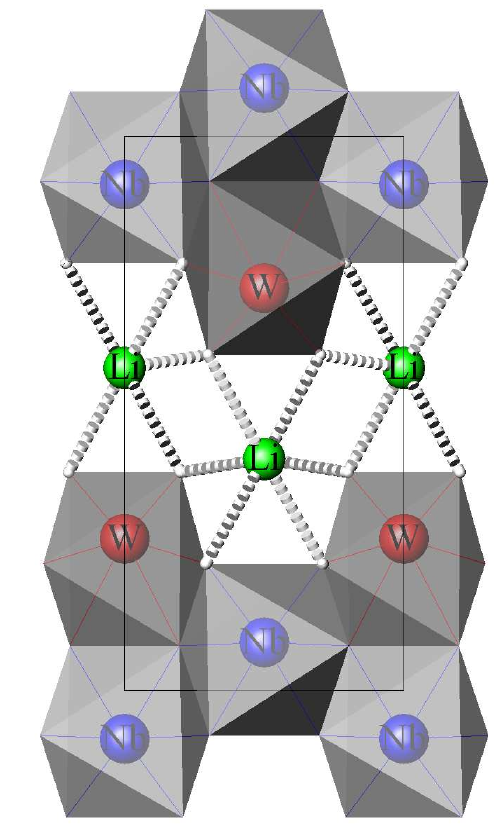
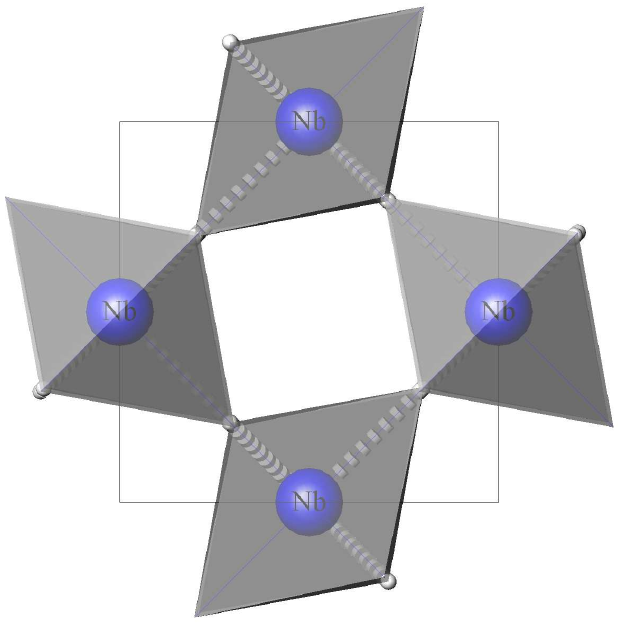
The LiMWO6 () compound belongs to a family material with chemical formula like ABB"O6, where A, B and B" are monovalent, three and hexavalent, respectively. In 1970, Blasse and Paw[7] proposed the these materials belong to tetragonal center-symetric structure to LiTaWO6 P () (with Å). Fourquet et.al.[8] proposes the non-center symmetric Space Group Pm (D) (with a = b = 4.6776, c = 9.2710 Å) for LiTaWO6 compound. More recently, in 2002, Catti[9] proposed a new structure to this compound, obtaining an orthorhombic center-symmetric C () (with a = b = 6.6088 and c = 9.2999 Å) with volume approximately two times the ones before proposed. In this work the HTaWO6.H2O trirutile was refined to P () Space Group. In all cases, the LiTaWO6.H2O trirutile is constituted by LiO6, TaO6 and WO6 octahedras connected like showed in Figure 2. Note that due to the octahedra ordering, Li, Ta and W cations are disposed parallel to c axis.
As a matter of fact, the P, P and C Space Groups obey the well defined Group-subgroup mathematical relationships, when a reduction of symmetry of P or C must be spliting of Wyckoff positions as showed in Table LABEL:tab:diagr1.
The introduction of two similar size cations in B site positions can result in ordering of structure as occur to LiTaWO6 trirutile. It means that taking in account the Space Group correlation between P and P there are two non-equivalent positions to B cations and three non-equivalent positions to oxigen anions.
It is known that HTaWO6 crystallizes in two different structures, a defect pyrochlore and trirutile. The defect pyrochlore one can be obtained via ionic change of its alcaline compound counterpart. In this case it is the KTaWO6 compound. Instead, the HTaWO6 trirutile is formed by anion change reaction from LiTaWO6 of same structure.
Buvanesh et. al. [10] has been studied non-linear optic responses of LiMVMVIO6 (MV=Nb, Ta; MVI=Mo, W) policrystaline samples with 25-45 grain sizes. It was demonstrated that materials exibhit SHG (Second Harmonic Generation) of 1064 wavelength radiation with efficiency of 16-28 times bigger than quartz. We know that, SHG is allowed only to non-center-symmetric samples what is consistent with Space Group described above (P).
2 Experimental Characterization
2.1 Synthesis
The reactants used to prepare LiTaWO6 precursor samples are shown in Table 1. The synthesis of LiTaWO6 Trirutile precursor was based in the procedure described by Catti[11] using stoichiometric reaction with following reactants:
| Reactant | Formula | Manufacturer | Purity(%) |
|---|---|---|---|
| Tantalum Dioxide | Ta2O5 | Alfa | 99 |
| Tungsten Dioxide | WO3 | Aldrich | 99 |
| Lithium Carbonate | Li2CO3 | Vetec | 99 |
| Nitric Acid | HNO3 | Merck | 65* |
*Aquous soluction concentration.
, with following reaction describe bellow:
The reactants were crushed and mixed in an agate mortar for 10 minutes, and after the mixing was transferred for a Platine crucible to heating at 850 in an oven. The system remains under heating by 24 hours, with an interruption after 12 hours for crushing and homogenization of the mixing.
The LiTaWO6 Trirutile precursor was submitted at ionic exchange reactions in HNO3 4mol.L-1 solution for 48 h, at 80 . The supernatant solution was exchanged in an analogous way describe in reference[12] to Pyrochlore synthesis. The used acids and experimental parameters are based on procedures described in the literature[13, 11]. We have performed Li+/H+ ionic exchange reactions in LiTaWO6 precursor to yield the HTaWO6 trirutile.
Finally, the protonated compounds were again subjected to ion exchange reactions, this time the proton was replaced by Li+ ions. The reactions were performed using the procedures of LQES laboratory for similar compounds[14, 15]. For this time, the reactions were performed by only one Li:H molar ration of 1:5 to form HxLi1-xTaWO6. We know the ion exchange reaction, to 1:5 for example, occurs as follows
2.2 X-ray diffraction
The X-ray diffractogram were obtained in a Shimadzu diffractometer, operating in scan mode with CuK radiation, generated at 40 KV and 30 mA current. The scanning speed used was 2/min in 2, with accumulation for reading every 0.6 seconds. The slits were used: divergent 1.0 mm and collection 0.3 mm. The calibration of the scanning angle was done with polycrystalline silicon and the samples were analyzed in powder form.
2.3 FTIR spectroscopy
The Fourier Transform Infrared (FTIR) spectra were obtained by Bomen ABB-FTLA 2000 in the 250-4000 cm-1interval with 4 cm-1 resolution and 16 accumulations. The samples were studied in KBr pellets from Fluorolube dispersion, for spectra in the 1300-4000 cm-1, and in Nujol, for 250-1300 cm-1, using cesium-iodide windows. The FTIR measurements were made in the LQES laboratory[12].
2.4 Raman spectroscopy
All spectra measurements had been performed at room temperature through following experimental apparatus: an Argon laser, a Jobin Yvon T64000 three-monochromator spectometer equipped by a microscope with 180 of focal objective. The laser line was 488 with power of 300 on the trirutile samples.
3 Results and Discussions
3.1 X-ray diffraction
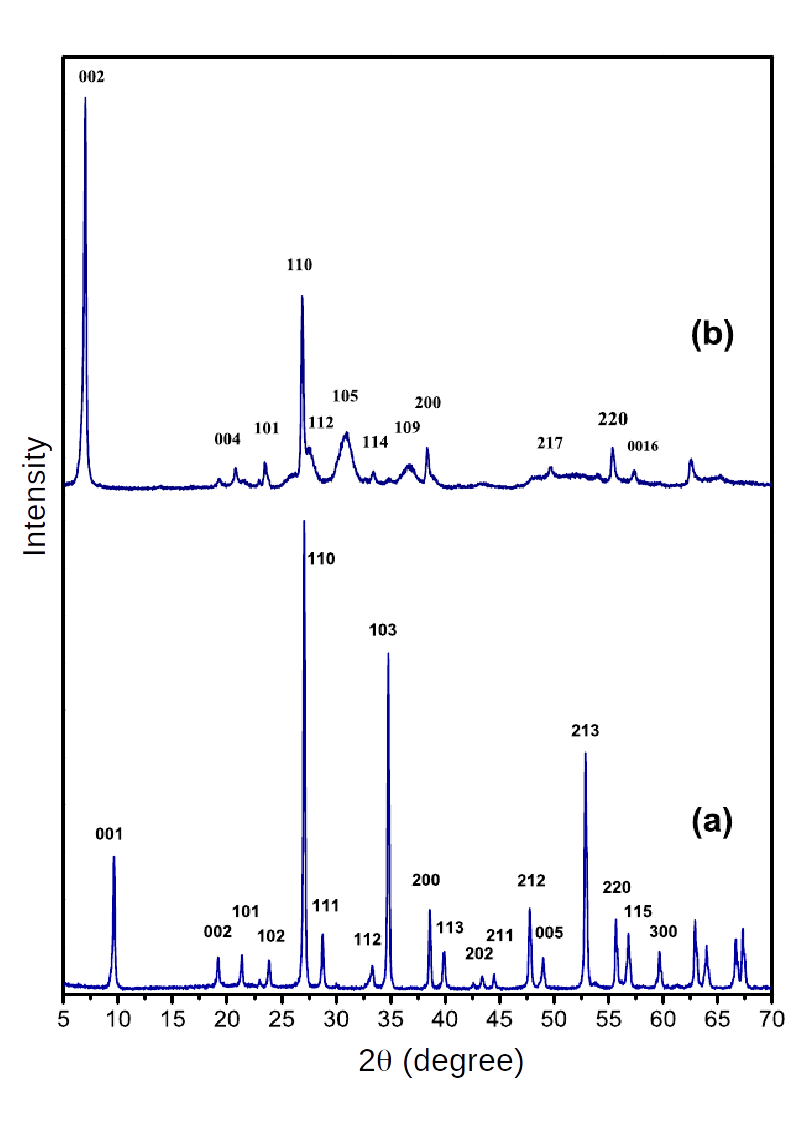
The ionic exchange does not change the structure of the compound, like is showed in the diffractograms of Figure 1 wich strutures correspond that showed in the Figure 2. The ionic exchange Li+/H+ in the trirutile structure, the tetragonal crystalline system produce the expansion of the cell c parameter from 9.24 to 25.52 Å, as we can verify by Miller index . Instead of, we got a significant dislocation of peak position, while the peak position remains unaltered.
For a lot of authors, the c parameter expasion is the primary evidence of tetragonal cell remaining after ionic exchange reactions[18, 19, 20]. The formation of supercell can be attributed to interlayers translations of water molecules, perpendicular to the c axis, that were oriented to optimize hydrogen bonds connected to adjacent layers[19]. A thorough analysis of the characteristics of that reactions has shown that Li+/H+ exchange reactions process occur together with a tetragonal primitive (LiTaWO6) to tetragonal body-center(HTaWO6.H2O) transformation[18].
In the Figure 1 are showed the X-ray diffractogram of both trirutile pristines HTaWO6.nH2O and LiTaWO6 of the reference [12]. The ionic change Li+/H+ in the trirutile structure produce the cell expansion in the parameter c, from 9.27 Å to 25.62 Å like verified by Miller index shift . Inspite of remarkable shift of peak, the position of diffraction peak remains unchanged. For the majority of authors, it is the main evidence of tetragonal cell keeping after ionic change[18, 19, 20].
The formation of superlattice is assign at translation of interlamellar layers, perpendicular at c-axis, because introduction of water molecules into structure [18, 19]. The ionic change Li+/H+ in compound, also cause alteration of primitive tetragonal unit cell to body centered tetragonal, when HTaWO6.nH2O is its hidrated form ()[18]. The structure maintenance after Li+/H+ ionic change, reveals high bi-dimensional mobility of precursor lithium, confirmed by studies of its difusion coeficient [21].
4 Group Theory and vibractional spectroscopy
In the case of ABBO6 compounds, the Table 3 shows 54 degrees of freedom through D2d representation Factor Group of P Space Group (Z = 2). From all modes () the are Raman active modes, while the are infrared active modes and correspond at acoustic modes. In contrast the is a remainded silent mode.
| ions | Wickoff sites/Symmetry | Irreducible Representations |
|---|---|---|
| A | 2c/C2v | AB2E |
| B | 2c/C2v | AB2E |
| B | 2c/C2v | AB2E |
| O | 4e/Cs | 2AAB2B3E |
| O | 4e/Cs | 2AAB2B3E |
| O | 4e/Cs | 2AAB2B3E |
| =9A3A3B9B15E | ||
| =9A3B8B14E =8B14E | ||
| =3A2 =BE | ||
The drawback in this methodology is its use in only polarized light. Since our samples are ceramics or powder, in consequence without crystal axis orientation, it is impossible to perform polarized measurements in order to discuss the vibrational modes in terms of irreductible factor groups. The more apropriated method is analysis in and out modes into structures. Both pyrochlore and trirutile structures are composed of octahedron networks BO6 (and BO6 or B/B’O6) and cations A (and B or B/B’).
In general the vibration modes of octahedron are observed between 300-900 cm-1 whereas extern mode frequencies are observed below 300 cm-1. In this case we should make a correlation table symmetry for lattice, sub-lattice and lattice itself, like showed in Table LABEL:tab:diagr1. However, we should know what and how much internal modes are allowed in a free octahedron for subsequent analyses by Group Theory based on symmetry reduction of octahedron inside lattice by correlation of crystal structures in study. The Group Theory calculation of vibrational modes of molecules type XY6 is showed in Apendixe B of Reference [22]. The distribution of the 21 degree of freedom of octahedral molecule is given by
where , e modes are streching moves of B bonds, and , and angular deformations O - B - O. The libration octahedra modes L(F1g) and that originally are silent in both Raman and IR spectra can be observed due lowing local symmetry octahedra when put in a crystalline lattice. How is the LiTaWO6 case considering its P Space Group, like shown in the Table LABEL:tab:diagr2. The BO6 that originally was in the cubic symmetry Oh is in the C now. In consequence, it make L(F1g) and active in both Raman and IR spectra.
This methodology has a limitation that all BO6 octahedra to be un-conected therselves, although all BO6 are connected. The vibrational activity for boths octahedra depend of bond forces B - O and B - O. In this case, the B cation has more eletrovalence and make the B - O constant force stronger than B - O. In the case of both constants forces are approximately close therselves, we can observe both octahedral activities.
Catti et. al.[23] study the thermal, structural, vibrational and electrical properties of HTaWO6.xH2O (x = 3/2, 1/2, 0). The results obtained through X-ray showed that HTaWO6.3/2H2O belongs to tetragonal system with lattice parameters a = 4.710 Å and a = 25.80 Å.
The Figure 3 show LiTaWO6 Raman spectrum at room temperature. This spectrum is in agreement with one reported by Catti et.al.[11], showing a similarity bethween the samples. Inspite that, there is no deep discution about observed vibration modes, due the absence of the LiTaWO6 monocrystals. There is a only reference about 960 cm-1 band, which has been atributed to TaO6 octahedra stretch vibration that share sides.
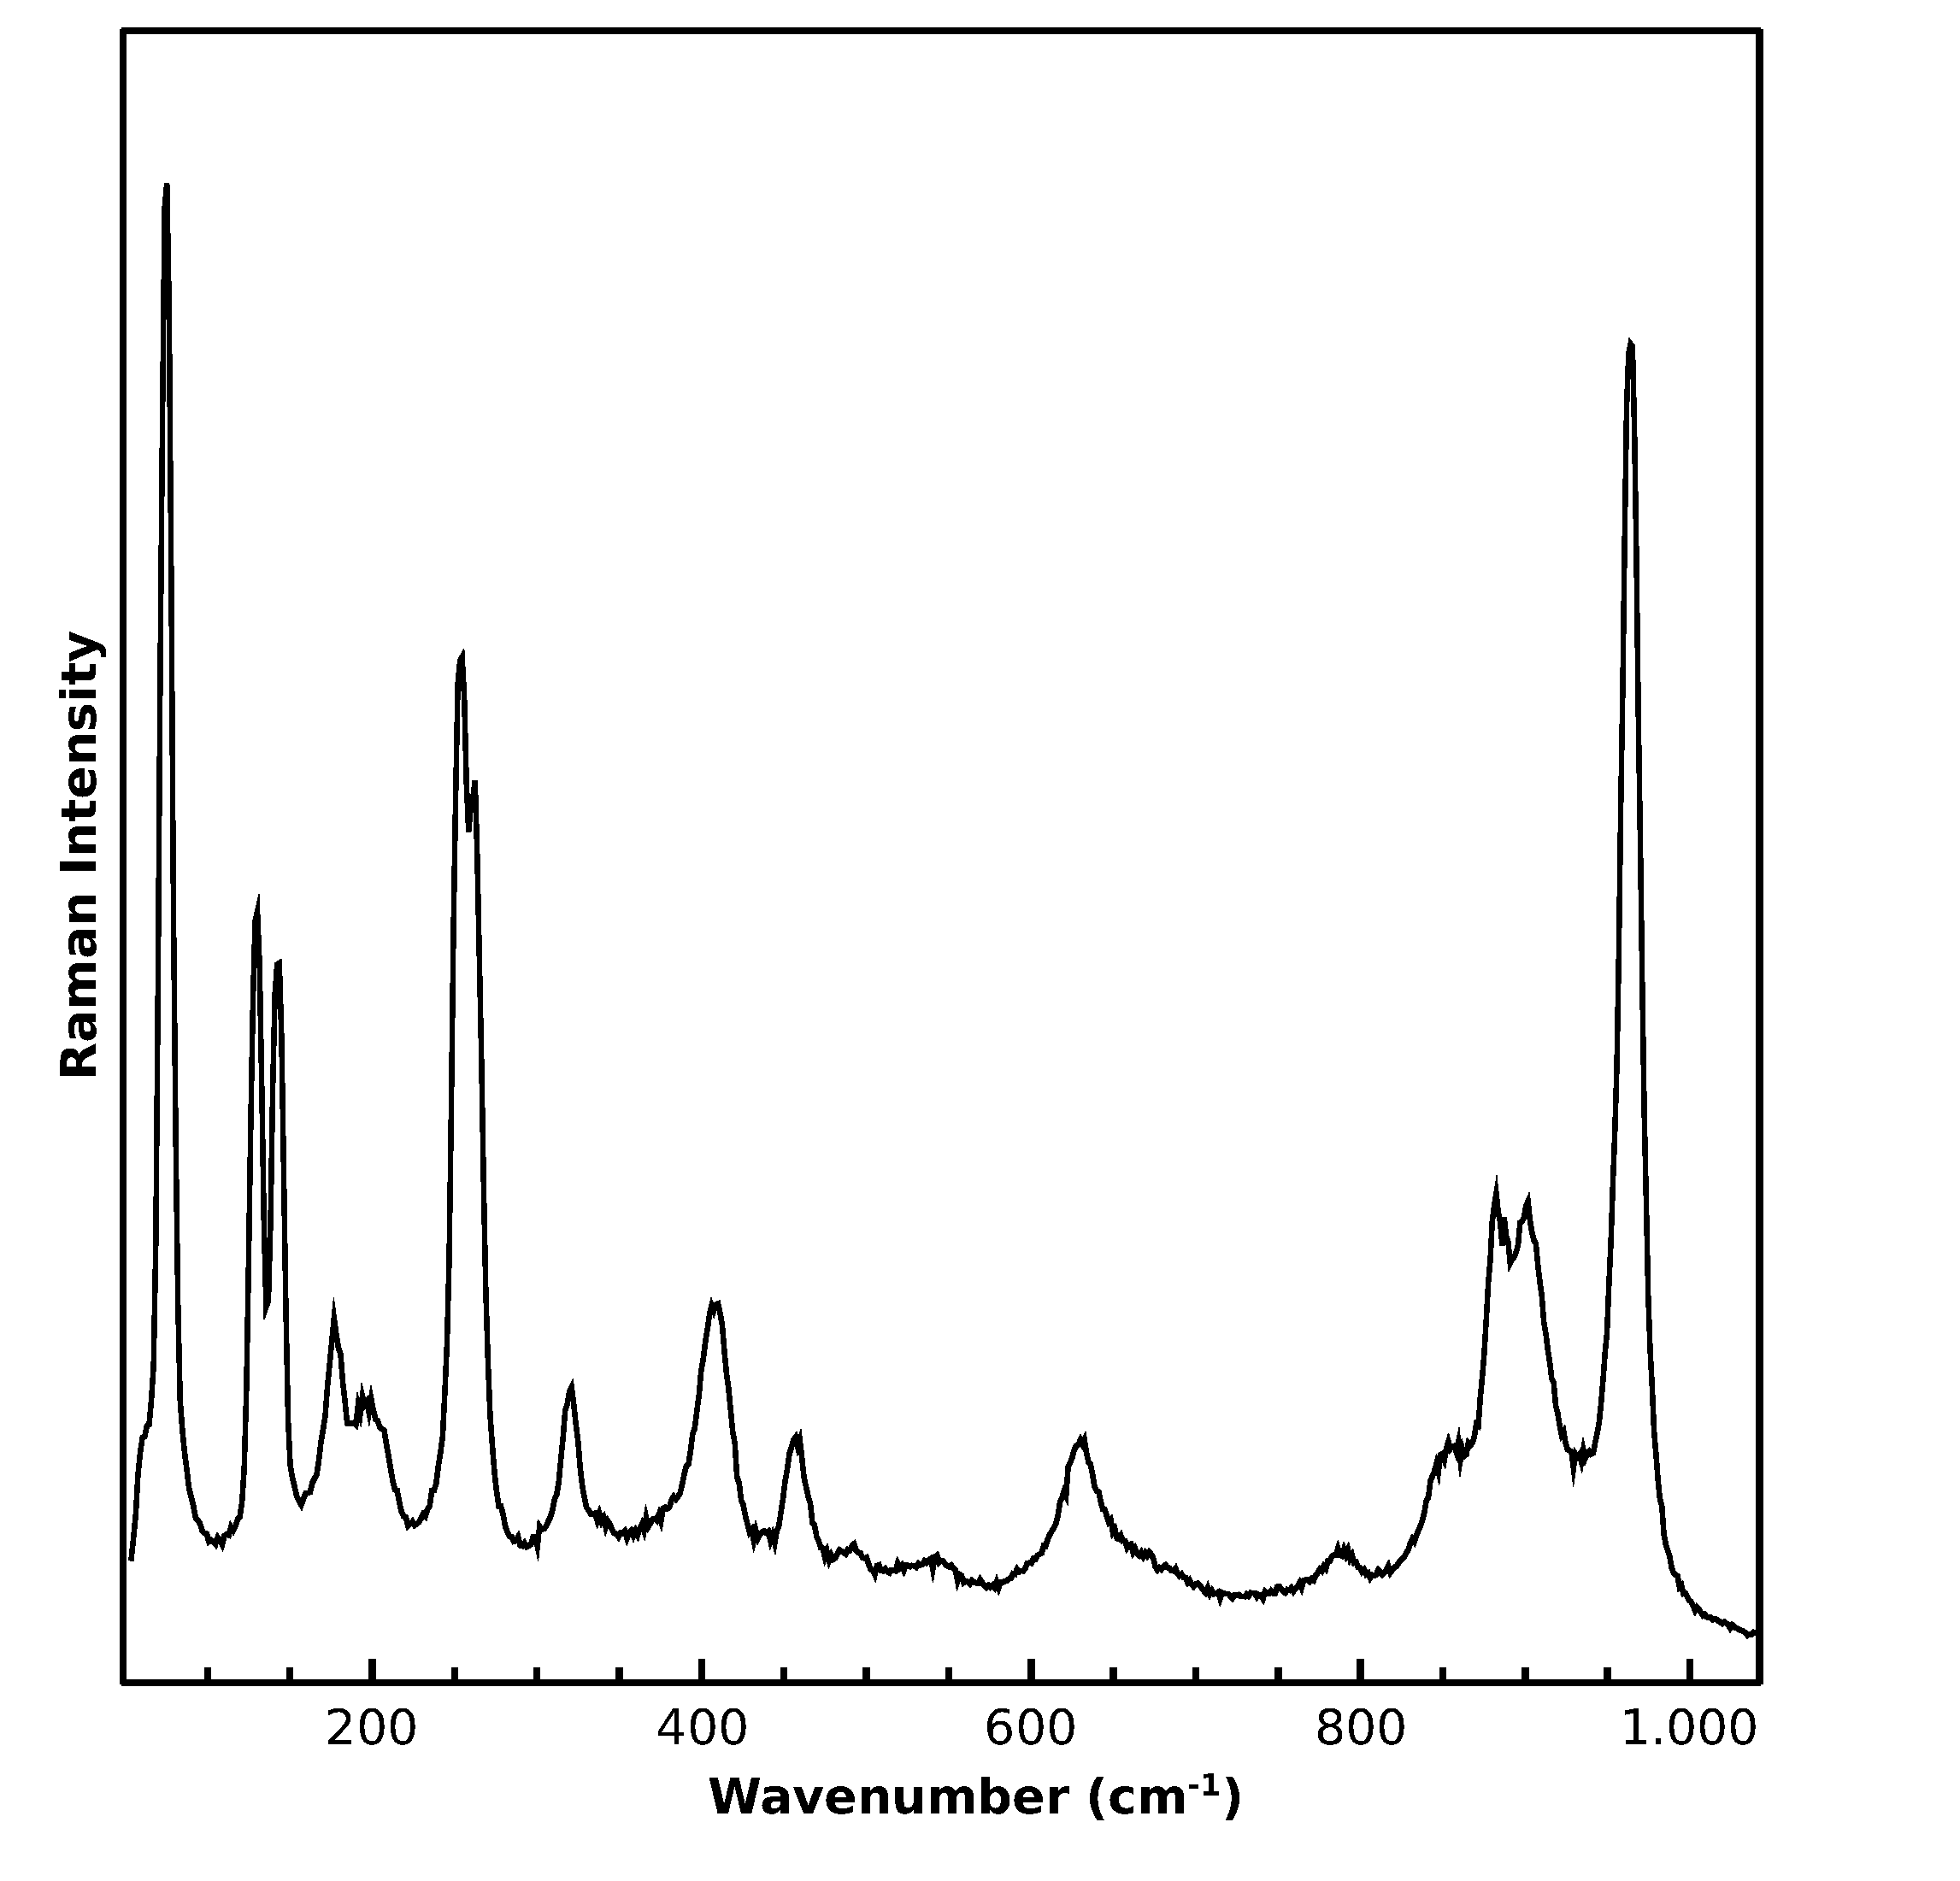
Not all predicted modes have been observed in the Raman spectrum, maybe sobreposition of some bands, or due low polarizability of some modes. Thus, the amount of bands and their line widths are consistent with ordered crystalline structure where atoms occupy positions of low symmetry.
4.1 FTIR and Raman spectra comparison
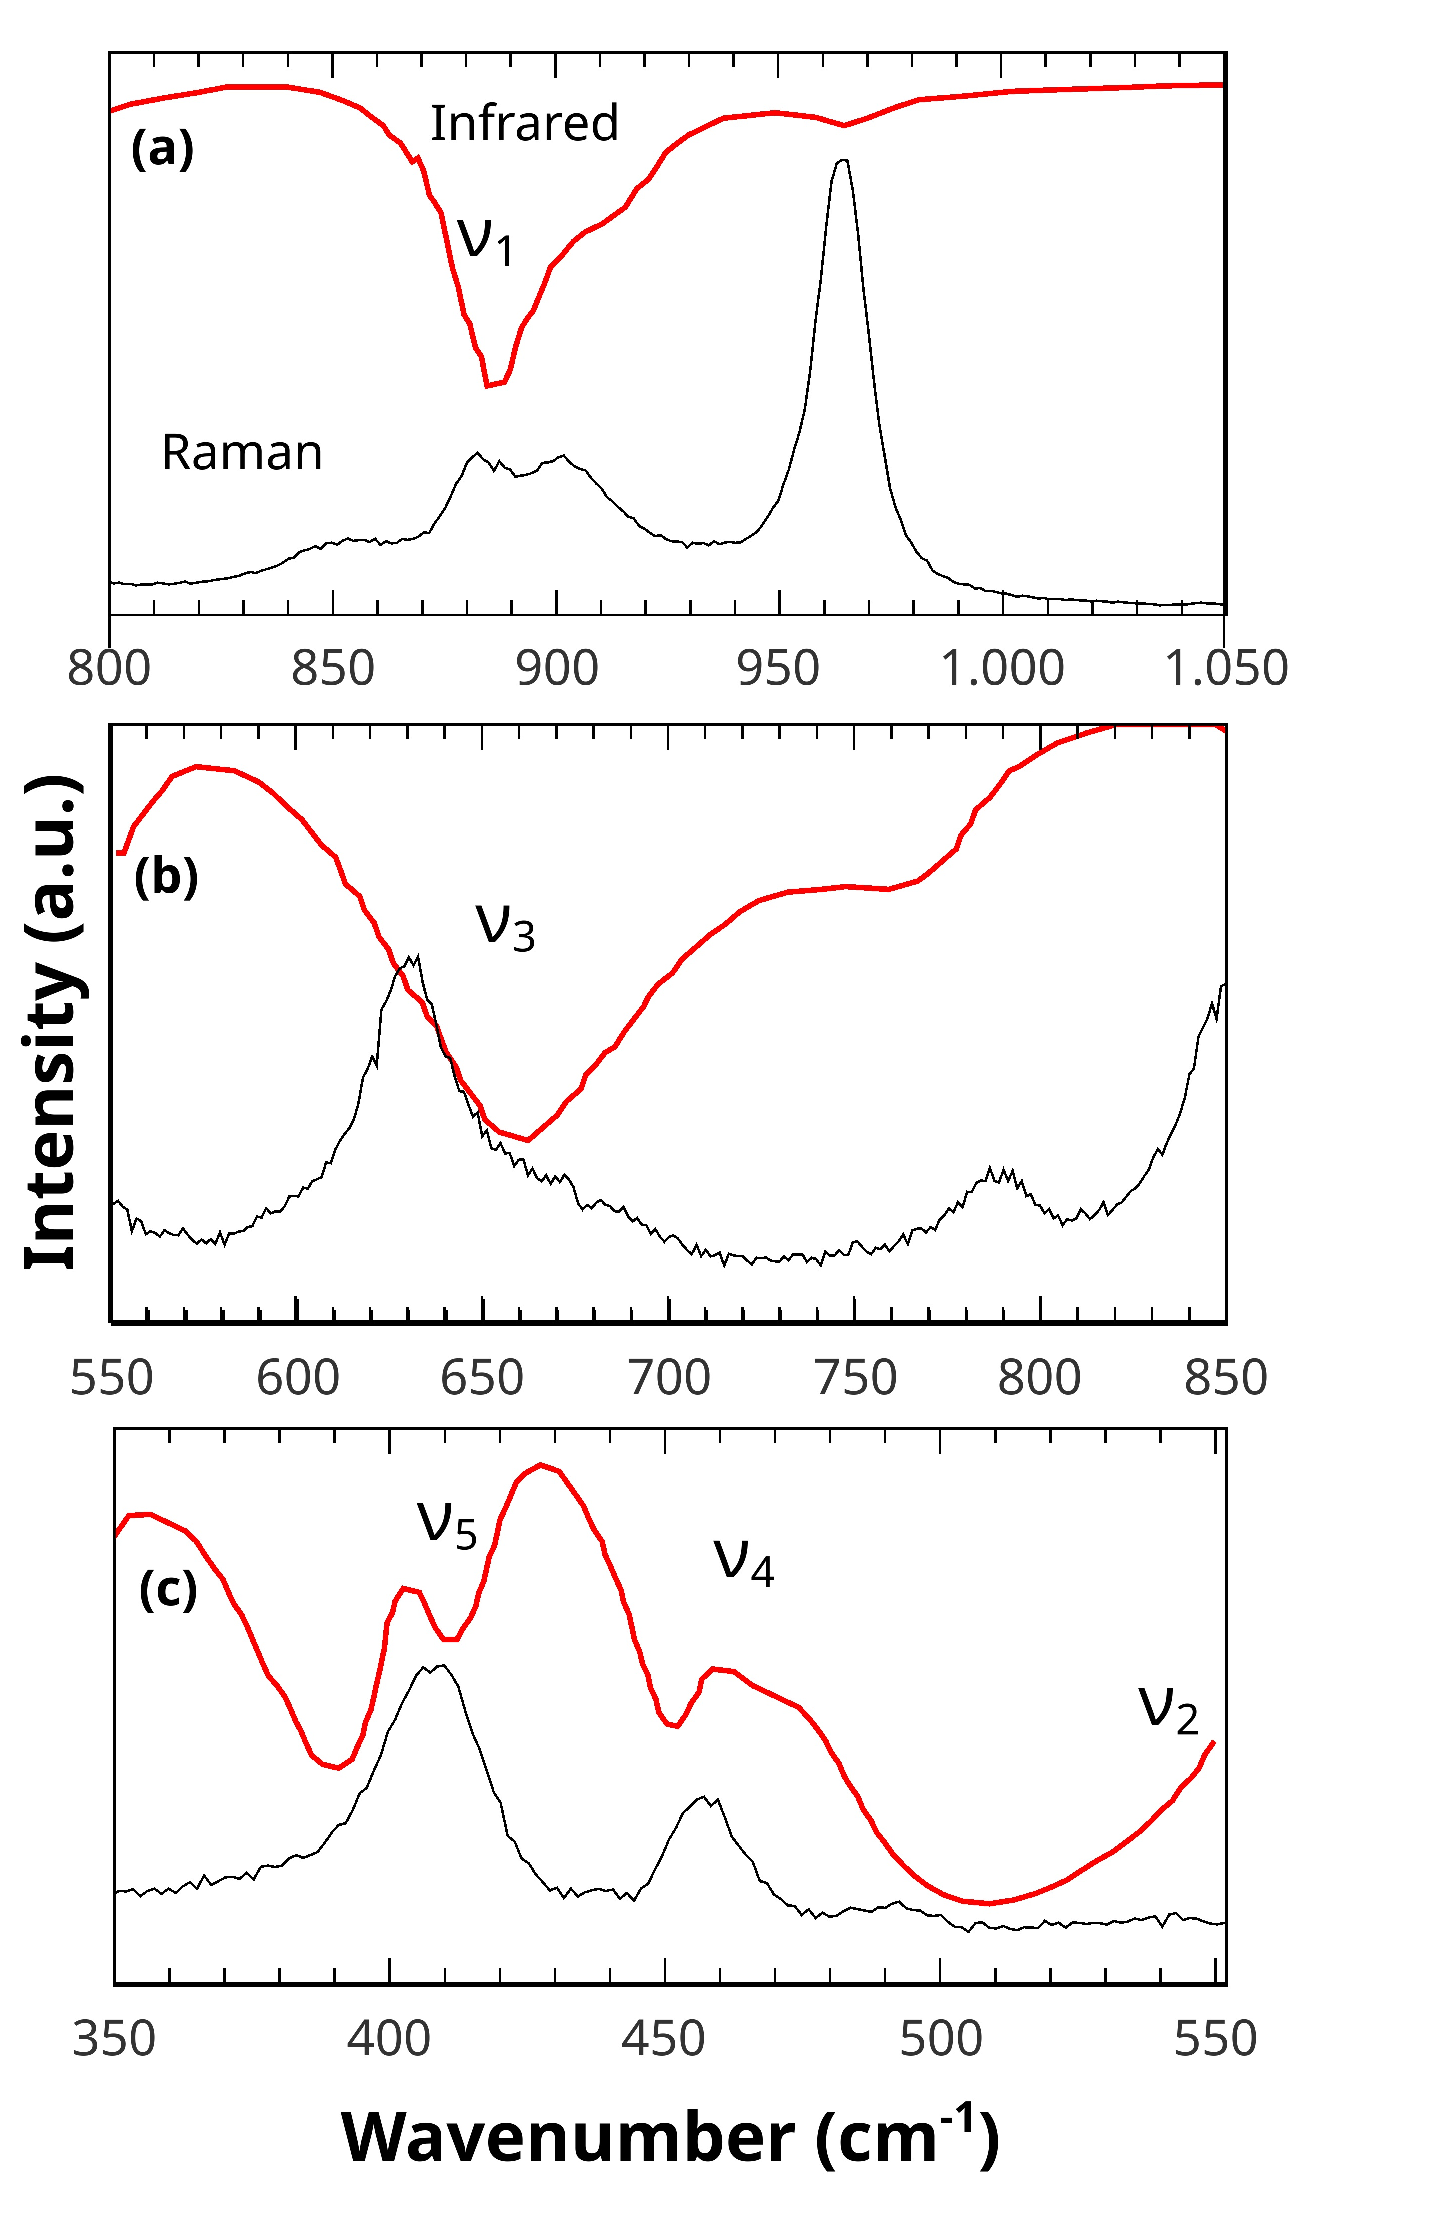
In the Figure 4 are compared both IR transmitance(reproduced by Ref [12]) and Raman spectrum of LiTaWO6 measured at room temperature. With respect to infrared spectrum, we can observe ten bands localized on 320, 390, 410, 451, 510, 660, 760, 885, 910, and 966 cm-1. Note that, a lot of this bands have a clear correlation with some Raman spectrum bands, that is expected if we take in account a non-center-symmetric structure. In fact, in according to Bhuvanesh et.al.[10], this compound exhibit second harmonic generation, an exclusive propertie of polars materials, whose inversion of symmetry center is absense. For this results, the more probable structure for LiTaWO6 is P.
Although we did not have oriented monocrystals of LiTaWO6, we could doing a qualitative analysis of the Raman modes observed based on both octahedra (BO6) and cations lattice vibrations in the structure. Since the W-O bond lenths are aproximately equal to Ta-O bonds, the vibrational spectrum of LiTaWO6 can be dominated mainly by WO6 or TaO6 octahedron vibrations. In some cases, if charges or masses of B e B are very differents, it should be possible make a differentiation between vibration of BO6 and BO6. In general, the frequency order of bonds stretching is , while for frequencies of angular deformations O-B-O is . In the LiTaWO6 structure the WO6 or (TaO6) structure are slighly distorted, leaving itselfes to lower symmetry C2v, than pyrochlore one (D3d). The influence of octahedral symmetry lowering in the vibrational spectrum should be analyzed using a correlation diagram like is showed in the Table LABEL:tab:diagr1. In according with Table LABEL:tab:diagr1 we observed 21 Raman modes that correspond to octahedra internal modes (2, 3, 4, 4, 4, 4) of which thirteen (, 2, 3, 3, 2, 2) must be observerd for both Raman and infrared, while the remaining only observed by Raman spectroscopy.
In according to literature, for compounds containing tantalum and tungstein, like peroviskite, for example, LiTaO3 [24], A2InTaO6 (A = Ba, Sr)[25], A2CoWO6 (A = Ba, Sr)[26] and A3In2WO9 (A = Ba, Sr) [27], the wavenumbers of the symmetrical breath of the octahedrons TaO6 and WO6 have values of 840 cm-1. Base on it, the unusual characteristic of the LiTaWO6 spectrum are bands localized between 810 and 1000 cm-1 . Similar characteristic are observed on TiTa2O7 [28] and TiNb2O7 [29], that have two octahedra distribuction of MO6 (M = Ta e Nb), respectively; one with the shared vertex MO6 and other with shared edges (M2O10). Two intense bands were observed in 899 and 1020 cm-1 for the TiTa2O7 and 1000 and 892 cm-1 for the TiNb2O7 compounds. The first was attributed to molecular breath symmetric mode M2O10, while the second was designed like a molecular breath symmetric of the M2O11 unit. The wavenumber diferences between the two bands was 121 and 180 cm-1to TiTa2O7 and TiNb2O7, respectively. If this wavenumber difference is systematic for the octahedra shared vertex and edge, the corresponding Raman bands are 964 and 851 cm-1(See Figs. 3 and 4), which difference is 113 cm-1. It may be a indicative that TaO6 and WO6 are well correlated. There is also a doublet to assign; it is centered in 890 cm-1. Since the crystalline system of octahedra TaO6 and WO6 in the trirutile structure is different of the peroviskites, we expected a displacement of the wavenumber of the vibrations to these octahedra, what it implies the 890 cm-1 doublet may be a symmetric streching () of the isolated octahedra TaO6 and WO6.
In the next spectral region, showed in the Figure 4(b), we can observe two bands in 600 and 760 cm-1in the infrared spectrum and three bands in the Raman spectrum in 630, 670 and 785 cm-1. In general, in this region is localized the assymetric stretching of infrared active mode . Lavat and Baran [30] studied infrared spectra of several perovskites containing tantalum as manly octahedral unit and observed that this mode is localized on 650 and 670 cm-1 region. On the other hand, Liegeois-Duyckaerts and Tarte[31] studied the Raman and infrared spectrum of the other series of perovskites containing tungstein as mainly octahedral unit and observed that (WO6) occured in the 600-650 cm-1 region. Based on this, we can only assign the bands between 650 cm-1 to (WO6)+(TaO6). Despite of suppositions, we can not assign the 750-810 cm-1 bands based on the free octahedra, but we can suppose this vibrations have origin in movements of couple (TaWO11 or by (TaWO10) octahedra.
The Figure 4(c) show the Raman and Infrared spectra comparison in the 350-570 cm-1 region. In this spectral region are concentrated stretching anti-symmetric modes of M - O () bonds, and angular deformations of O-M-O angles, with symmetry of and modes of the free octahedron. In according to literature, the (TaO6)+(WO6), (TaO6)+(WO6)
e (TaO6) modes have energy in the regions of 330-450 cm-1 [30, 31], 375-450 cm-1
[25, 31] and 550 cm-1[25]. We observed five and six bands in infrared and Raman spectra, respectively. In general, the mode have low intensity [25] and in lot of cases is not observed [31] in Raman spectrum, however we can assign the 537 cm-1 band in the LiTaWO6 Raman spectrum as (TaO6) symmetric mode. The wide band centering in 510 cm-1 is very comom in a lot of compounds of peroviskites family [27, 30] having symmetry mode, thus we assign the bands between 430-520 cm-1as a symmetry modes. Finally the bands localized between 375-425 cm-1 are vibrations of symmetry.
The bands lower than 375 cm-1are the most difficult to indentify because in this region are localized the librational () and translational () modes of crystal lattice. In this case, we consider the movement of the cations Li, Ta and W at long , or directions, as showed in the Table LABEL:tab:diagr1. Through the results of the Group Theory shown in this papper we must observe sixteen modes (10T+3L+3) in this specrtral region. Due the degenerescence of some bands or the weak intesity of the Raman spectrum due a material polarizability, we only observe ten bands in this region.
5 Raman spectrum of the H0.833Li0.167TaWO6 trirutile
Figure 5 shows the Raman
Spectra of the H0.833Li0.167TaWO6, LiTaWO6,
and
HTaWO6.nH2O[12]. The Raman spectra of the H0.833Li0.167TaWO6 and HTaWO6.nH2O show
some differences with LiTaWO6 for both the number of bands
and bandwidth.
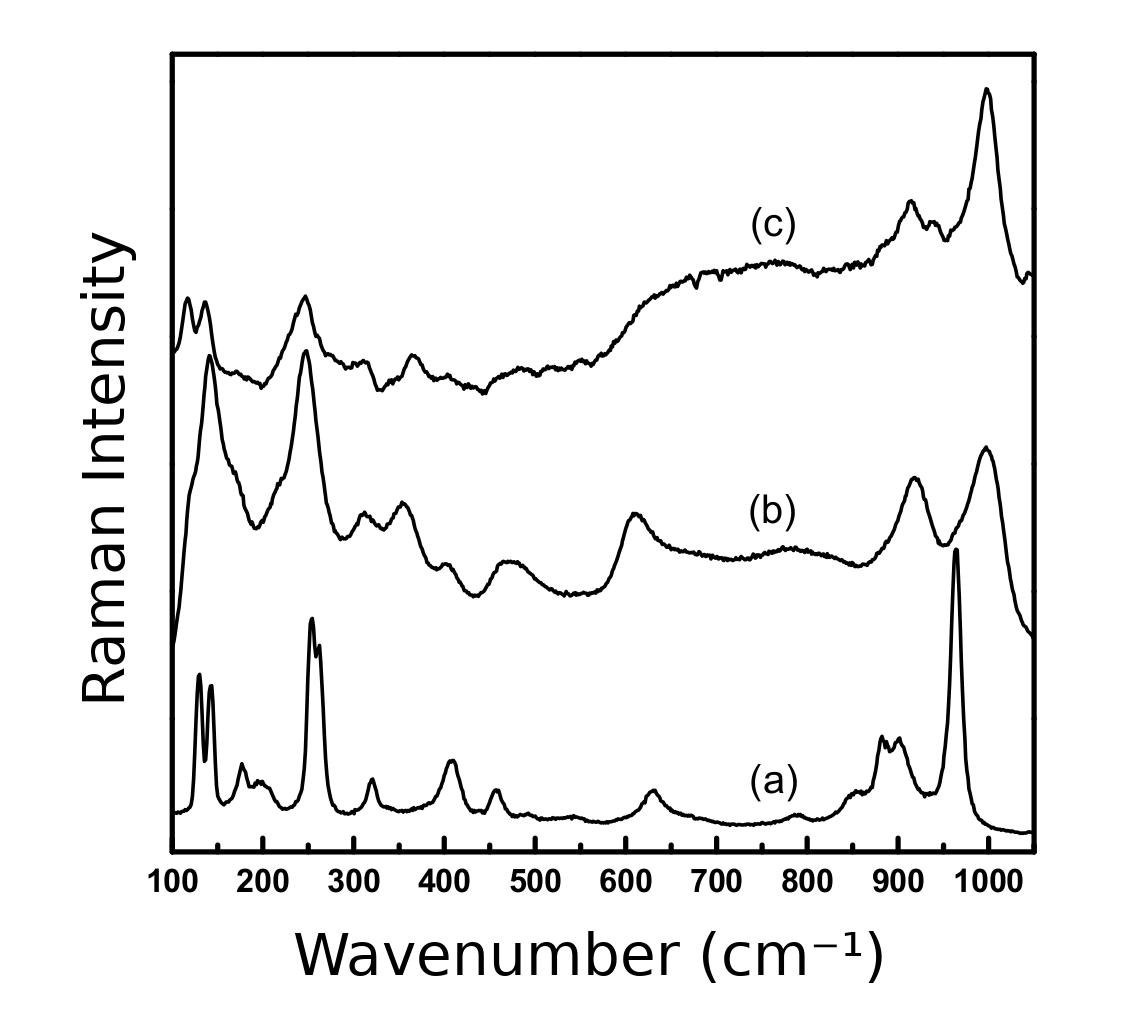
The Raman spectrum of Figure 5(b) is well represented for HTaWO6.nH2O trirutile with n between and like shown in the reference [11]. We can see the band shift of higher energy to high wavenumbers.
When hydration of HTaWO6.nH2O increases the structure tend to become more open with c lattice parameter changing from 20 to 26 Å [18, 32]. While with the Li+ ion the structure tends to more closely, with c lattice parameter remaining to 9.30 Å. The supercell formation also is attributed the translation of the interlayers of the water molecules, perpendicular to the c axis, that are oriented to optimize the hydrogen bonds that connected to adjacent layers[19]. The detailed analysis of the characteristic of the ionic exchange reactions had been shown for some authors. They took into account the ionic exchange reactions Li+/H+ occur followed by unit cell change, from tetragonal primitive to body center tetragonal (HTaWO6.nH2O)[18]. According to Kumada et.al.[19] the Li0.9H0.1TaWO6 compound, have lattice parameter c=11.1 Å that is close to the LiTaWO6 due to the large Li+ ion concentration. As H0.833Li0.167TaWO6 has low Li+ concentration, it is expected that the vibrational spectrum of this compound resembles that of HTaWO6.nH2O, as observed in Figure 5.
Although the HTaWO6.nH2O have the trirutile structure with c lattice parameter almost three times c lattice parameter of the LiTaWO6 compound, we still see a strong disorder in the octahedral cations Ta+ and W+ due to the enlargement of the high wavenumber bands (more than 500 cm-1), taking as reference the LiTaWO6 Raman spectrum.
As the H+ and Li+ ions contribute only to lattice libration modes (less than 500 cm-1) in the wavenumber interval showed in Figure 5, we observe a remarkable difference in this spectrum region.
6 Conclusion
We can summarize that studies that indicate a non-symmetric P structure can be performed, although done in a polycrystalline sample. Even so, we conducted a qualitative study using the knowledge about Raman modes of TiTa2O7 and TiNb2O7 by comparison.
The prediction by Group Theory for both IR and Raman active modes are 13 (, 2, 3, 3, 2, 2) from the total of 21 internal Raman modes (2, 3, 4, 4, 4, 4). With respect to the infrared spectrum, we observed ten bands localized on 320, 390, 410, 451, 510, 660, 760, 885, 910, and 966 cm-1, with a lot of these bands, have a clear correlation with some Raman spectrum bands, that is expected to a non-center-symmetric structure, as described by Bhuvanesh et.al.[10].
As long as there is no significant difference between B’O6 and B"O6 mass and charge, the band frequencies of B’O6 and B"O6 are closely each other, like a consequence of both B’-O and B"-O are approximately equal. It is a case of Ta-O and W-O bonds. As a consequence, the vibrational spectrum of LiTaWO6 is dominated mainly by WO6 and TaO6 octahedron vibrations. Take into account the frequency order of bonds stretching is , while for frequency order of angular deformations O-B-O is , we can assign:
-
•
to 851 and 964 cm-1;
-
•
The 510 cm-1band belong to , as well as the bands localized between 430-520 cm-1;
-
•
The bands are localized between 375-425 cm-1;
-
•
The bands lower than 375 cm-1are more difficult to identify. In this spectral region are localized the librational() and translational () modes.
We can observe ten infrared bands, (320, 390, 410, 451, 510, 660, 760, 885, 910, and 966 cm-1), of which 8 we can assign for both Raman and infrared activity.
Although this procedure is very limited, we can assign some vibrational bands for both Raman and infrared activity, with a significant level of confidence to conclude that our sample belongs to P Space Group.
7 Acknowledgments
D. Valim acknowledge E.N. Silva for his conversations about Group Theory and vibrational modes. D. Valim, AG Souza Filho, JM Filho, OL Alves, M.A.C. de Santis, and E.N. Silva acknowledge the Brazilian agencies, CNPq, CAPES, FUNCAP, and FAPESP for financial support.
References
- [1] A Bolzan, C Fong, B J Kennedy, and C J Howard. . Acta Crystallographica, Section B, B53:373–380, 1997.
- [2] J. I. Martínez, H. A. Hansen, J. Rossmeisl, and J. K. Nørskov. Formation energies of rutile metal dioxides using density functional theory. Physical Review B - Condensed Matter and Materials Physics, 79(4):1–5, 2009.
- [3] Angel M. Arevalo-Lopez, Elizabeth Castillo-Martinez, and Miguel Ángel Alario-Franco. A Study of [Cr-O6]-based rutile analogues by means of EELS. MRS Proceedings, 1148(January):1148–PP03–31, 2008.
- [4] B. R. Maddox, C. S. Yoo, Deepa Kasinathan, W. E. Pickett, and R. T. Scalettar. High-pressure structure of half-metallic Cr O2. Physical Review B - Condensed Matter and Materials Physics, 73(14):1–9, 2006.
- [5] Nan Jiang and John C.H. Spence. Electron energy-loss spectroscopy of the O K edge of NbO2, MoO2, and WO2. Physical Review B - Condensed Matter and Materials Physics, 70(24):1–7, 2004.
- [6] D. T. Maimone, A. B. Christian, J. J. Neumeier, and E. Granado. Lattice dynamics of ASb2 O6 (A=Cu, Co) with trirutile structure. Physical Review B, 97(10):1–11, 2018.
- [7] G Blasse and A D M de Pauw. Crystal structure of some LiMe5+Me6+O6 compounds. Journal of Inorganic and Nuclear Chemistry, 32(12):3960–3961, 1970.
- [8] J L Fourquet, J A Le Bail, and P A Gillet. LiNbWO6: Crystal structure of its two allotropic forms. Materials Research Bulletin, 23:1163–1170, 1988.
- [9] M Catti. Structural environment of Li+ and H+ in LiTaWO6 and HTaWO6.H2O trirutile ionic conductors. ISIS Experimental Report, (12834), 2002.
- [10] N S P Bhuvanesh, B R Prasad, C K Subramanian, and J Gopalakrishnan. Non-linear optical response of rutile-related oxides, LiM(V)M(VI)O(6), and their derivatives obtained by ion-exchange and intercalation. CHEMICAL COMMUNICATIONS, (3):289–290, FEB 7 1996.
- [11] M Catti, E Cazzanelli, C M Mari, and G Mariotto. Trirutile Phases of HTaWO6.H2O. J. Solid State Chem., 107:108–116, 1993.
- [12] M A Culhari de Santis. ESTRUTURA LAMELAR VERSUS ESTRUTURA PIROCLORO: OBTENÇÃO DE COMPOSTOS DO TIPO H1-XAgxTaWO6. Dissertação de mestrado, UNICAMP-Universidade Estadual de Campinas, 2006.
- [13] C M Mari, F Bonino, M Catti, R Pasinetti, and S. Pizzini. Electrical Conductivity of HTaWO6.H2O and HTaWO6. Sol. Stat. Ion., 18-19:1013–1019, 1986.
- [14] S GARCIA-MARTIN, ML VEIGA, A JEREZ, and C PICO. Analisis de las propriedades de conductividade ionica em la estructura tipo pirocloro. An. Quim. Int., 87:982–985, 1991.
- [15] S Zhuiykov. Hydrogen sensor based on a new type of proton conductive ceramic. Int. J. Hydrogen Energy, 21:749–759, 1996.
- [16] D Valim. Espectroscopia vibracional e de impedância de A1-xA’xTaWO6.nH2O (A = H, Li, A’ = Ag, H). PhD thesis, Universidade Federal do Ceará, 2009.
- [17] Daniel Valim, Souza Filho AG, Filho JM, Alves OL, De Santis MAC3, and Silva EN. Vibrational and Thermal Properties of Ionic Conductors Type Pirochlore H1-xAgxTaWO6.nH2O. Journal of Material Sciences & Engineering, 7(5), 2018.
- [18] V Bhat and J Gopalakrishnan. Novel layered oxides related to the rutile structure. Synthesis and investigation of ion-exchage and intercalation behaviour. Solid State Ionics, 26:25–32, 1988.
- [19] N Kumada, O Horiuchi, F Muto, and N Kinomura. A NEW LAYERED TYPE COMPOUND, HTaWO6-nH2O (n=0.5-1.5) PREPARED FROM LiTaWO6 BY ION EXCHANGE REACTION. Mat. Res. Bull., 23:209–216, 1988.
- [20] N Kumada, M Takeshita, and N Kinomura. A NEW LAYERED TYPE COMPOUND, HTaWO6-nH2O (n = 0.5-1.5) PREPARED FROM LiTaWO6 BY ION EXCHANGE REACTION. Mat. Res. Bull., 23:1053–1060, 1988.
- [21] L Sebastian and J Gopalakrishnan. Lithium ion mobility in metal oxides: a materials chemistry perspective. J. Mater. Chem., 13:433–441, 2003.
- [22] E N Silva. Propriedades vibracionais de perovsquitas complexas ordenadas. Tese de doutorado, Universidade Federal do Cear , Fortaleza-CE, 2008.
- [23] M Catti and C M Mari. Raman Study and Eletrical Conductivity of HTaMO6 (M=W and Te). Sol. Stat. Ion., 40/41:900, 1990.
- [24] S M Kostritskii, P Bourson, M Aillerie, M D Fontana, and D Kip. Quantitative evaluation of the electro-optic effect and second-order optical nonlinearity of lithium tantalate crystals of different compositions using Raman and infrared spectroscopy. Appl. Phys., B 82:423–430, 2006.
- [25] A Dias, L A Khalam, M T Sebastian, and R L Moreira. Raman-spectroscopic investigation of Ba2InTaO6 and Sr2InTaO6 perovskites. Journal of Solid State Chemistry, 180:2143–2148, 2007.
- [26] A P Ayala, I Guedes, E N Silva, M S Augsburger, M del C Viola, and J C Pedregosa. Raman investigation of A2CoBO6 (A=Sr and Ca, B=Te and W) double perovskites. Journal of Applied Physics, 101:123511, 2007.
- [27] E N Silva, A P Ayala, I Guedes, R M Pinacca S A Larregola, M del C Viola, and J C Pedregosa. Vibrational study of double perovskites a3in2bo9 (a= ba, sr; b = u, w). Journal of Raman Spectroscopy, 2009.
- [28] N G Eror and U Balachandran. Vibrational spectroscopic study of the compound TiTa2O7. Spectrochim. Acta, Part A, 39:261–263, 1983.
- [29] A A MCCONNELLand J S ANDERSON and C N R RAO. RAMAN-SPECTRA OF NIOBIUM OXIDES. SPECTROCHIMICA ACTA PART A-MOLECULAR AND BIOMOLECULAR SPECTROSCOPY, 32(5):1067–1076, 1976.
- [30] A E Lavat and E J Baran. IR-spectroscopic characterization of A2B’BÖ6 perovskites. Vibrational Spectroscopy, 32:167, 2003.
- [31] M LIEGEOIS and P TARTE. VIBRATIONAL STUDIES OF MOLYBDATES, TUNGSTATES AND RELATED COMPOUNDS .3. ORDERED CUBIC PEROVSKITES A2BIIBVIO6. SPECTROCHIMICA ACTA PART A-MOLECULAR AND BIOMOLECULAR SPECTROSCOPY, A 30(9):1771–1786, 1974.
- [32] C M Mari, A Anghileri, M Catti, and G Chiodelli. . Sol. Stat. Ion., 28-30:642, 1988.