Propagation Modeling Through Foliage
in a Coniferous Forest at 28 GHz
Abstract
The goal of this article is to investigate the propagation behavior of 28-GHz millimeter wave in coniferous forests and model its basic transmission loss. Field measurements were conducted with a custom-designed sliding correlator sounder. Relevant foliage regions were extracted from high-resolution LiDAR data and satellite images. Our results show that traditional foliage analysis models for lower-frequency wireless communications fail to consistently output correct path loss predictions. Novel fully automated site-specific models are proposed to resolve this issue, yielding 0.9 dB overall improvement and up to 20 dB regional improvement in root mean square errors.
Index Terms:
Channel modeling, coniferous forest environments, millimeter wave, site-specific models.I Introduction
With the rapid standardization process of 5G networks [1], millimeter waves (mm-waves) have garnered great attention worldwide from industry, academia, and government. A major issue is to better understand the propagation characteristics of mm-wave signals. Many mm-wave channel measurement campaigns have recently been carried out in urban and suburban environments [2, 3, 4, 5]. However, very limited effort has been put into validating and improving current channel models in overcoming vegetation blockage. This is a key element of sensor data collection in forestry and agriculture [6] for preventing cost incurred by under/over-deployment of the sensors and improving their communication performance. In [7], a constant excess path loss of around 25 dB was observed at 28.8 GHz through a pecan orchard for paths with roughly 8 to 20 trees. More recent works [5, 8] reported low attenuation values per unit foliage depth of 0.07 dB/m at 28 GHz and of 0.4 dB/m with 3 dB deviation at 73 GHz, respectively. In [9], attenuation with a dual-slope structure was observed for out-of-leaf measurements at 15 GHz, 28 GHz and 38 GHz in forest environments. Moreover, even though a variety of modeling approaches have been considered, most of them ignore site-specific geographic features [5]. A comprehensive analysis for attenuation in vegetation is required to validate those observations and make improvements to mm-wave propagation modeling.
We explore this gap by investigating mm-wave propagation at 28 GHz through a coniferous forest in Boulder, Colorado, where we recorded a total of 1415 basic transmission loss measurements. A comprehensive model comparison is provided to elucidate the pros and cons of different modeling approaches for predicting signal attenuation through vegetation. Novel site-specific models with consistently better performance than existing models are developed.
II Measurement Setup
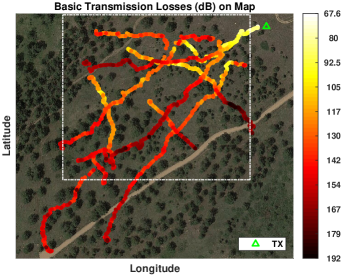
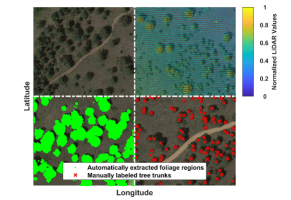
The measurement system in our previous work [4] was utilized. The receiver (RX), with a chip rate of 399.95 megachips per second, was installed in a backpack and powered by a lithium-ion polymer battery for portability purposes. As illustrated in Fig. 1LABEL:sub@fig_rx_tracks, the transmitter (TX) was set up at the edge of the forest, while the RX was moved in the coniferous forest to continuously record the signal along with the GPS location information. Basic transmission losses were computed accordingly. The TX antenna was adjusted before each signal recording activity to point to the middle area of the track to be covered. Beam alignment was achieved at the RX side using a compass. We also obtained satellite images from Google Maps and LiDAR data from the United States Geological Survey (USGS). Tree locations were manually labeled accordingly. Foliage regions were automatically extracted by comparing the LiDAR data with USGS terrain elevation data. These site-specific geographic features of the forest are illustrated in Fig. 1LABEL:sub@fig_tree_locaitons_zoomed_in. Boulder is a semi-arid environment with low humidity and minimal rainfall. Measurements were performed on a warm spring day under mostly sunny conditions.
III Foliage Analysis for the Coniferous Forest
We compared three empirical foliage analysis models: the partition-dependent attenuation factor (AF) model [10], the ITU-R obstruction by woodland model [11], and Weissberger’s model [12]. To tune these models, four parameters were computed for each measurement location: the distance between the TX and the RX, the number of tree trunks within the first Fresnel zone, the foliage depth along the line-of-sight (LoS) path, and the foliage area within the first Fresnel zone. These computations were performed in a three-dimensional (3D) reference system using Universal Transverse Mercator coordinates and altitude. Based on these results, site-specific models were introduced to improve path loss predictions.
All channel models considered here generate excess attenuation values on top of a site-general channel model. We use the free-space path loss (FSPL) model as the baseline generic model. The path loss in dB at the RX location is then composed of two parts:
where is the FSPL in dB at a RX-to-TX distance of at , and is the excess path loss in dB at .
III-A The AF Propagation Model [10]
The partition-dependent AF propagation model takes advantage of site-specific information by assuming that each instance of one type of obstacle along the LoS path will incur a constant excess path loss. In our case, we counted the number of trees, , along the LoS path to and added a constant excess path loss in dB, , for each of the trees, as follows:
Considering the forest size and the number of RX locations involved, it is extremely difficult and time-consuming to count at each on-site. In our work, we simplified the trees, making them vertical lines rather than estimating the cylinder of each tree. Then, the number of trees within the first Fresnel zone for each was estimated based on manually labeled trunk locations and used as the number of obstacle trees.
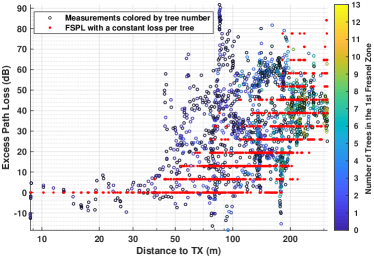
Fig. 2 shows the predictions obtained from the AF model. The unknown constant was fit according to the measurement data, resulting in a value of 6.47 dB per tree. As can be seen, the AF model closely follows the shape formed by the measurement results. However, it suffers in predicting the correct amount of excess path loss in general. This is expected because we have only considered the trunk locations for counting trees, but their physical sizes also play a critical role in attenuating the signal. The root mean squared error (RMSE) for the AF model compared with the measurements is 27.96 dB, achieving a 11.47 dB improvement over the FSPL model but still significantly worse than those for the other two empirical models discussed below. We observe that it may be possible to improve the AF model by classifying trees into different size categories and assigning each category a loss value. However, in our case, trees grew in clusters, making it extremely challenging to distinguish individual canopies and to properly classify trees.
III-B ITU-R Obstruction by Woodland Model [11]
The ITU-R obstruction by woodland model assumes one terminal (the TX or the RX) is located within woodland or similar extensive vegetation, which fits well our measurement scenario. Instead of the number of trees, the ITU model uses the length of the path within the woodland in meters, , which is the distance from the woodland edge to the terminal in the woodland, to estimate the excess path loss:
| (1) |
where dB/m is the typical specific attenuation for very short vegetative paths at 28 GHz, and is the maximum attenuation in dB. The most distinguishing feature of this model is the upper limit imposed on the excess path loss.
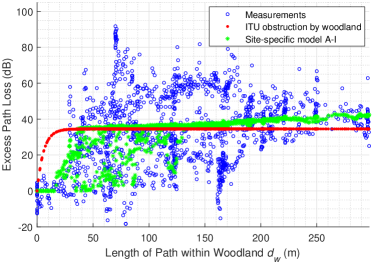
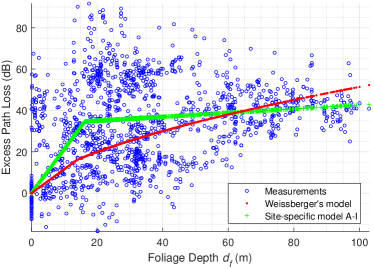
Since the TX was installed approximately 15 m away from the forest, this offset has been taken away from the 3D RX-to-TX distance to estimate , with the negative values clipped to zero. Also, is yet to be determined in [11] for 28 GHz signals, so we fitted it to our measurement results to obtain the best possible performance, which yielded dB. The resulting predictions are plotted in Fig. 3. The ITU model exhibits the best fit among the empirical models considered, with an overall RMSE of 20.08 dB. However, it clearly overestimates the path loss for locations with smaller than 30 m. At those locations, the LoS path may be clear or blocked by only a couple of trees, differing from a typical woodland blockage scenario. On the other hand, the ITU model underestimates the path loss for large .
III-C Weissberger’s Model [12]
Weissberger’s model, or Weissberger’s modified exponential decay (WMED) model, can be formulated as follows:
where is the carrier frequency, and is the foliage depth in meters along the LoS path for the RX location . The model treats locations with 14 differently from those with less foliage blockage.
We have taken an image processing approach to automatically obtain the site-specific foliage depth, , which is the sum total distance for the intersections of the direct path and the foliage regions. Both the LiDAR data and the terrain elevation data from the USGS were rasterized onto the same set of reference location points. The foliage regions were then extracted by thresholding their difference, resulting in the foliage regions illustrated in Fig. 1LABEL:sub@fig_tree_locaitons_zoomed_in. Along the LoS path, the ratio of the number of foliage region pixels over the total number of pixels was calculated and multiplied with the corresponding 3D RX-to-TX distance to get the foliage depth for each RX location.
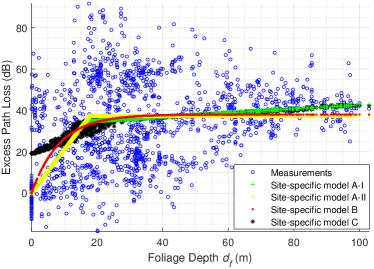
Fig. 4LABEL:sub@fig_weiss_results compares the predictions from the WMED model with the measurement results. Overall, the WMED model gives a reasonably good RMSE value of 22.19 dB.
III-D Site-specific Models
Using high-precision publicly available geographic information, existing channel models can be tuned with well-estimated site-specific parameters. As a result, simple but powerful site-specific models can be constructed as alternatives. We refer to these as "site-specific" models because their performance depends heavily on the accuracy of the parameters evaluated for each site.
By combining the idea of evaluating the blockage condition individually for each from the AF model and the two-slope modeling approach in the WMED model, we constructed model A-I:
where is the foliage depth in meters at , and are two constants for adjusting the extra loss in dB caused by each meter of foliage, and is the boundary determining when will take effect. The upper bound from the ITU model can be imposed by setting to form model A-II:
We also reused the ITU model in Equation 1 with site-specific foliage depth to form model B. That is, is used instead of , and parameters and are set according to the measurements.
For a fair performance comparison for these three models, we used the WMED boundary for model A-I to leave only two adjustable parameters. After fitting these models to our data, we found dB/m and dB/m for model A-I, dB/m and m for model A-II, along with dB and dB/m for model B. The resulting predictions are plotted in Fig. 4LABEL:sub@fig_site_spec_results. The corresponding RMSE values are summarized in Table I, together with those for the traditional models as references. Note that the site-specific models perform very similarly, and each unit of foliage depth tends to contribute less to the excess loss as foliage depth grows. Model A-I does not limit the excess loss as the other two site-specific models do, but it performs slightly better than model A-II in terms of RMSE. Overall, model B performs the best, but computationally, it is more demanding because of its exponential form.
We can further push the best RMSE performance to 19.18 dB with Model C:
where foliage area is the sum total area for the intersections between the first Fresnel zone at RX location and the foliage regions; (dB), (dB/m2), and (dB/m2) are constants adjusting the excess loss contribution; and is the boundary determining when the foliage is deep enough for to take effect. According to our measurement results, we have dB, dB/m2, dB/m2, and m2. This model has a sudden jump at the origin. Its prediction results are also shown in Fig. 4LABEL:sub@fig_site_spec_results for reference.
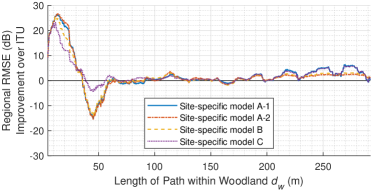
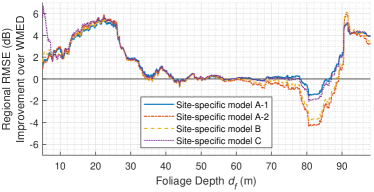
The most important feature for these models is that they are fully automatic and thus can be applied in large-scale wireless communication networks. Site-specific information was fetched from Google and USGS servers. Foliage information was extracted, and channel modeling performed, by our automated algorithms. Another advantage of our site-specific models is their consistently good performance throughout the whole dataset. To demonstrate this, regional RMSE improvements over the ITU and WMED models are evaluated in terms of and , respectively, as summarized in Fig. 5. For our dataset, the ITU model works very well, as shown in Table I. However, according to Fig. 5LABEL:sub@fig_regional_perf_itu, the ITU model suffers from an RMSE degradation of as much as 20 dB compared with the site-specific models in the low-vegetation-coverage region (30 m). For large , this value is observed to be as much as 6 dB. A visual comparison for predictions from the ITU model and model A-I is provided in Fig. 3, where model A-I clearly works better for extreme cases at the low and high ends of . Similar comparisons have been carried out for the WMED model in Fig. 4LABEL:sub@fig_weiss_results and Fig. 5LABEL:sub@fig_regional_perf_wmed. The WMED model slightly underestimates the path loss at RX locations with a small and overestimates it at large .
| Baseline | Traditional | Site-Specific | ||||||
|---|---|---|---|---|---|---|---|---|
| Model | FSPL | AF | ITU | WMED | A-I | A-II | B | C |
| RMSE (dB) | 39.43 | 27.96 | 20.08 | 22.19 | 19.96 | 20.02 | 19.93 | 19.18 |
IV Conclusion
A comprehensive channel model comparison for attenuation through vegetation was conducted using measurements in a coniferous forest near Boulder, Colorado. Inspired by the results, we developed novel site-specific models for consistent improvement in prediction accuracy through shallow to deep vegetation blockages. They are fully automatic, easy to implement, and feasibly applicable to machine learning frameworks.
References
- [1] S. A. Busari, S. Mumtaz, S. Al-Rubaye, and J. Rodriguez, “5G millimeter-wave mobile broadband: Performance and challenges,” IEEE Communications Magazine, vol. 56, no. 6, pp. 137–143, June 2018.
- [2] T. S. Rappaport, S. Sun, R. Mayzus, H. Zhao, Y. Azar, K. Wang, G. N. Wong, J. K. Schulz, M. Samimi, and F. Gutierrez Jr., “Millimeter wave mobile communications for 5g cellular: It will work!” IEEE Access, vol. 1, no. 1, pp. 335–349, 2013.
- [3] T. S. Rappaport, G. R. MacCartney, S. Sun, H. Yan, and S. Deng, “Small-scale, local area, and transitional millimeter wave propagation for 5G communications,” IEEE Transactions on Antennas and Propagation, vol. 65, no. 12, pp. 6474–6490, 2017.
- [4] Y. Zhang, D. J. Love, N. Michelusi, J. V. Krogmeier, C. R. Anderson, S. Jyoti, and A. Sprintson, “28-GHz channel measurements and modeling for suburban environments,” in 2018 IEEE International Conference on Communications (ICC). IEEE, May 2018, pp. 1–6.
- [5] Y. Zhang, D. J. Love, N. Michelusi, J. V. Krogmeier, S. Jyoti, A. Sprintson, and C. R. Anderson, “Improving millimeter-wave channel models for suburban environments with site-specific geometric features,” in 2018 International Applied Computational Electromagnetics Society (ACES) Symposium. IEEE, 2018, pp. 1–2.
- [6] H. Wu, L. Zhang, and Y. Miao, “The propagation characteristics of radio frequency signals for wireless sensor networks in large-scale farmland,” Wireless Personal Communications, vol. 95, no. 4, pp. 3653–3670, 2017.
- [7] P. B. Papazian, D. L. Jones, and R. H. Espeland, “Wideband propagation measurements at 30.3 GHz through a pecan orchard in texas,” National Telecommunications and Information Administration (NTIA), Boulder, CO, Tech. Rep. 92-287, September 1992.
- [8] T. S. Rappaport and S. Deng, “73 GHz wideband millimeter-wave foliage and ground reflection measurements and models,” in 2015 IEEE International Conference on Communication Workshop (ICCW). IEEE, 2015, pp. 1238–1243.
- [9] M. Shaik, A. Kabanni, and N. Nazeema, “Millimeter wave propagation measurments in forest for 5G wireless sensor communications,” in 2016 Mediterranean Microwave Symposium (MMS). IEEE, 2016, pp. 1–4.
- [10] G. Durgin, T. S. Rappaport, and H. Xu, “Measurements and models for radio path loss and penetration loss in and around homes and trees at 5.85 GHz,” IEEE Transactions on Communications, vol. 46, no. 11, pp. 1484–1496, 1998.
- [11] International Telecommunication Union, Recommendation ITU-R P.833-9 Attenuation in vegetation, Std., September 2016. [Online]. Available: https://www.itu.int/rec/R-REC-P.833-9-201609-I/en
- [12] M. A. Weissberger, “An initial critical summary of models for predicting the attenuation of radio waves by trees,” Electromagnetic Compatibility Analysis Center, Annapolis, MD, Tech. Rep. ESD-TR-81-101, 1982.