11email: lokas@camk.edu.pl
Buckling instability in tidally induced galactic bars
Strong galactic bars produced in simulations tend to undergo a period of buckling instability that weakens and thickens them and forms a boxy/peanut structure in their central parts. This theoretical prediction has been confirmed by identifying such morphologies in real galaxies. The nature and origin of this instability remains however poorly understood with some studies claiming it to be due to fire-hose instability while others relating it to vertical instability of stellar orbits supporting the bar. One of the channels for the formation of galactic bars is via the interaction of disky galaxies with perturbers of significant mass. Tidally induced bars offer a unique possibility of studying buckling instability because their formation can be controlled by changing the strength of the interaction while keeping the initial structure of the galaxy the same. We use a set of four simulations of flyby interactions where a galaxy on a prograde orbit forms a bar, which is stronger for stronger tidal forces. We study their buckling by calculating different kinematic signatures, including profiles of the mean velocity in vertical direction, as well as distortions of the bars out of the disk plane. Although our two strongest bars buckle most strongly, there is no direct relation between the ratio of vertical to horizontal velocity dispersion and the bar’s susceptibility to buckling, as required by the fire-hose instability interpretation. While our weakest bar buckles, a stronger one does not, its dispersion ratio remains low and it grows to become the strongest of all at the end of evolution. Instead, we find that during buckling the resonance between the vertical and radial orbital frequencies becomes wide and therefore able to modify stellar orbits over a significant range of radii. We conclude that the vertical orbital instability is the more plausible explanation for the origin of buckling.
Key Words.:
galaxies: evolution – galaxies: fundamental parameters – galaxies: interactions – galaxies: kinematics and dynamics – galaxies: spiral – galaxies: structure1 Introduction
Bars are the dominant non-axisymmetric features in late-type galaxies and a significant fraction of galaxies of this type possess them (see e.g. Buta et al., 2015, and references therein). Theoretical models have demonstrated that bars can form as a result of instability in self-gravitating axisymmetric disks (for a review see Athanassoula, 2013) or via interactions with perturbers of different masses (Noguchi, 1996; Miwa & Noguchi, 1998). Soon after their formation stronger bars undergo one or more episodes of buckling instability that involves distortions of the bar out of the equatorial plane of the disk and results in weakening and thickening of the bar (for a review see Athanassoula, 2016). The thickened bar takes the form of the so-called boxy/peanut shape when viewed edge-on.
Understanding buckling instability is important for the studies of bar evolution in galaxies, including the Milky Way, which has been known for a long time to possess the boxy/peanut structure in the inner parts (Weiland et al., 1994; Ciambur et al., 2017). Bar buckling in the Milky Way has been invoked to explain unusual behavior of stellar populations in the bulge (Debattista et al., 2017) and recently proposed by Khoperskov et al. (2019) to be the origin of the phase-space spirals discovered in Gaia DR2 (Antoja et al., 2018). While the observations of bars confirmed the presence of boxy/peanut shapes in many galaxies (Bureau et al., 2006; Yoshino & Yamauchi, 2015; Erwin et al., 2017; Li et al., 2017; Savchenko et al., 2017), including the classical example of NGC 128, catching the bars ‘in the act’ of actual distortion out of the disk plane remains elusive. Erwin et al. (2016) attempted this in the case of NGC 3227 and NGC 4569 by comparing asymmetric photometric and kinematic features of these galaxies to those of a simulated buckling bar.
Buckling of galactic bars has been studied theoretically mostly via -body and hydrodynamical simulations. The presence of boxy/peanut morphology was first convincingly demonstrated in the simulations of Combes & Sanders (1981). Pfenniger & Friedli (1991) and Raha et al. (1991) detected periods of asymmetric distortion of their simulated bars out of the disk plane before the formation of boxy/peanut shapes. Debattista et al. (2004) and Athanassoula (2005) found that the thickened parts of the bars resulting from buckling are in many aspects similar to bulges of late-type galaxies. Martinez-Valpuesta et al. (2006) were the first to report recurrent buckling in their simulation of a Milky Way-like galaxy. Later simulations of Debattista et al. (2006) demonstrated that buckling is quite common in simulated galaxies and in general weakens the bars but does not destroy them, contrary to the original suggestion of Raha et al. (1991). Simulations including gas dynamics and other hydrodynamical processes have however demonstrated that they can suppress buckling (Debattista et al., 2006; Berentzen et al., 2007; Villa-Vargas et al., 2010).
Although considerable effort has been invested into the studies of the buckling instability, its nature remains unclear, as recently emphasized by Smirnov & Sotnikova (2018). The early studies (Combes et al., 1990; Pfenniger & Friedli, 1991) suggested that buckling is due to orbital instability resulting from coinciding horizontal and vertical inner Lindblad resonances. The modification of the orbital structure then involves the bifurcation of the family of orbits into corresponding to the 2:1 vertical resonance and banana-like orbits, although the final orbital structure of the boxy/peanut is much more complicated (Patsis et al., 2002; Portail et al., 2015; Valluri et al., 2016; Abbott et al., 2017; Patsis & Harsoula, 2018). Other authors (Raha et al., 1991; Merritt & Hernquist, 1991; Merritt & Sellwood, 1994) related buckling to the fire-hose instability as envisioned by Toomre (1966). In this case the instability is controlled by the ratio of velocity dispersions along the vertical and horizontal directions. The instability is supposed to occur for low values of this ratio (of the order of 0.3) and is prevented if the ratio is large enough. The discussion continues to this day with some authors claiming the buckling to be due to orbital resonances (Saha et al., 2018) while others assign it to the fire-hose instability (Zana et al., 2018).
As mentioned above, one of the channels for the formation of bars is to induce them tidally by interaction with other objects. These may result from tidal effects generated by a neighboring bigger structure, as in the case of a satellite dwarf galaxy orbiting a bigger host (Łokas et al., 2014, 2015; Gajda et al., 2017, 2018) or a normal-size galaxy orbiting a cluster (Mastropietro et al., 2005; Łokas et al., 2016). Bars can also be induced by satellites infalling into or passing near a bigger galaxy (Mihos et al., 1995; Mayer & Wadsley, 2004; Gauthier et al., 2006; Purcell et al., 2011; Pettitt & Wadsley, 2018) or in interactions between galaxies of similar mass (Lang et al., 2014; Łokas, 2018; Peschken & Łokas, 2019). Tidally induced bars offer a unique possibility of studying buckling instability because their formation can be controlled by changing the strength of the interaction while keeping the initial structure of the galaxy the same. The bars forming in such interactions are then of different strength but they share as many similarities as possible.
In this paper we study the buckling instability occurring in tidally induced bars formed in flyby interactions of two Milky Way-like galaxies with the aim to elucidate its nature. In Section 2 we describe the simulations used in this work and in Section 3 we characterize the bars formed in these simulations. Section 4 focuses on different measures of the buckling instability and the discussion follows in Section 5.
| Simulation | Line color | ||||
|---|---|---|---|---|---|
| (kpc) | (kpc) | (km s-1) | |||
| B1 | 500 | 25 | 500 | 0.07 | blue |
| B2 | 350 | 25 | 350 | 0.15 | cyan |
| B3 | 300 | 25 | 300 | 0.20 | green |
| B4 | 250 | 25 | 250 | 0.26 | red |
2 The simulations
For the purpose of this study we used some of the simulations of galactic flybys described in Łokas (2018) and performed an additional one with a similar initial configuration. The configuration was illustrated in figure 1 of Łokas (2018) and comprised two Milky Way-like disky galaxies, each composed of a stellar disk and a dark matter halo. The disks were aligned with the orbital plane () of the flyby but so that one had exactly prograde and the other exactly retrograde orientation. The galaxies were placed at a distance from the axis and from the axis and assigned velocities in opposite directions along the axis of the simulation box. The distance , i.e. the nominal impact parameter, was the same for all simulations and the values of and were selected so that the flyby took place approximately after 1 Gyr from the start of the simulation in all cases.
We considered four different choices of and listed in the second and fourth column of Table LABEL:tabconfiguration leading to four simulations which were labelled B1-B4. The fifth column of the Table gives the values of the dimensionless tidal strength parameter of Elmegreen et al. (1991) which all fall in the interesting regime of identified by Elmegreen et al. (1991) as leading to the formation of bars. The last column indicates the color of lines with which the results for the corresponding simulation will be shown throughout the paper. We note that the simulations B1, B2 and B4 were named S2, S3 and S4 in Łokas (2018) and simulation B3 was additionally performed for this study.
As discussed in Łokas (2018), the model of the Milky Way used here is stable against bar formation in isolation, i.e. a very weak bar starts to form in the disk about 3 Gyr after the start of the simulation. For completeness, we recall the structural parameters of the galaxy which was similar to the model MWb of Widrow & Dubinski (2005): its dark matter halo had an NFW (Navarro et al., 1997) profile with a virial mass M⊙ and concentration while the exponential disk had a mass M⊙, the scale-length kpc and thickness kpc. The profile of the Toomre parameter for this model had a minimum of at .
The model of the galaxy was same as the one used by Łokas et al. (2016), Semczuk et al. (2017) and Łokas (2018). Its -body realization was created using the procedures described in Widrow & Dubinski (2005) and Widrow et al. (2008) with each component containing particles. The evolution of the two galaxies was followed for 3 Gyr with the -body code GADGET-2 (Springel et al., 2001; Springel, 2005) saving outputs every 0.05 Gyr. The adopted softening scales were kpc and kpc for the disk and halo of the galaxies, respectively.
3 Evolution of the bars
As discussed in detail in Łokas (2018), out of the two galaxies participating in each flyby, only the one on the prograde orbit forms a strong bar. The reasons for this behavior were thoroughly explained in this previous paper and involve the resonance between the angular velocity of the stars in the prograde disk and the motion of the perturbing galaxy. Here, from now on, we will consider only the bars formed in these prograde disks.
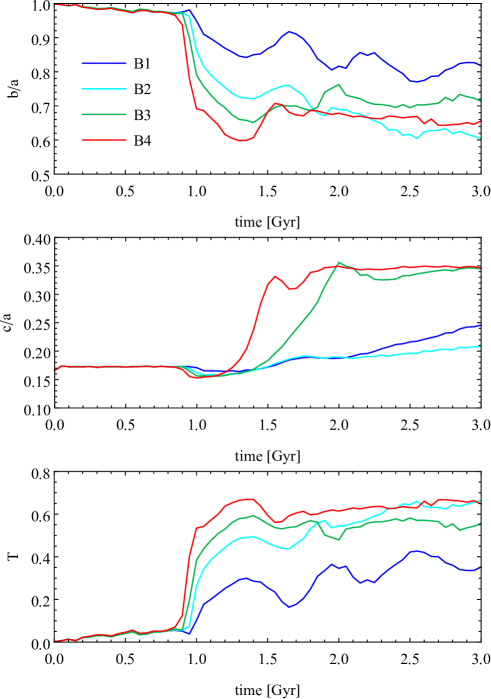
The simplest and most straightforward way to describe the formation of the bar is to measure the evolution of the shape of the stellar component of the galaxy in time. We do this by calculating the inertia tensor from all stars within and aligning the stellar component with the resulting principal axes, so that is along the major axis, along the intermediate axis and corresponds to the shortest one. After rotating the stellar component in this way we calculate for each snapshot the axis ratios (intermediate to longest) and (shortest to longest) using again all stars within . The shape of the stellar component is immediately clear from the combination of these ratios in the form of the triaxiality parameter which vanishes for infinitely thin disks and approaches unity for thin needles.
The evolution of the three quantities is shown in Figure 1. At the beginning the properties of the galaxies are very similar in all simulations and the disks are preserved, as demonstrated by the triaxiality parameter remaining close to zero. At the time of the interaction, around 1 Gyr from the start of the simulations, abrupt changes take place and the triaxiality increases very strongly reaching , i.e. going from the low values characteristic of disks to high values typical for prolate spheroids. This obviously signifies the formation of bars in all galaxies. Note that right after the bar formation, around Gyr, higher values of triaxiality reflect the stronger interactions during the flyby, as measured by the Elmegreen parameter (see Table LABEL:tabconfiguration).
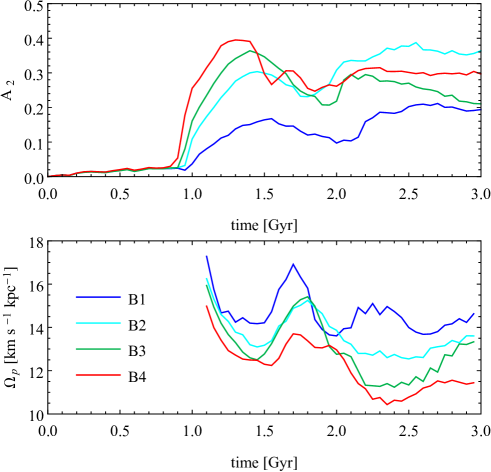
It is customary to measure the strength of the bar with the mode of the Fourier decomposition of the surface distribution of stars projected along the short axis: where is the azimuthal angle of the th star and the sum is up to the total number of stars. The radius is the standard radius in cylindrical coordinates in the plane of the disk, . We measured this quantity again using all stars within the radius of in one bin and show the evolution of this bar mode in the upper panel of Figure 2. The results confirm the impression from the analysis of the triaxiality parameter: the bar is initially stronger for stronger interactions during the flyby. There is a subtle difference however in terms of the time when the first maximum of is reached. We note that the B4 bar grows faster and reaches its maximum sooner, around Gyr, than the other bars which have the maxima at 1.4, 1.45 and 1.55 Gyr for B3, B2 and B1, respectively. However, in the later stages of the evolution the hierarchy of the mode is not preserved. After some decrease in the case of all bars, the one in B2 grows most and ends up highest of all at the end of the evolution.
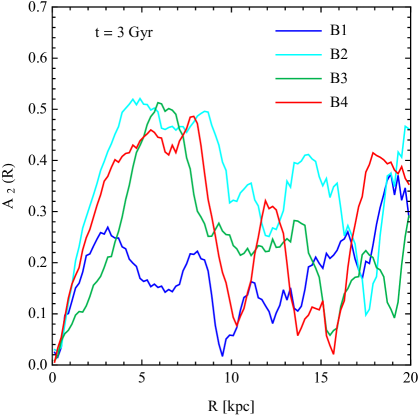
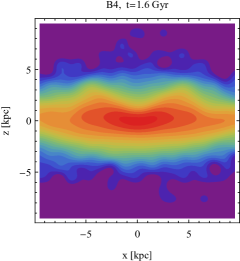
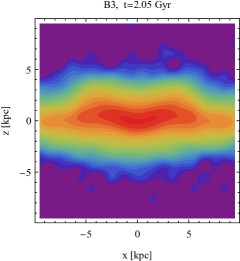
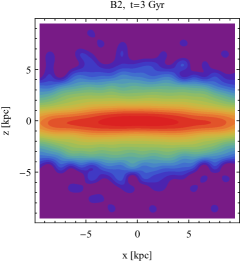
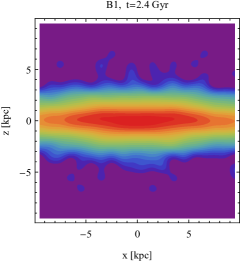
Figure 3 shows the profiles of at the end of the evolution ( Gyr). They have a typical shape strongly increasing at low radii, reaching a maximum at a few kpc and then decreasing. The decrease is not as smooth as for a typical bar formed in isolation because of additional structures present. The secondary peaks and variations in the outer radii are due to the presence of the rings and spiral arms also resulting from the interaction. We note that except for B1, which is rather weak, all the remaining bars are quite strong, with maximum bar mode . We also note that B3 is a bit more spherical in the center, i.e. its profile grows more slowly with radius in the inner 5 kpc.
In the lower panel of Figure 2 we plot the evolution of the pattern speed of the bars obtained by measuring the difference between the orientation of the major axis of the stellar component in two subsequent simulation outputs. The measurements start at Gyr, after the formation of the bar and have been smoothed by averaging over three subsequent outputs to reduce the noise. The pattern speeds turn out to be rather low, between 10 and 18 km s-1 kpc-1, characteristic of tidally induced bars and dark matter dominated galaxies. As expected, the hierarchy of the pattern speeds is inverted with respect to the bar strength as measured by , i.e. stronger bars are slower. Interestingly, this hierarchy is preserved also in the later stages of the evolution, namely the pattern speed of B2 remains between the values for B1 and B3 in spite of the bar being the strongest in this case. There is also a dependence between the bar strength and its pattern speed in time for each of the simulated bars: in general a decreasing trend in the evolution is accompanied by an increasing trend in the pattern speed. We note that the bars are also slow in terms of the ratio where is the corotation radius and is the bar length. This ratio is of the order of 2 for all our bars (Łokas, 2018).
4 Buckling instability
The decrease of the strength of the bar mode soon after the formation of the bar, as seen in the upper panel of Figure 2, is typically a signature of buckling instability which tends to weaken the bar. We verify that this phenomenon indeed occurs in our bars by visual inspection of the surface density distribution of the stars in the edge-on view, i.e. along the intermediate axis of the bar. A few examples of such distributions are shown in Figure 4, one for each simulation. We see that strong distortions of the bar out of the disk plane are indeed present, especially in the case of B4 and B3, while only a weak distortion is present for B1 and almost none for B2. As discussed in more detail below, the output times used in Figure 4 were selected as those when the close to maximum distortion is seen for a given simulation, except for B2 where we took the final output ( Gyr).
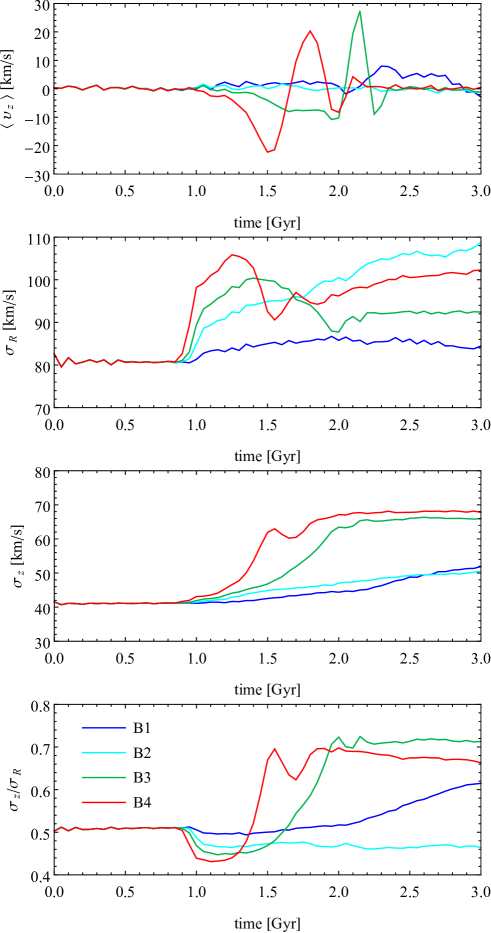
In order to further explore the phenomenon and determine its timescale, we look at the kinematic evolution of the bars. The distortions must involve systematic departures out of the disk plane of significant numbers of stars and these may manifest themselves in ordered motion along the axis. We measure this by calculating the mean velocity of stars along , , as a function of time using stars within . This quantity is shown in the upper panel of Figure 5 measured with respect to the velocity of the center of the galaxy, estimated iteratively down to the radius of 0.5 kpc. The velocities were assumed to have a positive sign if they pointed along the positive axis, which was chosen to point in the same direction as the galaxy’s angular momentum vector. Clearly, a strong signal of mean velocity out of the disk plane is present, especially in the case of B4 and B3, reaching km s-1. Interestingly, a weak signal, at the level of 8 km s-1, is also visible for the weakest bar B1, formed in the weakest interaction, but not in the intermediate case B2, where the mean velocity does not exceed the noise. The kinematic signal occurs earlier for stronger bars, first for B4, then for B3 and at the latest time for B1. We note that the streaming motion with respect to the center in cases B3 and B4 has a negative sign first which changes to positive later on. This means that the stars move downwards first, creating a frown-like distortion of the bar, and upwards later, changing into a smile-like distortion. This is confirmed by following the evolution of the edge-on images like those in Figure 4 in time.
Buckling is known to increase the velocity dispersion along the axis and the thickness of the bar. In the second and third panel of Figure 5 we plot the evolution of the velocity dispersions in the radial and vertical direction, and , respectively. While is a measure of the bar strength, because it reflects the amount of radial motion in the bar, quantifies the effect of buckling in increasing the amount of vertical random motion in the bar which is related to its thickness. Indeed, the evolution of reflects that of the bar mode in the upper panel of Figure 2. On the other hand, the evolution of correlates with the velocity signature of buckling in the upper panel of Figure 5. Its increase is strongest in the case of B4 and B3, much weaker for B1 and occurs sooner for bars buckling earlier. Similar increase is seen in the thickness of the stellar component as measured by the axis ratio plotted in the middle panel of Figure 1.
In the lower panel of Figure 5 we show the evolution of the ratio with time. We see that right after the formation of the bar, the ratio drops and it does so more strongly for stronger bars. The more the ratio drops, the faster the buckling seems to occur, and the sooner the ratio grows at least for B4 and B3. This dependence is however broken for the weaker bars, B2 and B1: although the drop in B1 is smallest, this bar does buckle weakly later on, while B2, which shows a bigger drop, does not buckle at all and its remains at the same low level until the end of evolution. Let us note that in the case of B2 both and increase at a similar rate in time, i.e. there is an approximately linear growth of in time, probably due to heating, but no speed up of this growth takes place as it does in the case of B1.
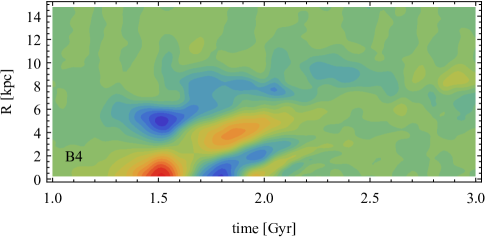
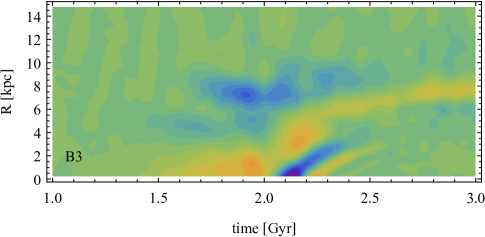
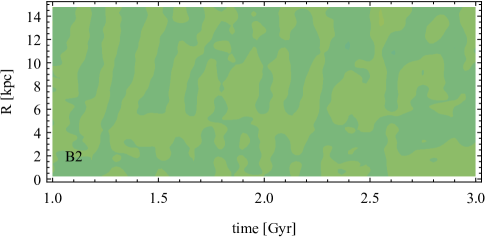
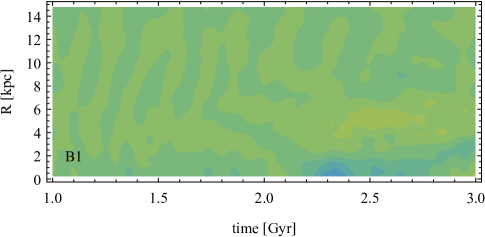
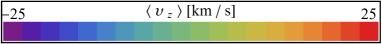
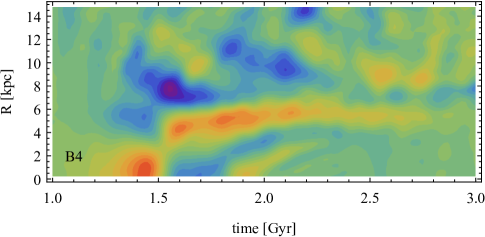
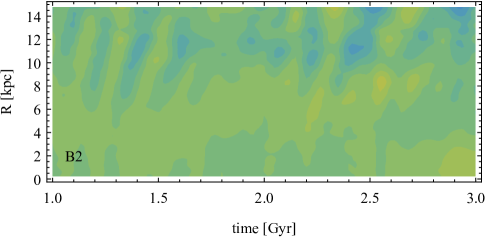
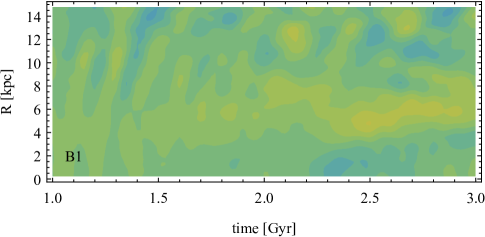
In order to obtain further insight into the kinematic structure of the bar at the time of buckling, in Figure 6 we plot the maps showing the evolution of the profiles in time. While for the global, single-value, measurement of shown in the upper panel of Figure 5 we used the reference frame centered on the very center of the galaxy, here we measure the velocities along with respect to the average, bulk motion of the galaxy estimated as the mean velocity of all stars within the radius of 10 kpc. As a result, the maps in Figure 6 show the motion of the center going up and the outer parts going down first (around Gyr for B4 and Gyr for B3), corresponding to the frown-like phase detected in the global measurement of Figure 5. Later on, in the second phase, the central parts of the bar move down and the outer parts move up and the distortion is smile-like. After these two main phases the bars start to oscillate even more, i.e. there are more changes in the sign of the velocity along the radius , until no large scale ordered motion is present any more.
In Figure 7 we plot the profiles of the mean distortion of the stellar component along , , as a function of time. As for the velocities, the measurements were done with respect to the mean position of the stars within the radius of 10 kpc. Also in this case, the first phase of frown-like distortion is seen, followed by a smile-like phase and more complicated patterns later on. As expected, the maximal distortions are shifted with respect to the maximal velocities along , for example the maximum velocity at Gyr for B4 corresponds to the change in the sign of the distortion at this time. Although the streaming velocities and distortions are much weaker in B1 than in B4 and B3, the characteristic pattern is still present. In the case of B2, some distortion in the outer radii are seen, but no corresponding signal is present in the velocity map, confirming our earlier claim that the bar in B2, in spite of being quite strong, does not buckle.
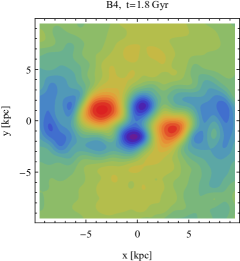
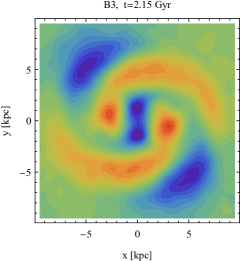
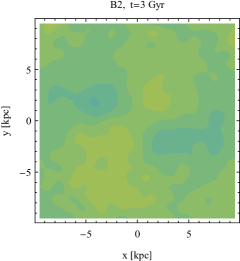
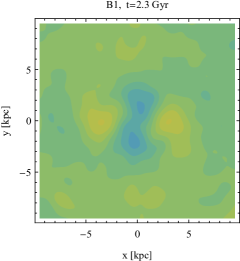
While the evolutionary plots of Figures 6 and 7 indeed provide more information on the character of the distortions, they still simplify the picture a little because the measurements are done in radial bins thus averaging the dependence of the data on the orientation. A fuller picture can be obtained by looking at the face-on maps of the mean vertical velocity distribution, as shown in Figure 8. Here the velocities were binned into 1 kpc 1 kpc bins and the measurements were done again with respect to the mean velocity of the stars within 10 kpc. The examples shown in the Figure correspond to the second phase of buckling, when the velocity is maximal and in the smile-like direction, except for B2 where we show the final output. In each panel the bar is oriented along the axis () and the galaxy is rotating anti-clockwise. An interesting pattern is revealed: the two regions of the dominant upward motion (in red) are located along the bar, while another pair of two regions moving downwards (in blue) are closer to the center and oriented perpendicular to the bar. More structure is present further out, related to the spiral arms which are particularly well visible in the case of B3. We note that a similar, although weaker, pattern of two regions moving upward and two moving downward is seen in B1, while no such structure is present in B2. While there is some motion in B2, it is on a larger scale and not related to the bar.
To complete our description of the distortions due to buckling and facilitate a comparison with other studies we calculated another commonly used measure of the asymmetry in the form of the mode of the Fourier decomposition of the surface distribution of stars in the edge-on view (projected along the intermediate axis): . This is similar to the standard mode calculation, where is the azimuthal angle of the th star and the sum is up to the total number of stars, but now the radius is measured in the plane, . Examples of the profiles for the times where the maximum distortions occur (according to Figure 7 for the second phase of buckling) for different simulations are shown in Figure 9.
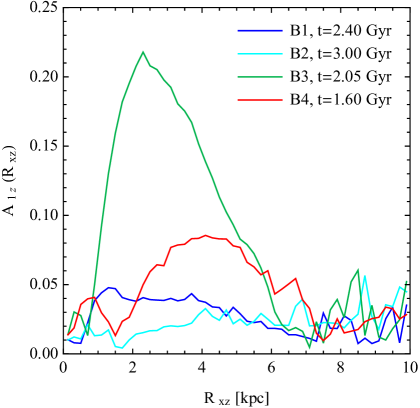
For the strongly buckling bars B3 and B4 the maxima of are 0.22 and 0.09 respectively, but the profiles peak at different radii: in the case of B3 the distortion is strongest closer to the center of the galaxy, around kpc while for B4 it occurs further out, at kpc. The times of this maximum distortion are also different. In the case of B4 the maximum occurs at Gyr after the start of the simulation, while for B3 the maximum distortion is present much later, at Gyr. Note that the hierarchy of the maxima in B4 and B3 would we reversed had we considered the first phase of buckling: the distortion is then stronger for B4. For B1 the values of are much lower reaching 0.05 near the center of the galaxy with a slight decreasing trend with radius, and the maximum occurs around Gyr. For B2 they are low at all times, with the radial trend rather opposite, so we show the example at the end of the evolution, Gyr. The times when the maximal distortions occur for each simulation were the same as those for which we show the edge-on galaxy images in Figure 4.
5 Discussion
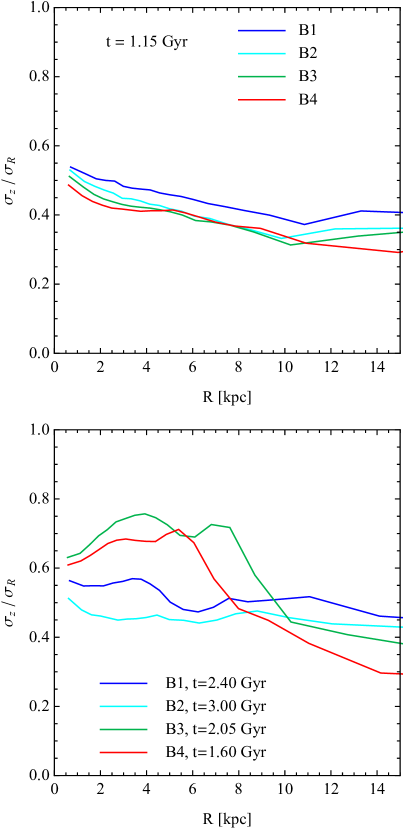
We studied the evolution of bars formed tidally as a result of flyby interactions of different strength, in particular the buckling instability that occurs in them. We find that strong buckling takes place in stronger bars, although the weakest bar in our sample also buckles a little. We found no direct relation between the value of the ratio of velocity dispersions in the vertical and radial direction, , and the bar’s susceptibility to buckling. While our weakest bar B1 with highest does buckle, a stronger one with lower present in simulation B2 does not. This suggests that the nature of buckling instability is not related to the fire-hose instability known from plasma physics.
In order to further explore the dependence of buckling on the ratio after bar formation, we plot in the upper panel of Figure 10 the profiles of this ratio for all our simulations at the time right after the formation of the bars ( Gyr). We can see that stronger bars have this ratio systematically lower within . In particular, the ratio has a significantly larger value for our weakest bar B1. If buckling was strictly related to the value of the ratio then B1 should be the least prone to the instability, which is not the case. Instead, the bar which does not buckle is the one in simulation B2 which has the profile very similar to B4 and B3 which buckle strongly. In the lower panel of Figure 10 we plot the same quantity, , but at the time of the second phase of buckling, when the distortion of the bars out of the disk plane in largest. We see that the ratio is now strongly increased in most cases as a result of buckling, but remains low for B2 which did not buckle. While the values of increased a little for this simulation in comparison with the earlier time (shown in the upper panel of the Figure), it was probably due to heating and not buckling since no strong vertical streaming motions associated with the bar were found in our analysis of this case in the previous section.
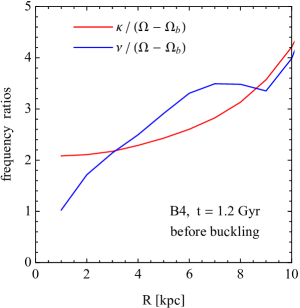
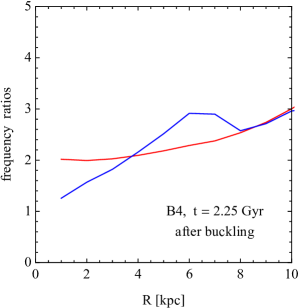
These results therefore support the alternative interpretation of the nature of buckling instability which states that it results from orbital instabilities and orbit trapping in the vicinity of the horizontal and vertical inner Lindblad resonances. To check if this interpretation is plausible we calculated the ratios and , where , and are the radial, circular and vertical frequencies and is the pattern speed of the bar shown in Figure 2. For this purpose we follow Pfenniger & Norman (1990) and Pfenniger & Friedli (1991) and use an axisymmetric approximation and the Poisson equation in the form which we evaluate at expressing the density by the surface density measured at each simulation output.
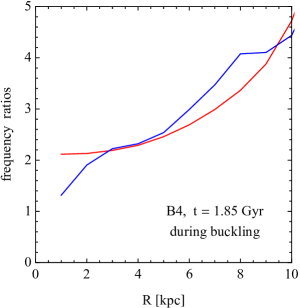
Examples of the profiles of frequency ratios and for our strongest bar B4 are shown in Figure 11. As discussed by Pfenniger & Norman (1990), a resonance zone where is always present in any potential which goes from spherical symmetry () to a flat disk (). This is what we see in the left panel of Figure 11 along the cylindrical radius which shows the frequency ratios before the bar buckles. Clearly, the resonance occurs only at one radius and is therefore very narrow and not effective in modifying the orbits of stars. However, following the evolution of the ratios to later times we find that at the time of buckling (middle panel of Figure 11) the frequency ratios coincide over a significant range of radii, 3 kpc 5 kpc, and are both close to the value of 2 characteristic of inner Lindblad resonances. At this time the resonance is thus much wider and able to dispatch stars out of the disk plane. After buckling (right panel of Figure 11) the resonance becomes narrow again in this radial range.
Similar behavior is found in simulations B3 and B1, although for B4 it looks most convincing. For B2 and coincide in a narrow range of radii and times but the buckling does not lift off. The reason why B2 does not buckle may be related to the presence of spiral arms. While the tidally induced bars studied here are particularly useful because they originate from the same initial disky galaxy, the difficulty such configurations entail is the formation of tidally induced spiral arms in addition to bars. The spiral arms are quite strong in the case of B2, even at the end of evolution, as confirmed by the presence of high secondary peaks of the profile at larger radii in Figure 3. After their formation, the spiral arms wind up and may disturb the orbital structure of the bar. In the case of B4 and B3 the bars may be strong enough to remain unaffected and in the case of B1 the spiral arms may be too weak, but for B2 they may affect the bar. However, even if this is the case, this circumstance actually speaks in favor of our interpretation of buckling in terms of vertical orbital instabilities. While the orbital structure of B2 may have been disturbed by the spiral arms its remained low and should have led to buckling if this was the quantity that controlled the occurrence of this phenomenon.
In summary, although to some extent similar to the fire-hose instability, the buckling seen in the tidally induced bars studied here does not relate directly to the ratio , as would be required in this case. We conclude in agreement with Pfenniger & Friedli (1991) and Pfenniger (1996) that the phenomenon of buckling is probably due to vertical instability of stellar orbits supporting the bar.
Acknowledgements.
This work was supported in part by the Polish National Science Center under grant 2013/10/A/ST9/00023. Insightful comments from the anonymous referee are kindly appreciated.References
- Abbott et al. (2017) Abbott, C. G., Valluri, M., Shen, J., Debattista, V. P. 2017, MNRAS, 470, 1526
- Athanassoula (2005) Athanassoula, E. 2005, MNRAS, 358, 1477
- Athanassoula (2013) Athanassoula, E. 2013, in Secular Evolution of Galaxies, ed. J. Falcón-Barroso J., & J. H. Knapen (Cambridge Univ. Press, Cambridge), 305
- Athanassoula (2016) Athanassoula, E. 2016, in Galactic Bulges, ed. E. Laurikainen, R. Peletier, & D. Gadotti (Springer International Publishing, Switzerland), 391
- Antoja et al. (2018) Antoja, T., Helmi, A., Romero-Gómez, M., et al. 2018, Nat, 561, 360
- Berentzen et al. (2007) Berentzen, I., Shlosman, I., Martinez-Valpuesta, I., & Heller, C. H. 2007, ApJ, 666, 189
- Bureau et al. (2006) Bureau, M., Aronica, G., Athanassoula, E., et al., 2006, MNRAS, 370, 753
- Buta et al. (2015) Buta, R. J., Sheth, K., Athanassoula, E., et al. 2015, ApJS, 217, 32
- Ciambur et al. (2017) Ciambur, B. C., Graham, A. W., & Bland-Hawthorn, J. 2017, MNRAS, 471, 3988
- Combes & Sanders (1981) Combes, F., & Sanders, R. H. 1981, A&A, 96, 164
- Combes et al. (1990) Combes, F., Debbasch, F., Friedli, D., & Pfenniger, D. 1990, A&A, 233, 82
- Debattista et al. (2004) Debattista, V. P., Carollo, C. M., Mayer, L., & Moore, B. 2004, ApJ, 604, L93
- Debattista et al. (2006) Debattista, V. P., Mayer, L., Carollo, C. M., et al. 2006, ApJ, 645, 209
- Debattista et al. (2017) Debattista, V. P., Ness, M., Gonzalez, O. A., et al. 2017, MNRAS, 469, 1587
- Erwin et al. (2016) Erwin, P., & Debattista, V. P. 2016, ApJ, 825, L30
- Erwin et al. (2017) Erwin, P., & Debattista, V. P. 2017, MNRAS, 468, 2058
- Elmegreen et al. (1991) Elmegreen, D. M., Sundin, M., Sundelius, B., & Elmegreen, B. 1991, A&A, 244, 52
- Gajda et al. (2017) Gajda, G., Łokas, E. L., & Athanassoula, E. 2017, ApJ, 842, 56
- Gajda et al. (2018) Gajda, G., Łokas, E. L., & Athanassoula, E. 2018, ApJ, 868, 100
- Gauthier et al. (2006) Gauthier, J.-R., Dubinski, J., & Widrow, L. M. 2006, ApJ, 653, 1180
- Khoperskov et al. (2019) Khoperskov, S., Di Matteo, P., Gerhard, O., et al. 2019, A&A, 622, L6
- Lang et al. (2014) Lang, M., Holley-Bockelmann, K., & Sinha, M. 2014, ApJ, 790, L33
- Li et al. (2017) Li, Z.-Y., Ho, L. C., & Barth, A. J. 2017, ApJ, 845, 87
- Łokas et al. (2014) Łokas, E. L., Athanassoula, E., Debattista, V. P., et al. 2014, MNRAS, 445, 1339
- Łokas et al. (2015) Łokas, E. L., Semczuk, M., Gajda, G., & D’Onghia, E. 2015, ApJ, 810, 100
- Łokas et al. (2016) Łokas, E. L., Ebrová, I., del Pino, A., et al. 2016, ApJ, 826, 227
- Łokas (2018) Łokas, E. L. 2018, ApJ, 857, 6
- Martinez-Valpuesta et al. (2006) Martinez-Valpuesta, I., Shlosman, I., & Heller, C. 2006, ApJ, 637, 214
- Mastropietro et al. (2005) Mastropietro, C., Moore, B., Mayer, L., et al. 2005, MNRAS, 364, 607
- Mayer & Wadsley (2004) Mayer, L., & Wadsley, J. 2004, MNRAS, 347, 277
- Merritt & Hernquist (1991) Merritt, D., & Hernquist, L. 1991, ApJ, 376, 439
- Merritt & Sellwood (1994) Merritt, D., & Sellwood, J. A. 1994, ApJ, 425, 551
- Mihos et al. (1995) Mihos, J. C., Walker, I. R., Hernquist, L., Mendes de Oliveira, C., & Bolte, M., 1995, ApJ, 447, L87
- Miwa & Noguchi (1998) Miwa, T., Noguchi, M. 1998, ApJ, 499, 149
- Navarro et al. (1997) Navarro, J. F., Frenk, C. S., & White, S. D. M. 1997, ApJ, 490, 493 (NFW)
- Noguchi (1996) Noguchi, M. 1996, ApJ, 469, 605
- Patsis & Harsoula (2018) Patsis, P. A., & Harsoula, M. 2018, A&A, 612, A114
- Patsis et al. (2002) Patsis, P. A., Skokos, Ch., & Athanassoula, E. 2002, MNRAS, 337, 578
- Pettitt & Wadsley (2018) Pettitt, A. R., & Wadsley, J. W. 2018, MNRAS, 474, 5645
- Peschken & Łokas (2019) Peschken, N., & Łokas, E. L. 2019, MNRAS, 483, 2721
- Pfenniger (1996) Pfenniger, D. 1996, in Barred galaxies, ed. R. Buta, D. A. Crocker, & B. G. Elmegreen (Astronomical Society of the Pacific, San Francisco), 273
- Pfenniger & Friedli (1991) Pfenniger, D., & Friedli, D. 1991, A&A, 252, 75
- Pfenniger & Norman (1990) Pfenniger, D., & Norman, C. 1990, ApJ, 363, 391
- Portail et al. (2015) Portail, M., Wegg, C., & Gerhard, O. 2015, MNRAS, 450, L66
- Purcell et al. (2011) Purcell, C. W., Bullock, J. S., Tollerud, E. J., Rocha, M., & Chakrabarti, S. 2011, Nat, 477, 301
- Raha et al. (1991) Raha, N., Sellwood, J. A., James, R. A., & Kahn, F. D. 1991, Nat, 352, 411
- Saha et al. (2018) Saha, K., Graham, A. W., & Rodríguez-Herranz, I. 2018, ApJ, 852, 133
- Savchenko et al. (2017) Savchenko, S. S., Sotnikova, N. Ya., Mosenkov, A. V., Reshetnikov, V. P., & Bizyaev, D. V. 2017, MNRAS, 471, 3261
- Semczuk et al. (2017) Semczuk, M., Łokas, E. L., & del Pino, A. 2017, ApJ, 834, 7
- Smirnov & Sotnikova (2018) Smirnov, A. A., & Sotnikova, N. Ya. 2018, MNRAS, 481, 4058
- Springel (2005) Springel, V. 2005, MNRAS, 364, 1105
- Springel et al. (2001) Springel, V., Yoshida, N., & White, S. D. M. 2001, New Astronomy, 6, 79
- Toomre (1966) Toomre A. 1966, in Geophys. Fluid Dyn., No. 66-46, 111
- Valluri et al. (2016) Valluri, M., Shen, J., Abbott, C., & Debattista, V. P. 2016, ApJ, 818, 141
- Villa-Vargas et al. (2010) Villa-Vargas, J., Shlosman, I., & Heller, C. 2010, ApJ, 719, 1470
- Weiland et al. (1994) Weiland, J. L., Arendt, R. G., Berriman, G. B., et al. 1994, ApJ, 425, L81
- Widrow & Dubinski (2005) Widrow, L. M., & Dubinski, J. 2005, ApJ, 631, 838
- Widrow et al. (2008) Widrow, L. M., Pym, B., & Dubinski, J. 2008, ApJ, 679, 1239
- Yoshino & Yamauchi (2015) Yoshino, A., & Yamauchi, C. 2015, MNRAS, 446, 3749
- Zana et al. (2018) Zana, T., Capelo, P. R., Dotti, M., et al. 2018, submitted to MNRAS, arXiv:1810.07701