Prompt Fission Neutron Spectra in the 239Pu() Reaction
Abstract
Prompt fission neutron spectra from 239Pu () were measured with respect to 252Cf spontaneous fission for incident neutron energies from
to MeV at the Weapons Neutron Research facility (WNR) of the Los Alamos Neutron Science Center.
A newly designed high-efficiency fission chamber was coupled to the highly segmented Chi-Nu neutron liquid scintillator array to detect neutrons emitted in fission events.
The double time-of-flight technique was used to deduce the incident-neutron energies from
the spallation target and the outgoing-neutron energies from the fission chamber. Prompt fission neutron spectra (PFNS) were measured with respect to 252Cf spontaneous fission down to keV and up to about MeV for all the incident neutron energies with typical total uncertainties well below up to about MeV outgoing-neutron energy.
The general trend of PFNS is well reproduced by JEFF3.3 and ENDF/B-VIII.0 evaluations, although a better agreement is found with JEFF3.3 . Discrepancies were observed for the low-energy part of the spectra, especially around the opening of the -, - and -chance fission. Neutron average kinetic energies as a function of incident-neutron energy are obtained experimentally with reported total uncertainties below . The measured values agree with the most recent data.
The trend is fairly well reproduced by the JEFF3.3 evaluation, although it
fails to reproduce the experimental values within their uncertainties.
I Introduction
Observables related to prompt fission neutrons represent a key parameter for nuclear energy applications and technology, and provide valuable information on the fission process. As far as the applications are concerned, it has been recently shown that accurate predictions of nuclear criticality using neutron transport codes crucially depend on the underlying nuclear data, especially the prompt fission neutron spectrum peneliau2014 . While the accuracy of evaluated neutron multiplicities, , has improved in recent years for some nuclei, the experimental database of prompt fission neutron spectra consists of a limited number of datasets, far less precise than those on the other key fission observables and often discrepant capote2008 ; neudecker2016 .
For the 239Pu() prompt fission neutron spectrum (PFNS) the situation is similar: the few experimental data sets that are available and adequate for an evaluation nefedov ; boytsov ; starostov ; starostov89 ; lajtai ; staples1995 ; knitter75 ; lestone2014 ; chatillon ; noda2011 are often not in agreement within quoted uncertainties neudecker2016 ; capote2016 ; neudecker2018 . Moreover, there are large gaps in the experimental data for important parts of the outgoing-neutron spectra, i.e., below MeV and above MeV. These two regions of the PFNS are particularly challenging because of technical limitations (detection efficiency at low outgoing-neutron energy and statistics at high energy). The high activity of the 239Pu isotope makes the measurement even more challenging to carry out.
Due to these deficiencies in experimental data, evaluated data files partially rely on models to predict the spectra. However, despite the considerable progresses in recent years, microscopic models are not yet able to precisely predict the fission observables, and in particular PFN spectra, because of the complex physical processes associated with the prompt emission of neutrons from fission of actinides. Phenomenological models, mainly based on the Madland-Nix approach madland_LosAlamosModel1 , are then used to evaluate PFN spectra in the libraries. These models rely on parameters, tuned as best fits to the measured PFN spectra. However, it has been suggested that significant systematic errors could be present in the evaluated libraries, leading to a too hard PFNS chadwick2011 . In particular, according to Ref. maslov2011 , the PFN spectra of major actinides should have more neutrons below MeV and fewer neutrons above about MeV outgoing-neutron energies. Recently developed Monte Carlo Hauser-Feshbach models talou2011 ; freya ; fifrelin point to the same direction. For the fast-neutron induced 239Pu() reaction, recent data from Lestone and Chatillon lestone2014 ; chatillon ; noda2011 support current PFNS evaluations for outgoing energies between and MeV, and and MeV, respectively. But these data do not rule out the ideas proposed in Ref. maslov2011 that there should be more prompt fission neutrons below 1 MeV and fewer above MeV.
The open question on the high-energy tail of the spectrum has important implications also on the understanding of the fission process. Indeed, this part of the spectrum is very sensitive to the total excitation energy sharing at scission: the spectrum gets harder at higher excitation energy. While in the original Madland-Nix model madland_LosAlamosModel1 ; madland_LosAlamosModel2 a thermal equilibrium between the two nascent fragments at scission is assumed, a recent model karlheinz2010 ; karlheinz2011 ; karlheinz2011_2 describes the fission process with a constant temperature level density, where each nascent fragment would be characterised by a temperature only dependent on the mass number of the fragment. This model naturally leads to an unexpected partitioning of the excitation energy when increasing the incoming neutron energy karlheinz2010 , which would affect the high-energy tail of the spectrum.
Our group has been involved since the 2000’s in PFNS measurements ethvignot ; noda2011 ; chatillon ; taiebProc ; keegan_Pu , in the framework of a collaboration agreement between the US Department of Energy - National Nuclear Security Administration (DOE/NNSA) and the French Commissariat à l’énergie atomique et aux énergies alternatives - Direction des applications militaires (CEA-DAM). First experiments on PFN spectra of 239Pu() were carried out in 2007 and 2008 noda2011 ; chatillon . Since then special efforts in the development of a new experimental area devlin2018 , new detectors, and data collection procedures were made with the aim of improving the measured PFNS accuracy and precision. In particular, a new fission chamber was developed, with a fission fragment detection efficiency better than , despite the high -activity of the sample. Such a feature is crucial to avoid any bias of the data associated to a particular range in angle or total kinetic energy. In this work, we present the results of the 239Pu() PFNS measurements performed in 2017 at the Los Alamos National Laboratory (LANL). The goals of this experiment are: (i) to significantly improve the experimental accuracy of the measured PFNS, in particular in the low- and high-energy tails of the spectrum, in the to MeV incident neutron energy range; (ii) to produce PFNS data as a function of incident-neutron energy, for which few experimental data exist to date, (iii) to provide an independent measurement of emitted-neutron mean kinetic energy as a function of incident-neutron energies with high accuracy.
II Experimental setup
The experiment was carried out at the WNR facility wnr1 ; wnr at Los Alamos National Laboratory. A white pulsed neutron beam, spanning an energy range from below MeV to several hundreds of MeV, is produced by MeV proton-induced spallation reactions on a tungsten target. The beam is delivered in s-long macropulses with an average frequency varying between and Hz. Each macropulse contains micropulses separated by s. A -borated, cm-thick polyethylene absorber is placed into the beam line to harden the spectra in order to reduce the so-called wrap-around effect, i.e., to minimize the number of slow neutrons (keV) reaching the fission target at the same time or after the fastest neutrons of the following pulse. The neutron beam is collimated along a flight path of about m before impinging onto the 239Pu fission target. A beam pipe right upstream from the experimental hall was placed under vacuum to limit neutron scattering on air.
Data were taken for 20 days of effective time with a fission rate of s-1.
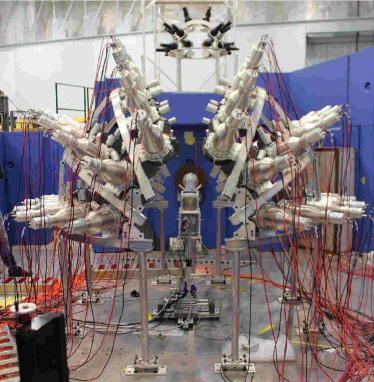
The experimental setup (Fig. 1) couples the Chi-Nu liquid scintillator array chinu to a newly developed fission chamber and a digital data acquisition system. The detectors are placed over a get-lost pit to minimize the amount of scattered neutrons on surrounding materials (see Sec. III.3).
II.1 Fission chamber
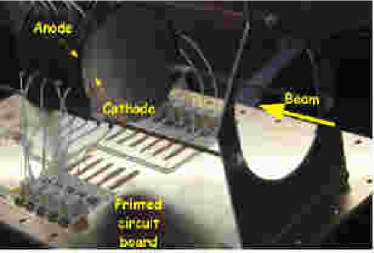
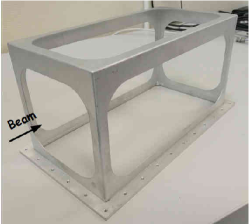
The multi-plate fission chamber (Fig. 2) was designed to contain mg of 239Pu arranged in deposits and readout channels. The fissile material was deposited on every cathode, located mm away from its corresponding anode. The diameter of each deposit was mm and the isotopic purity of the material . The chamber, filled with CF4 gas to ensure a fast charge collection, operates mbar above the local atmospheric pressure. This allows for a reduction in the amount of structural material, as shown in Fig. 3, thereby minimizing the neutron scattering both for the incoming neutron beam and for the emitted fission neutrons (see Sec. III.3). A more detailed description of the detector can be found in taieb .
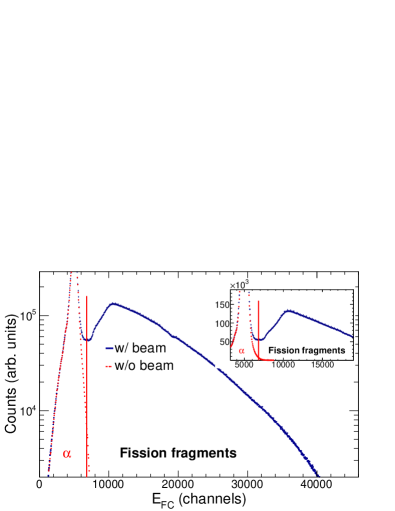
Front-end electronic boards containing pre-amplifiers and shapers were developed to match the detector characteristics. Thanks to the detector and electronics design, an improved -fission fragment discrimination could be obtained, with a fission detection efficiency better than , despite approximately MBq activity per channel budtz . Two pulse height spectra (shown in Fig. 4) measured during the experiment with (in blue) and without (in red) beam illustrate the discrimination obtained. A time resolution better than ns full width at half maximum (FWHM) could be achieved. This leads to an emitted-neutron time-of-flight resolution of about ns (FWHM). The latter arises from summed contribution of the fission chamber and the neutron detector time resolutions.
An identical chamber, containing a 252Cf deposit of the same size as the 239Pu ones, was used for neutron detection efficiency measurements (see Sec. III.2).
For sake of completeness, we mention here that, during the experiment two channels of the Pu fission chamber were not working. Those are the third and the seventh channels. This does not introduce any significant bias in the experimental results, since the interaction probabilities of and MeV fission neutrons with the material supporting each deposit are and , respectively. In other words, the stack of 239Pu deposits is equivalent to a single deposit, with the advantage of a thin deposit, i.e., allowing the recoil of fission fragments out of the target.
II.2 Neutron detection array
The Chi-Nu neutron detector array chinu was used to measure neutrons in coincidence with a fission chamber signal. The Chi-Nu high-energy array consists of 54 EJ-309 liquid scintillator cells, read by photomultipliers, and arranged on a hemisphere with inner radius of about m around the fission chamber, as shown in Fig. 1. The diameter and the thickness of each cell are and cm, respectively. The whole array covers close to of the solid angle. The detectors are placed at nine different angles, with detectors per angle, , from to , with respect to the beam axis. The angular distribution of the emitted neutrons can therefore be studied. The use of the Chi-Nu array constitutes a significant improvement with respect to previous measurements noda2011 ; chatillon performed with the FIGARO array, due to the higher number of scintillation detectors and the significant reduction of scattering material near the fission chamber and the detector array.
The EJ-309 liquid scintillator is sensitive to both neutrons and -rays. Particle identification was performed via Pulse Shape Discrimination (PSD) technique, which is based on the charge integration of the slow and fast components of the pulse. The neutron- discrimination was optimized adjusting the duration of the time integration windows.
A mm-thick Pb shield was placed in front of each cell to reduce the amount of low energy (keV) -rays, impinging on the cell.
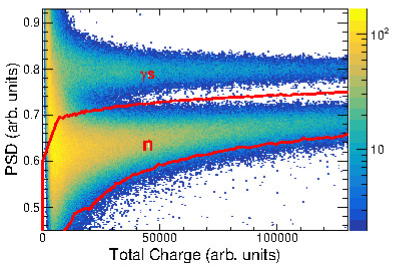
A typical pulse-shape discrimination plot is shown in Fig. 5, where the slow to fast pulse-component ratio (PSD) is plotted as a function of the total pulse charge. The use of the Pb shield allowed us to obtain a clear neutron- discrimination down to keV electron equivalent energy pino2014 .
II.3 Data acquisition system
The digital Fast Acquisition System for nuclEar Research (FASTER) faster was used during the experiment. Signals were digitized by a MHz, 12-bits, low noise Analog to Digital Converter (ADC) and processed by real time numerical modules implemented into Field Programmable Gate Arrays (FPGA). The signal-to-noise ratio, as well as the zero time crossing determination on the Constant Fraction discriminator (CFD) signal, are optimized by limiting the analog bandwidth with the use of an input passive low pass filter (MHz). This allows to obtain a time resolution as low as ps. The use of this acquisition system allowed the near complete avoidance of numerical dead-time. The acquisition was triggered and a coincidence window of s opened when a signal was present in the fission chamber. Signals from the scintillators falling in the coincidence window were recorded.
III Data analysis
The experiment is based on the double time-of-flight technique. For each triggered event, the time of flight of the incoming neutron from the spallation target to the fission chamber and the time of flight of the emitted neutron from the fission chamber to the scintillator were measured. From the measured raw time of flight, the absolute times of flight for incoming and emitted neutrons were determined from the position of the -flash generated by the interaction of the proton beam on the tungsten target and from prompt-fission -rays, respectively. Distances between the fission target and each scintillator cell were carefully measured with an uncertainty better than with a high precision laser range meter. Given the importance of knowing the distance precisely, a careful consistency check of the measured values was performed at the very beginning of the data analysis.
To measure the flight path length from the spallation source to each deposit in the fission chamber, a inch-thick carbon absorber was inserted in the beamline upstream the experimental hall. The positions of the and MeV resonances in the total cross section gave the distances between each deposit of the fission chamber and the spallation target, with an absolute uncertainty of mm over the m flight path.
The combination of the time-of-flight and distance measurements gives us access to the incident and emitted neutron kinetic energies. The obtained relative uncertainty on the incident-neutrons energy is . The uncertainty on the outgoing-neutron energy is dominated by the time-of-flight resolution (ns ).
III.1 Events selection
III.1.1 -fission fragments discrimination
A threshold was set to discriminate fission from -decay and nuclear reaction events in the fission chamber pulse-height spectrum (see Fig. 4). The threshold position is the best compromise between minimizing the contribution of -decay and reaction events and preserving the full fission-fragment total kinetic energy and angular distributions.
III.1.2 -neutron discrimination
Special efforts were made to improve the -neutron discrimination and -ray rejection.
A first selection based on the detected time-of-flight was performed to remove prompt -rays.
An additional selection was placed, for each neutron detector, on the PSD vs total charge correlation, shown in Fig. 5, to remove the remaining -rays.
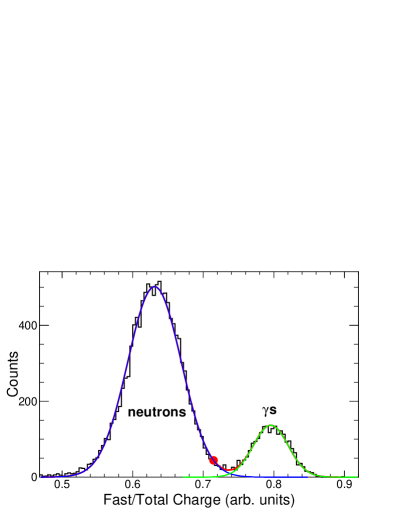
The cut was determined according to the procedure described in Ref. polack : for each total charge interval, the fast to total pulse-component ratio was fitted with two Gaussians, as shown in Fig. 6. This allowed us to define the cut with the same criterion for all the detectors and to estimate the remaining contribution of -rays, which is lower than .
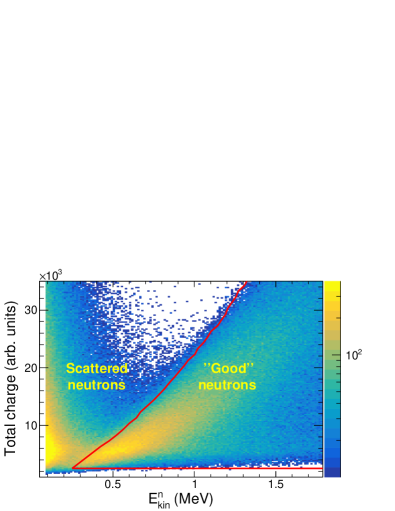
To remove a large fraction of scattered neutrons impinging on the detectors, a light output vs. outgoing-neutron kinetic energy correlation, as shown in Fig. 7, was made. Since a correlation exists between the kinetic energy of the neutron impinging on the scintillator cell and the scintillator light output, only events satisfying this correlation were selected (red contour in Fig. 7).
With these constraints, neutrons down to keV could be identified. As these selections are applied both to the 239Pu and 252Cf PFN spectra analyses as discussed below, possible systematic uncertainties associated to the selections cancel out when correcting the measured 239Pu spectra for the neutron detector efficiency (see Sec. III.2).
III.2 Neutron detector efficiency
Neutron detector efficiencies were obtained by measuring the PFNS of the 252Cf spontaneous fission reaction in the same experimental conditions.
For this purpose, beam-off runs were performed with a dedicated fission chamber containing a 252Cf deposit placed on the central cathode of the chamber. All the structural materials constituting the 239Pu fission chamber were present in the chamber used for the 252Cf measurement. Fission signals triggered the data acquisition. The presence of a single deposit in the Cf chamber, as contrasted to the 11 deposits in the Pu chamber, does not introduce a significant distortion of the measured spectra due to the very low interaction probabilities of fission neutrons with the material supporting each deposit. Moreover the exact distance of each Pu deposit to each neutron detectors was accounted for. The efficiencies were determined from 252Cf spontaneous fission PFNS with respect to the Mannhart evaluated PNFS standard carlson2009 , shown in Fig. 8, normalized to the evaluated standard of () for 252Cf(sf) carlson2018 . An example of the typical relative neutron detection efficiency is shown in Fig. 9. We stress that a threshold as low as keV neutron energy was obtained with the present setup. The counting statistics for the 252Cf(sf) was of fission events, comparable to the one collected for the 239Pu (n,f).
III.3 Scattering corrections
The presence of structural and surrounding materials, and to a lesser extent air, causes the scattering of neutrons distorting the measured PFNS. The whole setup was placed above a m deep “get-lost” pit, the beam pipe upstream from the experimental hall was placed under vacuum, and special efforts were dedicated to the development of the fission chamber with a reduced amount of scattering material (see Sec. II.1 and Fig. 3). Nevertheless, the remaining scattered neutron contributions have to be corrected for.
Scattering of prompt fission neutrons leads to an erroneous determination of their flight path, and thus of their kinetic energy. This contribution is accounted for, at a first order, when correcting the spectra for the detector efficiency. Indeed the efficiency measurement was performed in the same experimental conditions as the real measurement. Moreover, under the reasonable assumption that the 252Cf and 239Pu have similar PFN spectra, the distortions due to the remaining scattering events are compensated for in the efficiency calibration process. This is further discussed in Sec. III.5.
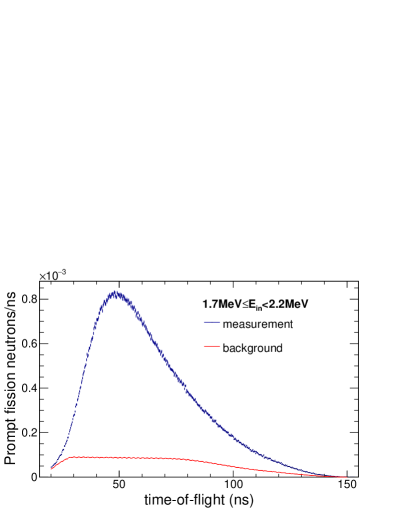
The most significant contribution to spectrum distortion and background comes from neutrons scattered from the incident neutron beam and introduces a significant background in the PFNS. This background is not correlated with fission events, thus creating random coincidences in neutron detectors, and its contribution varies with time after the proton burst. A pulser trigger, acting as a fake-fission generator, was used to start the acquisition and record neutron-detector random coincidences during the whole experiment. As the beam was on, the various incident-neutron times-of-flight were randomly sampled and the background monitored as a function of the beam energy. The pulser rate was much higher than the rate of real fissions (fissionss-1), so that the statistical uncertainty associated to the background contribution was times smaller than the statistical uncertainty associated to real fissions. An example of measured fission neutrons and random coincidence times-of-flight is shown in Fig. 10 in blue and red, respectively. It can be noted that for times-of-flight under about and above ns (corresponding to energies of about and MeV, respectively) the difference between the measurement and the background vanishes, validating the correct background measurement and subtraction. Random coincidences were then subtracted offline.
III.4 Extraction of the PFNS
Thanks to the high statistics accumulated during the experiment and the low detection thresholds, PFNS from keV to about MeV could be extracted, the associated PFN observables studied, and their evolution investigated as a function of the incident neutron energy. Data were sorted in eighty-six incident neutron energy bins with energies ranging from to MeV. The bin widths were chosen based on the available statistics and on the incident-neutrons time-of-flight resolution. The bin width was MeV at low incident neutron energies and it increased up to MeV above MeV. The used bin-widths are reported in Table 1.
| Ein range | Ein bin width | Ein range | Ein bin width |
|---|---|---|---|
| (MeV) | (MeV) | (MeV) | (MeV) |
For each detector, time-of-flight spectra were measured for each incident neutron energy bin. The time spectra, corrected for random coincidences, were then converted into energy spectra and corrected for the detection efficiency normalized to the 252Cf(sf) standard. The final spectrum for a given incoming-neutron energy range was finally obtained by combining all the detector spectra. In the following, results are presented with the absolute statistical and systematics error bars, propagated through the data analysis. The systematic uncertainty is the uncertainty on the evaluated 252Cf spectrum. The horizontal bars indicate the width of the emitted neutron energy bin and do not represent an error bar. The chosen variable bin width for the energy spectra is a compromise between a precise shape of the spectrum, enough statistics and the outgoing-neutron time-of-flight resolution.
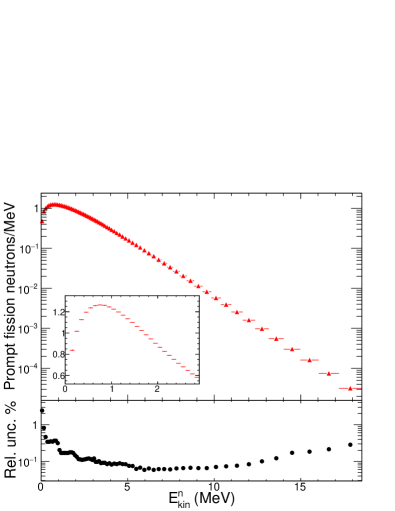
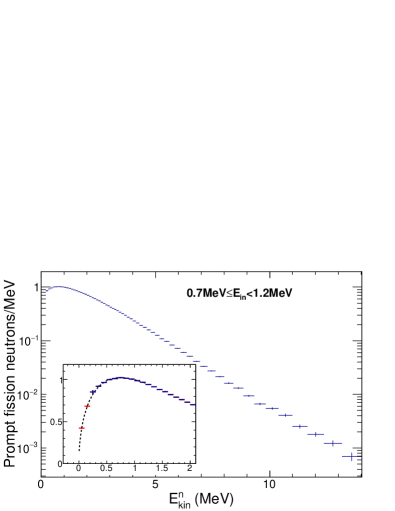
An example of the measured prompt fission neutron spectra is shown in Fig. 11. The spectrum was obtained for an incident neutron energy ranging from to MeV, with a mean energy of MeV. The performances of the setup and the associated electronics chain, and the high collected statistics, allowed PFN spectra to be experimentally measured from MeV to -to-MeV, depending on the incident neutron energy, with total uncertainties from to around MeV and MeV, respectively.
III.4.1 Extrapolation of PFNS at low kinetic energy
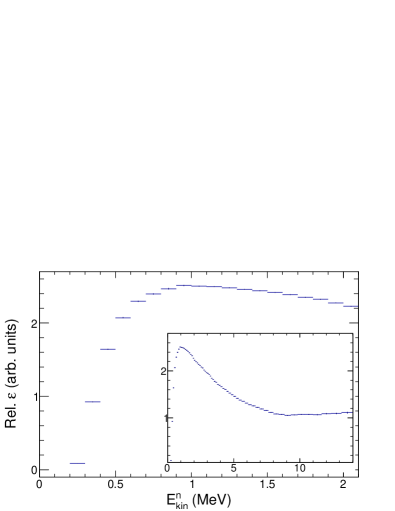
Despite the rather low outgoing-neutron energy threshold, it should be kept in mind that quantities such as the mean kinetic energy of prompt fission neutrons, , are sensitive to the low-energy part of the spectrum. Owing to simple theoretical descriptions of PFNS based on either Watt watt1952 or Maxwellian bloch1943 spectra, the measured spectra were extrapolated at energies from MeV downwards by fitting the low energy part of the spectra with a Watt-type and a Maxwell-type distribution terrell1959 . The Watt-based extrapolation was limited to incident energies below the opening of the second-chance fission, around MeV. The fitting ranges were from to MeV for the two functions. The uncertainties on the extrapolated points at and MeV were given by the uncertainties and covariances on the fit parameters. Consistent results were obtained below MeV incident-neutron energy when using Watt-type and Maxwell-type distributions. This validates the use of a Maxwell-type distribution at energies above MeV. As a test case, the same extrapolation method was applied to identically truncated PFNS generated by the General Description of Fission Observables (GEF) code GEF . The procedure was applied to GEF PFNS from to MeV incident neutron energies. From the comparison of the extrapolated and the full distributions, we observe differences smaller that on the PFN spectra, as well as on the PFN mean kinetic energy, , thus validating the extrapolation method. An example of the result is shown in the insert in Fig. 11, where blue points are experimentally measured and red points are extrapolated. In the following these extrapolated spectra will be used, unless differently specified.
III.5 Study of possible experimental bias
As mentionned neutron distorsion spectra corrections are obtained through the measurement of neutron detection efficiencies with a 252Cf fission chamber (see Sec. III.2). Under the reasonable assumption that the 252Cf PFNS is sufficiently close to the 239Pu, this is justified since the 252Cf and the 239Pu fission chambers are exactly the same. In order to validate it the fission chamber as well as neutron detectors were simulated with the GEANT4 toolkit geant4 using the NPTool package matta . The custom neutron interaction model, MENATER, was used, where the inelastic neutron-carbon and neutron-hydrogen reactions are modeled as discrete reaction channels based on experimental information kohley_menate . The input 252Cf PFNS was assumed to be the evaluated Mannhart’s spectrum carlson2009 , while experimentally measured PFN spectra for incident mean energies of , and MeV were used as input for 239Pu(n,f) PFN spectra. Fifty million events were generated and the simulated 252Cf(s.f.) and 239Pu(n,f) PFN spectra extracted. The detector efficiencies and the 239Pu spectra were determined following the same procedure as for the experimental data.
The influence of the neutron detector and of the fission chamber materials were studied separately. The biggest distortion to the 239Pu(n,f) PFN spectra comes from neutron scattering on the neutron detector materials. It is of about and is observed at the opening of the second-chance fission for an outgoing neutron energy below keV. In the other region of the spectrum and for other incident neutron energies the distortion is negligible. A negligible distortion is also introduced by the presence of the fission chamber, as well as by two not working channels of the chamber itself (see Sec. II.1).
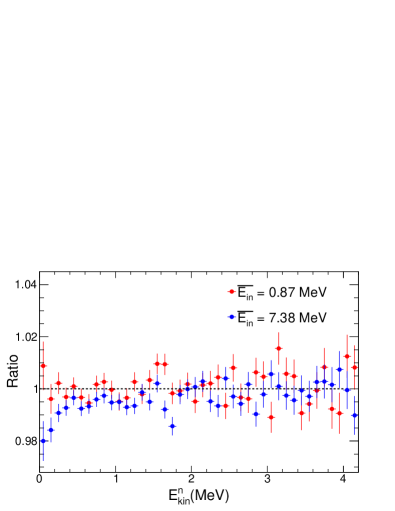
To validate the assumption that the 252Cf PFNS is sufficiently close to the 239Pu, the possible systematic bias introduced by the use of the 252Cf(s.f.) PFN spectra to determine the detector efficiencies were investigated. As an example, the ratios between the 239Pu(n,f) PFN spectrum determined as in the data analysis and the PFN spectrum used as input in the simulation are plotted in Fig.12 for and MeV incident neutron energies. The dashed line has the purpose of guiding the eyes. A very good agreement is found for all the outgoing neutron energies for MeV incident neutron energy, and, more in general, for incident neutron energies significantly different from the opening of the -th chance fission. Indeed it is around this energy that a significant distortion is observed for outgoing-neutron energies below MeV.
These results support the use of the 252Cf PFNS to account for the presence of surrounding materials and to determine the detector efficiencies, and indicate that it does not bias the experimental results.
III.6 Study of wrap-around background
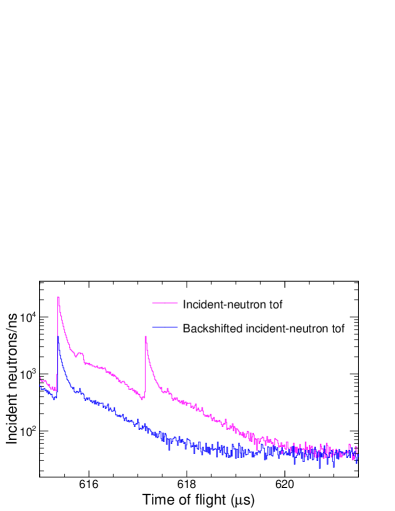
As discussed in Sec. II, due to the short micropulse spacing (s) and the long neutron flight-path (m), neutron time-of-flight distributions are affected by the so-called wrap-around background. Indeed slow neutrons (keV) remaining after the polyethylene absorber reach the fission target at the same time or after the fastest neutrons of the following micropulse. Fission events induced by high-energy neutrons and low-energy neutron background can not be discriminated on time-of-flight basis. The fraction of wrap-around background in each incident neutron energy bin was estimated using data collected with a different DAQ, where the time of flight of neutrons belonging to the same macropulse are all stored keegan . This allows one to inspect seperately fission events associated to each micropulse in a macropulse. The last micropulse was considered. Indeed in this case, being two macropulses separated by about s, the slow neutrons do not overlap with the fastest neutrons of the following micropulse, and their time of flight can be cleanly characterized. This is clearly illustrated in Fig. 13 with the time spectrum of the incident neutron, in pink, which represents the last two micropulses of a macropulse.
A good agreement was found between the incident-neutron time of flight measured in our experiment and the time of flight of incident neutrons belonging to the last micropulse measured in keegan , with the appropriate normalization.
Hence these events can be use to determine the proportion of wrapped neutrons in the other micropulses.
The time-of-fligh spectrum of the last micropulse was backshifted of (blue line in Fig. 13). The backshifted-to-last micropulse time-of-flight ratio gives the fraction of slow neutron background present in each incident neutron energy bin.
The wrap-around contribution varies from a maximum of about to about below MeV and above MeV, respectively. The associated relative uncertainty varies from to few as the incident neutron energy increases, due to the statistics available in the used data.
It is worth recalling that slow neutrons giving rise to the wrap-around effect have energies keV. The PFN spectra for these incident neutron energies were not measured during the experiment. However, under the reasonable assumption that PFN spectra for incident neutron energies below MeV vary slowly, the PFN spectrum measured for an incident neutron energy ranging from to MeV was used to correct PFN spectra for higher incident energies. It is worth noting that this introduces a correlation between all the PFN spectra. The uncertainties on the to MeV incident energy PFN spectrum as well as on the wrap-around fraction were propagated to obtain wrap-around-corrected PFN spectra for all the incident energy bins.
In the following we will refer to these wrap-around corrected spectra as “spectra” and they will be used to calculate the quantities of interest, unless differently specified.
IV Results
IV.1 PFNS
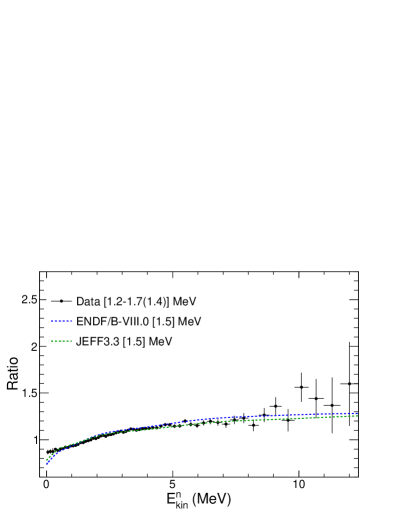
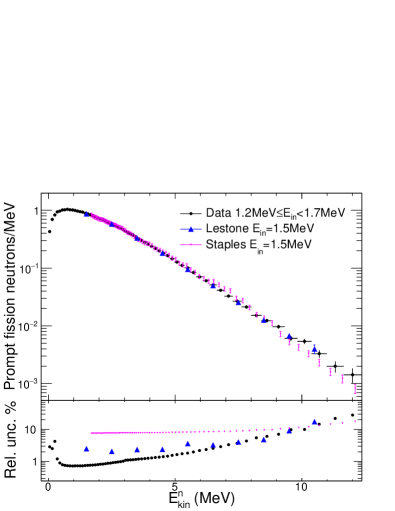
The PFNS measured for an average incident-neutron energy of MeV is presented in Fig. 14 and compared to data from Lestone et al. lestone2014 and Staples et al. staples1995 for MeV incident energy. The ratio of the PFN spectrum to a Maxwellian distribution with temperature MeV is provided as supplemental material (Fig.LABEL:fig:ratio_to_maxwell_lestone_staples). Our data are in very good agreement within the error bars with data from Lestone on the whole outgoing-energy range. It should be noted that results from Lestone were obtained from underground nuclear explosion measurements, with a much higher neutron flux on the studied sample. A very good agreement is found also with data from Staples, with small discrepancies above about MeV, due to a change in the slope around MeV, which leads to a slightly softer spectrum. Similar conclusions can be drawn when comparing the spectrum measured at MeV, provided as supplemental material, with the one measured by Staples.
In the lower panel of Fig. 14 the relative uncertainty on the spectrum is presented (black circles). This is a typical example of the attained accuracy in the measurement for the smallest incident energy bins (MeV bin width): between and MeV the uncertainty is smaller than , it stays below up to MeV and it is less than up to about MeV. These values have to be compared to the uncertainties obtained by Lestone, which vary from to between and MeV, and to those measured by Staples, which are around on the whole outgoing-energy range.
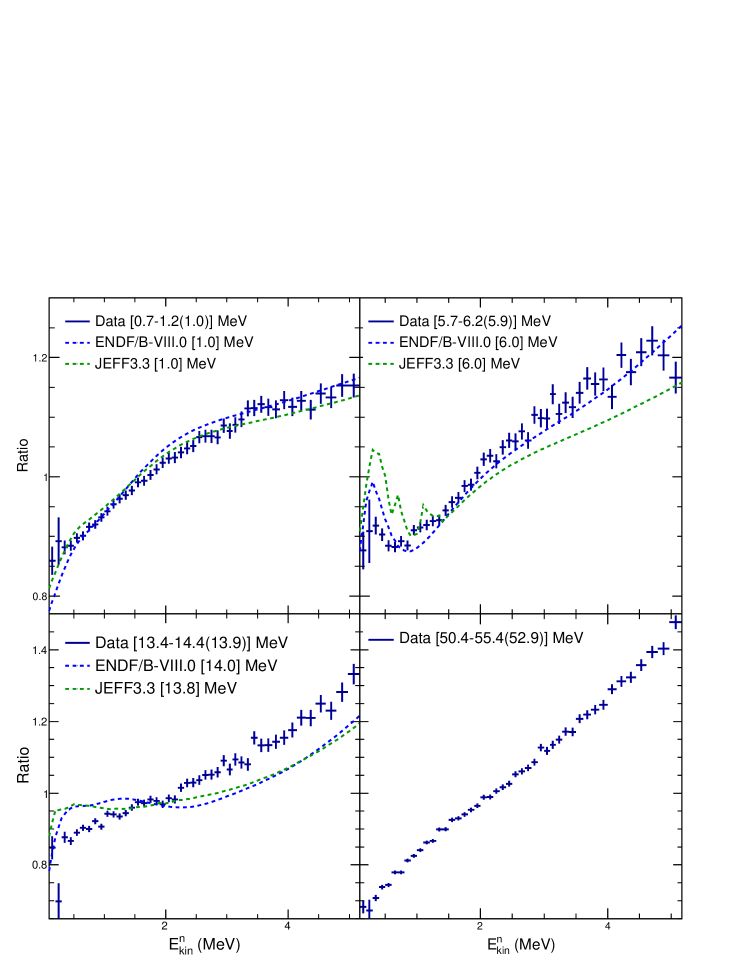
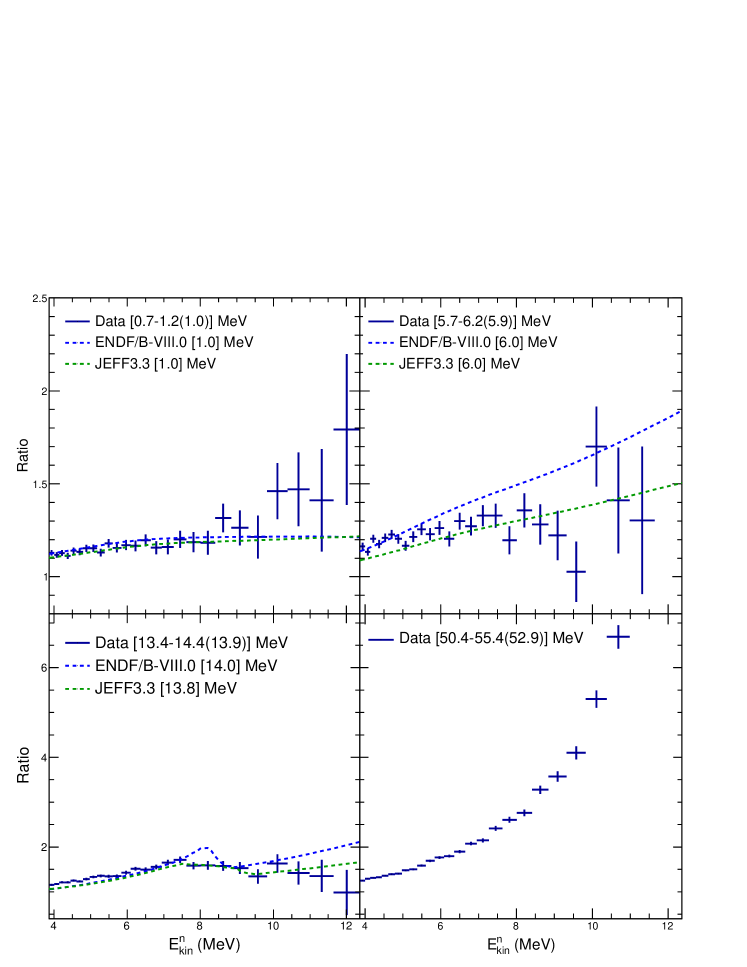
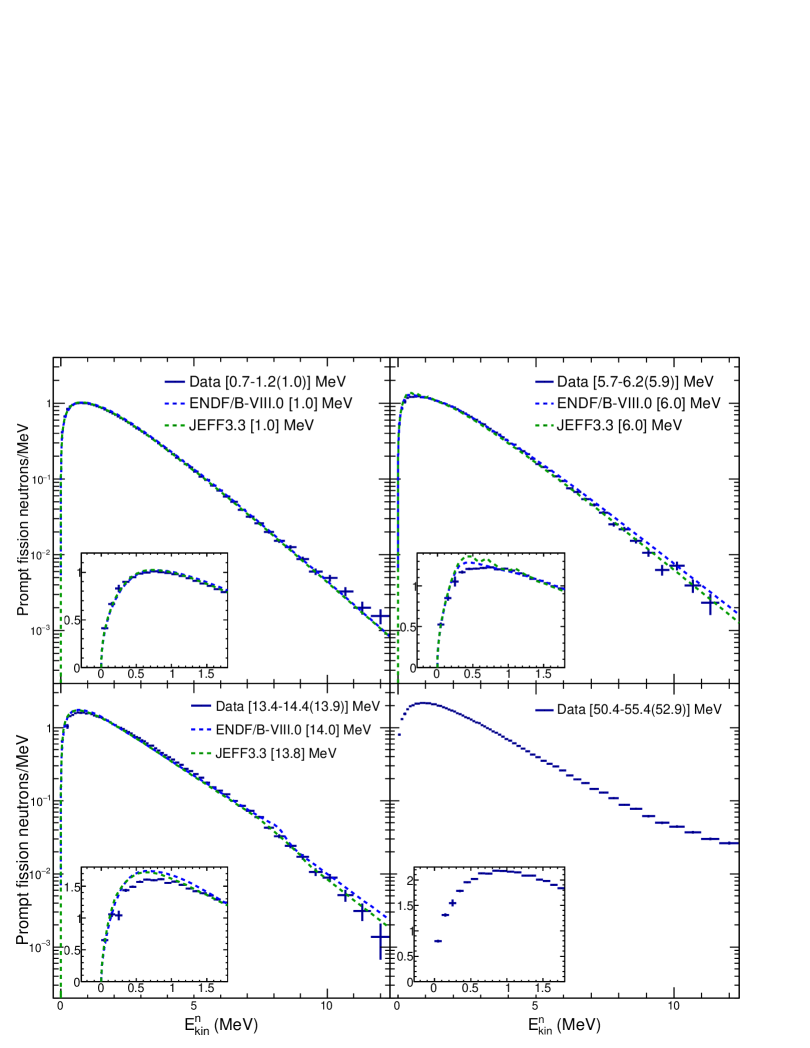
Figure 15 shows spectra for four incident neutron energy bins, compared to the ENDF/B-VIII.0 endf8 ; endf8_pfns and JEFF3.3 JEFF33 evaluations. Spectra for the other energy bins are provided as supplemental material. All the spectra are normalized to the integral of the PFNS on the whole energy range (i.e., to the experimental neutron multiplicity). Overall, a fair agreement is observed between the data and the evaluations. Slight discrepancies are found for the low- (MeV) and high-energy tails (MeV) of the spectra, depending on the incident neutron energy. We concentrate here on outgoing-neutron kinetic energies above MeV. For spectra up to the opening of the second-chance fission (MeV), a rather good agreement is observed between the data and the evaluations. For energies above the second chance fission, a better agreement is observed at high kinetic energy with the JEFF3.3 evaluation, while ENDF/B-VIII.0 predicts harder spectrum (a higher number of high-energy fission neutrons). Data indicate that both the evaluations predict harder spectra for energies above MeV.
Figures 16, 17 and 18 show the ratio of PFN spectra to a Maxwellian distribution with temperature MeV for five incident-neutron energy bins, compared to ENDF/B-VIII.0 and JEFF3.3 evaluations. In Fig. 17 only emitted neutrons with kinetic energies below MeV are shown, to focus the attention on the low-energy part of the spectra. On the contrary Fig. 18 focuses on the high-energy part of the spectra. The spectra, as well as the evaluations, were normalized to the integral of the PFN spectra on the whole energy range. For spectra up to MeV incident-neutron energy, predictions seem to underestimate the amount of fission neutrons below keV, while a better agreement is found for higher incident energies. The situation changes for energies around the opening of the second-, third and forth-chance fission (, and MeV, respectively), where discrepancies are observed for outgoing energies below MeV.
IV.2 PFN mean kinetic energy
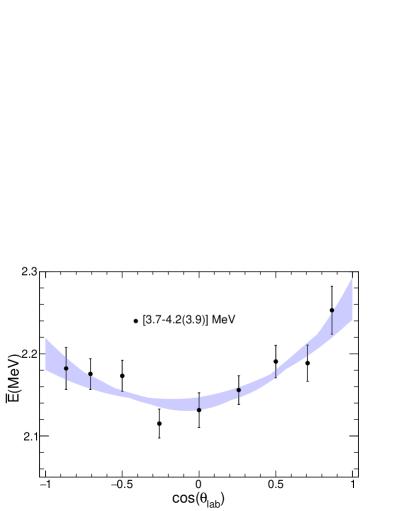
The high statistics accumulated during the experiment and the Chi-Nu segmentation allows us to obtain a precise shape of the PFNS as a function of the neutron emission angle with respect to the beam direction () for each incident-neutron energy range studied. Nine spectra, one for each measured , were therefore obtained by combining the spectra obtained from the six detectors at the considered angle. The average neutron kinetic energy, , was computed from the spectra for every and incident energy bin. No threshold was applied. An example of angular dependence of , , is plotted in Fig. 19 for an incident neutron energy ranging from to MeV. The total uncertainty on is close to %. It includes the statistical uncertainties on the 239Pu and 252Cf measurements, on their background measurements and on the wrap-around correction. The systematic uncertainty encompasses the uncertainty of the evaluated 252Cf(s.f.) PFN spectra. We remind that the associated correlation matrix was not propagated. The angular distributions exhibit two main characteristics: first, they are not isotropic, even at low incident energies, with a of about below MeV. The anisotropy arises from the fact that PFN carry angular momentum from fully accelerated fission fragments. Information on fission fragments angular momentum at scission could therefore be extracted by model comparison, which is beyond the scope of this paper. Second, angular distributions are characterized by a certain degree of forward/backward asymmetry which increases with the incident-neutron energy, reflecting the increase in the kinematical boost and pre-equilibrium emission.
The experimentally measured mean kinetic energy angular distributions were also needed in the determination of the average neutron for each incident neutron energy range. They were fitted with polynomial functions and was taken as the sum of the experimental values and the values deduced from the fitted distribution, for those angles that were not covered by detectors during the experiment. Several different fitting functions were tested to estimate the systematic uncertainty on due to the arbitrary choice of the functions. It amounts to about and was calculated as the root-mean-square of the values obtained with the different fitting functions for each incident neutron energy. The envelop of the different fitting functions used is shown as shaded area in Fig.19. The total uncertainty is estimated to be between and depending on the incident neutron energy bin.
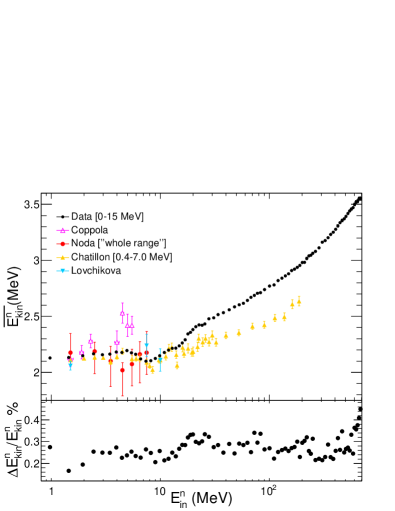
The obtained values are plotted in Fig. 20 as a function of the kinetic energy of the incoming neutron. All available other experimental results are also plotted on the same graph Coppola1970 ; noda2011 ; chatillon ; Lovchikova1996 . The mean kinetic energy of the emitted neutrons increases rather slowly over the full energy range, spanning from to MeV. Above MeV, we observe a slower increase of the kinetic energy, while fluctuations are observed below this energy. A clear dip of about keV depth is observed around MeV, and described with 8 experimental data points between and MeV. Smaller second and third dips are observed around and MeV, as reported also in chatillon . The presence of these dips is due to pre-fission neutrons emitted at the opening of the second- (third- and fourth-) chance fission. Indeed pre-fission neutrons, evaporated from the compound nucleus before fissioning, have smaller kinetic energy than fission neutrons, since they do not profit from the kinematical boost from fission fragments.
A good agreement with the most recent data chatillon is found up to MeV. At higher energy, where pre-equilibrium reactions set in, the discrepancy is explained by the fact that the setup used in Ref. chatillon is most sensitive to lower energy evaporation neutrons and not to the higher energy neutrons emitted in the forward direction. A fair agreement is observed also with data from Refs.Lovchikova1996 ; noda2011 , which present large error bars. Our data are not consistent with data from Ref. Coppola1970 .
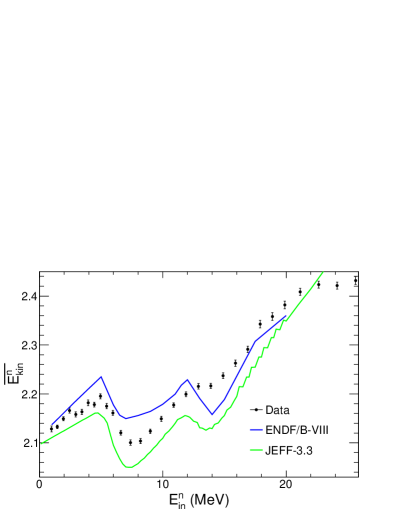
Figure 21 shows the comparison of our data to ENDF/B-VIII.0 and JEFF3.3 evaluations. Below the opening of the second-chance fission the JEFF3.3 evaluation reproduce the trend of , although the values are slightly underestimated. On the contrary ENDF/B-VIII.0 indicates a steeper increase of with increasing the neutron energy, which is not observed in the data. Above MeV JEFF3.3, and to a lesser extent ENDF/B-VIII.0 , reproduce the dip depth, although they are not consistent with the experimental values. Both evaluations indicate the presence of a second dip around MeV, whose depth is much less pronounced in the experimental data than in the evaluations. It appears that all evaluations either underestimate (JEFF3.3 ) or overestimate the second and third chance fission probability in 239Pu (). These features notably impact the PFNS and the mean neutron energy. None of the evaluations is in agreement with the measured data.
V Conclusions
Prompt fission neutron spectra from to MeV outgoing-neutron energy were measured with respect to 252Cf spontaneous fission with the Chi-Nu liquid scintillator array for incident neutron energies from to MeV. The obtained final uncertainties are well below for outgoing-neutron energies up to MeV, and lower than the ones from all previous measurements.
In general, the data agree well with theoretical predictions based on the Los Alamos model, ENDF/B-VIII.0 and JEFF3.3, from to about MeV outgoing-neutron energies.
Below about MeV incident energy, evaluations underestimate
the number of low-energy neutrons (keV) and significant discrepancies are observed below outgoing energies of MeV around the opening of the second-, third- and forth-chance fission.
Above MeV incident energy, a better agreement is found at high kinetic energy with the JEFF3.3 evaluation.
The mean energy of the PFNS was measured with a total uncertainty better than for all incident neutron energies and shows a continuous increase with the beam energy. Signatures of the opening of the second- third- and fourth-chance fissions can be recognized around , and MeV. A good agreement is found with previous data from Ref. chatillon up to the onset of pre-equilibrium reactions, around MeV. The shape, but not the measured values, is better reproduced by the JEFF3.3 evaluation.
The obtained accuracies were made possible thanks to a newly developed fission chamber with a detection efficiency close to , its associated electronics, the high statistics collected and the Chi-Nu segmentation and neutron/ discrimination capabilities.
Given the success of the present experiment, further measurements should be performed to provide more accurate PFNS data than those available at present on other relevant actinides.
Acknowledgments
We wish to acknowledge A. Moens, G. Sibbens and D. Vanleeuw from the JRC-Geel target preparation laboratory for providing 239Pu samples and assisting their mounting in the fission chamber. We also wish to acknowledge the support of E. Bond from LANL C-NR for providing the 252Cf sample. This work was performed under the auspices of a cooperation agreement between CEA/DAM and DOE/NNSA on fundamental sciences and benefited from the use of the LANSCE accelerator facility. The work at Los Alamos was performed under the auspices of the U.S. Department of Energy by Los Alamos National Laboratory under Contract DE-AC52-06NA25396.
References
- [1] Y. Peneliau, O. Litaize, P. Archier, and C. De Saint Jean. Nucl. Data Sheets, 118:459 – 462, 2014.
- [2] R. Capote, V. Maslov, E. Bauge, T. Ohsawa, A. Vorobyev, M.B. Chadwick, and S. Oberstedt. Report consultants’ meeting on prompt fission neutron spectra. Technical report, Vienna, INDC(NDS) 0541, 2008.
- [3] D. Neudecker, T.N. Taddeucci, R.C. Haight, H.Y. Lee, M.C. White, and M.E. Rising. Nucl. Data Sheets, 131:289 – 318, 2016.
- [4] V. N. Nefedov, B. I. Starostov, and A. A. Boytsov. Precision measurements of , , and prompt fission neutron spectra (PFNS) in the energy range 0.04-5 MeV. In IAEA Vienna Report INDC(CCP)-0457 (2014), translation into English from: Proceedings of the All-Union Conf. on Neutron Physics, Kiev, 2-6 Oct. 1983 2, 285 (1983) (in Russian), EXFOR-No. 40871.
- [5] A. A. Boytsov, A. F. Semenov, and B. I. Starostov. Relative measurements of +, + and + prompt fission neutron spectra (PFNS) in the energy range 0.01-5 MeV. In IAEA Vienna Report INDC(CCP)-0459 (2014), translation into English from: Proceedings of the All-Union Conf. on Neutron Physics, Kiev, 2-6 Oct. 1983 2, 294 (1983) (in Russian), EXFOR-No. 40873.
- [6] B. I. Starostov, V. N. Nefedov, and A. A. Boytsov. Precision measurements of f, +, + and + prompt fission neutron spectra (PFNS) in the energy range 2-11 MeV. In IAEA Vienna Report INDC(CCP)-0458 (2014), translation into English from: Proceedings of the All-Union Conf. on Neutron Physics, Kiev, 2-6 Oct. 1983 2, 290 (1983) (in Russian), EXFOR-No. 40872.
- [7] B. I. Starostov, V. N. Nefedov, and A. A. Bojtsov. Prompt neutron spectra from fission of , and by thermal neutrons and from spontaneous fission of f in the 0.01-12 MeV energy range. In IAEA Vienna Report INDC(CCP)-293/L, p.19-32 (1989), translation into English from: Yadernye Konstanty 1985, 16 (1985) (in Russian), EXFOR-No. 40930.
- [8] A. Lajtai, J. Kecskeméti, J. Sáfár, P. P. Dyachenko, and V. M. Piksaikin. Energy Spectrum Measurements of Neutrons for Energies 30 keV-4 MeV from Thermal Fission of Main Fuel Elements. In Proceedings of the Conf. on Nuclear Data for Basic and Applied Sciences, Santa Fe 1985 1, 613 (1985), EXFOR-No. 30704.
- [9] P. Staples, J. J. Egan, G. H. R. Kegel, A. Mittler, and M. L. Woodring. Nucl. Phys. A, 591:41 – 60, 1995. EXFOR-No. 13982.
- [10] H. H. Knitter. Atomkernenergie, 26:76, 1975. EXFOR-No. 20576.
- [11] J. P. Lestone and E. F. Shores. Nucl. Data Sheets, 119:213 – 216, 2014.
- [12] A. Chatillon, G. Bélier, T. Granier, B. Laurent, B. Morillon, J. Taieb, R. C. Haight, M. Devlin, R. O. Nelson, S. Noda, and J. M. O’Donnell. Phys. Rev. C, 89:014611, 2014.
- [13] S. Noda, R. C. Haight, R. O. Nelson, M. Devlin, J. M. O’Donnell, A. Chatillon, T. Granier, G. Bélier, J. Taieb, T. Kawano, and P. Talou. Phys. Rev. C, 83:034604, 2011.
- [14] R. Capote, Y.-J. Chen, F.-J. Hambsch, N.V. Kornilov, J. P. Lestone, O. Litaize, B. Morillon, D. Neudecker, S. Oberstedt, T. Ohsawa, N. Otuka, V.G. Pronyaev, A. Saxena, O. Serot, O.A. Shcherbakov, N.-C. Shu, D. L. Smith, P. Talou, A. Trkov, A. C. Tudora, R. Vogt, and A. S. Vorobyev. Nucl. Data Sheets, 131:1 – 106, 2016.
- [15] D. Neudecker, P. Talou, T. Kawano, A.C. Kahler, M.C. White, T.N. Taddeucci, R.C. Haight, B. Kiedrowski, J.M. O’Donnell, J.A. Gomez, K.J. Kelly, M. Devlin, and M.E. Rising. Nucl. Data Sheets, 148:293, 2018.
- [16] D. G. Madland and J. Rayford Nix. Nucl. Sci. Eng., 81:213–271, 1982.
- [17] M.B. Chadwick, M. Herman, P. Obložinský, M. E. Dunn, Y. Danon, A. C. Kahler, D. L. Smith, B. Pritychenko, G. Arbanas, R. Arcilla, R. Brewer, D. A. Brown, R. Capote, A. D. Carlson, Y.S. Cho, H. Derrien, K. Guber, G.M. Hale, S. Hoblit, S. Holloway, T.D. Johnson, T. Kawano, B.C. Kiedrowski, H. Kim, S. Kunieda, N.M. Larson, L. Leal, J. P. Lestone, R. C. Little, E.A. McCutchan, R.E. MacFarlane, M. MacInnes, C.M. Mattoon, R.D. McKnight, S.F. Mughabghab, G.P.A. Nobre, G. Palmiotti, A. Palumbo, M.T. Pigni, V.G. Pronyaev, R.O. Sayer, A.A. Sonzogni, N.C. Summers, P. Talou, I.J. Thompson, A. Trkov, R.L. Vogt, S.C. van der Marck, A. Wallner, M.C. White, D. Wiarda, and P.G. Young. Nucl. Data Sheets, 112:2887 – 2996, 2011.
- [18] V. M. Maslov, N. A. Tetereva, V. G. Pronyaev, A. B. Kagalenko, K. I. Zolotarev, R. Capote, T. Granier, B. Morillon, F.-J. Hambsch, and J.-C. Sublet. J. Korean Phy. Soc., 59:1337, 2011.
- [19] P. Talou, B. Becker, T. Kawano, M. B. Chadwick, and Y. Danon. Phys. Rev. C, 83:064612, 2011.
- [20] J. Randrup and R. Vogt. Phys. Rev. C, 80:024601, 2009.
- [21] O. Litaize and O. Serot. Phys. Rev. C, 82:054616, 2010.
- [22] D. G. Madland. Acta Phys. Hungaria New Ser. Heavy Ion Phys., 10:231, 1999.
- [23] K.-H. Schmidt and B. Jurado. Phys. Rev. Lett., 104:212501, 2010.
- [24] K.-H. Schmidt and B. Jurado. Phys. Rev. C, 83:014607, 2011.
- [25] K.-H. Schmidt and B. Jurado. Phys. Rev. C, 83:061601(R), 2011.
- [26] T. Ethvignot, M. Devlin, R. Drosg, T. Granier, R.C. Haight, B. Morillon, R.O. Nelson, J.M. O’Donnell, and D. Rochman. Phys. Lett. B, 575:221 – 228, 2003.
- [27] J. Taieb, T. Granier, T. Ethvignot, M. Devlin, R.C. Haight, R.O. Nelson, J.M. O’Donnell, and D. Rochman. In Proceedings of the International Conference on Nuclear Data for Science and Technology, page 429, 2007.
- [28] K. J. Kelly et al. to be submitted to Phys. Rev. C.
- [29] M. Devlin, J.A. Gomez, K.J. Kelly, R.C. Haight, J.M. O’Donnell, T.N. Taddeucci, H.Y. Lee, S.M. Mosby, B.A. Perdue, N. Fotiades, J.L. Ullmann, C.Y. Wu, B. Bucher, M.Q. Buckner, R.A. Henderson, D. Neudecker, M.C. White, P. Talou, M.E. Rising, and C.J. Solomon. Nuclear Data Sheets, 148:322, 2018.
- [30] P. W. Lisowski, C. D. Bowman, G. J. Russell, and S. A. Wender. Nucl. Sci. Eng., 106:208, 1990.
- [31] P. W. Lisowski and K. F. Schoenberg. Nucl. Instrum. Methods Phys. Res., Sect. A, 562:910 – 914, 2006.
- [32] J. Taieb, B. Laurent, G. Bélier, A. Sardet, and C. Varignon. Nucl. Instrum. Methods Phys. Res., Sect. A, 833:1 – 7, 2016. Patent pending for the anode concept.
- [33] R. C. Haight, H. Y. Lee, T. N. Taddeucci, J. M. O’Donnell, B. A. Perdue, N. Fotiades, M. Devlin, J. L. Ullmann, A. Laptev, T. Bredeweg, M. Jandel, R. O. Nelson, S. A. Wender, M. C. White, C. Y. Wu, E. Kwan, A. Chyzh, R. Henderson, and J. Gostic. J. Inst., 7:C03028, 2012.
- [34] C. Budtz-Jørgensen and H.-H. Knitter. Investigation of fission layers for precise fission cross-section measurements with a gridded ionization chamber. Nuclear Science and Engineering, 86(1):10–21, 1984.
- [35] F. Pino, L. Stevanato, D Cester, G. Nebbia, L. Sajo-Bohus, and G. Viesti. Appl. Radiat. Isot., 89:79 – 84, 2014.
- [36] FASTER. LPC-Caen http://faster.in2p3.fr, 2013.
- [37] J. K. Polack, M. Flaska, A. Enqvist, C. S. Sosa, C. C. Lawrence, and S. A. Pozzi. Nucl. Instrum. Methods Phys. Res., Sect. A, 795:253 – 267, 2015.
- [38] A. D. Carlson, V. G. Pronyaev, D. L. Smith, N. M. Larson, Zhenpeng Chen, G. M. Hale, F.-J. Hambsch, E. V. Gai, Soo-Youl Oh, S. A. Badikov, T. Kawano, H. M. Hofmann, H. Vonach, and S. Tagesen. Nucl. Data Sheets, 110:3215 – 3324, 2009.
- [39] A. D. Carlson, V. G. Pronyaev, R. Capote, G. M. Hale, Z.-P. Chen, I. Duran, F.-J. Hambsch, S. Kunieda, W. Mannhart, B. Marcinkevicius, R. O. Nelson, D. Neudecker, G. Noguere, M. Paris, S. P. Simakov, P. Schillebeeckx, D. L. Smith, X. Tao, A. Trkov, A. Wallner, and W. Wang. Nucl. Data Sheets, 148:143 – 188, 2018.
- [40] B. E. Watt. Phys. Rev., 87:1037–1041, 1952.
- [41] F. Bloch and H. Staub. U.S. Atomic Energy Commission Document AECD-3158. (as quoted by Terrell in Phys. Rev. 113:527-541, 1959), 1943.
- [42] J. Terrell. Phys. Rev., 113:527–541, 1959.
- [43] K.-H. Schmidt, B. Jurado, C. Amouroux, and C. Schmitt. Nucl. Data Sheets, 131:107 – 221, 2016.
- [44] J. Allison, K. Amako, J. Apostolakis, P. Arce, M. Asai, T. Aso, E. Bagli, A. Bagulya, S. Banerjee, G. Barrand, B.R. Beck, A.G. Bogdanov, D. Brandt, J.M.C. Brown, H. Burkhardt, Ph. Canal, D. Cano-Ott, S. Chauvie, K. Cho, G.A.P. Cirrone, G. Cooperman, M.A. Cortés-Giraldo, G. Cosmo, G. Cuttone, G. Depaola, L. Desorgher, X. Dong, A. Dotti, V.D. Elvira, G. Folger, Z. Francis, A. Galoyan, L. Garnier, M. Gayer, K.L. Genser, V.M. Grichine, S. Guatelli, P. Guèye, P. Gumplinger, A.S. Howard, I. Hřivnáčová, S. Hwang, S. Incerti, A. Ivanchenko, V.N. Ivanchenko, F.W. Jones, S.Y. Jun, P. Kaitaniemi, N. Karakatsanis, M. Karamitros, M. Kelsey, A. Kimura, T. Koi, H. Kurashige, A. Lechner, S.B. Lee, F. Longo, M. Maire, D. Mancusi, A. Mantero, E. Mendoza, B. Morgan, K. Murakami, T. Nikitina, L. Pandola, P. Paprocki, J. Perl, I. Petrović, M.G. Pia, W. Pokorski, J.M. Quesada, M. Raine, M.A. Reis, A. Ribon, A. Ristić Fira, F. Romano, G. Russo, G. Santin, T. Sasaki, D. Sawkey, J.I. Shin, I.I. Strakovsky, A. Taborda, S. Tanaka, B. Tomé, T. Toshito, H.N. Tran, P.R. Truscott, L. Urban, V. Uzhinsky, J.M. Verbeke, M. Verderi, B.L. Wendt, H. Wenzel, D.H. Wright, D.M. Wright, T. Yamashita, J. Yarba, and H. Yoshida. Nuclear Instruments and Methods in Physics Research Section A: Accelerators, Spectrometers, Detectors and Associated Equipment, 835:186 – 225, 2016.
- [45] A. Matta, P. Morfouace, N. de Séréville, F. Flavigny, M. Labiche, and R. Shearman. Jour. of Phys. G: Nucl. and Part. Phys., 43:045113, 2016.
- [46] Z. Kohley, E. Lunderberg, P.A. DeYoung, B.T. Roeder, T. Baumann, G. Christian, S. Mosby, J.K. Smith, J. Snyder, A. Spyrou, and M. Thoennessen. Nucl. Instr. and Meth. in Phys. Res. Sec. A, 682:59, 2012.
- [47] K.J. Kelly, J.A. Gomez, J.M. O’Donnell, M. Devlin, R.C. Haight, T.N. Taddeucci, S.M. Mosby, H.Y. Lee, D. Neudecker, M.C. White, C.Y. Wu, R. Henderson, J. Henderson, M.Q. Buckner, P. Talou, N. Fotiades, M.E. Rising, and C.J. Solomon. In Proceedings of the 20th Topical Meeting of the Radiation Protection and Shielding Division. LA-UR-18-28140 (2018).
- [48] D. A. Brown, M. B. Chadwick, R. Capote, A. C. Kahler, A. Trkov, M. W. Herman, A. A. Sonzogni, Y. Danon, A. D. Carlson, M. Dunn, D. L. Smith, G. M. Hale, G. Arbanas, R. Arcilla, C. R. Bates, B. Beck, B. Becker, F. Brown, R. J. Casperson, J. Conlin, D. E. Cullen, M.-A. Descalle, R. Firestone, T. Gaines, K. H. Guber, A. I. Hawari, J. Holmes, T. D. Johnson, T. Kawano, B. C. Kiedrowski, A. J. Koning, S. Kopecky, L. Leal, J. P. Lestone, C. Lubitz, J. I. Márquez Damián, C. M. Mattoon, E. A. McCutchan, S. Mughabghab, P. Navratil, D. Neudecker, G. P. A. Nobre, G. Noguere, M. Paris, M. T. Pigni, A. J. Plompen, B. Pritychenko, V. G. Pronyaev, D. Roubtsov, D. Rochman, P. Romano, P. Schillebeeckx, S. Simakov, M. Sin, I. Sirakov, B. Sleaford, V. Sobes, E. S. Soukhovitskii, I. Stetcu, P. Talou, I. Thompson, S. van der Marck, L. Welser-Sherrill, D. Wiarda, M. White, J. L. Wormald, R. Q. Wright, M. Zerkle, G. Žerovnik, and Y. Zhu. Nucl. Data Sheets, 148:1 – 142, 2018.
- [49] D. Neudecker, P. Talou, T. Kawano, A.C. Kahler, M.C. White, T.N. Taddeucci, R.C. Haight, B. Kiedrowski, J.M. O’Donnell, J.A. Gomez, K.J. Kelly, M. Devlin, and M.E. Rising. Nucl. Data Sheets, 148:293 – 311, 2018.
- [50] OECD/NEA. JEFF3.3 Evaluated data Library - Neutron Data. Technical report.
- [51] M. Coppola and H. H. Knitter. Zeitschrift für Physik, 232:286–302, 1970.
- [52] G. N. Lovchikova and A. M. Trufanov. In Vop. At. Nauki Tekhn. Ser. Yadernye Konstanty, page 102, 1996.