Universality, scaling and collapse in supercritical fluids
Introduction
The Supercritical Fluid (SCF) is known to exhibit salient dynamic and thermodynamic crossovers [1, 2, 3] and inhomogeneous molecular distribution [4, 5, 6, 7]. But the question as to what basic physics underlies these microscopic and macroscopic anomalies remains open. Here, using an order parameter extracted by machine learning, the fraction of gas-like (or liquid-like) molecules, we find simplicity and universality in SCF: First, all isotherms of a given fluid collapse onto a single master curve described by a scaling relation. The observed power law holds from the high-temperature and pressure regime down to the critical point where it diverges. Second, phase diagrams of different compounds collapse onto their master curves by the same scaling exponent, thereby demonstrating a putative law of corresponding supercritical states in simple fluids. The reported results support a model of the SCF as a mixture of two interchangeable microstates, whose spatiotemporal dynamics gives rise to unique macroscopic properties.
Main text
Almost two centuries after its discovery by Cagniard de la Tour [8], understanding the supercritical fluid (SCF) remains a challenge. This exotic state of matter exhibits an anomalous blend of liquid-like and gas-like traits that is beyond the scope of conventional fluid theories [3, 9]. This distinctive nature also renders the SCF a promising candidate for potential industrial applications [10, 11]. SCF simultaneously manifests microscopic inhomogeneities and macroscopic crossover phenomena. Therefore, developing a theoretical framework that can capture the physics of SCF at all the relevant scales is still an open problem. Inspired by recent applications in physics [12, 13, 14, 15], we used machine learning classifiers to identify distinct liquid-like and gas-like microstructures coexisting in SCF [16]. Linking supercritical anomalies to fluctuations between the microstates, we proposed the number fraction of gas-like molecules, , as a useful order parameter of SCF.
In this Letter, we report on universal scaling of the supercritical phase diagram obtained using the order parameter . Unlike standard scaling laws, which are usually restricted to the vicinity of the critical point, the reported scaling relation spans through the whole “Widom delta"[16], from the critical point up to high temperature and pressure. The divergence of the scaling functions accurately pinpoints the liquid-gas critical point (LGCP). Furthermore, the scaling exponents are found to be universal among three simple fluids we examined, Ar, and . These results provide evidence that the physics of SCF is governed by the scaling relation of microscopic inhomogeneity.
Motivated by investigations of supercritical scaling in systems with Ising [17] and quantum criticality [18, 19], we examined the variation of in the phase diagram (Fig. 1). Before we expound on the results, we briefly explain the main features of our approach. The computational method we use was developed and tested in a previous work [16] (see Methods and Supplementary Information): Neural networks label individual particles in SCF as liquid-like and gas-like, based on their local structures. For a given temperature and pressure, is the ensemble-averaged number fraction of gas-like particles.
As a reference line, we use the supercritical gas-liquid boundary (SGLB), defined as the loci of equal liquid and gas fractions, in the supercritical domain . Taking the SGLB, which is also the line of maximal instability, as a reference is based on two observations: (i) near the LGCP, the Widom line and the SGLB closely coincide [16], and (ii) the vapor-liquid equilibrium line (VLE), the LGCP, and the Widom line can be framed together within an extended corresponding states principle [20]. Therefore, we employ the postulate that the SGLB is the extension of the VLE and LGCP into the supercritical region of the phase diagram.
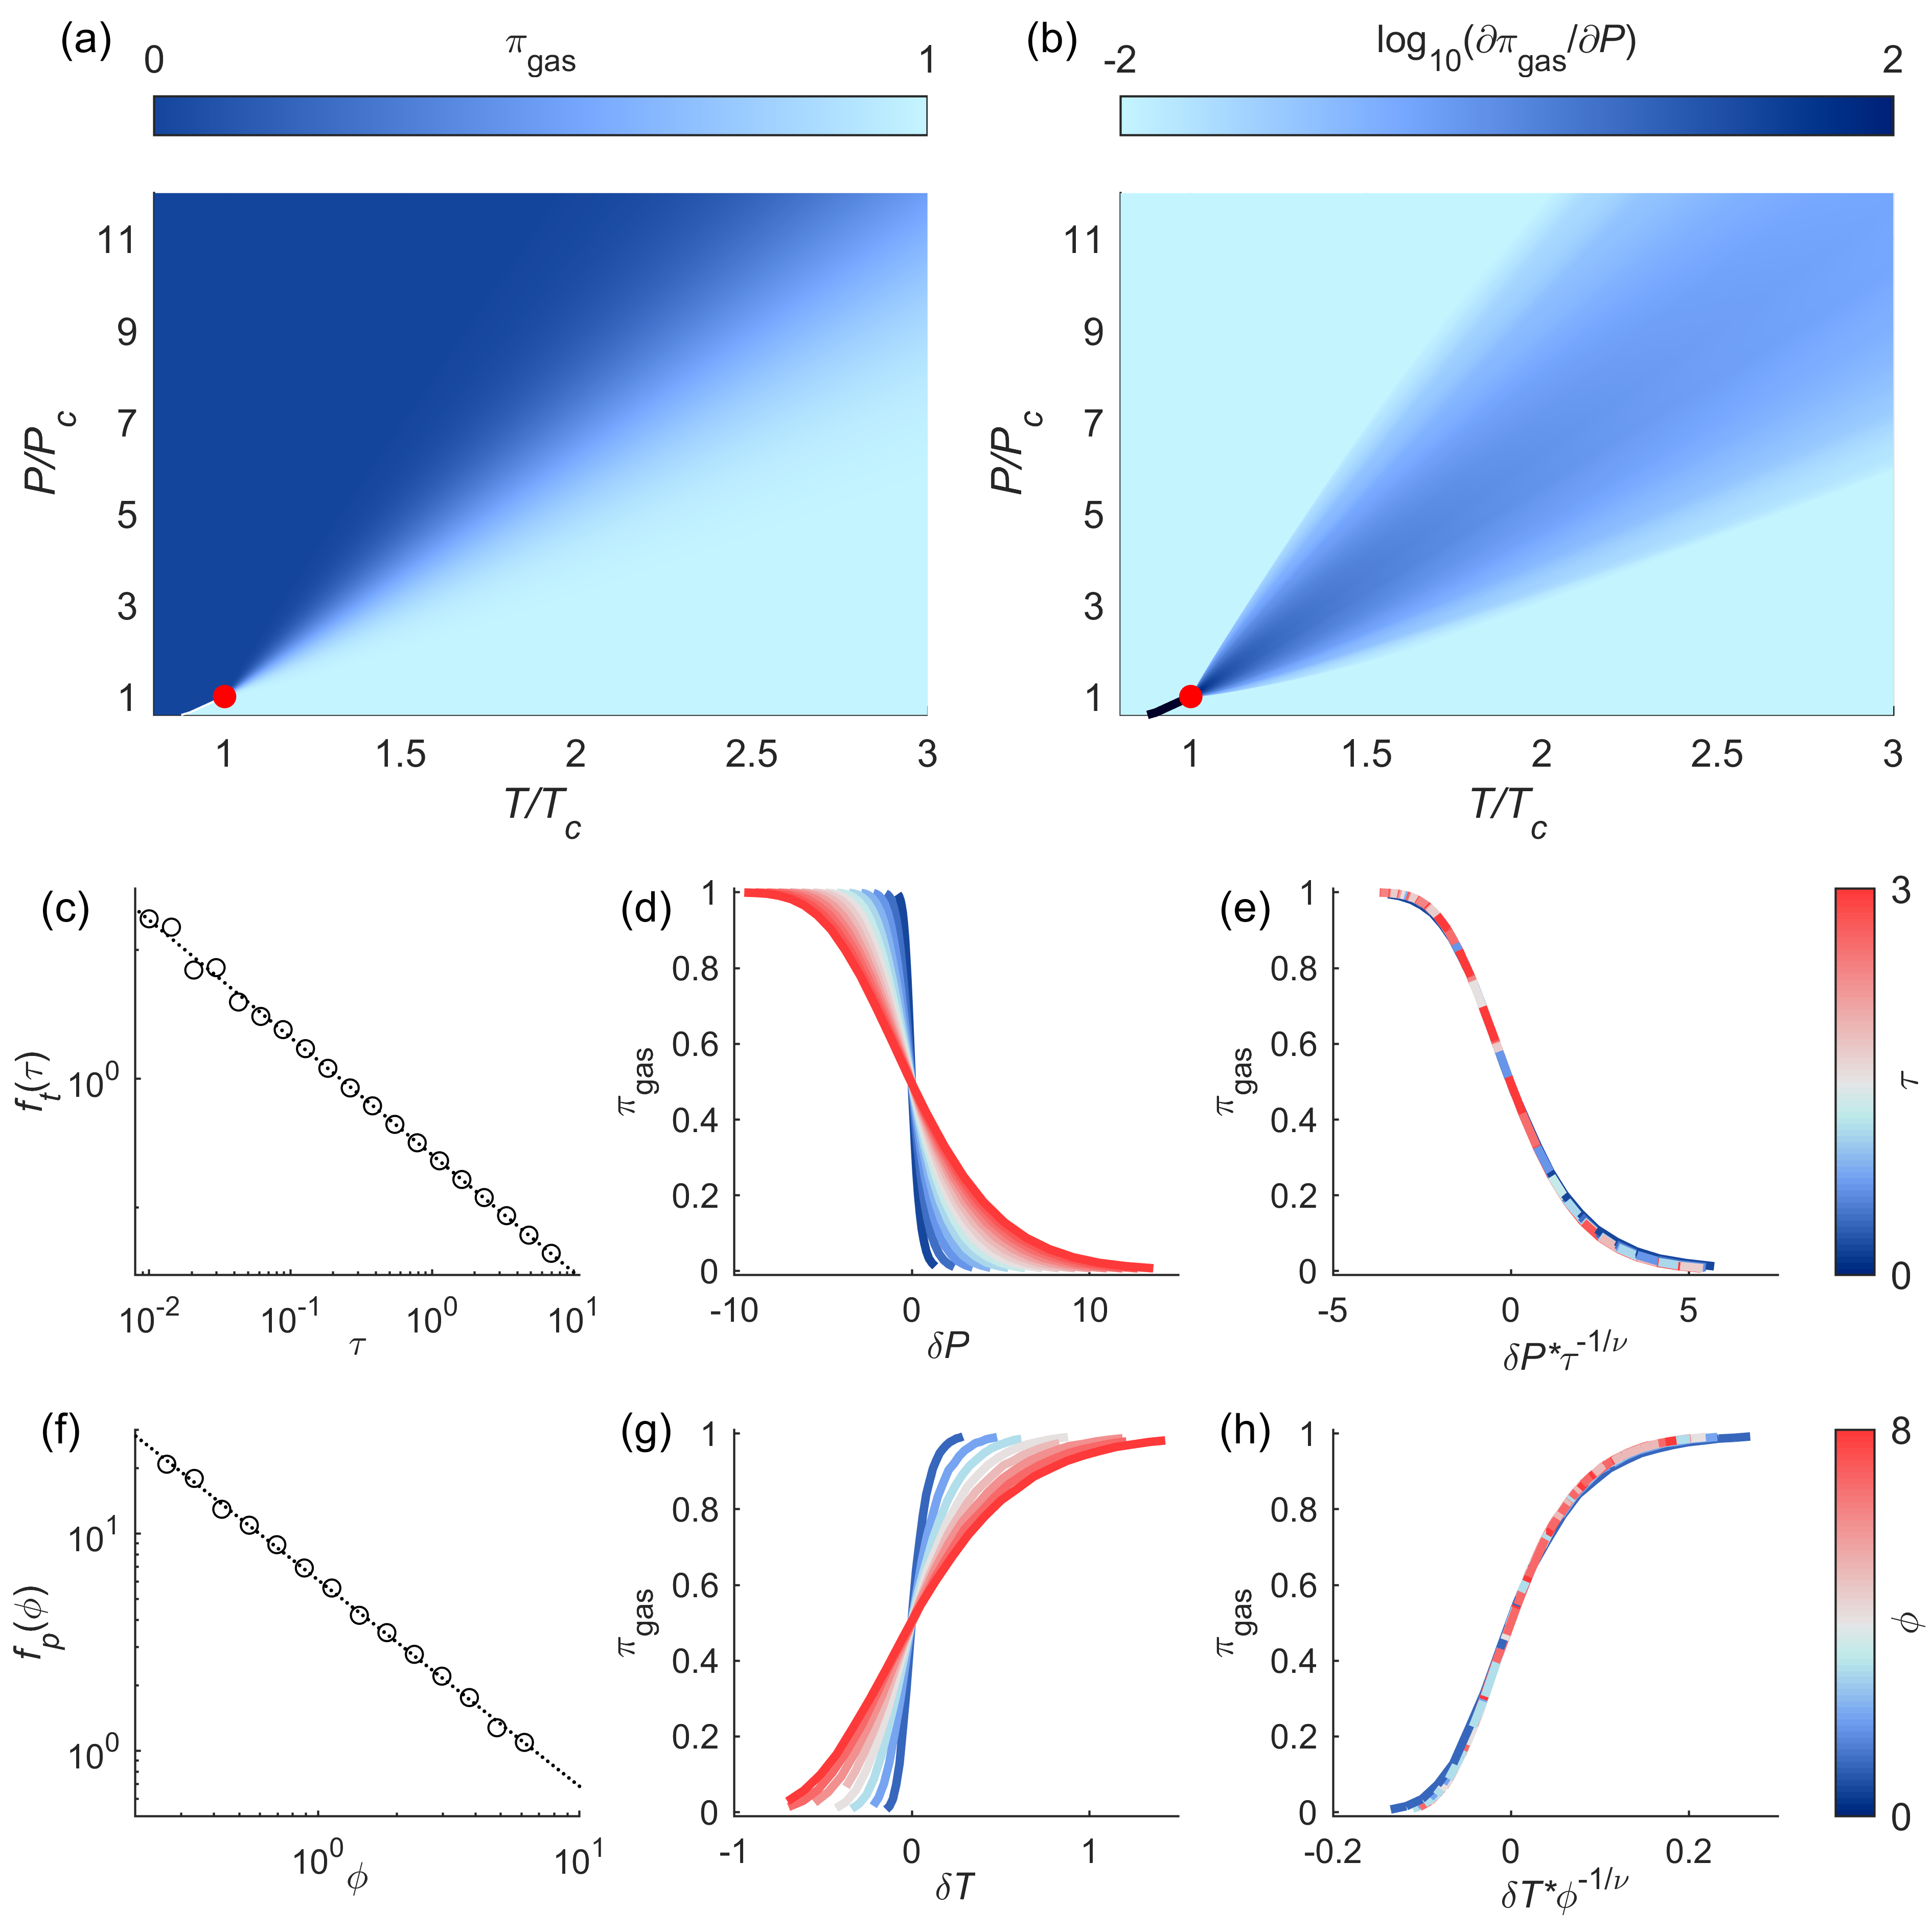
The phase diagram of the order parameter , as computed by the machine learning classifiers (Fig. 1(a)), exhibits discontinuity across the VLE line. In contrast, beyond the LGCP, is continuous throughout the “Widom delta" – the deltoid liquid-gas coexistence region emanating from the LGCP. The diagram of the pressure derivative, , highlights the divergence at the LGCP (Fig. 1 (b)).
It is instructive to define the functions and , the isothermal and isobaric gradients of at the SGLB:
| (1) |
Following the standard scaling procedure, we compute the reduced temperature and pressure with respect to the critical point, i.e. and . In these reduced coordinates, the functions (Fig. 1(c)), and (Fig. 1(f)) nicely fit to power-laws:
| (2) |
The prefactors , and the exponents, and , were extracted by fitting the data to equation (2); the estimated exponents are and .
The second postulate we assume and examine is that different isothermal curves of are all isomorphic, with scales determined by the scaling function . Fig. 1(d) shows isotherms of as a function of , the pressure shift from the SGLB. Rescaling by , we observe collapse into a single master curve (Fig. 1(e)), which captures the whole supercritical phase diagram. Similarly, different isobars of as a function of the temperature shift also collapse into a single curve by rescaling by (Fig. 1(f-h)).
The scaling functions and diverge at the critical point, as evident from their power law dependence (Fig. 1(c) and (f)). So far, however, the critical values, and , used for obtaining the power laws (equation (2)) were not fitting parameters, but rather pre-determined (Supplementary Information). To test if our model is able to capture the critical point itself, we tried a more flexible form of and :
| (3) |
where and are free fitting parameters. The numerical fitting yielded , comparable to values determined from the law of rectilinear diameters, , or from van der Waals hypothesis, . Interestingly, the values are in the vicinity of the critical point of full LJ potentials [21, 22], .
It is worth noting that the liquid/gas classifiers were trained with information only on the local structure of individual particles. Considering the strong volume fluctuations in the supercritical state, the classifiers are blind to the macroscopic state of the system, which is only loosely encoded in the ensemble average of . Nevertheless, the reported results put forth the number fraction of the two particle types as a measure that captures the critical behavior and the bulk characteristics of the system, which are collectively determined by spatiotemporal dynamics of the microstructure.
At this point, one might naturally question the relation between and experimental observables, e.g. the bulk density , since is only accessible via molecular simulations [24]. To resolve this issue, we define the density of gas-like and liquid-like states as and . The data exhibits several ‘empirical’ relations between , and (see Figs. S3-S4 and comments there). First, the bulk density equals the weighted sum of the liquid-like and gas-like densities:
| (4) |
Note that equation (4) is not merely the outcome of volume and number conservation, which lead to . Denoting liquid-like and gas-like densities at SGLB as and , and defining the isothermal deviation from the SGLB as and , equation (4) can be rewritten as:
| (5) |
where .
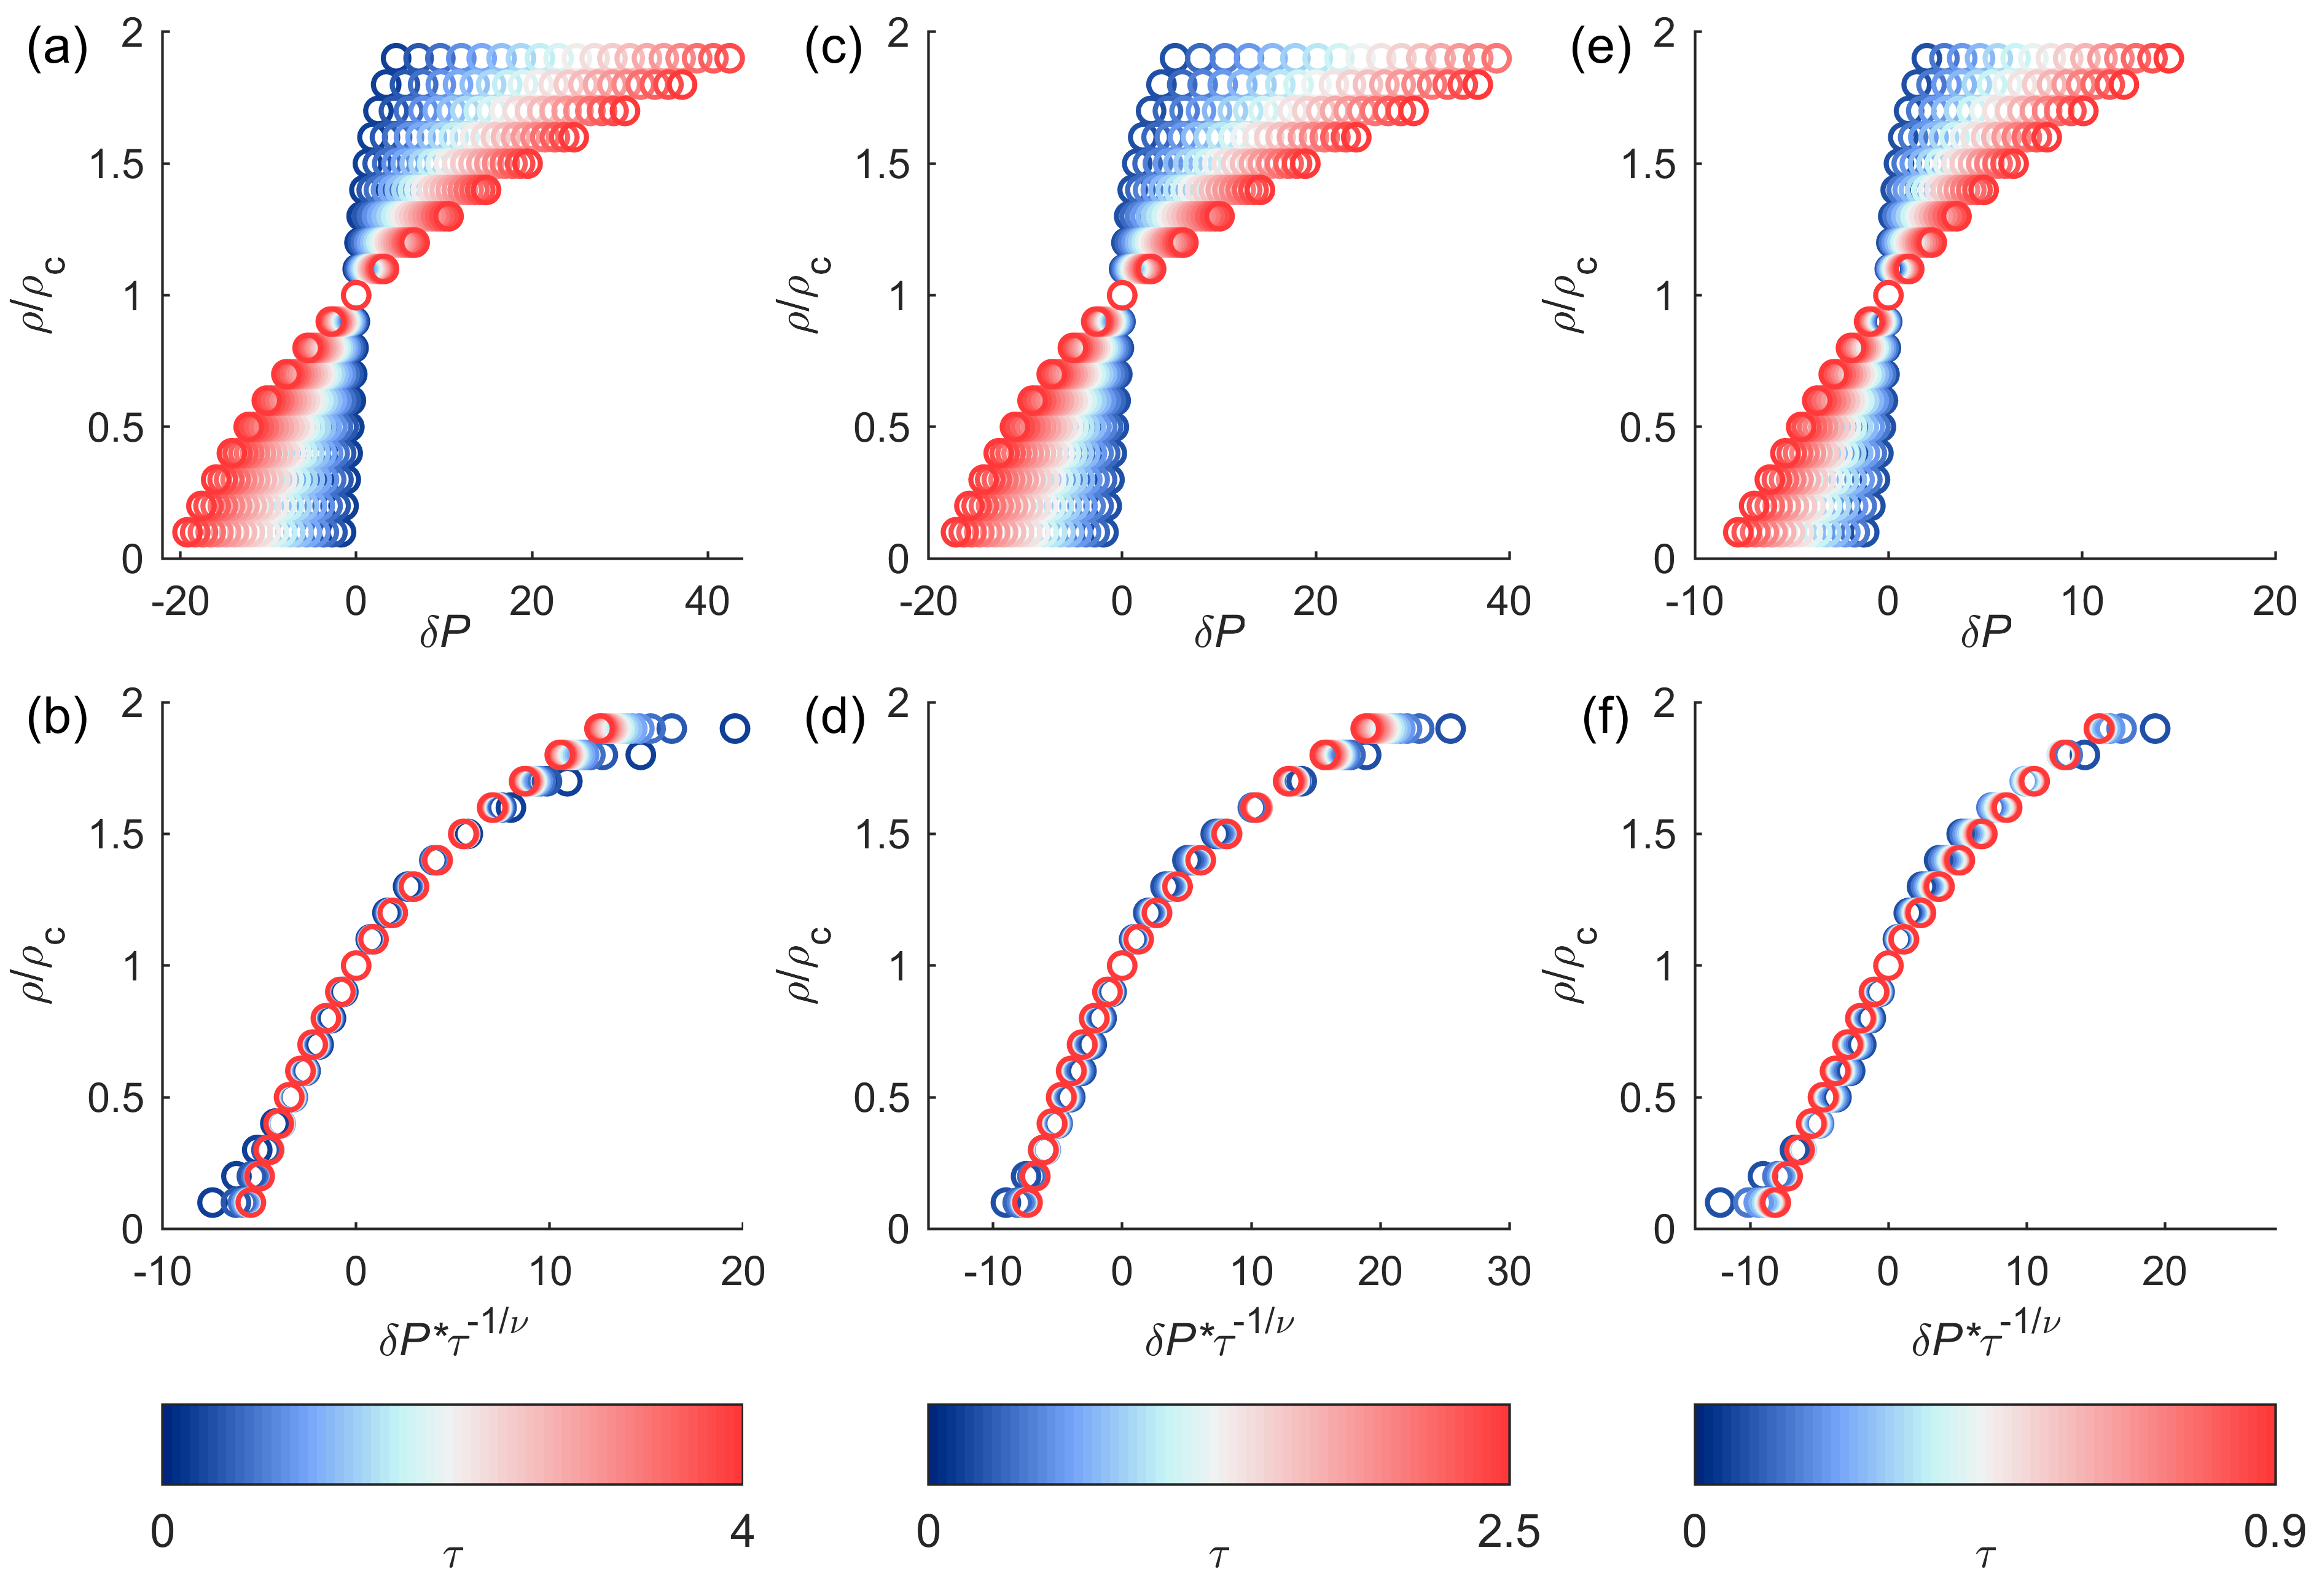
Examining the data in Figs. S3-S4, one finds that the three terms on the r.h.s. of equation (5) exhibit the following dependence: (i) is a function of , (ii) is also a function of , and (iii) is a weak function of the temperature , saturating to a finite value. Hence, if the range of is not too wide, or if is high enough, then is, approximately, a function of . From all this, one concludes that the rescaling of with (Fig. 1) applies also to .
This conjecture was first tested in a supercritical LJ fluid (Fig. 2(a-b)). We find that, as long the reduced temperature is sufficiently far from the LGCP, it can be reduced to a single line using the same scaling exponent of the order parameter . This scaling is not restricted to the LJ toy model, and seems to be universal among simple fluids, at least for the three examples we examined: Fig. 2(c-f) show the rescaling of the phase diagrams of supercritical and (data taken from the NIST chemistry webbook [23]). To avoid dependence on machine learning techniques, we defined as the deviation from the critical isochore, instead of the SGLB. With the same scaling exponent acquired from LJ fluid, the bulk densities of supercritical and also collapse to a single line. Similar rescaling is obtained for isobaric density curves (Fig. S6). Overall, these results suggest that supercritical scaling in the Widom delta is universal in simple fluids. The observed scaling also supports the framework proposed in this Letter, of understanding the SCF as an inhomogeneous mixture of two microstates.
In conclusion, by analyzing the behavior of the order parameter , we found material-independent scaling relations for the supercritical state of several simple fluids. The supercritical gas-liquid boundary serves as the reference line of the SCF, from which the properties of SCF can be rescaled into a master curve. The reported results put forth a picture of the SCF as an inhomogeneous mixture of microstates that collectively determine both microscopic and macroscopic features.
Finally, it is worth pointing that the Widom delta in Fig. 1(a-b) is akin to the “fan-shaped” quantum critical region found near metal-insulator transitions, where universality and scaling are expected [25, 19, 18, 26]. In the language of quantum critical phenomena, systems in deeply critical regions of the Widom delta cannot ‘know’ whether they are liquid or gas. Only when the system comes closer to the LGCP, it ‘notices’ to which phase it belongs and then bifurcates into the liquid-like and gas-like branches. Below the critical temperature, the system divided into liquid/gas states separated by first-order phase transition, analogous to the quantum ground states at zero temperature. One potential direction for future study would be testing whether the ‘scaling region’ universally exists for both quantum and classical phenomena.
Methods
All molecular dynamics simulations were performed using LAMMPS [27]. Fluid particles interacted via a 12-6 Lennard-Jones pairwise potential, truncated at cutoff distance of with standard correction on long-range energy contribution. Nose-Hoover thermostat and barostat were used to maintain the temperature and pressure of the system at the desired value. Isothermal and isobaric properties were calculated in NVT and NPT ensemble, where the thermodynamic properties were averaged over 10,000,000 time steps. Machine learning analyses were performed on snapshots of configurations dumped every 10,000 time steps. Voro++ library was used for the Voronoi tessellation [28].
Machine learning classifiers were implemented using deep convolutional neural networks [29], designed following the VGGNet [30]. Training data were the local structure information of subcritical liquid and gas particles in saturated liquid and vapor phases, sampled by Gibbs-ensemble Monte Carlo simulation [31] at near-critical temperature of . The neural network was trained by supervised learning approach, optimizing the node weights to maximize classification accuracy of liquid and gas particles. We trained 24 neural networks of same architecture with different training sets, and their training accuracies were . The trained neural networks could classify saturated liquid and vapor particles at with 100% accuracy.
Acknowledgements
This research was supported by Creative Materials Discovery Program through the National Research Foundation of Korea (NRF) funded by Ministry of Science and ICT (NRF-2018M3D1A1058624), and NRF Grant funded by Korean Government (NRF-2017H1A2A1044355, NRF-2018R1A2B6006262).
Author contributions
M.Y.H., Y.J. and W.B.L. designed the simulations. M.Y.H. and T.J.Y. performed the simulations and collected data. M.Y.H., T.T. and Y.J. interpreted the results. M.Y.H. wrote the manuscript with the assistance of T.T. and Y.J. W.B.L. headed this project.
Additional information
Online Supplementary Information is available. Correspondence and requests for materials should be addressed to Y.J., T.T. or W.B.L.
Competing financial interests
The authors declare no competing financial interests.
References
- [1] Xu, L. et al. Relation between the widom line and the dynamic crossover in systems with a liquid–liquid phase transition. \JournalTitleProc. Natl. Acad. Sci. USA 102, 16558–16562 (2005).
- [2] Simeoni, G. G. et al. The widom line as the crossover between liquid-like and gas-like behaviour in supercritical fluids. \JournalTitleNat. Phys. 6, 503–507 (2010).
- [3] McMillan, P. F. & Stanley, H. E. Fluid phases: Going supercritical. \JournalTitleNat. Phys. 6, 479–480 (2010).
- [4] Tucker, S. C. Solvent density inhomogeneities in supercritical fluids. \JournalTitleChem. Rev. 99, 391–418 (1999).
- [5] Nishikawa, K. & Morita, T. Inhomogeneity of molecular distribution in supercritical fluids. \JournalTitleChem. Phys. Lett. 316, 238–242 (2000).
- [6] Yoon, T. J., Ha, M. Y., Lee, W. B. & Lee, Y.-W. Monte carlo simulations on the local density inhomogeneities of sub-and supercritical carbon dioxide: Statistical analysis based on the voronoi tessellation. \JournalTitleJ. Supercrit. Fluid. 119, 36–43 (2017).
- [7] Yoon, T. J., Ha, M. Y., Lee, W. B. & Lee, Y.-W. Molecular dynamics simulation on the local density distribution and solvation structure of supercritical co2 around naphthalene. \JournalTitleJ. Supercrit. Fluid. 130, 364–372 (2017).
- [8] Cagniard de La Tour, C. Exposé de quelques résultats obtenu par l’action combinée de la chaleur et de la compression sur certains liquides, tels que léau, l’alcool, l’ether sulfurique et l’essence de pétrole rectifiée. \JournalTitleAnn. Chim. Phys. 21, 127 (1822).
- [9] Bolmatov, D., Brazhkin, V. V. & Trachenko, K. Thermodynamic behaviour of supercritical matter. \JournalTitleNat. Commun. 4, 2331 (2013).
- [10] Eckert, C. A., Knutson, B. L. & Debenedetti, P. G. Supercritical fluids as solvents for chemical and materials processing. \JournalTitleNature 383, 313 (1996).
- [11] Savage, P. E., Gopalan, S., Mizan, T. I., Martino, C. J. & Brock, E. E. Reactions at supercritical conditions: applications and fundamentals. \JournalTitleAIChE J. 41, 1723–1778 (1995).
- [12] Carrasquilla, J. & Melko, R. G. Machine learning phases of matter. \JournalTitleNat. Phys. 13, 431 (2017).
- [13] Van Nieuwenburg, E. P. L., Liu, Y.-H. & Huber, S. D. Learning phase transitions by confusion. \JournalTitleNat. Phys. 13, 435 (2017).
- [14] Cubuk, E. D. et al. Identifying structural flow defects in disordered solids using machine-learning methods. \JournalTitlePhys. Rev. Lett. 114, 108001 (2015).
- [15] Schoenholz, S. S., Cubuk, E. D., Sussman, D. M., Kaxiras, E. & Liu, A. J. A structural approach to relaxation in glassy liquids. \JournalTitleNat. Phys. 12, 469 (2016).
- [16] Ha, M. Y., Yoon, T. J., Tlusty, T., Jho, Y. & Lee, W. B. Widom delta of supercritical gas-liquid coexistence. \JournalTitleJ. Phys. Chem. Lett. 9, 1734–1738 (2018).
- [17] Anisimov, M. A., Povodyrev, A. A., Kulikov, V. D. & Sengers, J. V. Nature of crossover between ising-like and mean-field critical behavior in fluids and fluid mixtures. \JournalTitlePhys. Rev. Lett. 75, 3146 (1995).
- [18] Terletska, H., Vučičević, J., Tanasković, D. & Dobrosavljević, V. Quantum critical transport near the mott transition. \JournalTitlePhys. Rev. Lett. 107, 026401 (2011).
- [19] Furukawa, T., Miyagawa, K., Taniguchi, H., Kato, R. & Kanoda, K. Quantum criticality of mott transition in organic materials. \JournalTitleNat. Phys. 11, 221 (2015).
- [20] Banuti, D. T., Raju, M. & Ihme, M. Similarity law for widom lines and coexistence lines. \JournalTitlePhys. Rev. E 95, 052120 (2017).
- [21] Caillol, J. Critical-point of the lennard-jones fluid: A finite-size scaling study. \JournalTitleJ. Chem. Phys. 109, 4885–4893 (1998).
- [22] Potoff, J. J. & Panagiotopoulos, A. Z. Critical point and phase behavior of the pure fluid and a lennard-jones mixture. \JournalTitleJ. Chem. Phys. 109, 10914–10920 (1998).
- [23] Nist chemistry webbook, nist standard reference database number 69 (National Institute of Standards and Technology, Gaithersburg MD, 20899).
- [24] Yoon, T. J., Ha, M. Y., Lee, W. B. & Lee, Y.-W. Probabilistic characterization of the widom delta in supercritical region. \JournalTitleJ. Chem. Phys. 014502 (2018).
- [25] Vučičević, J., Terletska, H., Tanasković, D. & Dobrosavljević, V. Finite-temperature crossover and the quantum widom line near the mott transition. \JournalTitlePhys. Rev. B 88, 075143 (2013).
- [26] Lamsal, J., Gaddy, J., Petrovic, M., Montfrooij, W. & Vojta, T. The search for quantum critical scaling in a classical system. \JournalTitleJ. Appl. Phys. 105, 07E322 (2009).
- [27] Plimpton, S. Fast parallel algorithms for short-range molecular dynamics. \JournalTitleJ. Comput. Phys. 117, 1–19 (1995).
- [28] Rycroft, C. Voro++: A three-dimensional voronoi cell library in c++. \JournalTitleChaos 19, 041111 (2009).
- [29] Goodfellow, I., Bengio, Y. & Courville, A. Deep learning, vol. 1 (MIT press Cambridge, 2016).
- [30] Simonyan, K. & Zisserman, A. Very deep convolutional networks for large-scale image recognition. \JournalTitlearXiv preprint arXiv:1409.1556 (2014).
- [31] Frenkel, D. & Smit, B. Understanding molecular simulation: from algorithms to applications, vol. 1 (Elsevier, 2001).