Raman spectroscopy of -electron metals: An example of CeB6
Abstract
We performed an optical spectroscopy study of electronic and magnetic excitations for a rare-earth system with a single electron quasi-localized in the -shell on an ion at high-symmetry crystallographic site in application to CeB6 heavy-fermion metal. We carried out group-theoretical classification of the electronic crystal field (CF) transitions and assessed their coupling to light cross-sections for polarization resolved Raman scattering processes. We discuss applicability of symmetrized Raman susceptibility to studies of exotic charge and spin high multiplet ordering phases in -electron systems. We study temperature effects on intra- and inter-multiplet CF transitions and also on the coupling between the CF excitations with the lattice vibrations. We acquired temperature dependence of the low-frequency polarization resolved Raman response for all Raman-allowed symmetry channels: A1g, Eg, T1g, and T2g of the cubic Oh point group. We demonstrate that T1g-symmetry static Raman susceptibility shows a temperature dependence which is consistent with the previously-reported magnetic susceptibility data. Such behavior in the T1g channel signifies the presence of long wavelength magnetic fluctuations, which is interpreted as a manifestation of ferromagnetic correlations induced by tendency towards quadrupolar ordering.
10.1103/PhysRevMaterials.3.065003
I Introduction
Strongly correlated - and -electron systems support a rich variety of low-temperature phases, including magnetism and superconductivity Imada et al. (1998); Dagotto (2005); Moore and van der Laan (2009); Pfleiderer (2009). Among these phases, long-range order of multipoles, namely high-rank electric or magnetic moments, has great interest Kuramoto et al. (2009); Santini et al. (2009); Cameron et al. (2016); Suzuki et al. (2018). For example, second-rank quadrupolar moments could lead to novel phenomena including the quadrupolar Kondo effect Cox (1987) and quadrupole-fluctuation-mediated superconductivity Kotegawa et al. (2003). In -electron systems, the orbital angular momentum is usually quenched by large crystal-field (CF) splitting, hindering multipolar moments. -electron systems, on the other hand, are suitable choices to study multipolar interactions and ordering phenomena by virtue of the interplay of the spin and orbital degrees of freedom. Indeed, the actinide dioxides, in which -electrons play an important role, serve as a paradigm for understanding the physics of multipolar interactions Santini et al. (2009). Quadrupolar orderings have also been discovered in a number of -electron compounds Morin and Rouchy (1993); Kosaka et al. (1998); Hirota et al. (2000); Paixão et al. (2002); Tsujimoto et al. (2014); Cameron et al. (2016).
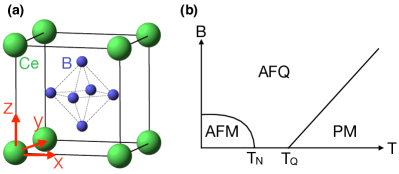
CeB6, with its simple chemical composition, lattice structure, and electronic configuration, is considered a prototypical example of heavy-fermion metal with quadrupolar ordering. This material has a cubic structure (space group Pmm, No. 221; point group Oh) composed of cerium ions and boron octahedrons [Fig. 1(a)]. Every Ce3+ ion has only one electron in its orbital and Oh site symmetry. CeB6 undergoes a second-order phase transition into a non-magnetic phase at TQ = 3.2 K, before developing an antiferromagnetic (AFM) order below TN = 2.3 K Takase et al. (1980); Fujita et al. (1980). The AFM phase has a double-Q commensurate magnetic structure with Q1=(0.25, 0.25, 0) and Q2=(0.25, 0.25, 0.5) Burlet et al. (1982); Zaharko et al. (2003). As for the non-magnetic phase, neutron scattering shows no structural transition at TQ Zaharko et al. (2003). Resonant X-ray diffraction determines that this non-magnetic phase involves an orbital ordering with wavevector (0.5, 0.5, 0.5) Hironori Nakao and Ko-ichi Magishi and Yusuke Wakabayashi and Youichi Murakami and Kuniyuki Koyama and Kazuma Hirota and Yasuo Endoh and Satoru Kunii (2001), and the C44 elastic constant, related to -type strains, shows an anomaly at TQ Nakamura et al. (1994). Based on these results, it is generally believed that the non-magnetic phase is a two-sublattice arrangement of Ce3+ -type electric quadrupole moments, with a wavevector (0.5, 0.5, 0.5) Cameron et al. (2016). This proposed antiferroquadrupolar (AFQ) model is consistent with experimental data in the presence of magnetic field Hanzawa (2000); Kunimori et al. (2012); Matsumura et al. (2009, 2012); Schlottmann (2012), but to our knowledge, up to now there is no direct evidence demonstrating the -type AFQ order in zero field. A sketch of field-temperature phase diagram for CeB6 is shown in Fig. 1(b).
All experimental results reported in this study correspond to the zero-field paramagnetic (PM) phase, namely, the data is acquired at T TQ.
In the recent years multiple experimental studies have revealed the importance of unexpected ferromagnetic (FM) correlations in the low-temperature ordering phenomena of CeB6. In the AFQ phase with finite magnetic field, electron spin resonance (ESR) with narrow linewidth was uncovered, pointing to existence of FM correlations Demishev et al. (2009). Theoretical study suggested that such FM correlations result from AFQ ordering Schlottmann (2012). A zone-center excitation at the (110) point, following the energy of ESR, was found by inelastic neutron scattering (INS) Portnichenko et al. (2016). In the AFQ phase at zero magnetic field, this finite-energy mode collapses into a quasi-elastic peak Jang et al. (2014). Moreover, intense FM fluctuations were uncovered in the AFM phase, suggesting propensity to FM instability Jang et al. (2014).
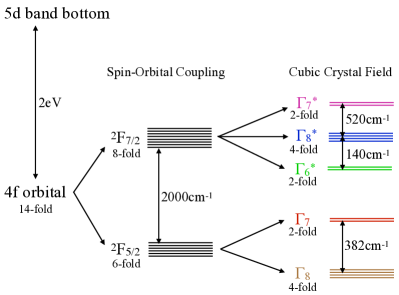
Both the AFQ and AFM phases are closely related to the CF ground state Cameron et al. (2016). In CeB6, 6-fold degenerate is the ground multiplet, and 8-fold is the lowest-energy excited multiplet [Fig. 2]. These two multiplets were identified in photoemission spectroscopy studies Takahashi et al. (1995); Koitzsch et al. (2016) by the self-energy effects 111Photoemission spectroscopy probes energy states below the Fermi level, thus, ARPES cannot directly access the multiplet. However, virtual excitations to the narrow multiplet contribute to the self energy of the spectral function, making the multiplet identifiable in the photoemission spectra. Details of this mechanism can be found in Refs. Gunnarsson and Schönhammer (1983); Coleman (1984); Patthey et al. (1987). From group theory analysis Koster (1963), the cubic CF potential splits the multiplet into quartet and doublet states, and the multiplet into doublet , doublet , and quartet states 222Asterisks are used to distinguish the CF states of the multiplet (, and ) from those of the multiplet ( and ).. For the multiplet, the state is the ground state Sato et al. (1984); Zirngiebl et al. (1984); Sakai et al. (1997); Sundermann et al. (2017) and the state has an energy of 372 cm-1 at room temperature Zirngiebl et al. (1984); Loewenhaupt et al. (1985). For the multiplet, the energy of the CF levels has not been determined experimentally.
In order to better understand the low-temperature ordering phenomena in CeB6, a more detailed study of the interplay of CF excitations, lattice dynamics and the FM correlations is required. Raman spectroscopy is a suitable technique providing symmetry-resolved excitation spectra of electronic, magnetic, and phononic degrees of freedom. As a photon-in-photon-out inelastic scattering process, polarization-resolved Raman scattering has the unique advantage of high energy-resolution and the ability to disentangle the excitation spectra into individual symmetry channels. The symmetry of a particular excitation can be identified by controlling the polarization of the incident and scattered light Hayes and Loudon (2004). This experimental method has been successfully used to study CF excitations Schaack (2000); Güntherodt et al. (1987); it is a well-fitted choice of investigating the intra- and inter-multiplet CF excitations of CeB6. Moreover, Raman scattering makes it possible to study the excitations in the magnetic dipolar (T1g of Oh group) and electric quadrupolar (Eg and T2g of Oh group) channels separately. Thus, the relationship between the quadrupolar correlations and FM correlations can be clarified. Notice that quadrupolar excitations involve a change of the component of angular momentum along the quantization axis by two quantum units. Among conventional experimental probes, only photons can induce quadrupolar excitations.
In this paper, we present a comprehensive study of CeB6 using optical secondary-emission spectroscopy. We identify an intense photo-luminescence feature corresponding to recombination process. We analyze the temperature-dependence of both intra- and inter-multiplet CF excitations, and illustrate the interaction between light and CF states by a model Hamiltonian calculation. We draw information about the electron-phonon interaction by studying lattice dynamics. We observe dynamical magnetic fluctuations related to the ordered broken-symmetry states. Especially, we demonstrate two virtues of Raman scattering which have not been generally appreciated: first, the temperature dependence of the parameters of CF excitations reveals the interaction between -electrons and itinerant electrons; and second, the low-energy Raman response probes dynamical fluctuations related to exotic multipolar ordering.
The rest of this paper is organized as follows. In Sec. II we describe the sample preparation and experimental setup. In Sec. III we present and discuss the experimental results; in this section, we first show an overview of the main spectral features in SubSec. III.1 and then discuss them separately in the following subsections. In SubSec. III.2 we show the high-energy photo-luminescence (CF) feature. In SubSec. III.3 we discuss the CF excitations. Specifically, in III.3.1 we present the four lowest-energy CF excitations of Ce3+ ions, and identify the symmetry of the CF states; in III.3.2, we analyze the temperature dependence of the CF parameters, and explain the observed anomaly on the basis of Kondo effect; in III.3.3, we build a single-ion Hamiltonian, and fit the measured CF energies with this Hamiltonian to evaluate the SOC and CF strength, and to obtain the wavefunctions of eigenstates. In SubSec. III.4 we discuss lattice dynamics. The asymmetric lineshape, and relatively large full-width-at-half-maximum (FWHM) of the optical phonon modes point to electron-phonon interaction. In SubSec. III.5 we discuss quasi-elastic excitations. We find that quasi-elastic fluctuations in the symmetry channel containing magnetic excitations develops below 20 K, and that the temperature dependence of the corresponding Raman susceptibility is consistent with the previously-reported static magnetic susceptibility data. Finally, in Sec. IV we provide a summary of our observations and their implications.
II Experimental
Single crystals of CeB6 were grown in Al flux by slow cooling from 1450 ∘C. The crystals were removed from the Al flux by leaching in NaOH solution Foroozani et al. (2015); Canfield and Fisk (1992). The sample measured in this study was cleaved in ambient condition to expose its (001) crystallographic plane; the cleaved surface was then examined under a Nomarski microscope to find a strain-free area.
| Scattering Geometry | Symmetry Channel |
|---|---|
| XX | A1g+4Eg |
| XY | T1g+T2g |
| X’X’ | A1g+Eg+T2g |
| X’Y’ | 3Eg+T1g |
| RR | A1g+Eg+T1g |
| RL | 3Eg+T2g |
Raman-scattering measurements were performed in a quasi-back scattering geometry from sample placed in a continuous helium-gas-flow cryostat. A set of lines from a Kr+ ion laser, 476, 531, 647, 676 and 752 nm, were used for excitation. Incident light with less than 10 mW power was focused into a 50100 m2 spot. The temperature points reported in this paper were corrected for laser heating, which was estimated to be 0.5 K mW 333We mainly followed the procedure discussed in Ref. Maksimov et al. (1992) to estimate the laser heating. The optical absorption coefficient data were extracted from the optical data Kimura et al. (1990, 1992, 1994), while the thermal conductivity data were taken from Ref. Sera et al. (1996)..
Six polarization configurations were employed to probe excitations in different symmetry channels. The relationship between the scattering geometries and the symmetry channels Hayes and Loudon (2004) is given in Table. 1. The algebra used to decompose measured spectra into four symmetry channels is shown in Table. 2.
We used a custom triple-grating spectrometer with a liquid-nitrogen-cooled charge-coupled device (CCD) detector for analysis and collection of the scattered light. Low-resolution gratings with 150 lines per mm were used to measure the broad PL feature, while high-resolution gratings with 1800 lines per mm were used for measurements of the sharp Raman features. The data were corrected for the spectral response of the system.
For first-order scattering processes, the measured secondary-emission intensity is related to the Raman response by , where is the Bose factor, is excitation energy, with temperature, and represents photo-luminescence SM . For the second-order acoustic-phonon scattering process to be discussed in SubSec. III.4, assuming the two constitute excitations have the same energy, and are related by SM .
| Symmetry Channel | Expression |
|---|---|
| A1g | |
| Eg | |
| T1g | |
| T2g |
III Results and Discussion
III.1 Overview
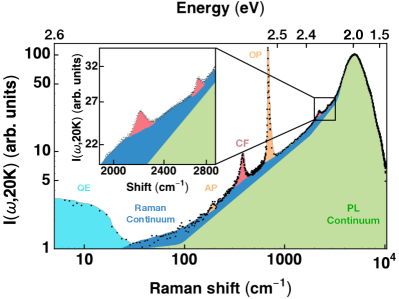
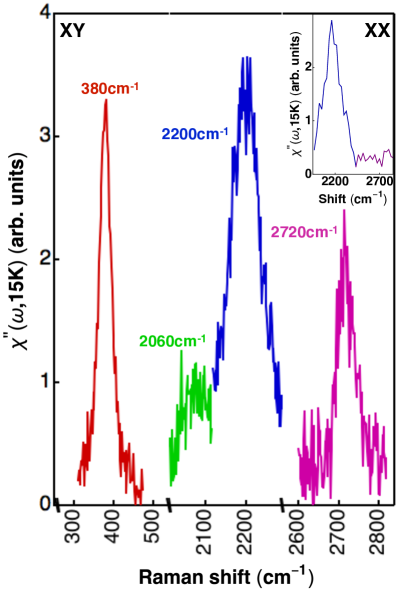
In Fig. 3 we present a typical secondary-emission spectrum over a large energy range, covering Raman features of distinct origins. Among the Raman features, quasi-elastic excitations have the lowest-energy. Second-order acoustic phonon excitations are at around 200 cm-1, while first-order optical phonon excitations are near 1000 cm-1. The energy of the intra-multiplet CF excitation is around 400 cm-1, while that of the inter-multiplet CF excitations is more than 2000 cm-1. The PL continuum arises from a broad PL peak at around 2.0 eV. In the following subsections we will discuss every spectral feature separately in details.
III.2 Photo-Luminescence
In Fig. 4(a) we show the excitation dependence of the PL feature at room temperature. The PL peak has 2.0 eV excitation threshold, and excitations below 2.0 eV threshold show predominantly Raman features. The PL feature is centered at 1.95 eV, just below the threshold energy, and has about 0.4 eV full width at half maximum (FWHM). Upon cooling the peak shifts slightly to higher energy [Fig. 4(b)].
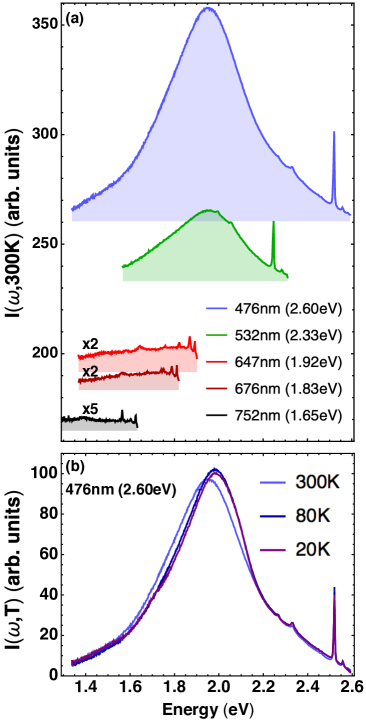
The optical conductivity shows a shoulder at around 2.0 eV Kimura et al. (1990, 1992, 1994), suggesting an optical gap. Band-structure calculations further indicate a 2.0 eV gap between the Ce dispersive -band bottom and flat -band Kitamura (1994); Suvasini et al. (1996); Neupane et al. (2015). We therefore attribute the PL peak to the recombination of the electron-hole excitations between the - and -bands. Transitions between - and -states are dipole allowed, and the energy separation of the -band bottom and the -band is consistent with the energy of this PL peak. The enhancement of PL intensity for excitations above the 2 eV threshold results from the increase of the density of states (DOS) for the to interband transition.
III.3 Crystal-Field Excitations
III.3.1 Identification
In total, there are four CF excitations from the ground state to the higher states within the and multiplets: one intra-multiplet excitation and three inter-multiplet excitations [Fig. 2]. In Fig. 5 we present the spectrum of the four CF excitations measured at 15 K. Four peaks at 380 cm-1, 2060 cm-1, 2200 cm-1 and 2720 cm-1 are observed. The 380 cm-1 excitation is the intra-multiplet transition. Among the three inter-multiplet excitations, only the transition can have a finite component Koster (1963). In the inset of Fig. 5 we show that among the inter-multiplet excitations only the one at 2200 cm-1 contains an component. The 2200 cm-1 excitation is therefore assigned to the transition. The CF excitation at 2720 cm-1, in turn, can only be a transition between the ground state and the or states. Raman scattering cannot distinguish between and transitions because they both contain the same irreducible representations Koster (1963): = = . However, we will show in III.3.3 that the electron-cloud distribution of the state has the smallest overlap with the boron octahedrons, the state has intermediate overlap, and the state has the largest overlap. Because of the Coulomb repulsion between cerium and boron electrons, the state has the highest energy while the state has the lowest energy. Indeed, within the multiplet because the state has more overlap with the boron octahedrons it has a higher energy than the state. Therefore, the 2720 cm-1 excitation is assigned to the transition, and the 2060 cm-1 excitation is assigned to the transition.
III.3.2 Temperature Dependence
In Fig. 6 we present the temperature dependence of the energy and FWHM of three CF excitations. The spectral parameters of the CF excitations were obtained by fitting the measured spectral peaks with a Lorentzian lineshape.
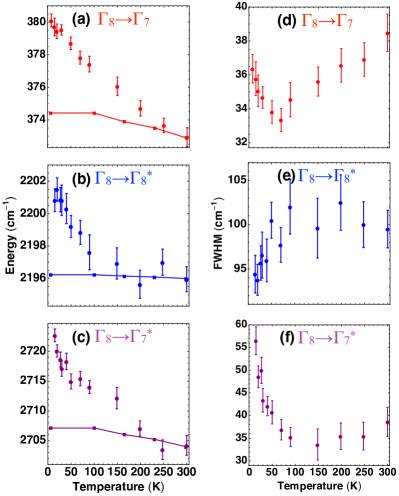
On cooling from 304 K to 15 K the lattice contraction strengthens the electrostatic potential at the Ce sites resulting in increase of the , , and transition energy by 7 cm-1, 5 cm-1, and 18 cm-1 respectively 444The energy of the transition shows monotonic temperature dependence. The earlier reports, Ref. Zirngiebl et al. (1984); Loewenhaupt et al. (1985), showed no temperature dependence of the transition energy on cooling from 300 K to 20 K, followed by a rapidly hardening on cooling below 20 K.. A discussion of the change of the energy of the CF states with increasing CF potential will be given in III.3.3.
At room temperature, the CF spectral lines of CeB6 are broader than those measured from Ce3+ ions embedded in insulators, e.g. Ce-doped Y2O3 Nolas et al. (1994) or Ce-doped LuPO4 Williams et al. (1989). The broadening could be caused by two factors: first, lattice of Ce3+ ions leads to small dispersion of the narrow -bands; and second, hopping of conduction electrons among the boron sites induces fluctuations of the electrostatic potential at the Ce sites, which broadens FWHM.
On cooling, the FWHM of the and CF transitions decrease from 300 K to 80 K, but anomalously increases below 80 K [Fig. 6 (d) and (f)]. The decrease of FWHM is expected because lattice vibrations, causing fluctuations of the electrostatic potential at Ce sites, diminish with cooing. In order to understand the anomalous increase of FWHM below 80 K, it is important to notice that the electrical resistivity of CeB6 has its local minimum at 80 K. The resistivity upturn below 80 K results from the Kondo effect Takase et al. (1980) due to increase in the rate of conduction electron scattering from the local moments at the Ce sites on cooling Hewson (1993); Amusia et al. (2015). The Kondo effect shortens the lifetime of the and CF states, so the FWHM of the and CF transitions increases below 80 K. Nevertheless, the FWHM of the CF transition does not show an upturn below 80 K [Fig. 6 (e)]. This is because the state has smaller overlap with the boron octahedrons than the and states, therefore, it is less influenced by the increased conduction electron scattering rate.
Our data do not display directly the splitting of the CF ground state. However, the minimum FWHM of the is around 33 cm-1 [Fig. 6 (d)]: if the splitting of the CF ground state is small, it would not be resolved. The previous studies suggested a splitting of 20 cm-1 Zirngiebl et al. (1984); Terzioglu et al. (2001), which does not contradict our data.
III.3.3 Model Hamiltonian Calculation
To shed light on the nature of the CF transitions, we perform a model Hamiltonian calculation. We use the following single-ion Hamiltonian
| (1) |
The first term represents the energy of unperturbed shell. The value is chosen to put the ground state at zero energy. The second term
| (2) |
describes the effect of SOC. Here is the SOC coefficient, is the orbital angular momentum operator and are Pauli matrices. The third term
| (3) |
is the general expression for a CF potential of cubic site symmetry Lea et al. (1962), where , , and are Stevens operators Stevens (1952), and and are the CF coefficients 555When comparing the CF coefficients across different literature, additional constants are needed Hutchings (1964); Kassman (1970).:
| (4) |
| (5) |
and are the geometrical coordination factors determined by the charge configuration around the Ce sites. Regardless of the specific configuration, and , where is the lattice constant; and are the mean fourth and sixth powers of the radii of the Ce3+ -orbital, and and are the Stevens multiplicative factors Stevens (1952).
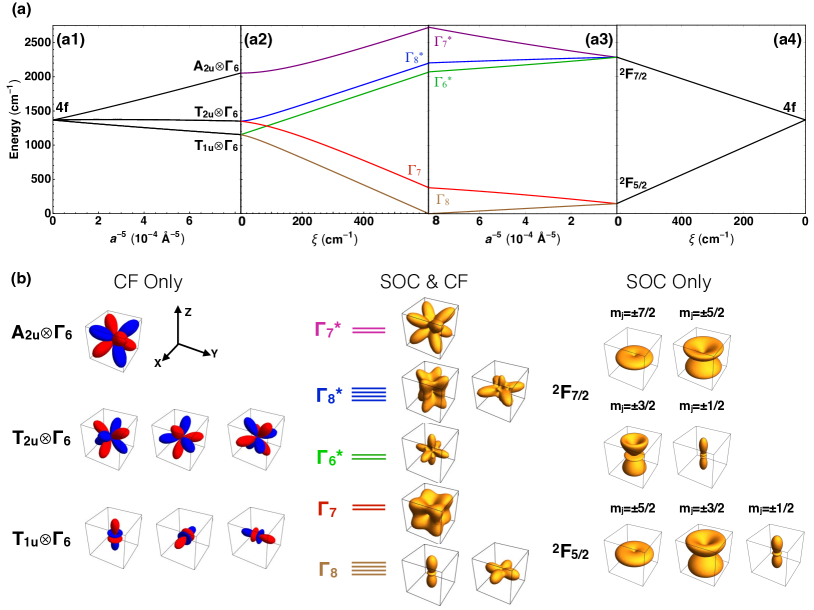
The effects of SOC and CF potential on the energy and angular electron-cloud distribution of the CF levels are illustrated in Fig. 7. In the absence of the SOC, the CF eigenfunctions could be classified by the irreducible representations (IRs) of Oh double group. The relevant IRs are the one-dimensional , three-dimensional , and three-dimensional for the orbital part of the wavefunction, and two-dimensional for the spin part. The 14-fold degenerate 4f orbital would be split into 2-fold , 6-fold , and 6-fold orbitals. Finite SOC splits further these orbitals and results in mixing of wavefunctions derived from different orbitals. The symmetry of the split states is given by the decomposition of the direct products into direct sums of IRs of Oh double group Koster (1963): , , and .
On the other hand, if cubic CF were absent, the 4f orbital would be split into 8-fold () and 6-fold () multiplets. Finite CF potential splits the two multiplets and induces mixing of wavefunctions derived from different multiplets SM . The symmetry of the split states is given by the compatibility table showing the mapping of IRs of the full rotational group into IRs of Oh double group Koster (1963): , and . With both SOC and CF present, the CF eigenfunctions should be classified by the IRs of the double group, namely two-dimensional , two-dimensional , and four-dimensional .
We diagonalize the Hamiltonian (1) in the basis of , where are quantum numbers corresponding to operators, respectively. After diagonalization, the CF transition energies can be expressed in terms of , and . We obtain these three parameters by fitting the energies of three CF transitions to the data at 15 K (the weakest transition is not accounted in this procedure). The obtained set of parameters comprises =610 cm-1, =-0.758 cm-1 and =-0.0165 cm-1. The same values automatically render the energy of weakest transition at 2070 cm-1, which is close to the observed value at 2060 cm-1. The value of (610 cm-1) is also consistent with the estimated value for the Ce3+ ion embedded in LuPO4 (614 cm-1) Williams et al. (1989). Such consistency demonstrates the reliability of the model (1).
We can further use this single-ion model to describe the temperature dependence of the CF excitation energy. Here we assume that is temperature-independent, and that the temperature dependence of the and coefficients comes from the temperature dependence of the lattice constant . We therefore rewrite and as = and =, where and are temperature-independent factors. The temperature dependence of the lattice constant is obtained from the Refs. Tanaka and Ōnuki (2002); Zaharko et al. (2003). Then, we determine the values of , and by matching the calculated values with the measured data at 300 K. Finally, we use the determined , and to calculate CF excitation energies below 300 K. The results are shown in Fig. 6 (a-c). The discrepancy between the measured data and the calculated values below 200 K results from unaccounted terms in the model Hamiltonian [Eq. (1)]; for an example, interactions between localized -electrons and the itinerant conduction electrons.
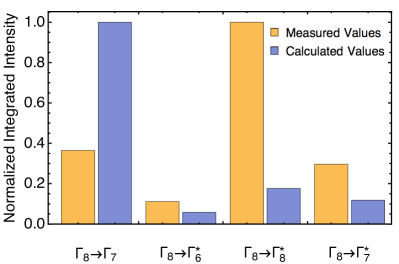
By virtue of the obtained eigenfunctions, the Raman intensity of the four CF transitions can be calculated. For non-resonant scattering, the Raman response has the following expression Devereaux and Hackl (2007):
| (6) |
where is the partition function, , are the initial and final state with energy and , is the Raman shift, and is the effective Raman operator. In our case, is the CF ground state and is one of the excited CF states. For nonresonant Raman scattering, is a quadrupolar operator depending on the crystallographic symmetry and scattering geometry Axe (1964); Kiel et al. (1969); Williams et al. (1989). For XY scattering geometry in a cubic crystal, transforms in the same way as quadrupole under the symmetry operations of Oh point group:
| (7) |
where and are the ladder operators of the orbital angular momentum. We note that because light only couples to the electron’s orbital degree of freedom, the effective Raman operator should be written in terms of the orbital angular momentum operators, rather than the total angular momentum operators. Expression (7) should accordingly be evaluated in the basis of .
In Fig. 8 we compare the calculated and measured CF transition intensity. Because the 476 nm excitation is resonant with interband transitions (see SubSec. III.2) but the expression (7) is only valid for non-resonant scattering, we expect discrepancy between the calculated and measured results. Nevertheless, the relative intensity of the three inter-multiplet transitions is reproduced.
III.4 Phononic Excitations
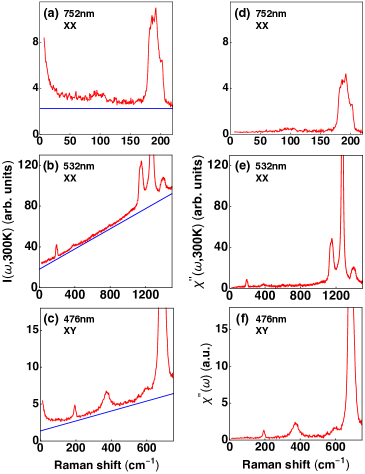
An overview of the phonon modes is presented in Fig. 9(a). From group-theory analysis, CeB6 has three Raman-active optical phonon modes: A1g, Eg and T2g. Their respective energies are 1271, 1143 and 681.7 cm-1 at 300 K, consistent with previous results Zirngiebl et al. (1986); Ogita et al. (2003). Their lineshapes at 300 K and 4 K are presented in Fig. 9(b); no anomaly is observed on cooling. The Eg and T2g optical phonon modes exhibits asymmetric lineshape. The underlying electronic continuum likely results from electronic interband transitions: according to the calculated and measured band structure Kitamura (1994); Suvasini et al. (1996); Neupane et al. (2015), many direct interband transitions are allowed and in turn can contribute to the nearly flat continuum below 1500 cm-1 (0.2 eV).
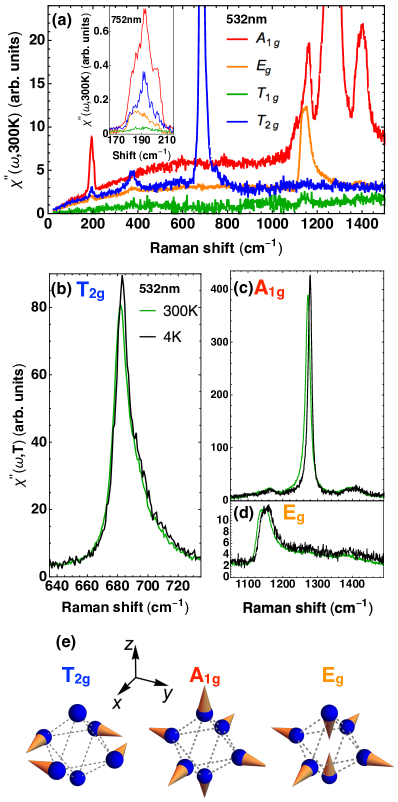
The peak at 194 cm-1 is not fully polarized. It originates from second-order scattering of acoustic branches at the Brillouin-zone boundary Ogita et al. (2003), where the flat dispersion gives rise to a large density of states. From this peak, we infer that the maximum of the acoustic phonon frequency is around 100 cm-1, which is consistent with the INS data Kunii et al. (1997). Another feature at 373 cm-1 shows larger T2g contribution and smaller Eg contribution. It is the CF excitation discussed in SubSec. III.3. The peak at 1400 cm-1 has strong A1g contribution and very weak Eg contribution. It results from second-order scattering of the T2g phonon mode Ogita et al. (2003). The symmetry-decomposed spectra further reveal an A1g peak at 1158 cm-1, which was not reported previously. This peak might correspond to the summation mode of the 373 cm-1 CF excitation and the T2g phonon mode. Such coupling has been observed in another -electron system UO2 Livneh (2008).
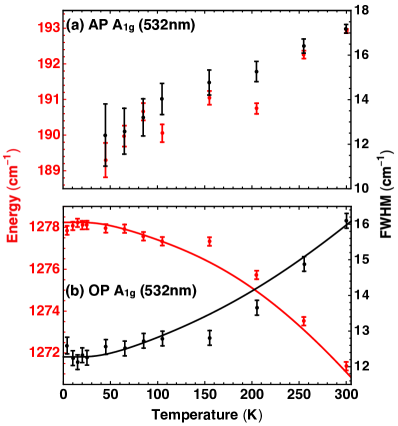
In Fig. 10 we show the temperature dependence of the energy and FWHM of the A1g contribution of the second-order acoustic mode, and the A1g optical mode. The spectral parameters of the phonon modes were obtained by fitting the measured spectral peaks with a Lorentzian lineshape.
Temperature dependence of the phonon energy and FWHM is usually described by anharmonic effects. In most cases, the three-phonon processes renders the fastest relaxation, and higher-order processes can be neglected. Furthermore, the A1g optical mode at point has the highest frequency among all the phonon branches of CeB6 Gürel and Eryiğit (2010); hence we only need to consider processes in which one A1g optical mode at point decays into two phonon modes satisfying conservation of energy and momentum 666There are other constraints which the decay processes must satisfy. For example, the spontaneous decay of a phonon by anharmonic processes of any order into a set of phonons of higher phase velocity is impossible Lax et al. (1981).. We use an generalized anharmonic decay model assuming multiple decay channels; for every channel, the decay products can be two acoustic modes, an optical plus an acoustic modes, or two acoustic modes Wallis et al. (1966); Balkanski et al. (1983) 777Because in CeB6 the maximum acoustic phonon frequency is around 100 cm-1, for the high-frequency A1g mode decay into two acoustic modes is impossible.:
| (8) |
| (9) |
where the subscript indicates the decay channel. and are factors reflecting the relative importance of the various decay channels. and are the energy of the decay products in the decay channel labelled by . and correspond to the zero-temperature phonon energy and the FWHM, respectively. accounts for the temperature-independent part of the FWHM originating not from anharmonic decay processes, but from, for example, imperfection of the sample.
Both and are proportional to
| (10) |
where is the anharmonic coefficient; and are the wavevector of the decay products in the decay channel labelled by ; represents the Dirac -function.
Referring to the calculated phonon dispersion Gürel and Eryiğit (2010), we expect two decay channels for the 1278 cm-1 A1g phonon: (1) decay into one 684 cm-1 optical phonon and one 594 cm-1 optical phonon with opposite momenta; (2) decay into one 1178 cm-1 optical phonon near +R point and one 100 cm-1 acoustic phonon near -R point.
The two phonon branches involved in the decay channel (1) is essentially flat over the whole Brillouin zone; hence a large number of states are available for the decay to happen. On the contrary, for the two phonon branches of the decay channel (2), only states near R point simultaneous satisfy the requirements of energy and momentum conservation. Therefore, the decay channel (1) would dominate if the anharmonic coefficient is not significantly different for the two channels.
| 1309.00.1 | 28.120.05 | 2.6640.003 |
| 1.070.08 | 8.40.2 | 1.760.01 |
The fitting results of the anharmonic decay model are summarized in Table 3. Indeed, > and > . The temperature-independent is much smaller than , indicating not only that the lineshape broadening mainly results from the anharmonic decay, but also that the sample is of excellent quality. In contrast to the behavior of the A1g optical mode, the second-order scattering of acoustic modes in the A1g channel shows decreasing energy on cooling [Fig. 10(a)]. The 2% softening might be a prelude to the AFQ ordering.
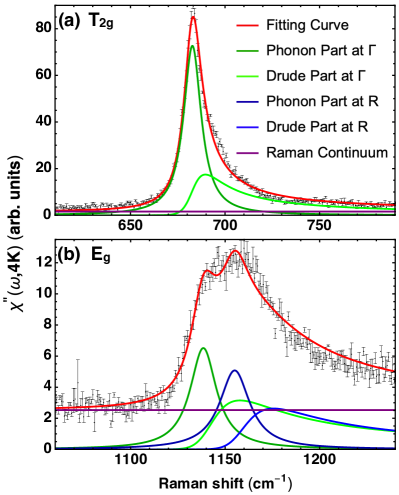
We attribute the apparent asymmetric lineshape of the T2g and Eg optical phonon modes to the coupling between these phonons and the low-frequency fluctuations [SubSection. III.5]. The observed spectral lineshapes are resulted from convolution of the phononic Lorentzian and Drude-like function describing the low-lying fluctuations. We use the following expression to fit modes’ lineshape at 4 K:
| (11) |
In Eq. (11), the first term describes the bare phonon part, while the second and third terms correspond to the Stokes and anti-Stokes of the phonon assisted electronic scattering. The summation runs over all the -points in the Brillouin zone. Referring to the calculated phonon dispersion Gürel and Eryiğit (2010), the T2g mode belongs to a flat branch over the Brillouin zone, while the Eg mode belongs a dispersive branch which has high DOS at and points Gürel and Eryiğit (2010). Therefore, for the latter case we only consider coupling at and points. In this equation, is the phonon light-scattering vertex; is the phonon frequency; is the FWHM of the bare phonon Lorentzian function; measures the relaxation rate of the Drude function; represents the electron-phonon coupling strength; and is the Heaviside step function.
For the T2g mode, we choose to be 3.0 cm-1, which is consistent with the measured value of the T1g quasi-elastic fluctuations at 16 K. For the Eg mode, we choose both and to be 11 cm-1, which is consistent with the measured value of the A1g quasi-elastic fluctuations at 16 K. We further require that and are the same.
The fitting results of the T2g and Eg composite modes are shown in Fig. 11 and summarized in Table 4. The dip of the fitting curve in Fig. 11(b) results from the negligence of the contributions at -points between and points. The FWHM of the bare T2g phonon mode (11 cm-1) is similar to that of the A1g phonon mode (12 cm-1), while the FWHM of the bare Eg phonon mode (17 cm-1) is larger. This large Eg FWHM, again, is an artifact caused by negligence of the contributions from remaining -points. The energy difference between the Eg mode at and points is 17 cm-1, which is comparable to the calculated difference of 30 cm-1 Gürel and Eryiğit (2010).
| Parameter (Units) | T2g Mode | Eg Mode |
|---|---|---|
| (a.u.) | 20.290.03 | 7.40.4 |
| (cm-1) | 5.670.02 | 8.50.5 |
| (cm-1) | 682.730.02 | 1138.40.3 |
| (a.u.) | 7.00.8 | |
| (cm-1) | 101 | |
| (cm-1) | 1155.00.5 | |
| (cm-1) | 0.6910.005 | 2.20.2 |
III.5 Quasi-Elastic Excitations
In Fig. 12 we show the symmetry-decomposed Raman response measured with 752 nm excitation at 300 K and 16 K. The low-energy Raman response shows quasi-elastic features which can be described by a Drude lineshape:
| (12) |
where is the light-scattering vertex and measures the fluctuation rate.
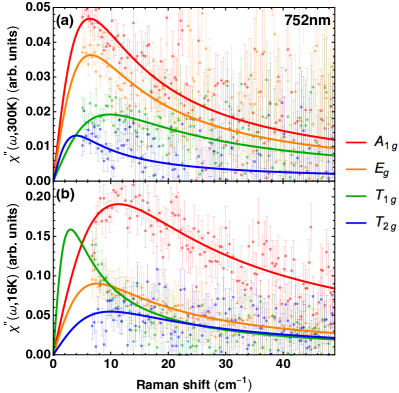
The Raman response gets enhanced in all the channels on cooling. Especially, the T1g Raman response changes qualitatively and develops into a strong quasi-elastic feature at low temperature. The basis functions of the T1g representation in Oh group transform as the three components of angular momentum, which behave as a pseudovector Koster (1963). This transformation property indicates that the observed quasi-elastic peak in T1g channel may have a magnetic origin.
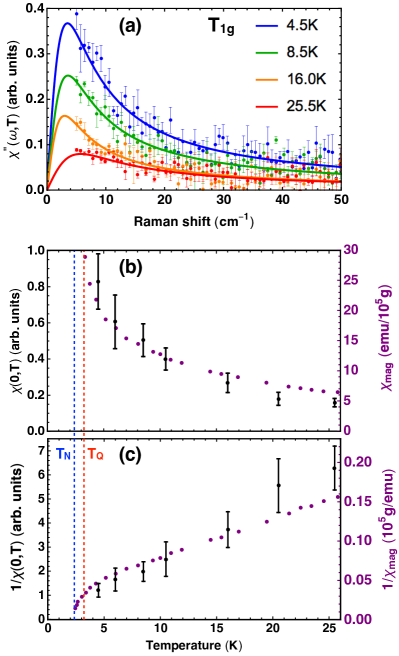
We measured the temperature dependence of Raman response in the XY scattering geometry, in which T1g+T2g symmetry components are probed. Since T2g signal at low-temperature is nearly constant [Fig. 12(b)], we fit the Raman response with the sum of Drude and constant terms, and then remove the constant part to obtain the desired T1g component SM . The T1g Raman response obtained this way is shown in Fig. 13(a). The quasi-elastic excitation in T1g symmetry channel becomes significant below 20 K, and its intensity increases on further cooling. The static Raman susceptibility, , plotted in Fig. 13(b) is obtained from the Raman response by virtue of Kramers-Kronig relation: . Drude function in Eq. (12) is used to extrapolate below 4 cm-1. In Fig. 13(b) and (c), the temperature dependence of the static Raman susceptibility is compared with that of the magnetic susceptibility Kawakami et al. (1980). The fact that the temperature dependence of both quantities follows the same trend further supports the magnetic origin of the quasi-elastic peak in T1g symmetry channel Kung et al. (2015).
In zero magnetic field, Raman scattering data cannot determine whether the observed T1g quasi-elastic response is of FM or AFM origin. Nevertheless, the Raman-measured T1g quasi-elastic response is consistent with the FM correlations studied by INS: without external magnetic field and above TQ, the magnitude of the INS-measured zone-center quasi-elastic peak decreases on warming Jang et al. (2014). We note by passing that a first-principle calculation for CeB6 indicates that the expected values of both -orbital occupancy and total angular momentum exhibit an obvious anomalies around 20 K Lu and Huang (2017). This is the same temperature around which the T1g quasi-elastic Raman response starts to develop.
The mechanism responsible for the FM correlations can be understood as follows Schlottmann (2012). Consider the two electrons at neighboring Ce3+ sites. In the staggered orbital-ordering phase, the orbital part of the total wavefunction of these two electrons is antisymmetric. Due to the resulting exchange interaction, the spins at neighboring Ce3+ sites are FM correlated.
The CF ground state of Oh group has zero quadrupole moment. If the site symmetry is reduced from Oh group to D4h group, the state of Oh group would be split into the and states of D4h group. The and states can only have quadrupole moments of or type, rather than the proposed , , and type. Hence, only when the site symmetry is reduced to D2h group, and the state of Oh group is split into two states of D2h group, can the CF ground state carries finite quadrupole moments of , , and type. However, in a continuous second-order phase transition, the symmetry of the system cannot be directly reduced from cubic to orthorhombic, which violates Landau theory Landau and Lifshitz (1980). Theories which claim an AFQ phase with Oxy-type moments using a localized picture should address this difficulty. Inconsistency of the AFQ description has also been suggested based on magnetic-susceptibility anisotropy and magnetostriction measurements Amara and Galéra (2012).
IV Conclusion
In summary, we have employed optical secondary-emission spectroscopy to study the spin-orbital coupling (SOC), electronic crystal-field (CF) excitations, electron-phonon interaction and long-wavelength magnetic fluctuations in the heavy-fermion metal CeB6.
Ce3+ ions have a single electron in the -shell. The SOC splits the degenerate 4f levels into a lower-energy multiplet and a higher-energy multiplet, with a separation of around 2000 cm-1, from which we estimate the SOC strength =610 cm-1.
The two multiplets are further split into five Kramers-degenerate CF states by the cubic CF potential. The multiplet is composed of one quartet ground state and one doublet excited state, and the multiplet consists of and doublets, and a quartet states. We resolve all four electronic CF transitions: 380 cm-1 for the intra-multiplet excitation, and 2060, 2200 and 2720 cm-1 for the three inter-multiplet transitions.
On cooling, the FWHM for the and transitions first decreases from 300 K to 80 K, but then increases below 80 K. We relate the decrease of the FWHM to lattice vibration driven fluctuations of the electrostatic potential at Ce sites, which diminish on cooling. The increase of the FWHM below 80 K results from the Kondo effect, an electron-correlation effect which increases the self-energy of the excited CF states. We apply a single-ion Hamiltonian model to obtain the eigenvalues and eigenfunctions of the 4f-electron CF states. Using the Fermi Golden Rule, we also calculate the intensity of the four Raman active CF transitions and compare the calculation to the experimental data.
We study the lattice dynamics of CeB6 and analyze the temperature dependence of all Raman active phonon modes. In the phonon spectra, we interpret the asymmetric lineshape of Eg and T2g optical phonons as manifestation of electron-phonon interaction. We also identify a composite CF plus phonon excitation at 1158 cm-1.
We acquire temperature dependence of the low-energy Raman response for all Raman-allowed symmetry channels, and uncover the development of a quasi-elastic Raman response in the magnetic-dipolar T1g symmetry channel below 20 K. The corresponding static Raman susceptibility shows similar temperature dependence as the magnetic susceptibility data, which supports the interpretation of its magnetic origin. By comparing the quasi-elastic Raman scattering data with electron spin resonance and inelastic neutron scattering results, we relate this T1g spectral feature to ferromagnetic correlations.
Additionally, we detect photo-luminescence emission centered at 1.95 eV at room temperature. We relate this emission to recombination of the electron-hole excitations between the 5d- and 4f-bands.
The experimental methods, models, and analyses demonstrated in this study can be applied to a range of systems, especially for rare-earth materials containing localized f-electrons of Ce3+ or Yb3+ ions at high-symmetry crystallographic sites Ye et al. (2019). The approach could enable us to probe ferroquadrupolar (FQ) fluctuations in TmAg2 (TFQ = 5.0 K) Morin and Rouchy (1993) or TmAu2 (TFQ = 7.0 K) Kosaka et al. (1998) systems, to name a few examples. Also, magnetic correlation induced by quadrupolar ordering could be probed in antiferroquadrupolar (AFQ) systems, for instance in UPd3 (multiple AFQ phases, with the highest TAFQ = 7.6 K) Lingg et al. (1999), NpO2 (TAFQ = 25.0 K) Paixão et al. (2002), or DyB2C2 (TAFQ = 24.7 K) Hirota et al. (2000).
Acknowledgements.
We are grateful to K. Haule and P. Coleman for discussions. We thank A. Lee for participating in the early data acquisition. The spectroscopic work at Rutgers (M.Y., H.-H.K, G.B.) was supported by NSF Grant No. DMR-1709161. Sample synthesis at Los Alamos was performed under the auspices of the U.S. Department of Energy, Office of Basic Energy Sciences, Division of Materials Science and Engineering. G.B. also acknowledges the QuantEmX grant from ICAM, the Gordon and Betty Moore Foundation through Grant No. GBMF5305 allowing G.B. to make a collaborative visit to Stanford. Work at NICBP was supported by IUT23-3 grant.References
- Imada et al. (1998) Masatoshi Imada, Atsushi Fujimori, and Yoshinori Tokura, “Metal-insulator transitions,” Rev. Mod. Phys. 70, 1039–1263 (1998).
- Dagotto (2005) Elbio Dagotto, “Complexity in strongly correlated electronic systems,” Science 309, 257–262 (2005).
- Moore and van der Laan (2009) Kevin T. Moore and Gerrit van der Laan, “Nature of the states in actinide metals,” Rev. Mod. Phys. 81, 235–298 (2009).
- Pfleiderer (2009) Christian Pfleiderer, “Superconducting phases of -electron compounds,” Rev. Mod. Phys. 81, 1551–1624 (2009).
- Kuramoto et al. (2009) Yoshio Kuramoto, Hiroaki Kusunose, and Annamária Kiss, “Multipole orders and fluctuations in strongly correlated electron systems,” J. Phys. Soc. Jpn. 78, 072001 (2009).
- Santini et al. (2009) Paolo Santini, Stefano Carretta, Giuseppe Amoretti, Roberto Caciuffo, Nicola Magnani, and Gerard H. Lander, “Multipolar interactions in -electron systems: The paradigm of actinide dioxides,” Rev. Mod. Phys. 81, 807–863 (2009).
- Cameron et al. (2016) Alistair S Cameron, Gerd Friemel, and Dmytro S Inosov, “Multipolar phases and magnetically hidden order: review of the heavy-fermion compound ,” Rep. Prog. Phys. 79, 066502 (2016).
- Suzuki et al. (2018) Michi-To Suzuki, Hiroaki Ikeda, and Peter M. Oppeneer, “First-principles theory of magnetic multipoles in condensed matter systems,” J. Phys. Soc. Jpn. 87, 041008 (2018).
- Cox (1987) D. L. Cox, “Quadrupolar kondo effect in uranium heavy-electron materials?” Phys. Rev. Lett. 59, 1240–1243 (1987).
- Kotegawa et al. (2003) H. Kotegawa, M. Yogi, Y. Imamura, Y. Kawasaki, G.-q. Zheng, Y. Kitaoka, S. Ohsaki, H. Sugawara, Y. Aoki, and H. Sato, “Evidence for Unconventional Strong-Coupling Superconductivity in : An Sb Nuclear Quadrupole Resonance Study,” Phys. Rev. Lett. 90, 027001 (2003).
- Morin and Rouchy (1993) P. Morin and J. Rouchy, “Quadrupolar ordering in tetragonal ,” Phys. Rev. B 48, 256–268 (1993).
- Kosaka et al. (1998) Masashi Kosaka, Hideya Onodera, Kenji Ohoyama, Masayoshi Ohashi, Yasuo Yamaguchi, Shintaro Nakamura, Terutaka Goto, Hisao Kobayashi, and Susumu Ikeda, “Quadrupolar ordering and magnetic properties of tetragonal ,” Phys. Rev. B 58, 6339–6345 (1998).
- Hirota et al. (2000) K. Hirota, N. Oumi, T. Matsumura, H. Nakao, Y. Wakabayashi, Y. Murakami, and Y. Endoh, “Direct Observation of Antiferroquadrupolar Ordering: Resonant X-Ray Scattering Study of ,” Phys. Rev. Lett. 84, 2706–2709 (2000).
- Paixão et al. (2002) J. A. Paixão, C. Detlefs, M. J. Longfield, R. Caciuffo, P. Santini, N. Bernhoeft, J. Rebizant, and G. H. Lander, “Triple- Octupolar Ordering in ,” Phys. Rev. Lett. 89, 187202 (2002).
- Tsujimoto et al. (2014) Masaki Tsujimoto, Yosuke Matsumoto, Takahiro Tomita, Akito Sakai, and Satoru Nakatsuji, “Heavy-Fermion Superconductivity in the Quadrupole Ordered State of ,” Phys. Rev. Lett. 113, 267001 (2014).
- Takase et al. (1980) A. Takase, K. Kojima, T. Komatsubara, and T. Kasuya, “Electrical resistivity and magnetoresistance of ,” Solid State Commun. 36, 461–464 (1980).
- Fujita et al. (1980) T. Fujita, M. Suzuki, T. Komatsubara, S. Kunii, T. Kasuya, and T. Ohtsuka, “Anomalous specific heat of ,” Solid State Commun. 35, 569 – 572 (1980).
- Burlet et al. (1982) P. Burlet, J. Rossat‐Mignod, J. M. Effantin, T. Kasuya, S. Kunii, and T. Komatsubara, “Magnetic ordering in cerium hexaboride ,” J. Appl. Phys. 53, 2149–2151 (1982).
- Zaharko et al. (2003) O. Zaharko, P. Fischer, A. Schenck, S. Kunii, P.-J. Brown, F. Tasset, and T. Hansen, “Zero-field magnetic structure in reinvestigated by neutron diffraction and muon spin relaxation,” Phys. Rev. B 68, 214401 (2003).
- Hironori Nakao and Ko-ichi Magishi and Yusuke Wakabayashi and Youichi Murakami and Kuniyuki Koyama and Kazuma Hirota and Yasuo Endoh and Satoru Kunii (2001) Hironori Nakao and Ko-ichi Magishi and Yusuke Wakabayashi and Youichi Murakami and Kuniyuki Koyama and Kazuma Hirota and Yasuo Endoh and Satoru Kunii, “Antiferro-Quadrupole Ordering of Studied by Resonant X-Ray Scattering,” J. Phys. Soc. Jpn. 70, 1857–1860 (2001).
- Nakamura et al. (1994) Shintaro Nakamura, Terutaka Goto, Satoru Kunii, Katsuhiko Iwashita, and Akira Tamaki, “Quadrupole-strain interaction in rare earth hexaborides,” J. Phys. Soc. Jpn. 63, 623–636 (1994).
- Hanzawa (2000) Katsurou Hanzawa, “Hyperfine Interactions in ,” J. Phys. Soc. Jpn. 69, 510–525 (2000).
- Kunimori et al. (2012) Keisuke Kunimori, Masafumi Sera, Hiroshi Tanida, Takeshi Matsumura, and Fumitoshi Iga, “New Type of the Domain-Redistribution at Low Magnetic Fields in Phase II of ,” J. Phys. Soc. Jpn. 81, 104706 (2012).
- Matsumura et al. (2009) Takeshi Matsumura, Takumi Yonemura, Keisuke Kunimori, Masafumi Sera, and Fumitoshi Iga, “Magnetic Field Induced Octupole in Probed by Resonant X-Ray Diffraction,” Phys. Rev. Lett. 103, 017203 (2009).
- Matsumura et al. (2012) Takeshi Matsumura, Takumi Yonemura, Keisuke Kunimori, Masafumi Sera, Fumitoshi Iga, Tatsuya Nagao, and Jun-ichi Igarashi, “Antiferroquadrupole order and magnetic field induced octupole in CeB6,” Phys. Rev. B 85, 174417 (2012).
- Schlottmann (2012) P. Schlottmann, “Electron spin resonance in antiferro-quadrupolar-ordered CeB6,” Phys. Rev. B 86, 075135 (2012).
- Demishev et al. (2009) S. V. Demishev, A. V. Semeno, A. V. Bogach, N. A. Samarin, T. V. Ishchenko, V. B. Filipov, N. Yu. Shitsevalova, and N. E. Sluchanko, “Magnetic spin resonance in ,” Phys. Rev. B 80, 245106 (2009).
- Portnichenko et al. (2016) P. Y. Portnichenko, S. V. Demishev, A. V. Semeno, H. Ohta, A. S. Cameron, M. A. Surmach, H. Jang, G. Friemel, A. V. Dukhnenko, N. Yu. Shitsevalova, V. B. Filipov, A. Schneidewind, J. Ollivier, A. Podlesnyak, and D. S. Inosov, “Magnetic field dependence of the neutron spin resonance in ,” Phys. Rev. B 94, 035114 (2016).
- Jang et al. (2014) Hoyoung Jang, G. Friemel, J. Ollivier, A. V. Dukhnenko, N. Yu Shitsevalova, V. B. Filipov, B. Keimer, and D. S. Inosov, “Intense low-energy ferromagnetic fluctuations in the antiferromagnetic heavy-fermion metal ,” Nat. Mater. 13, 682–687 (2014).
- Takahashi et al. (1995) T. Takahashi, T. Morimoto, T. Yokoya, S. Kunii, T. Komatsubara, and O. Sakai, “Crystal-field splitting in as observed by high-resolution photoemission,” Phys. Rev. B 52, 9140–9142 (1995).
- Koitzsch et al. (2016) A. Koitzsch, N. Heming, M. Knupfer, B. Buchner, P. Y. Portnichenko, A. V. Dukhnenko, N. Y. Shitsevalova, V. B. Filipov, L. L. Lev, V. N. Strocov, J. Ollivier, and D. S. Inosov, “Nesting-driven multipolar order in from photoemission tomography,” Nat. Commun. 7, 10876 (2016).
- Note (1) Photoemission spectroscopy probes energy states below the Fermi level, thus, ARPES cannot directly access the multiplet. However, virtual excitations to the narrow multiplet contribute to the self energy of the spectral function, making the multiplet identifiable in the photoemission spectra. Details of this mechanism can be found in Refs. Gunnarsson and Schönhammer (1983); Coleman (1984); Patthey et al. (1987).
- Koster (1963) G. F. Koster, Properties of the thirty-two point groups (M.I.T. Press, Cambridge, 1963).
- Note (2) Asterisks are used to distinguish the CF states of the multiplet (, and ) from those of the multiplet ( and ).
- Sato et al. (1984) Noriaki Sato, Satoru Kunii, Isamu Oguro, Takemi Komatsubara, and Tadao Kasuya, “Magnetic Properties of Single Crystals of ,” J. Phys. Soc. Jpn. 53, 3967–3979 (1984).
- Zirngiebl et al. (1984) E. Zirngiebl, B. Hillebrands, S. Blumenröder, G. Güntherodt, M. Loewenhaupt, J. M. Carpenter, K. Winzer, and Z. Fisk, “Crystal-field excitations in studied by Raman and neutron spectroscopy,” Phys. Rev. B 30, 4052–4054 (1984).
- Sakai et al. (1997) Osamu Sakai, Ryousuke Shiina, Hiroyuki Shiba, and Peter Thalmeier, “A New Interpretation of NMR in Quadrupolar Ordering Phase of - Consistency with Neutron Scattering -,” J. Phys. Soc. Jpn. 66, 3005–3007 (1997).
- Sundermann et al. (2017) M. Sundermann, K. Chen, H. Yavaş, Hanoh Lee, Z. Fisk, M. W. Haverkort, L. H. Tjeng, and A. Severing, “The quartet ground state in : An inelastic x-ray scattering study,” Europhys. Lett. 117, 17003 (2017).
- Loewenhaupt et al. (1985) M. Loewenhaupt, J. M. Carpenter, and C. K. Loong, “Magnetic excitations in ,” J. Magn. Magn. Mater. 52, 245–249 (1985).
- Hayes and Loudon (2004) W. Hayes and R. Loudon, Scattering of Light by Crystals (Dover Publications, London, 2004).
- Schaack (2000) G. Schaack, “Raman scattering by crystal-field excitations,” in Light Scattering in Solids VII, edited by M. Cardona and G. Güntherodt (Springer, Berlin, 2000) pp. 30–179.
- Güntherodt et al. (1987) G. Güntherodt, E. Zirngiebl, R. Mock, H. Brenten, S. Blumenröder, G. Pofahl, and Z. Fisk, “Raman and brillouin scattering spectroscopy of intermediate valence and heavy fermion compounds,” in Theoretical and Experimental Aspects of Valence Fluctuations and Heavy Fermions, edited by L. C. Gupta and S. K. Malik (Springer, Boston, 1987) pp. 261–268.
- Foroozani et al. (2015) N. Foroozani, J. Lim, G. Fabbris, P.F.S. Rosa, Z. Fisk, and J.S. Schilling, “Suppression of dense Kondo state in under pressure,” Physica B 457, 12 – 16 (2015).
- Canfield and Fisk (1992) P. C. Canfield and Z. Fisk, “Growth of single crystals from metallic fluxes,” Philos. Mag. B 65, 1117–1123 (1992).
- Note (3) We mainly followed the procedure discussed in Ref. Maksimov et al. (1992) to estimate the laser heating. The optical absorption coefficient data were extracted from the optical data Kimura et al. (1990, 1992, 1994), while the thermal conductivity data were taken from Ref. Sera et al. (1996).
- (46) See Supplemental Material at [URL will be inserted by publisher] for details of analysis of Raman data and for calculation of the crystal field state eigenfunctions, which includes Refs. Hayes and Loudon (2004); Loudon (1964); Klein (1981); Nyhus et al. (1997); Fazekas (1999).
- Kimura et al. (1990) S. Kimura, T. Nanba, S. Kunii, T. Suzuki, and T. Kasuya, “Anomalous infrared absorption in rare-earth hexaborides,” Solid State Commun. 75, 717 – 720 (1990).
- Kimura et al. (1992) S. Kimura, T. Nanba, M. Tomikawa, S. Kunii, and T. Kasuya, “Electronic structure of rare-earth hexaborides,” Phys. Rev. B 46, 12196–12204 (1992).
- Kimura et al. (1994) Shin-ichi Kimura, Takao Nanba, Satoru Kunii, and Tadao Kasuya, “Low-energy optical excitation in rare-earth hexaborides,” Phys. Rev. B 50, 1406–1414 (1994).
- Kitamura (1994) Michihide Kitamura, “ levels of rare-earth hexaborides: A simple approach based on a modified orthogonalized-plane-wave method and a self-consistent-field atomic-structure calculation,” Phys. Rev. B 49, 1564–1573 (1994).
- Suvasini et al. (1996) M. B. Suvasini, G. Y. Guo, W. M. Temmerman, G. A. Gehring, and M. Biasini, “The Fermi surface of ,” J. Phys.: Condens. Matter 8, 7105 (1996).
- Neupane et al. (2015) Madhab Neupane, Nasser Alidoust, Ilya Belopolski, Guang Bian, Su-Yang Xu, Dae-Jeong Kim, Pavel P. Shibayev, Daniel S. Sanchez, Hao Zheng, Tay-Rong Chang, Horng-Tay Jeng, Peter S. Riseborough, Hsin Lin, Arun Bansil, Tomasz Durakiewicz, Zachary Fisk, and M. Zahid Hasan, “Fermi surface topology and hot spot distribution in the Kondo lattice system ,” Phys. Rev. B 92, 104420 (2015).
- Note (4) The energy of the transition shows monotonic temperature dependence. The earlier reports, Ref. Zirngiebl et al. (1984); Loewenhaupt et al. (1985), showed no temperature dependence of the transition energy on cooling from 300\tmspace+.1667emK to 20\tmspace+.1667emK, followed by a rapidly hardening on cooling below 20\tmspace+.1667emK.
- Nolas et al. (1994) G. S. Nolas, V. G. Tsoukala, S. K. Gayen, and Glen A. Slack, “Electronic-raman-scattering study of the low-lying energy levels of trivalent cerium-doped yttria,” Phys. Rev. B 50, 150–157 (1994).
- Williams et al. (1989) G. M. Williams, P. C. Becker, J. G. Conway, N. Edelstein, L. A. Boatner, and M. M. Abraham, “Intensities of electronic Raman scattering between crystal-field levels of in : Nonresonant and near-resonant excitation,” Phys. Rev. B 40, 4132–4142 (1989).
- Hewson (1993) A. C. Hewson, The Kondo problem to heavy fermions (Cambridge University Press, Cambridge, 1993).
- Amusia et al. (2015) M. Ya. Amusia, K. G. Popov, V. R. Shaginyan, and V. A. Stephanovich, Theory of Heavy-Fermion Compounds (Springer, Switzerland, 2015).
- Terzioglu et al. (2001) Cabir Terzioglu, D. A. Browne, R. G. Goodrich, A. Hassan, and Z. Fisk, “EPR and magnetic susceptibility measurements on ,” Phys. Rev. B 63, 235110 (2001).
- Lea et al. (1962) K. R. Lea, M. J. M. Leask, and W. P. Wolf, “The raising of angular momentum degeneracy of f-electron terms by cubic crystal fields,” J. Phys. Chem. Solids 23, 1381–1405 (1962).
- Stevens (1952) K. W. H. Stevens, “Matrix elements and operator equivalents connected with the magnetic properties of rare earth ions,” Proc. Phys. Soc. A 65, 209 (1952).
- Note (5) When comparing the CF coefficients across different literature, additional constants are needed Hutchings (1964); Kassman (1970).
- Tanaka and Ōnuki (2002) Kiyoaki Tanaka and Yoshichika Ōnuki, “Observation of 4f electron transfer from Ce to B6 in the Kondo crystal CeB6 and its mechanism by multi-temperature X-ray diffraction,” Acta Cryst. B 58, 423–436 (2002).
- Devereaux and Hackl (2007) Thomas P. Devereaux and Rudi Hackl, “Inelastic light scattering from correlated electrons,” Rev. Mod. Phys. 79, 175–233 (2007).
- Axe (1964) J. D. Axe, “Two-photon processes in complex atoms,” Phys. Rev. 136, A42–A45 (1964).
- Kiel et al. (1969) A. Kiel, T. Damen, S. P. S. Porto, S. Singh, and F. Varsanyi, “Electronic Raman Effect in Paramagnetic Crystals: Ce,” Phys. Rev. 178, 1518–1524 (1969).
- Zirngiebl et al. (1986) E. Zirngiebl, S. Blumenröder, R. Mock, and G. Güntherodt, “Relation of phonon anomalies to charge fluctuation rates in intermediate valence compounds,” J. Magn. Magn. Mater. 54-57, 359 – 360 (1986).
- Ogita et al. (2003) Norio Ogita, Shinji Nagai, Naoki Okamoto, Masayuki Udagawa, Fumitoshi Iga, Masafumi Sera, Jun Akimitsu, and Satoru Kunii, “Raman scattering investigation of La, Ce, Pr, Sm, Gd, Dy, and Yb),” Phys. Rev. B 68, 224305 (2003).
- Kunii et al. (1997) Satoru Kunii, Jean M. Effantin, and Jean Rossat-Mingnod, “Lattice Dynamics in Studied by Neutron-Scattering and Specific-Heat Measurements,” J. Phys. Soc. Jpn. 66, 1029–1032 (1997).
- Livneh (2008) Tsachi Livneh, “Coupling of multi-LO phonons to crystal-field excitations in studied by Raman spectroscopy,” J. Phys.: Condens. Matter 20, 085202 (2008).
- Wallis et al. (1966) R. F. Wallis, I. P. Ipatova, and A. A. Maradudin, “Temperature Dependence of the Width of the Fundamental Lattice-Vibration Absorption Peak in Ionic Crystals,” Soviet Phys. Solid State 8, 850–861 (1966).
- Balkanski et al. (1983) M. Balkanski, R. F. Wallis, and E. Haro, “Anharmonic effects in light scattering due to optical phonons in silicon,” Phys. Rev. B 28, 1928–1934 (1983).
- Gürel and Eryiğit (2010) Tanju Gürel and Resul Eryiğit, “Ab initio lattice dynamics and thermodynamics of rare-earth hexaborides and ,” Phys. Rev. B 82, 104302 (2010).
- Note (6) There are other constraints which the decay processes must satisfy. For example, the spontaneous decay of a phonon by anharmonic processes of any order into a set of phonons of higher phase velocity is impossible Lax et al. (1981).
- Note (7) Because in CeB6 the maximum acoustic phonon frequency is around 100\tmspace+.1667emcm-1, for the high-frequency A1g mode decay into two acoustic modes is impossible.
- Kawakami et al. (1980) M. Kawakami, S. Kunii, T. Komatsubara, and T. Kasuya, “Magnetic properties of single crystal,” Solid State Commun. 36, 435 – 439 (1980).
- Kung et al. (2015) H.-H. Kung, R. E. Baumbach, E. D. Bauer, V. K. Thorsmølle, W.-L. Zhang, K. Haule, J. A. Mydosh, and G. Blumberg, “Chirality density wave of the “hidden order” phase in ,” Science 347, 1339–1342 (2015).
- Lu and Huang (2017) Haiyan Lu and Li Huang, “Anomaly in the temperature-dependent electronic structure of the heavy-fermion compound : A theoretical investigation by means of a first-principles many-body approach,” Phys. Rev. B 95, 155140 (2017).
- Landau and Lifshitz (1980) L. D. Landau and E. M. Lifshitz, “Chapter xiv - phase transitions of the second kind and critical phenomena,” in Statistical Physics (Butterworth-Heinemann, Oxford, 1980) 3rd ed., pp. 446 – 516.
- Amara and Galéra (2012) M. Amara and R.-M. Galéra, “ Macroscopically Revisited,” Phys. Rev. Lett. 108, 026402 (2012).
- Ye et al. (2019) Mai Ye, E. W. Rosenberg, I. R. Fisher, and G. Blumberg, “Lattice dynamics, crystal-field excitations, and quadrupolar fluctuations of ,” Phys. Rev. B 99, 235104 (2019).
- Lingg et al. (1999) N. Lingg, D. Maurer, V. Müller, and K. A. McEwen, “Ultrasound investigations of orbital quadrupolar ordering in ,” Phys. Rev. B 60, R8430–R8433 (1999).
- Gunnarsson and Schönhammer (1983) O. Gunnarsson and K. Schönhammer, “Electron spectroscopies for Ce compounds in the impurity model,” Phys. Rev. B 28, 4315–4341 (1983).
- Coleman (1984) Piers Coleman, “New approach to the mixed-valence problem,” Phys. Rev. B 29, 3035–3044 (1984).
- Patthey et al. (1987) F. Patthey, W. D. Schneider, Y. Baer, and B. Delley, “High-temperature collapse of the Kondo resonance in observed by photoemission,” Phys. Rev. Lett. 58, 2810–2813 (1987).
- Maksimov et al. (1992) A.A. Maksimov, A.V. Puchkov, I.I. Tartakovskii, V.B. Timofeev, D. Reznik, and M.V. Klein, “Investigations of the temperature dependence of the low energy electronic Raman scattering in single crystals,” Solid State Commun. 81, 407 – 410 (1992).
- Sera et al. (1996) M. Sera, S. Kobayashi, M. Hiroi, N. Kobayashi, and S. Kunii, “Thermal conductivity of () single crystals,” Phys. Rev. B 54, R5207–R5210 (1996).
- Loudon (1964) R. Loudon, “The Raman effect in crystals,” Advances in Physics 13, 423–482 (1964).
- Klein (1981) M. V. Klein, “Theory of two-phonon Raman scattering in transition metals and compounds,” Phys. Rev. B 24, 4208–4223 (1981).
- Nyhus et al. (1997) P. Nyhus, S. L. Cooper, Z. Fisk, and J. Sarrao, “Low-energy excitations of the correlation-gap insulator : A light-scattering study,” Phys. Rev. B 55, 12488–12496 (1997).
- Fazekas (1999) P. Fazekas, Lecture notes on electron correlation and magnetism (World Scientific Publishing, Singapore, 1999).
- Hutchings (1964) M.T. Hutchings, “Point-charge calculations of energy levels of magnetic ions in crystalline electric fields,” Solid State Phys. 16, 227 – 273 (1964).
- Kassman (1970) Allen J. Kassman, “Relationship between the coefficients of the tensor operator and operator equivalent methods,” J. Chem. Phys. 53, 4118–4119 (1970).
- Lax et al. (1981) M. Lax, P. Hu, and V. Narayanamurti, “Spontaneous phonon decay selection rule: and processes,” Phys. Rev. B 23, 3095–3097 (1981).
Supplemental Material for:
Raman spectroscopy of -electron metals: An example of CeB6
Appendix A Analysis of Raman Spectra
A.1 Subtraction of Photo-Luminescence
The measured secondary-emission intensity is related to the Raman response by , where n is the Bose factor, is energy, is temperature, and represents photo-luminescence. Spectra taken with 752 nm excitation are subtracted by a constant [Fig. S1 (a)], while those taken with 532 and 476 nm excitations are subtracted by a linear function of frequency [Fig. S1 (b) and (c)].
A.2 Thermal Factor for Second-Order Acoustic-Phonon Scattering
For first-order scattering processes, the scattering intensity is given by the expression Hayes and Loudon (2004), where is the Bose factor, is the response function, is excitation energy and is temperature. However, for the second-order acoustic-phonon scattering process observed in our study, assuming the two constitute acoustic phonons have the same energy, the expression should be modified to .
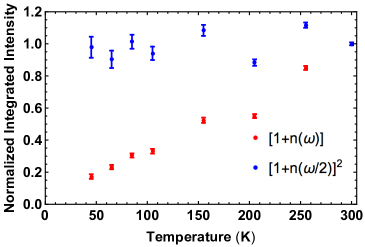
The reason for the modification is as follows. Second-order Raman scattering can result from either two successive first-order interactions, or one second-order interaction Loudon (1964). In the first case, the thermal factor should be used. However, it is essential that first-order scattering should be allowed for the two constituent excitations individually. Because the wavevector of visible light is much smaller than the Brillouin-zone size, first-order scattering of acoustic modes at the Brillouin-zone boundary is not allowed. The second-order Raman scattering of acoustic modes observed in our study, therefore, originates from the scattering process in which the light interacts with a pair of excitations in a single event. Wavevector conservation is effectively satisfied when the wavevectors of the constituent excitations are equal and opposite. In this case, assuming the two constituent excitations have the same energy, the thermal factor should be used Klein (1981); Nyhus et al. (1997); Hayes and Loudon (2004)
Using thermal factor for the second-order acoustic-phonon scattering process in CeB6 would lead to unreasonable decreasing intensity on cooling [Fig. S2]. The energy and FWHM of the peak, on the contrary, is insensitive to which thermal factor is used.
A.3 Measurement of T1g Quasi-Elastic Excitations
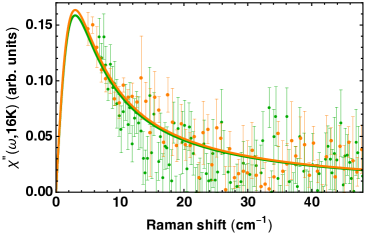
The T1g Raman response shown in Fig.12 of the Main Text is extracted from the data measured in the XY scattering geometry. We fit the Raman response with the sum of Drude and constant terms, and then remove the constant part to obtain the desired T1g component. To justify this procedure, Fig. S3 compares the 16 K T1g spectrum shown in Fig.11(b) (decomposed from the spectra measured in the XY, X’Y’ and RL scattering geometries) and in Fig.12(a) (obtained solely from the spectrum measured in the XY scattering geometry). They match well.
Appendix B Crystal-Field Eigenfunctions
The calculated eigenfunctions are given in Table S1. Because of Kramers degeneracy, every eigenfunction has a partner .
Usually, is solved within a particular multiplet in the basis of Fazekas (1999). This treatment assumes that SOC is much larger than CF potential, and inter-multiplet mixing can therefore be ignored. Without inter-multiplet mixing, the eigenfunctions are independent of the parameters and . However, Ce has the smallest SOC among the 4f lanthanides. Thus comparing the exact results with the approximate results helps to illustrate the limitations of the approximate treatment. The eigenfunctions obtained by separately diagonalizing in the and multiplets are presented in Table S2. For convenient comparison with Table S1, the results have been converted into basis. Inter-multiplet mixing occurs between and , and between and , where and . The absolute change of coefficients are larger for and states than for and states. state derived from the multiplet has no corresponding state in the multiplet; hence it has no inter-multiplet mixing, and the coefficients for state are the same in Table S1 and S2. Notice that the approximate treatment not only changes the magnitude of various coefficients, but also makes some finite coefficients vanish.
| -3 | -2 | -1 | 0 | +1 | +2 | +3 | -3 | -2 | -1 | 0 | +1 | +2 | +3 | |
|---|---|---|---|---|---|---|---|---|---|---|---|---|---|---|
| -0.033 | -0.737 | +0.675 | ||||||||||||
| +0.675 | -0.737 | -0.033 | ||||||||||||
| -0.325 | -0.325 | +0.853 | +0.250 | |||||||||||
| +0.250 | +0.853 | -0.325 | -0.325 | |||||||||||
| -0.032 | +0.723 | +0.423 | -0.546 | |||||||||||
| -0.546 | +0.423 | +0.723 | -0.032 | |||||||||||
| -0.763 | +0.455 | +0.459 | ||||||||||||
| +0.459 | +0.455 | -0.763 | ||||||||||||
| +0.477 | +0.477 | +0.152 | +0.722 | |||||||||||
| +0.722 | +0.152 | +0.477 | +0.477 | |||||||||||
| -0.816 | +0.380 | -0.267 | +0.345 | |||||||||||
| +0.345 | -0.267 | +0.380 | -0.816 | |||||||||||
| +0.645 | +0.500 | +0.577 | ||||||||||||
| +0.577 | +0.500 | +0.645 | ||||||||||||
| -3 | -2 | -1 | 0 | +1 | +2 | +3 | -3 | -2 | -1 | 0 | +1 | +2 | +3 | |
|---|---|---|---|---|---|---|---|---|---|---|---|---|---|---|
| -0.756 | +0.655 | |||||||||||||
| +0.655 | -0.756 | |||||||||||||
| -0.345 | -0.345 | +0.845 | +0.218 | |||||||||||
| +0.218 | +0.845 | -0.345 | -0.345 | |||||||||||
| -0.154 | +0.772 | +0.378 | -0.488 | |||||||||||
| -0.488 | +0.378 | +0.772 | -0.154 | |||||||||||
| -0.764 | +0.423 | +0.488 | ||||||||||||
| +0.488 | +0.423 | -0.764 | ||||||||||||
| +0.463 | +0.463 | +0.189 | +0.732 | |||||||||||
| +0.732 | +0.189 | +0.463 | +0.463 | |||||||||||
| -0.802 | +0.267 | -0.327 | +0.423 | |||||||||||
| +0.423 | -0.327 | +0.267 | -0.802 | |||||||||||
| +0.645 | +0.500 | +0.577 | ||||||||||||
| +0.577 | +0.500 | +0.645 | ||||||||||||