Multi-wavelength variability properties of CGRaBS J0733+0456: identifying a distant -ray blazar at z = 3.01
Abstract
We report on OVRO, WISE, Swift and Fermi-LAT observations of the high redshift blazar CGRaBS J0733+0456, from which significant flux variations in radio, infrared (IR) as well as -ray domains are detected. Particularly, the amplitude of long-term IR variation is over one order of magnitude and the IR variability timescale can be constrained as short as a few hours in the source frame. The IR and -ray light curves are found to be rather similar, and the strong quasi-simultaneous infrared and -ray flares are proved to be unique among the nearby -ray sources. This is the first time to identify a ray blazar at redshift with multi-wavelength flux variations (flares). Broadband spectral energy distributions in different flux states are constructed and theoretically described. The ray flares from some blazars as distant as redshift 5 are expected to be detectable for Fermi-LAT.
1 INTRODUCTION
Blazars, including flat-spectrum radio quasars (FSRQs) and BL Lacertae objects (BL Lacs), are an extreme subclass of Active Galactic Nuclei (AGNs). Their strong relativistic jets are beamed toward the observer and hence the highly variable non-thermal jet emissions are overwhelming (Blandford & Rees, 1978; Wagner & Witzel, 1995; Ulrich et al., 1997). The luminous jet emission is characterized by a universal two-bump structure in logF-log plot, where one is believed to be synchrotron emission while the other one extending to the -ray domain is usually explained as inverse Compton (IC) scattering of soft photons from either inside (the synchrotron self-Compton, or SSC) and/or outside (external Compton, or EC) the jet by the same population of relativistic electrons generating the synchrotron emission (e.g., Maraschi et al., 1992; Dermer & Schlickeiser, 1993; Sikora et al., 1994; Błażejowski et al., 2000). Meanwhile, the detection of high energy neutrino event coincident with high energy -ray flares in TXS 0506+056 suggests that at least in some cases hadronic processes also take place (IceCube Collaboration et al., 2018). Blazars at high redshifts, harboring supermassive black holes (SMBHs) heavier than one billion solar masses (Romani et al., 2004; Ghisellini et al., 2010), are valuable targets since they shed lights on the formation and growth of the first generation of super massive black holes (SMBHs) and also on the evolution of AGN jets across different cosmic times (e.g., Volonteri, 2010).
Benefiting from all-sky surveyors, like Fermi-LAT (Atwood et al., 2009) and WISE (Wright et al., 2010; Mainzer et al., 2014), along with complementary observations from radio to X-rays, multi-wavelength campaigns become a regular approach to investigate the physical mechanism of blazars. Particularly, in addition to scanning in every a half year in mid-infrared (IR) bands at 3.4 m (W1) and 4.6 m (W2), WISE also provides about one dozen of exposures within 1-2 days in each epoch. Thus, it provides a chance for the mid-IR investigations in both long-term and intraday variability (Jiang et al., 2012; Jiang, 2018; Mao et al., 2018). Correlations between -ray emission of blazars and those in other windows of electromagnetic radiation have been frequently detected (e.g., Abdo et al., 2010; Liao et al., 2014). Meanwhile, considering the relatively limited angular resolution of the -ray observation, the correlated variations are essential to pin down the association between the -ray source and its low-energy counterpart (e.g., Liao et al., 2016). However, at the high redshift regime (i.e. ), such crucial information are still lacking (Ackermann et al., 2017; Liao et al., 2018).
CGRaBS J0733+0456, first known as a radio emitter (Griffith et al., 1995) and identified as a high redshift quasar at = 3.01 (Healey et al., 2008), stands out for its large-amplitude mid-infrared variability during the systematical study of WISE flaring sources (Wang et al in preparation). Considering the significant radio variability (Gorshkov et al., 2008) and the broadband flat radio spectrum spanning from 150 MHz to 15 GHz (Richards et al., 2011; Intema et al., 2017), it is not surprised that CGRaBS J0733+0456 is suggested as a blazar (Massaro et al., 2009, 2014; Fan & Wu, 2018). However, due to the low signal to noise ratio (S/N) of the W3 band detection listed in the ALLWISE catalog, the position of CGRaBS J0733+0456 in the “WISE blazar strip” (Massaro et al., 2011) can not be well constrained. Interestingly, there is a -ray source cospatial with CGRaBS J0733+0456, named as FL8Y J0733.8+0455111https://fermi.gsfc.nasa.gov/ssc/data/access/lat/fl8y/ or 4FGL J0733.8+0455 in the fourth Fermi-LAT source catalog (The Fermi-LAT collaboration, 2019). In this Letter, multiwavelength data of CGRaBS J0733+0456 are collected and analyzed, and its broadband variability properties are reported (Section 2), along with some discussions (Section 3). We adopt a CDM cosmology with = 0.3, = 0.7, and a Hubble constant of = 70 km-1 s-1 Mpc-1.
2 DATA ANALYSIS AND RESULTS
2.1 Fermi-LAT Data
We selected the first 10-year (MJD 5468358335) SOURCE type -LAT Pass 8 data (evclass = 128 and evtype = 3) with the energy range of GeV. The analysis was carried out with the updated software Fermitools package of version 1.0.1. The data filtration was accomplished with gtselect and gtmktime tasks, by adopting a maximum zenith angle of 90 and “DATA_QUAL > 0” & “LAT_CONFIG==1”. -ray flux and spectrum were extracted by the gtlike task with unbinned likelihood algorithm. The test statistic (TS = 2log, Mattox et al. 1996) was adopted to quantify the significance level of a -ray detection, where represents the likelihood function, between models with and without the source. All 4FGL sources within 15 of 4FGL J0733.8+0455 were considered. Parameters of background sources within 10 of the target as well as two diffuse templates were left free, whereas others were frozen to be 4FGL values. After the gtlike analysis, any new -ray sources (i.e TS 25) emerged in the subsequently generated TS residual map were added into the updated background model and the likelihood fitting was then re-performed. In the temporal analysis, we removed weak background sources (i.e TS 10) from the model. When TS value of one source is smaller than 10, the pyLikelihood UpperLimits tool was adopted to calculate the 95% confidential level (C. L.) upper limit instead.
First, the analysis of the entire 10-year LAT data suggests a new -ray source not included in 4FGL. Its TS value is 85 with an optimized -ray location of R.A. 118.49 and DEC. 9.41 (95% C. L. error radius of 0.08), likely associated with a flat spectrum radio source PMN J0753+0924 (Griffith et al., 1995). After updating the background model, 4FGL J0733.8+0455 is proved as a significant (TS = 225) -ray source. Our analysis gives a 10-year averaged flux of (1.20 0.15) ph with a pow-law index of 2.450.07 (i.e. , where is the photon index), in agreement with those reported in 4FGL. Following localization analysis confirms that CGRaBS J0733+0456 is the only known blazar candiate within the 95% C. L. of -ray error radius.
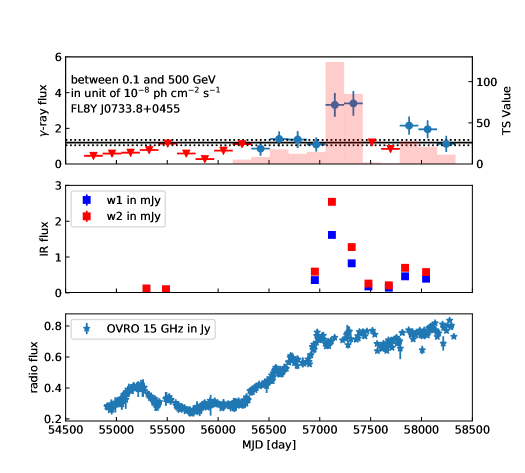
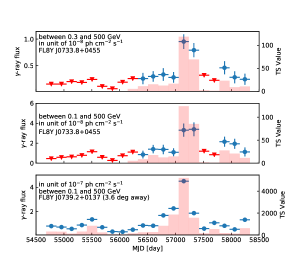
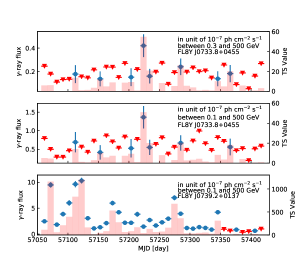
We extracted a half-year time bin -ray light curve, see Figure 1. The target is undetectable (TS 4) for Fermi-LAT until Feb. 2013, which explains its absence in the third Fermi-LAT AGN catalog (3LAC, Ackermann et al. 2015). Since then, followed by a two years period of moderate flux state, a strong -ray flare appears, with peaking flux roughly three times of the 10-year averaged flux, see Figure 2. The target is quiescent after the flare, then a mild -ray activity occurs in 2017. In consideration of a bright nearby (3.6 away) -ray source, 4FGL J0739.2+0137 (associated with PKS 0736+01), we also extracted its light curve to check its influence on the target light curve, see Figure 3. Though these two sources peaks at the same time bin, the strong flare of the target is still significant (, which is calculated by defined in Nolan et al. 2012) in 300 MeV (68% C. L. containment angle of about 3) light curve, suggesting that it is not artificial due to the flux variation of the neighbor. Furthermore, 10-day time bin -ray light curves were extracted. The separation of the peaking times of the two sources is about 100 days, which establishes the association of the strong flare with CGRaBS J0733+0456, see Figure 3. The 10-day peaking flux of CGRaBS J0733+0456 reaches (1.3 0.4) ph , with a pow-law index of 2.100.17. The corresponding -ray luminosity is erg . Although the limited statistics hampers us to search for short-term ray variability, in contrast with the first 4.5-yr 95% C. L. upper limit, ph , significant long-term -ray variability has been revealed. Meanwhile, possible spectral hardening is found compared to the result from the 10-year averaged data.
2.2 Swift Data
The Neil Gehrels Swift Observatory (Gehrels et al., 2004) observed (ObsID: 00036786001) CGRaBS J0733+0456 in Dec. 2007. The XRT photon counting mode data and the UVOT UVW2 image were analyzed with the FTOOLS software version 6.22.1. For the XRT data, initially, the event cleaning with the xrtpipeline using standard quality cuts was performed. Then the source spectra were extracted with xselect from a circular region with a radius of 20 pixels while the background one from a larger circle (i.e. 50 pixels) in a blank area. To facilitate the spectral analysis, we produced the ancillary response file taken from the CALDB database with xrtmkarf. The grouped spectra were demanded to have at least 1 count per bin using the cstat approach. Considering the 19 net photons, the absorption column density was set as the Galactic value (i.e. ) and the spectral power-law index was frozen as 1.5 which is typical among high redshift blazars (e.g., Wu et al., 2013), giving an unabsorbed 0.5-10.0 keV flux of erg (, 8.4/18; Cash 1979). For the UVW2 image, an aperture photometry, using uvotsource with a 5 arcsec circular aperture together with a background extraction in a larger source-free region, yielded no significant excess toward the target.
2.3 WISE Data
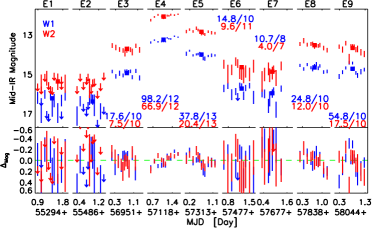
The mid-IR photometric data of CGRaBS J0733+0456 including a total of nine epochs (marked as E1…, E9) were collected from the ALLWISE and NEOWISE data release. The long-term light curves are presented in Figure 1. In order to check the long-term variations, the median magnitude values of W1 and W2 bands in each epoch were calculated222We only use the singe exposure photometry with S/N 3, and calculate the median values following our previous works (e.g., Dou et al., 2016; Jiang et al., 2016). The fluxes are in low state during the first two epochs in 2010. There is a giant mid-IR flare in 2015, the flux peaks in E4 epoch (MJD57118, 2015-4-6), which W1 (W2) band photometry gives 13.19 (12.07) magnitude. It is 3.0 (3.5) magnitude in W1 (W2) band brighter than the low-flux state in E1 and E2 epochs.
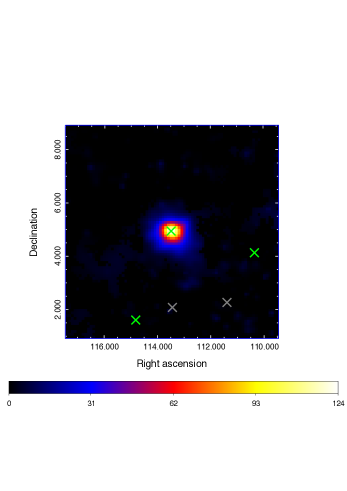
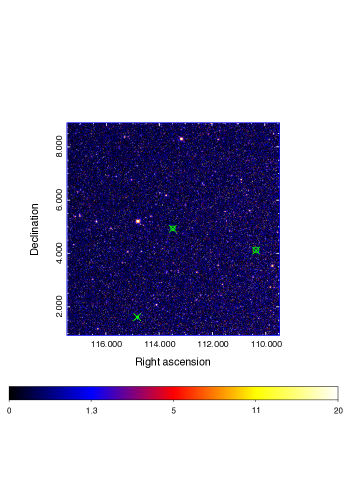
In short-term, among the 10 exposures within 1 day in each epoch, only the best-quality single-frame images (‘qual’ 0.5) were selected, see Figure 3. In most of the single exposures in the E1 and E2 epochs, only upper limits were given due to the limited S/Ns. We adopted the -statistic to search any short-term variations in other epochs with a null hypothesis of a constant flux. Significant intraday variations in W1 band were detected in E4, E5, E8 and E9 epochs (reduced ). Meanwhile, intraday variations were also detected in W2 band in E4, E5 and E9 epochs. The cross correlations between W1 and W2 band in E4, E5 and E9 epochs were then calculated. Significant cross correlations were detected in E4 and E5 epoch, with the cross correlation factors of 0.73 and 0.65, respectively. No significant cross correlation was detected in E9 epoch. The intraday variability properties in those epochs were investigated, following our previous works (e.g., Ai et al., 2010; Jiang et al., 2012). The W1 band variability amplitudes are 0.09, 0.08, 0.10 and 0.20 magnitude, respectively, in E4, E5, E8 and E9 epochs. The W2 band variability amplitudes are 0.09, 0.05, and 0.16 magnitude, respectively, in E4, E5, and E9 epochs. The confidence levels of variability significance in W1 band are 5.0, 3.0, 2.4, and 4.2, respectively, in E4, E5, E8 and E9 epochs. While in W2 band they are 4.3, 2.4, and 2.4, respectively, in E4, E5, and E9 epochs. The power spectrum density in E4 was also calculated, from which the timescale of the intraday variability is 34 hours in rest frame. A intraday bluer-when-brighter trend was detected in each epoch, though the trend is tentative considering the uncertainties. Such a trend disappears among different epochs (i.e. from E3 to E9). The average value of the median W1-W2 colors in epoch E3 to E9 is 1.09, while the one is 0.75 in epoch E1 to E2. The IR spectral variability behavior of CGRaBS J0733+0456 is consistent with those of other blazars (e.g., Massaro et al., 2017; Jiang, 2018).
2.4 OVRO light curve
CGRaBS J0733+0456 is included in the Owens Valley Radio Observatory (OVRO) 40 m telescope monitoring program333http://www.astro.caltech.edu/ovroblazars/. This program begins in 2007 and encompasses over 1800 objects that are mainly from the CGRaBS survey (Healey et al., 2008). The radio light curves are well sampled with observations for each source occurring twice per week, at a frequency of 15 GHz (Richards et al., 2011). Significant radio variability of CGRaBS J0733+0456 displays in the OVRO light curve, see Figure 1. It maintains in a low radio flux state ( 0.4 Jy) before 2013. Since then the flux is doubled after a two years ascent phase and keeps in a high radio flux state until now.
2.5 Implications of multi-wavelength variability
Significant flux variations in radio, mid-IR (shifted to near-IR in the source frame) as well as rays have been detected for CGRaBS J0733+0456. Especially, IR emissions at epoch E4 is over 15 times of those at epoch E1, strongly suggesting that the jet emission is dominated then. Moreover, the IR and -ray light curves are rather similar, including a quiescent period at early time of Fermi-LAT operation, a strong flare event in 2015 as well as a mild activity in 2017. For the -ray flare of CGRaBS J0733+0456 alone, there could be possible contamination from PKS 0736+01. However, the quasi-simultaneous IR flare detected in CGRaBS J0733+0456 does not emerge for PKS 0736+01, together with the well angular resolution of the WISE observation (see Figure 2), strongly supporting the validness of the association between CGRaBS J0733+0456 and 4FGL J0733.8+0455. The IR and -ray fluxes of CGRaBS J0733+0456 in the flaring state are checked and it is is consistent with other blazars in the perspective of infrared--ray connection (Massaro & D’Abrusco, 2016). In fact, a tight connection between emissions from low-energy frequencies (i.e. optical and near-IR bands) and rays of FSRQs are widely accepted thanks to the detections of simultaneous flares at the corresponding wavelengths (e.g., Bonning et al., 2012) and significant variation of optical polarization properties during a giant -ray flare (e.g., Abdo et al., 2010). Therefore, cospatiality of these two emissions are suggested and the leptonic processes likely play an important role in generating of -ray emission, which are further supported by CGRaBS J0733+0456. By contrast, the radio variation is moderate since it is likely from a more extended region than the near-IR and -ray bands. Nevertheless, the beginning of the radio ascent phase is coincident with “emergence” of the -ray emission. Meanwhile, the radio emission maintains in the high flux state up to now because the corresponding electrons cooled much slowly than that generate the near-IR and ray flares. Based on the consistent multiwavelength light curves, we conclude that CGRaBS J0733+0456 is the low-energy counterpart of FL8Y J0733.8+0455.
In short-term, intraday IR variability is identified, in which the variability timescale is constrained as short as 4 hours. Therefore a compact radiation region is inferred,
| (1) |
where is the Doppler factor, c is speed of the light. Such a deduction is also supported by the detections of fast -ray variability of FSRQs (e.g., Dondi & Ghisellini, 1995; Begelman et al., 2008; Foschini et al., 2011; Liao, 2018). Sometimes the -ray variability timescale could be down to a few minutes (Aleksić et al., 2011; Ackermann et al., 2016). Assuming near-IR and -ray photons of CGRaBS J0733+0456 are from the same region, to successfully escape from heavy absorption on rays via process, the Doppler factor should be high enough. The highest energy of the detected -ray photon is about 10 GeV while the absorption soft photons could be from the jet itself and the accretion system externally. In the former case, if we set the observed luminosity of soft photons (at a few keV) as erg since there is no simultaneous X-ray observations here, and the radius of the -ray radiation region is as same as the absorption length, 10 is given. Alternatively, little information of the external absorption photons at several tens of eVs is acquired, which prevents us to set a reliable constraint on the Doppler factor.
3 DISCUSSION and SUMMARY
There are only two -ray sources marked as blazars beyond redshift 3 in the 3LAC (Ackermann et al., 2015). Fortunately, the number of such sources is increasing. Recently, detections of -ray emission of five new blazars with 3.1 have been claimed, with the highest redshift of 4.3 (Ackermann et al., 2017). Additional candidates/sources include GB6 B1427+5149 at (Mooney et al., 2018) and B3 1428+422 at (Liao et al., 2018), the farthest object among the 105 month Swify-BAT all sky hard X-ray survey (Oh et al., 2018). However, identifications of these high redshift -ray blazar candidates are based on the cospatiality between the -ray sources and the low-energy counterparts. Ackermann et al. (2017) presents broadband spectral energy distributions (SEDs) of their five sources and argues that they share a typical FSRQ shape, but majority of their multiwavelength data are un-simultaneous. Though strong optical and -ray flares of NVSS J163547+362930 ( = 3.6) are identified (Li et al., 2018), these flares appear at different times. The successful detection of the simultaneous IR and ray flares ranks CGRaBS J0733+0456 as the first unambiguously identified -ray blazar beyond redshift 3. The broadband activities of CGRaBS J0733+0456 also confirm violent behaviors detected from other high redshift blazars (e.g., Akyuz et al., 2013; Orienti et al., 2014; Abdo et al., 2015; Li et al., 2018). Though high redshift blazars tend to be weak and spectrally soft -ray sources, the detection prospect can be significantly enhanced in the presence of the energetic flares.
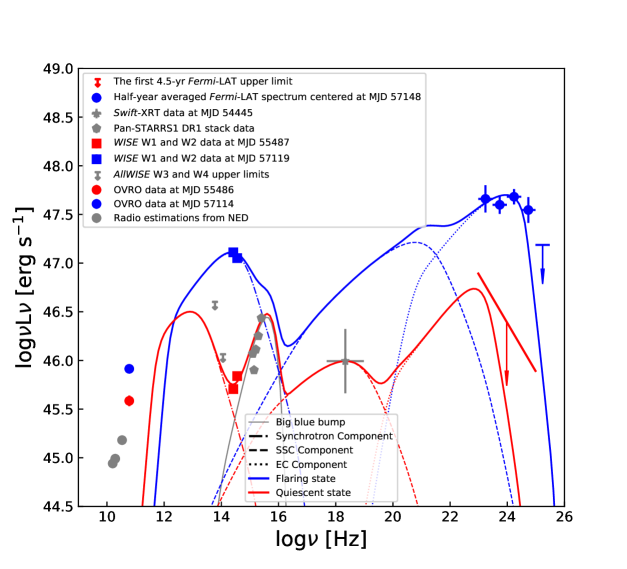
Broadband SEDs of CGRaBS J0733+0456 are shown in Figure 4. Un-simultaneous multi-wavelength data include radio flux densities obtained from NED, stack five-band magnitudes from the first data release from the Panoramic Survey Telescope and Rapid Response System (Pan-STARRS, Chambers et al. 2016; Flewelling et al. 2016) as well as the X-ray estimation from Swift-XRT analyzed here. Meanwhile, the OVRO data at MJD 55486, WISE observations at MJD 55487 and the first 4.5-yr Fermi-LAT 95 C.L. upper limit represent the low flux state SED, while OVRO data at MJD 57114, WISE observations at MJD 57119 and a half-yr averaged Fermi-LAT -ray spectrum centered at MJD 57148 correspond to the high flux state SED. In addition to the remarkable IR variability amplitude, the IR spectra are also variable, indicating that the synchrotron bump peaks at higher frequencies during the flaring epoch. The Pan-STARRS and the E2 WISE data are extracted by the emission from a standard Shakura & Sunyaev (1973) disk. The accretion disk extends from 3 to 2000, where is the Schwarzschild radius, and produces a total luminosity in which is the accretion rate and the accretion efficiency is set as a typical value, 0.1. The accretion disk emission exhibits a multi-temperature radial profile, and the local temperature at a certain radius is,
| (2) |
Meanwhile, a simple homogeneous one-zone leptonic scenario is adopted to describe the jet emission which is from a relativistic compact blob with a radius of embedded in the magnetic field. The emitting electrons follow a broken power-law distribution,
| (3) |
where is the electron break energy, and are the minimum and maximum energies of the electrons, is the normalization of the particle number density, and the are indices of the broken power-law particle distribution. Both synchrotron and IC processes are considered, along with the synchrotron self-absorption process and the KleinNishina effect in the IC scattering. Assuming a conical jet geometry, the distance between the jet radiation region and the central SMBH = 0.1 pc. Based on the monochrome UV flux at 1350 Å from the optical spectrum of CGRaBS J0733+0456 (Healey et al., 2008), the scale of the broad line region (BLR) can be inferred as 0.3 pc (Kilerci Eser et al., 2015). Since the strong Ly line is detected, Ly line emission is adopted as the external soft photons in the EC process. Meanwhile, the energy density of the external soft photons can be also estimated from the optical spectrum of CGRaBS J0733+0456 (Healey et al., 2008), erg . The transformations of frequency and luminosity between the jet frame and the observational frame are and . The simple leptonic model can provide reasonable descriptions of both SEDs (see Figure 4), though there are only a little information for the low flux state. The input parameters of the jet radiation models are listed in Table 1. A significant enhance of the Doppler factor as well as the due to ejecta of a new jet blob could account for the multi-wavelength flares of CGRaBS J0733+0456. Ghisellini et al. (2011) performs a systematical SED modeling study of 19 high redshift blazars with one-year averaged Fermi-LAT data. Their typical magnetic field intensity is 1 Gauss and bulk Lorentz factor of the jet blob is 13. Meanwhile, An & Romani (2018) revisits the SED of QSO J0906+6930, the farthest known blazar so far, though it has not been identified as a -ray emitter yet. To explain the -ray “off” SED, a bound 6 11.5 is set. In brief, the input parameters of the jet radiation models here are in agreement with SED modeling studies for other high redshift blazars.
In summary, we present a broadband temporal view of the high redshift blazar CGRaBS J0733+0456. Significant radio, IR and -ray flux variations are identified. In particular, violent long-term IR variability with amplitude over one order of magnitude and intraday IR variations with variability timescale down to a few hours have been detected. Moreover, the IR and -ray light curves share a rather similar shape, providing a decisive proof of the association between CGRaBS J0733+0456 and FL8Y J0733.8+0455. Broadband quasi-simultaneous SEDs correspond to different flux states can be well reproduced by the homogeneous one-zone leptonic radiation scenario. If similar strong activities occur in blazar candiates with 5 (Romani et al., 2004; Sbarrato et al., 2012; Ghisellini et al., 2014; Yi et al., 2014), detection of their -ray emissions are anticipated.
References
- Abdo et al. (2010) Abdo, A. A., Ackermann, M., Ajello, M., et al. 2010, Nature, 463, 919
- Abdo et al. (2015) Abdo, A. A., Ackermann, M., Ajello, M., et al. 2015, ApJ, 799, 143
- Acero et al. (2015) Acero, F., Ackermann, M., Ajello, M., et al. 2015, ApJS, 218, 23
- Ackermann et al. (2015) Ackermann, M., Ajello, M., Atwood, W. B., et al. 2015, ApJ, 810, 14
- Ackermann et al. (2016) Ackermann, M., Anantua, R., Asano, K., et al. 2016, ApJ, 824, L20
- Ackermann et al. (2017) Ackermann, M., Ajello, M., Baldini, L., et al. 2017, ApJ, 837, L5
- Ai et al. (2010) Ai, Y. L., Yuan, W., Zhou, H. Y., et al. 2010, ApJ, 716, L31
- Aleksić et al. (2011) Aleksić, J., Antonelli, L. A., Antoranz, P., et al. 2011, ApJ, 730, L8
- An & Romani (2018) An, H., & Romani, R. W. 2018, ApJ, 856, 105
- Andrei et al. (2009) Andrei, A. H., Souchay, J., Zacharias, N., et al. 2009, A&A, 505, 385
- Akyuz et al. (2013) Akyuz, A., Thompson, D. J., Donato, D., et al. 2013, A&A, 556, A71
- Atwood et al. (2009) Atwood, W. B., Abdo, A. A., Ackermann, M., et al. 2009, ApJ, 697, 1071
- Begelman et al. (2008) Begelman, M. C., Fabian, A. C., & Rees, M. J. 2008, MNRAS, 384, L19
- Blandford & Rees (1978) Blandford, R. D., & Rees, M. J. 1978, in Pittsburgh Conference on BL Lac Objects, ed. A. M. Wolfe (Pittsburgh, PA: Univ. Pittsburgh Press), 328
- Błażejowski et al. (2000) Błażejowski, M., Sikora, M., Moderski, R., & Madejski, G. M. 2000, ApJ, 545, 107
- Bonning et al. (2012) Bonning, E., Urry, C. M., Bailyn, C., et al. 2012, ApJ, 756, 13
- Cash (1979) Cash, W. 1979, ApJ, 228, 939
- Chambers et al. (2016) Chambers, K. C., Magnier, E. A., Metcalfe, N., et al. 2016, arXiv:1612.05560
- Dermer & Schlickeiser (1993) Dermer, C. D., & Schlickeiser, R. 1993, ApJ, 416, 458
- Dondi & Ghisellini (1995) Dondi, L., & Ghisellini, G. 1995, MNRAS, 273, 583
- Dou et al. (2016) Dou, L., Wang, T.-g., Jiang, N., et al. 2016, ApJ, 832, 188
- Fan & Wu (2018) Fan, X.-L., & Wu, Q. 2018, ApJ, 869, 133
- Flewelling et al. (2016) Flewelling, H. A., Magnier, E. A., Chambers, K. C., et al. 2016, arXiv:1612.05243
- Foschini et al. (2011) Foschini, L., Ghisellini, G., Tavecchio, F., Bonnoli, G., & Stamerra, A. 2011, A&A, 530, A77
- Gehrels et al. (2004) Gehrels, N., Chincarini, G., Giommi, P., et al. 2004, ApJ, 611, 1005
- Ghisellini et al. (2010) Ghisellini, G., Della Ceca, R., Volonteri, M., et al. 2010, MNRAS, 405, 387
- Ghisellini et al. (2011) Ghisellini, G., Tagliaferri, G., Foschini, L., et al. 2011, MNRAS, 411, 901
- Ghisellini et al. (2014) Ghisellini, G., Sbarrato, T., Tagliaferri, G., et al. 2014, MNRAS, 440, L111
- Griffith et al. (1995) Griffith, M. R., Wright, A. E., Burke, B. F., & Ekers, R. D. 1995, ApJS, 97, 347
- Gorshkov et al. (2008) Gorshkov, A. G., Konnikova, V. K., & Mingaliev, M. G. 2008, Astronomy Reports, 52, 278
- Healey et al. (2008) Healey, S. E., Romani, R. W., Cotter, G., et al. 2008, ApJS, 175, 97
- Hook & McMahon (1998) Hook, I. M., & McMahon, R. G. 1998, MNRAS, 294, L7
- IceCube Collaboration et al. (2018) IceCube Collaboration, Aartsen, M. G., Ackermann, M., et al. 2018, Science, 361, eaat1378
- Intema et al. (2017) Intema, H. T., Jagannathan, P., Mooley, K. P., & Frail, D. A. 2017, A&A, 598, A78
- Jiang et al. (2012) Jiang, N., Zhou, H.-Y., Ho, L. C., et al. 2012, ApJ, 759, L31
- Jiang et al. (2016) Jiang, N., Dou, L., Wang, T., et al. 2016, ApJ, 828, L14
- Jiang (2018) Jiang, N. 2018, Research Notes of the American Astronomical Society, 2, 134
- Kilerci Eser et al. (2015) Kilerci Eser, E., Vestergaard, M., Peterson, B. M., Denney, K. D., & Bentz, M. C. 2015, ApJ, 801, 8
- Li et al. (2018) Li, S., Xia, Z.-Q., Liang, Y.-F., Liao, N.-H., & Fan, Y.-Z. 2018, ApJ, 853, 159
- Liao et al. (2014) Liao, N. H., Bai, J. M., Liu, H. T., et al. 2014, ApJ, 783, 83
- Liao et al. (2016) Liao, N.-H., Xin, Y.-L., Fan, X.-L., et al. 2016, ApJS, 226, 17
- Liao et al. (2018) Liao, N.-H., Li, S., & Fan, Y.-Z. 2018, ApJ, 865, L17
- Liao (2018) Liao, N.-h. 2018, Galaxies, 6, 68
- Mainzer et al. (2014) Mainzer, A., Bauer, J., Cutri, R. M., et al. 2014, ApJ, 792, 30
- Mao et al. (2018) Mao, L., Zhang, X., & Yi, T. 2018, Ap&SS, 363, 167
- Massaro et al. (2009) Massaro, E., Giommi, P., Leto, C., et al. 2009, A&A, 495, 691
- Massaro et al. (2011) Massaro, F., D’Abrusco, R., Ajello, M., Grindlay, J. E., & Smith, H. A. 2011, ApJ, 740, L48
- Massaro et al. (2014) Massaro, F., Giroletti, M., D’Abrusco, R., et al. 2014, ApJS, 213, 3
- Massaro & D’Abrusco (2016) Massaro, F., & D’Abrusco, R. 2016, ApJ, 827, 67
- Massaro et al. (2017) Massaro, F., Marchesini, E. J., D’Abrusco, R., et al. 2017, ApJ, 834, 113
- Mattox et al. (1996) Mattox, J. R., Bertsch, D. L., Chiang, J., et al. 1996, ApJ, 461, 396
- Maraschi et al. (1992) Maraschi, L., Ghisellini, G., & Celotti, A. 1992, ApJ, 397, L5
- Mooney et al. (2018) Mooney, S., Quinn, J., Callingham, J. R., et al. 2018, arXiv:1811.07961
- Nolan et al. (2012) Nolan, P. L., Abdo, A. A., Ackermann, M., et al. 2012, ApJS, 199, 31
- Oh et al. (2018) Oh, K., Koss, M., Markwardt, C. B., et al. 2018, ApJS, 235, 4
- Orienti et al. (2014) Orienti, M., D’Ammando, F., Giroletti, M., et al. 2014, MNRAS, 444, 3040
- Richards et al. (2011) Richards, J. L., Max-Moerbeck, W., Pavlidou, V., et al. 2011, ApJS, 194, 29
- Romani et al. (2004) Romani, R. W., Sowards-Emmerd, D., Greenhill, L., & Michelson, P. 2004, ApJ, 610, L9
- Sbarrato et al. (2012) Sbarrato, T., Ghisellini, G., Nardini, M., et al. 2012, MNRAS, 426, L91
- Shakura & Sunyaev (1973) Shakura, N. I., & Sunyaev, R. A. 1973, A&A, 24, 337
- Sikora et al. (1994) Sikora, M., Begelman, M. C., & Rees, M. J. 1994, ApJ, 421, 153
- The Fermi-LAT collaboration (2019) The Fermi-LAT collaboration 2019, arXiv:1902.10045
- Ulrich et al. (1997) Ulrich, M.-H., Maraschi, L., & Urry, C. M. 1997, ARA&A, 35, 445
- Urry & Padovani (1995) Urry, C. M., & Padovani, P. 1995, PASP, 107, 803
- Volonteri (2010) Volonteri, M. 2010, A&A Rev., 18, 279
- Wagner & Witzel (1995) Wagner, S. J., & Witzel, A. 1995, ARA&A, 33, 163
- Wright et al. (2010) Wright, E. L., Eisenhardt, P. R. M., Mainzer, A. K., et al. 2010, AJ, 140, 1868
- Wu et al. (2013) Wu, J., Brandt, W. N., Miller, B. P., et al. 2013, ApJ, 763, 109
- Yi et al. (2014) Yi, W.-M., Wang, F., Wu, X.-B., et al. 2014, ApJ, 795, L29
| Model | [] | [Gauss] | [cm] | ||||
|---|---|---|---|---|---|---|---|
| Flaring state | 2.2 | 5.0 | 1826 | 1 | 26 | ||
| Quiescent state | 2.2 | 5.0 | 570 | 1 | 10 |
Note. — are the indexes of the broken power-law radiative electron distribution; is the break energy of the electron distribution; is the normalization of the particle number density; is the magnetic field strength; is the Doppler boosting factor and is the radius of the emission blob in the jet comoving frame. The minimum and maximum energies of the electrons are set as 100 and 10 times of the , respectively. The energy density of the Ly line emission emission is estimated as erg in the rest frame.