Cyber-physical risks of hacked Internet-connected vehicles
Abstract
The integration of automotive technology with Internet-connectivity promises to both dramatically improve transportation, while simultaneously introducing the potential for new unknown risks. Internet-connected vehicles are like digital data because they can be targeted for malicious hacking. Unlike digital data, however, Internet-connected vehicles are cyber-physical systems that physically interact with each other and their environment. As such, the extension of cybersecurity concerns into the cyber-physical domain introduces new possibilities for self-organized phenomena in traffic flow. Here, we study a scenario envisioned by cybersecurity experts leading to a large number of Internet-connected vehicles being suddenly and simultaneously disabled. We investigate post-hack traffic using agent-based simulations, and discover the critical relevance of percolation for probabilistically predicting the outcomes on a multi-lane road in the immediate aftermath of a vehicle-targeted cyber attack. We develop an analytic percolation-based model to rapidly assess road conditions given the density of disabled vehicles and apply it to study the street network of Manhattan (NY, USA) revealing the city’s vulnerability to this particular cyber-physical attack.
Introduction
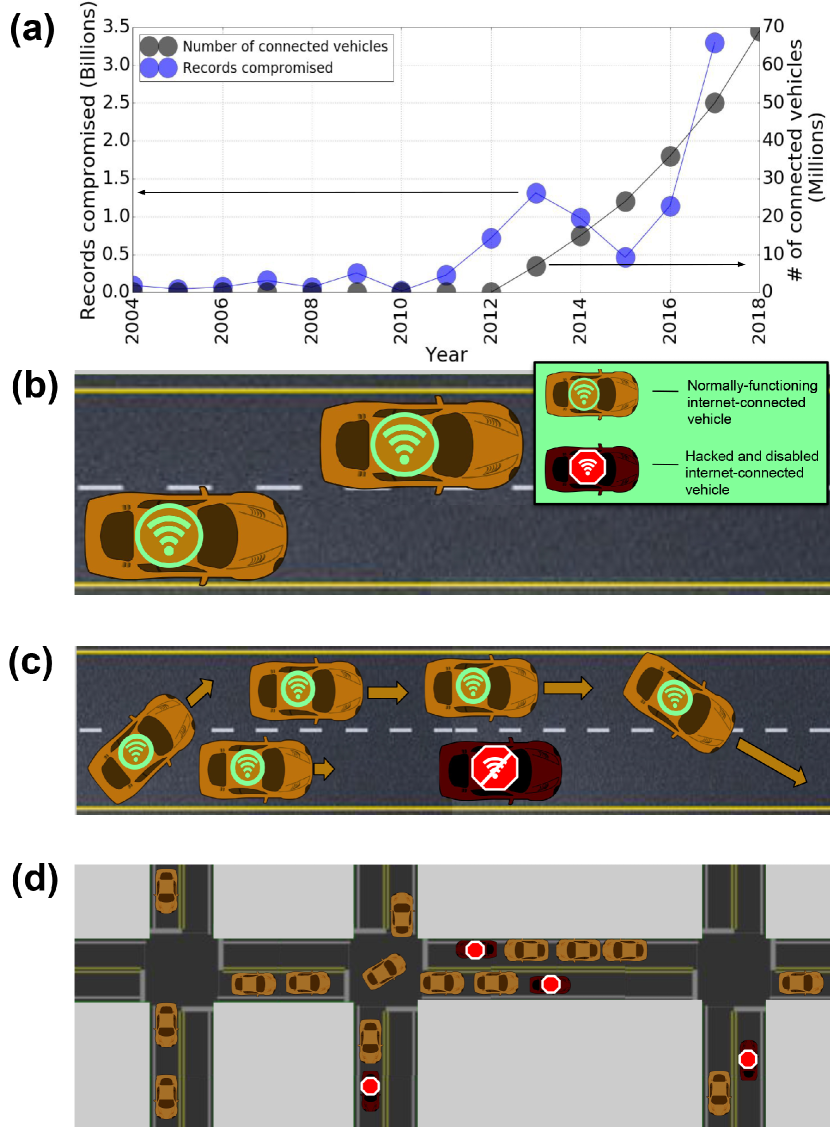
In the United States, over 40 million Internet-connected vehicles are on the road today, with hundreds of millions more expected by 2023 (Fig. 1a, gray circles) statistica . Connected vehicle technologies have the potential to transform transportation by preventing accidents, reducing congestion, and even improving in-vehicle worker productivity DOT-benefits . However, these highly anticipated benefits come with largely unknown risks, especially since connected vehicles are potential targets for computer hacking miller2015 ; greenberg2015 ; parkinson2017 ; amoozadeh2015 . In light of the growing number of hacking incidents exposing personal data (Fig. 1a, blue circles) hacks , cybersecurity experts are working to preemptively resolve similar software vulnerabilities and keep Internet-connected vehicles secure from similarly malicious activity GAO-DOT ; parkinson2017 ; eiza2017 . Nevertheless, in the event of a successful hack, compromised vehicles carry unknown cyber-physical risks, making it difficult to assess the mode and scale of disruption presented by this increasingly plausible scenario MIT .
While a full accounting of the risks presented by Internet-connected vehicles remains elusive, this open-ended question hasn’t stopped active exploration of the possibilities. Already, a number of scenarios have been outlined to identify how hacking increases the risk of collisions GAO-DOT ; amoozadeh2015 ; axelrod2017 and traffic disruptions axelrod2017 . For example: (i) degraded sensor input or distorted control protocols could cause connected-vehicle collisions amoozadeh2015 , (ii) self-monitoring anti-virus-like software could cause compromised vehicles to enter a “safe mode” when problems are detected and bring the vehicle to a stop, reducing the likelihood of accidents but increasing localized traffic congestion parkinson2017 ; Cal2018-article ; Cal2018-rules , (iii) similar self-monitoring software could directly lead to human-failure if control of a compromised vehicle was returned to an unprepared or distracted driver richtel2015google , and (iv) hacked sensors could be used to falsely report traffic or other objects on the road, thus inappropriately halting motion of compromised vehicles parkinson2017 ; bissmeyer2010intrusion . Furthermore, as driver-assisting and “auto-pilot” technologies continue to be incorporated in modern vehicles, we can anticipate an even deeper integration between mechanical components and software-controlled systems. In fact, some manufacturers already use wireless over-the-air updates to regularly upgrade and maintain their vehicle’s software. Thus, given the increased exposure to potential cybersecurity vulnerabilities, the growing physical control by these cybersystems over vehicular motion, and the historical precedent that “if it can be hacked, it will be hacked,” we can foresee the general contours of an emerging threat. In particular, many of the cybersecurity scenarios being considered lead to a common outcome where compromised vehicles cease motion and effectively become traffic-disrupting obstacles (Fig. 1b and c). From the physical perspective, we can ask what this outcome means for transportation as we quantify the emergent consequences of this cyber-physical risk.
The scenario we investigate here is one in which a substantial number of vehicles are simultaneously disabled in a single event causing them to become immobile obstacles on the road (Fig. 1d). By setting aside specifics for how cybersecurity vulnerabilities are exploited, we can instead focus on the general outcomes. To this end, we simulate traffic flow before and after a hack has occurred so that non-compromised vehicles continue to navigate around compromised vehicles wherever possible. Surprisingly, we find a relatively modest density of compromised vehicles can immediately halt all traffic flow. By deriving an analytical model based on percolation theory, we show the underlying cause of this result is the local geometric arrangement of vehicles. Application of our model to Manhattan (New York City, New York, USA) reveals the threshold number of compromised vehicles that causes city-wide gridlock and quantifies how access to emergency services is reduced. These insights provided by this model suggest how the risks of large-scale hacks can be addressed via network compartmentalization and redundancy.
Results and Discussion
Compromised vehicles impair traffic
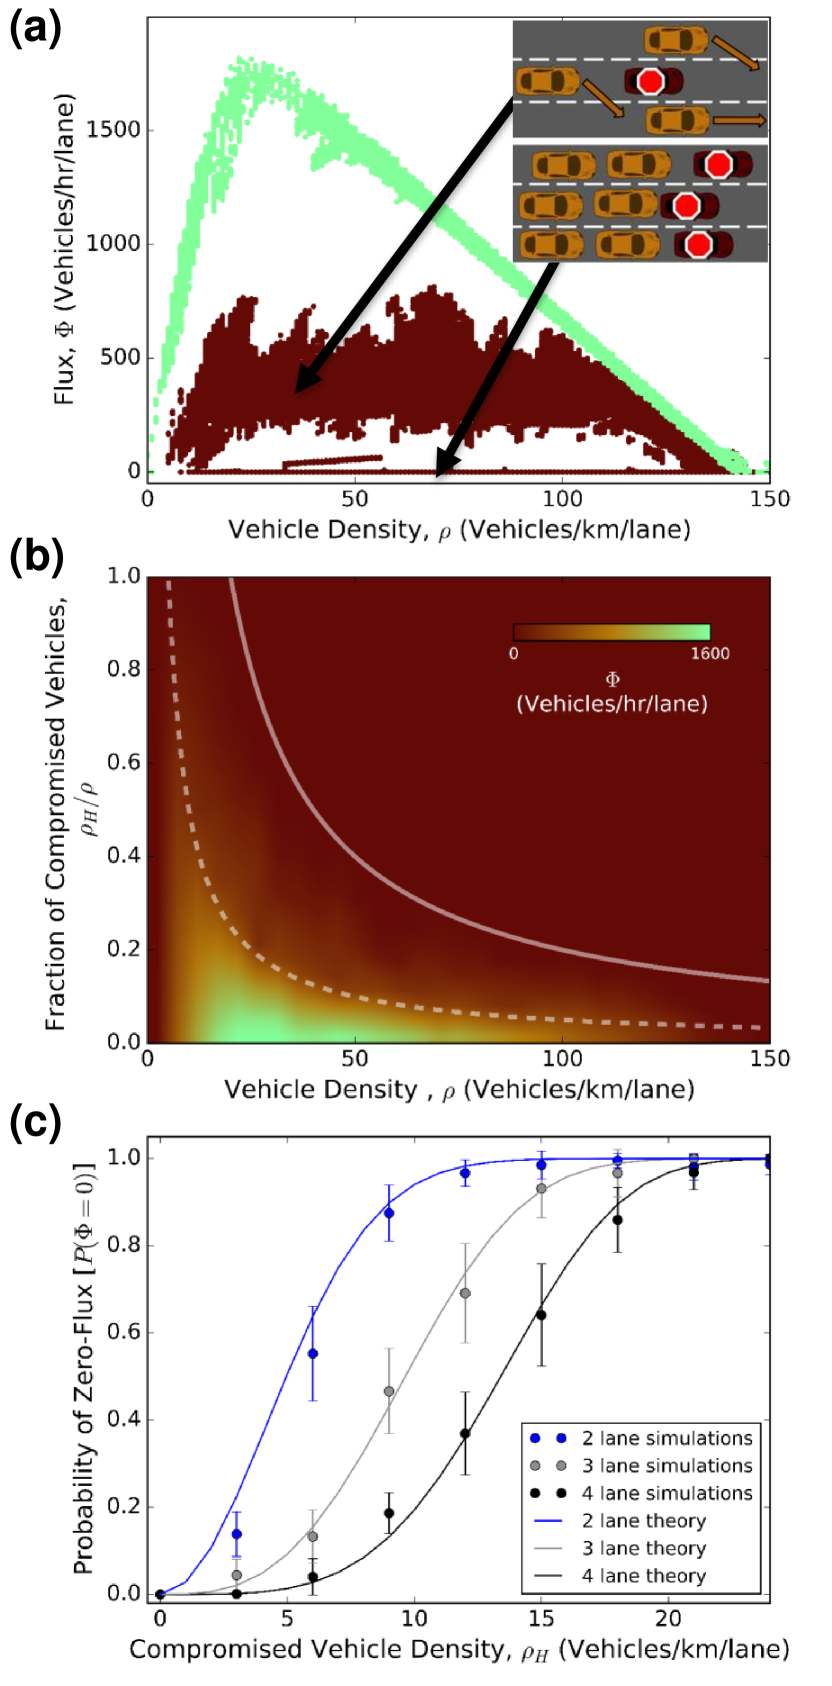
To begin our examination of how hacking targeted at Internet-connected vehicles disrupts traffic, we construct a minimal agent-based model for traffic flow. We simulate individual vehicles with the Intelligent Driver Model (IDM) helbing2001 ; treiber2000 ; chen2010calibration , a time-continuous car-following set of equations that quantitatively reproduces known traffic dynamics (Methods). To model lane changing, we use the Minimizing Overall Breaking Induced by Lane changes (MOBIL) framework treiber2006mobil ; treiber2009modeling (Methods). Briefly, a vehicle changes lanes if doing so would allow it and its neighbors to better match their preferred speeds. As a validation for these simulations, we varied the density of vehicles, (number of vehicles/km/lane), and measured the flux, (number of vehicles/hr/lane), on a 3 lane road. These simulations reproduce the classic peaked relationship between traffic flux and density (Fig. 2a, green symbols), which has been observationally measured and theoretically reproduced in agent-based and continuum models helbing2001 ; lwr1955 ; nagel1992 .
A variety of hacking scenarios targeting Internet-connected vehicles lead to the same generic outcome where compromised vehicles stop and become obstacles on the road. We simulate these scenarios by randomly selecting vehicles and marking them as compromised, thus halting their motion. We then simulated post-hack traffic on a straight 3 lane road with periodic boundary conditions to maintain constant total vehicle density. We investigated realistic densities ranging from to 150 vehicles/km/lane, and fraction of compromised vehicles ranging from 0% to 100% of all vehicles. Post-hack, we observe decreased flux at every density (Fig. 2a, dark red symbols). Interestingly, these data separate into two distinct regimes. Traffic continues to flow in 15% of the simulations, albeit at a significantly reduced rate (Fig. 2a, red band centered on vehicles/hr/lane). More strikingly, the remaining 85% of the simulations lead to a complete loss of traffic flow (Fig. 2a, red data at vehicles/hr/lane). Evidently, there are two distinct phenomenologies arising post-hack: one where traffic is slowed, and another where traffic is stopped. The gap between these two curves (Fig. 2a, white region where vehicles/hr/lane) is broadly independent of , suggesting a categorical distinction between the two flow phenomena and ruling out a continuous transition between the flow and no-flow states.
To better understand the effects of disabled vehicles on traffic flow, we plot the same simulation data as a flux heatmap with varying density and fraction of compromised vehicles (Fig. 2b). Most of the heatmap’s area corresponds to zero-flux outcomes (Fig. 2b, dark red), echoing the observation that 85% of the simulations lead to a complete loss of traffic flow. Intriguingly, contours of constant coincide with contours of constant compromised vehicle density, (Fig. 2b, white solid and dashed lines).
There are two classic flow phenomena that can produce zero-flux in the presence of constrictions: clogging thomas2015 ; zuriguel2014 ; peter2017 and percolation sahini2014 . In the first case, interactions between objects produce configurations that prevent other objects from flowing past each other, eventually arresting flow. Thus, clogging is a kinetic phenomenon, and the typical time it takes for a clog to form depends on the density of both mobile constituents and obstacles peter2017 . In fact, clogging is the phenomenological flow we commonly see when a vehicle breaks-down or traffic congestion increases during rush hour; in both cases, traffic flux gradually decreases over an expanding stretch of road. In contrast, percolation occurs when a continuously connected obstruction spans the system, and is therefore a purely geometric phenomenon sahini2014 . Thus, while clogging is a slow build-up to reduced traffic, percolation is a sudden and abrupt transition from flow to no-flow states independent of the density of free-flowing vehicles. Our observations that flux contours are consistent with rather than (Fig. 2b, white solid and dashed lines) suggests that geometric percolation of compromised vehicles is the underlying zero-flux mechanism in post-hack traffic considered here (Supplementary Materials).
Analytical expression for post-hack traffic flow
If post-hack traffic flow is a percolation flow phenomenon, an analytical expression for disabled vehicles to randomly align into geometric blockages should predict the probability of zero-flux traffic. We derived this expression to account for an arbitrary number of lanes, , the density of compromised vehicles per lane, , the length of the road, , and the minimum center-to-center distance between two vehicles on adjacent lanes that still allows a third vehicle to lane-change between them, . That is, is twice the vehicle length, which is held constant for simplicity. Assuming vehicles are distributed uniformly at random throughout the road prior to the hack, we find the probability of percolation, , (Methods) to be:
| (1) |
This expression gives the probability that compromised vehicles are positioned in such a way as to block all lanes of a multi-lane road. While we are interested in varying , , and to account for different traffic conditions and magnitudes of hacks, the effective vehicle length is fixed at 7 m ( m), which corresponds to the typical separation between cars in dense traffic treiber2000 .
We simulated hacking events of different magnitudes, as measured by the number or fraction of vehicles compromised during the hack, and measured the flux to determine whether zero-flux events occur as frequently as predicted by percolation in Eq. (1). Indeed, our analytical expression accurately captures the relationship between the probability of zero-flux, the density of compromised vehicles, and the number of lanes (Fig. 2c solid lines), with a remarkably high coefficient of determination in each case (). This is consistent with our hypothesis that geometric percolation causes standstill traffic in the post-hack conditions we explore; if clogging played a significant role, zero-flux traffic would have occurred more often than predicted by this analytical expression (Supplementary Materials) zuriguel2014 ; thomas2015 .
Beyond computational simulations, human drivers self-organize on roads forming spatial distributions that may differ from those formed by the combined IDM/MOBIL model. To address this potential concern and validate our percolation formula, we made use of the NGSIM dataset NGSIM , which is a US Department of Transportation-funded measurement of driver spatiotemporal trajectories. Similar to the procedure used to analyze simulations, we randomly selected a subset of vehicles to be hacked, compromised, and disabled (Supplementary Materials). We found our analytical model again captures the percolation probability with high accuracy (), even when applied to the empirical NGSIM data.
Percolation of compromised and disabled vehicles across a road or highway represents a particularly concerning scenario, as emergency vehicles can no longer use roads that become totally blocked. Furthermore, this analysis shows that zero-flux can occur with surprisingly low densities of disabled vehicles. For example, with just 6 compromised vehicles/km/lane ( of cars in bumper-to-bumper traffic) the probability of percolation across a two lane road is . Fortunately, as percolation is a geometric effect, the probability that a hacking event will block a road can be directly calculated with Eq. (1) for any set of parameters, circumventing the need for time-consuming, model-specific, agent-based simulations. Thus, this mathematical insight enables us to rapidly assess the risk of zero-flux traffic for any road, with any number of compromised connected vehicles.
Compromised vehicles gridlock Manhattan
To quantify the broader cyber-physical risks posed by hacking targeted at Internet-connected vehicles, we must investigate how traffic flow in an entire urban street network is affected. Using our percolation-based analytical formula Eq. (1), we can directly and immediately compute the likelihood of any road being blocked, which saves significant computational time otherwise required for city-scale agent-based simulations. Thus, we connect road-level traffic dynamics to network-level structure by stochastically marking roads as obstructed according to their percolation probabilities. We can then use tools from network theory to assess the degree of urban disruption due to hacking. While previous studies have investigated urban street network robustness to both random and targeted pruning of edges albert2000 ; callaway2000 ; abbar2016 ; wang2015 , the consequences of a hack have not been directly explored. The critical advancement introduced by percolation, therefore, is to motivate the pruning of edges based on the underlying traffic features quantified by , , , and rather than the bare network structure.
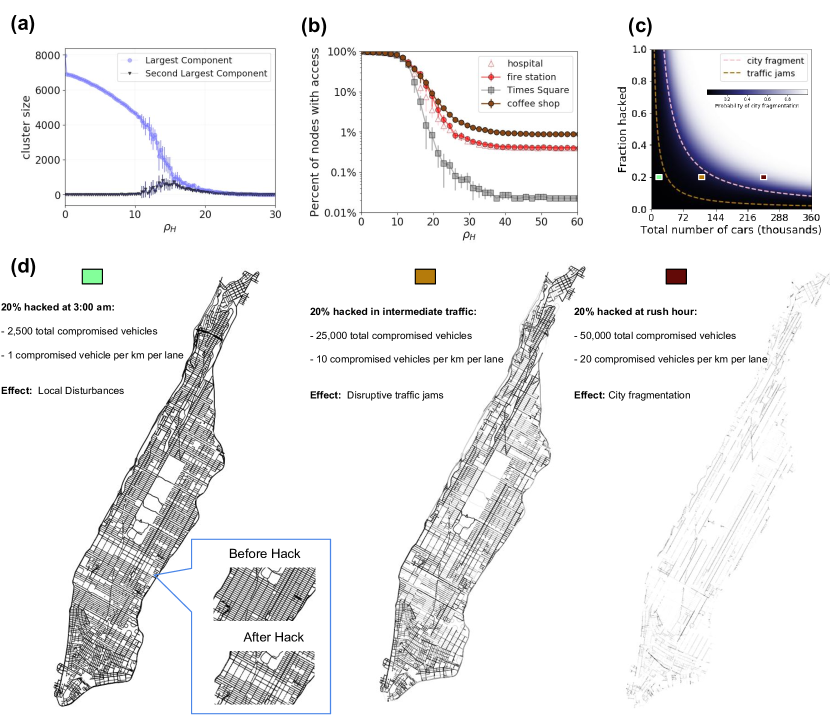
We applied this approach to the island neighborhood of Manhattan, in New York City, USA, using map data from the Open Street Maps tool OSMnx boeing2017osmnx . After fixing the density of compromised vehicles, each road is stochastically set to be accessible or blocked according to the probability calculated with Eq. (1), which depends on the length and number of lanes for each road (Methods). Using this method, we quantify the degree to which a hacking event disrupts the city by measuring the city’s connectivity. In our analysis, a connected component represents a spatial network of roads accessible to each other but not accessible to the rest of the network. The size of each connected component is computed as being equal to the number of accessible street intersections (nodes) within that component. We compute the size of the largest and second largest connected components; when the size of the largest component becomes comparable to the size of the second largest component, the city network has been fragmented li2015percolation ; wang2015 ; abbar2016 . Just as percolated compromised vehicles block individual streets, stochastically blocked individual streets can percolate across the city network shlomo2018percolation ; zeng2019switch , which can be described as a percolation-of-percolations event.
We find that for compromised vehicles/km/lane, small subnetworks are broken off of the largest connected component (Fig. 3a, dark purple lower line). At a critical compromised vehicle density of compromised vehicles/km/lane, the number of nodes in the second largest connected component reaches its maximal value and is comparable to the number of nodes in the largest connected component. Thus, compromised vehicles/km/lane represents the critical point at which there is no longer a substantial network of functional roads that connects points through the city. Above this compromised vehicle density, the city has fragmented. For compromised vehicles/km/lane almost all the roads in the city are blocked, and thus we see how compromised vehicles disrupt urban traffic via the percolation-of-percolations.
Along with severe traffic gridlock, access to hospitals and fire stations will be affected in the event of a large-scale hack. To quantify how this disruption affects access to these essential services, latitude and longitude locations of these services were obtained with the Google Places API, and mapped to the closest corresponding intersection in the street network (Methods). At low (Fig. 3b, compromised vehicles/km/lane), nearly every service is accessible from anywhere in the city. Once city fragmentation occurs, access to services decreases dramatically. At very large (Fig. 3b, compromised vehicles/km/lane), the only intersections with access to services are the intersections that contain the services. At these large densities of hacked, compromised, and disabled vehicles, all the curves plateau to the fraction of nodes with a given service (Fig. 3b). For example, if of intersections contain hospitals, the hospital access curve plateaus to . We find that, despite emergency services being well distributed throughout the city (Supplementary Materials), access to these services is still dangerously diminished in the event of a large-scale hack.
We quantify the risk of city-wide disruption through the probability of network fragmentation. This probability is defined by the density of compromised vehicles where the size of the second-largest connected component of the street network is maximized. Our measurement of city-wide risk is based on the total number of vehicles on Manhattan roads, and the fraction that are compromised (Fig. 3c). We find that when either the traffic density or the fraction of compromised vehicles is very low (number of compromised vehicles ), the probability that compromised vehicles percolate and block individual streets is negligible, so the city grid as a whole remains well connected ( of edges retained, (Fig. 3d, left). Nevertheless, local disruptions can be significant due to stochastic variations. For example, one random instantiation found 2,500 compromised vehicles distributed throughout Manhattan blocked over 70% of roads in the neighborhood just south of Central Park (Fig. 3d, left). While these disruptions are not widespread enough to fragment the city, their impact increases during intermediate traffic conditions due the increased number of mobile and compromised vehicles (Fig. 3d, middle). Not surprisingly, the potential for city-wide disruption peaks during rush-hour when traffic density is at its highest and the chances of individual streets being blocked exceeds 50% (Fig. 3d, right). The low, medium, and high traffic density regimes considered here (Fig. 3d, left to right), correspond to an average probability of blocked roads of less than 25%, greater than 25% but less than 50%, and greater than 50%, respectively (Supplementary Materials). The sensitive dependence of city-wide percolation on indicates that the overall risk rapidly increases as it approaches 13 compromised vehicles/km/lane, which ultimately leads to a cascade of consequences from the inability to access most parts of the city.
Large-scale hacking below the percolation threshold
Hacking events that fall below the threshold for city fragmentation can cause significant disruption and danger. As we have already shown, a small-scale hack can stochastically incapacitate a localized region of the city (Fig. 3d, left inset). Alternatively, the same small-scale hack can induce the more familiar phenomenology of clogging simply by disabling a handful of Internet-connected vehicles and waiting for traffic to build up. There are even second-order effects where both clogging and localized percolation happen simultaneously, which could potentially result in even wider disruption due to non-linear interactions between kinetic (clogging) and non-kinetic (percolation) flows. To better grasp the potential disruption of sub-critical densities of disabled vehicles, we examined post-hack traffic dynamics on a Manhattan-like grid, using the Simulation of Urban Mobility (SUMO) sumo traffic suite (Supplementary Materials). In these simulations, we observed clogging-like kinetic slowing traffic at densities below the percolation threshold. As expected, the critical threshold for at which the average vehicle velocity drops to zero coincides with the percolation threshold. While these additional sub-percolation simulations shift away from static blockages to examine time-dependent dynamics, they underscore the reality that a percolation-of-percolation event exists within a wider ecosystem of disruptions.
Our effort to isolate the specific nature of percolation and distinguish its statistical properties from clogging may appear to underestimate the severity of hacking targeted at Internet-connected vehicles. However, this distinction is critically important for developing risk mitigation, response, and recovery plans. For example, a plan that is highly effective for clogging at a sub-critical density of disabled vehicles, may be significantly less effective at larger densities of disabled vehicles, and of course, vice versa. Furthermore, our analytical approach with Eq. (1) captures the underlying risk of percolation-based gridlock, while bypassing computationally expensive large-scale traffic simulations. This computational efficiency is appealing for developing real-time recovery plans in the aftermath of a cyber attack where case-specific details can be incorporated in the recovery response. Indeed, with the proliferation of Vehicle-to-Vehicle (V2V) and Vehicle-to-Infrastructure (V2I) connectivity, these challenges are already permeating urban infrastructure. New York City has current plans to install V2V and V2I technology NY-CV ; NY-CV2 , suggesting an urgent need to identify, understand, and plan ahead for the likelihood of vehicle-targeted hacking.
Conclusion
Quantification is the critical first step in cyber-physical risk mitigation. With the results presented here, we found just compromised vehicles/km/lane on the Manhattan street network is enough to cause citywide disruption, wherein portions of the city become disconnected from key services. This density corresponds to 10% of the capacity of the city, or about 30% of all vehicles at intermediate traffic density. From the New York State vehicle registry, the four largest vehicle manufacturers (Honda, Toyota, Ford, and General Motors) each account for around 10% of the total number of vehicles registered (Supplementary Materials). Thus, if any one of those four manufacturers were compromised during rush hour, it would cause city-wide disruption with probability . If two manufacturers were compromised, city fragmentation becomes a near certainty, occurring with probability . Because we have no precedent for large scale cyber-physical hacking, we cannot directly compare these predictions to empirical observations. Indeed, records of traffic accidents across New York City show that there are at most simultaneous accidents, which is far below the percolation threshold NYCaccidents . Evidently, the percolation-of-percolations phenomenon described here is a flow phenomenon that is statistically unlikely to occur in conventional conditions, making a cyber-physical hack the only apparent means of observing its occurrence.
As a direct benefit of developing the percolation-of-percolation framework, we have incidentally uncovered an insight useful for developing risk-mitigating strategies. Using multiple distinct networks for connected vehicle communications and infrastructure decreases the number of vehicles that can be compromised in a single malicious cyber-intrusion. For example, if there were 20 compartmentalized networks in a city, each of which was responsible for 5% of connected vehicles communications, the chance of citywide fragmentation would be low () if any one of these networks was hacked. A hacker deliberately seeking to cause a large-scale disruption faced with this compartmentalized multi-network architecture would therefore be required to execute multiple simultaneous intrusions across multiple distinct networks, increasing the cyber-attack’s difficulty and makes it less likely to occur. In conjunction with conventional cybersecurity strategies, shamsh2013roaming ; almeshekah2016 the chances of a percolation-of-percolation event could be effectively reduced to zero. While isolated traffic disruptions are well-understood from the perspective of transportation science, the easy digital scalability and replicability of hacking means a single well-coordinated attack could surpass any familiar traffic condition. As we explore these technology enabled “unknown unknowns,” we must be aware of how unintended blind spots can be exploited so that we can preemptively predict and prevent their harms.
Methods
.1 Intelligent Driver Model (IDM) Simulations
We simulate the motion of individual vehicles using IDM. The rules for IDM simulations are:
| (2) |
where and denote the position and velocity of the vehicle, and is the distance between vehicle and the vehicle in front of it on the same lane. We choose parameters treiber2000 : km/h is the velocity a vehicle would drive in free traffic; m is the minimum acceptable gap maintained from the front bumper of one car to the rear bumper of the car in front of it in dense, standing traffic Treiber2008 ; s is the minimum possible time for a vehicle to reach the current position of the vehicle in front of it; m/s2 is the maximum acceleration; m/s2 is the comfortable deceleration. In simulations, we numerically solve these equations for vehicles, and after 1,000 time steps corresponding to 100 s of simulated drive time, randomly select a portion of them to be “compromised,” and stop them where they are on the road. Interestingly, the percolation results are substantially independent from the numerical values of these microscopic model parameters (Supplementary Materials).
.2 MOBIL Lane Changing Rules
To realistically model the behavior of individual vehicles, we also need a microscopic description to determine when vehicles should switch lanes. While a variety of options have been established in the literature, here, we utilize the Minimizing Overall Breaking Induced By Lane changes (MOBIL) modeltreiber2006mobil ; treiber2009modeling . This framework considers whether a vehicle and its neighbors would better match their preferred speed if the vehicle changes lanes. Defining the change in acceleration post-lane-change between the next time step (after the lane change) and the current time step (before the lane change) as
| (3) |
we can express the MOBIL condition as
| (4) |
where the index corresponds to the vehicle changing lanes, is the current vehicle behind the lane-changing vehicle at time , and is the vehicle that will be behind the lane changing vehicle at if changes lanes. The constant is referred to as the politeness factor; we choose , which corresponds to force minimization of a vehicle and its nearest neighbors.
In simulations with three lanes, the left-most and right-most lanes, can change into the center lane, and at every time step, vehicles in these edge lanes initiates lane changing, only if Eq. (4) is satisfied and a random number . This additional random variable prevents the emergence of unrealistic large-scale simultaneous lane switching. Vehicles in the center lane choose the left or right lane to change into, depending on whether or respectively. Within fluctuations, we find that different values for do not affect macroscopic flux-densities measurements. Likewise, in the presence of disabled vehicles, does not change the underlying percolation-geometric transition discussed in the main text.
.3 Percolation of Compromised Vehicles
Given the prevalence of zero-flux events post-hack in our highway-like simulations, even when only a portion of vehicles are compromised, we sought to understand whether percolation of compromised vehicles is the dominant phenomenon after a cyber-attack. Percolation of disabled vehicles occurs when, on an lane road, there is an -tuple of disabled vehicles positioned across all lanes such that no other vehicle can pass them (Fig 2a, lower inset).
To this end, we derived an expression for the probability of a percolated configuration on an lane road of length and a per-lane vehicle density , with effective vehicle size . The effective vehicle size is the length from the rear bumper of one vehicle to the rear bumper of the next vehicle in “bumper to bumper” traffic. Of course in bumper to bumper traffic cars’ bumpers are not actually in contact, so is slightly larger than the physical length of a vehicle. In our case m, which is typically the separation between cars in dense traffic treiber2000 .
To determine the probability that compromised vehicles end up in a percolated position, i.e. one that would block all lanes of a highway if the vehicles were frozen in place, we first assume that the position of the connected vehicle in lane will be distributed uniformly:
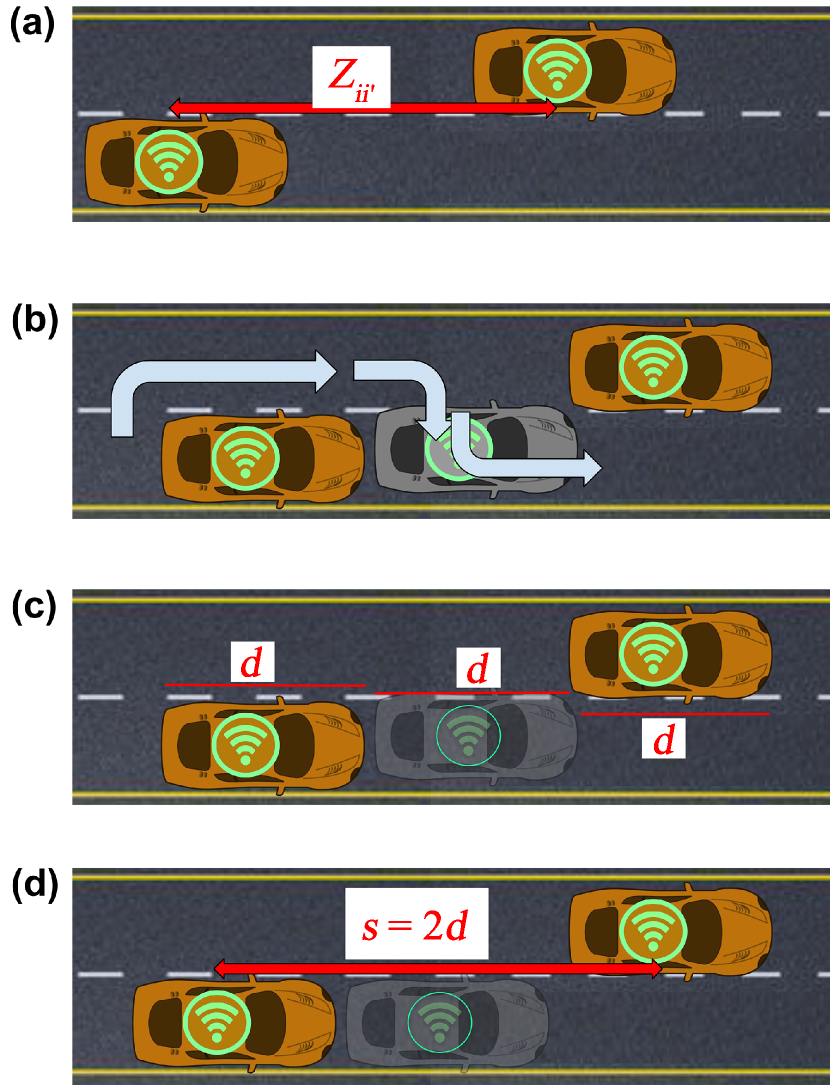
We next define the random variable
which describes the center-to-center distance between two vehicles in adjacent lanes, projected onto the direction of traffic flow. This is the quantity we are interested in, since we want to understand the probability that cars in adjacent lanes are positioned such that a third car can not lane-change between or around them. In other words, we want to know if compromised vehicles in adjacent lanes are a distance no greater than from each other, where is twice the effective car length (Fig. 4). If for all pairs of cars and in adjacent lanes, then percolation of compromised vehicles did not occur; a configuration that would cause compromised vehicle percolation across two adjacent lanes occurs with probability .
Since is a random variable related to the difference between two uniformly distributed random variables with known probability distribution functions, we can directly calculate using convolution. In fact, we derive this probability for an arbitrary real number . For example let’s consider cars labeled by and . The probability distribution functions for their positions, and , are
We seek the cumulative distribution function for , because this will give us the probability that for any arbitrary real number . The cumulative distribution function is:
By taking derivatives and using the chain rule, we can get the probability distribution functions:
Note that is the convolution of with , and that we know and are distributed uniformly on the interval . Then we can write, compactly:
Where is the delta function and is the Heaviside step function. This is the standard triangular distribution, sometimes called the uniform difference distribution. The integration must be performed carefully here, because the cases when and , and when and must each be considered separately Blitzstein2014 . We notice right away that this expression is an even function of and so and so . We are only interested in distances, so without loss of generality we focus on . Thus, we can simplify:
To find we integrate:
Nothing on the right hand side of the above equation depends on the vehicle labels and . This observation is generally true for any pair of vehicles on adjacent lanes. In addition, this independence is true for any arbitrary real number . We are interested, however, specifically in the probability that two vehicles on adjacent lanes are separated by a distance less than , so we define:
This is the probability that a pair of vehicles in adjacent lanes is positioned such that it would completely block both of those lanes if the vehicles were frozen in place. For a two-lane road, this would completely block the motion of vehicles. When distributing an -tuple of vehicles on an lane road, the probability that the tuple does not block the entire road is given by
as there are pairs of lanes to consider.
Finally, we can calculate the overall probability that any tuple does block the highway. To do so, we consider every -tuple of vehicles that could potentially percolate, and find:
where is the number of vehicles in each lane, and there are tuples that could each potentially block the highway. In this last step, we assumed , i.e., there are equal numbers of vehicles in each lane. This was not strictly enforced in simulations, yet simulations still agreed with the analytical formula. Collecting all of these terms, and replacing with we find the result for Eq. (1) in the main text:
This mathematical prediction based on the hypothesis of percolation is consistent with simulations we performed varying each parameter (Supplementary Materials). The advantage offered by this calculation over direct numerical simulations is that it allows for immediate percolation probability calculations without the need for computationally intensive numerical simulations of agent-based models. Without this time-saving mechanism, our city level analysis would have been practically impossible.
.4 Intersections
Our analysis of citywide traffic in the post-hack scenario uses Eq. (1) to compute the probability of obstructions blocking traffic flow. This approach neglects potential effects that occur at intersections. We can justify this simplification with the following back-of-the-envelope calculation. First, we define the probability, , that a blockage occurs exactly in an intersection of length at the end of a road segment of size , as the difference in the blockage probability between the road of length and a hypothetical road of length . We then approximate . We compute the partial derivative from Eq. (1). Using parameters that are reasonable for Manhattan we find to be on the order of . For example, if km, m, vehicles/km/lane, , and m, then we find On the other hand, the total number of intersections in Manhattan is on the order of . Therefore, we expect that by making this simplification to ignore intersections, we are neglecting the effects of intersection within the entire city. This back-of-the-envelope estimate provides good evidence that ignoring intersections is quantitatively reasonable for our analysis.
.5 Code Availability
The results generated and analyzed in this study were derived from custom software. All code is available at https://github.com/dyanni3/Traffic-Simulations.
Acknowledgements
SV, DY, and PJY acknowledge support from the Georgia Tech Soft Matter Incubator. JLS was independently funded.
Data Availability
The datasets generated and analyzed in this study are available from the corresponding author upon request.
-
•
Custom software is available at:
https://github.com/dyanni3/Traffic-Simulations -
•
NGSIM data is available for public access through the US Department of Transportation:
https://ops.fhwa.dot.gov/trafficanalysistools/ngsim.htm -
•
Data for vehicle speeds in Manhattan was obtained from the NYC DOT:
http://www.nyc.gov/html/dot/html/about/datafeeds.shtml
References
- [1] Connected car market report. https://www.statista.com/outlook/320/109/connected-car/united-states#, 2018. Accessed: 2018-05-10.
- [2] Connected vehicle benefits. https://www.its.dot.gov/factsheets/pdf/ConnectedVehicleBenefits.pdf, 2018. Accessed: 2018-03-28.
- [3] Charlie Miller and Chris Valasek. Remote exploitation of an unaltered passenger vehicle. Black Hat USA, 2015, 2015.
- [4] Andy Greenberg. Hackers remotely kill a jeep on the highway—with me in it. Wired, 7:21, 2015.
- [5] Simon Parkinson, Paul Ward, Kyle Wilson, and Jonathan Miller. Cyber threats facing autonomous and connected vehicles: future challenges. IEEE Transactions on Intelligent Transportation Systems, 18(11):2898–2915, 2017.
- [6] Mani Amoozadeh, Arun Raghuramu, Chen-Nee Chuah, Dipak Ghosal, H Michael Zhang, Jeff Rowe, and Karl Levitt. Security vulnerabilities of connected vehicle streams and their impact on cooperative driving. IEEE Communications Magazine, 53(6):126–132, 2015.
- [7] World’s biggest data breaches. http://www.informationisbeautiful.net/visualizations/worlds-biggest-data-breaches-hacks/, 2018. Accessed: 2018-05-10.
- [8] General accountability office (gao), vehicle cybersecurity: Dot and industry have efforts under way, but dot needs to define its role in responding to a realworld attack, gao- 16-350. http://www.gao.gov/assets/680/676064.pdf, 2016. Accessed: 2018-03-27.
- [9] Mahmoud Hashem Eiza and Qiang Ni. Driving with sharks: Rethinking connected vehicles with vehicle cybersecurity. IEEE Vehicular Technology Magazine, 12(2):45–51, 2017.
- [10] Hackers are the real obstacle for self-driving vehicles. https://www.technologyreview.com/s/608618/hackers-are-the-real-obstacle-for-self-driving-vehicles/.
- [11] C Warren Axelrod. Cybersecurity in the age of autonomous vehicles, intelligent traffic controls and pervasive transportation networks. In Systems, Applications and Technology Conference (LISAT), 2017 IEEE Long Island, pages 1–6. IEEE, 2017.
- [12] Autonomous cars without human drivers are coming to california next year. http://bgr.com/2017/10/11/self-driving-car-tests-california-rules/, 2017. Accessed: 2018-03-27.
- [13] Driverless testing of autonomous vehicles. https://www.dmv.ca.gov/portal/dmv/detail/vr/autonomous/auto, 2018. Accessed: 2018-03-27.
- [14] Matt Richtel and Conor Dougherty. Google’s driverless cars run into problem: Cars with drivers. New York Times, 1, 2015.
- [15] Norbert Bißmeyer, Christian Stresing, and Kpatcha M Bayarou. Intrusion detection in vanets through verification of vehicle movement data. In Vehicular Networking Conference (VNC), 2010 IEEE, pages 166–173. IEEE, 2010.
- [16] Dirk Helbing. Traffic and related self-driven many-particle systems. Reviews of Modern Physics, 73:1067–1141, Dec 2001.
- [17] Martin Treiber, Ansgar Hennecke, and Dirk Helbing. Congested traffic states in empirical observations and microscopic simulations. Physical Review E, 62(2):1805, 2000.
- [18] Chenyi Chen, Li Li, Jianming Hu, and Chenyao Geng. Calibration of mitsim and idm car-following model based on ngsim trajectory datasets. In Vehicular Electronics and Safety (ICVES), 2010 IEEE International Conference on, pages 48–53. IEEE, 2010.
- [19] Martin Treiber and Dirk Helbing. Mobil: General lane-changing model for car-following models. Disponıvel em http://www. mtreiber. de/publications/MOBIL_TRB. pdf, Acesso em dezembro de, 2009, 2006.
- [20] Martin Treiber and Arne Kesting. Modeling lane-changing decisions with mobil. Traffic and Granular Flow’07, pages 211–221, 2009.
- [21] GB Whitham. On kinematic waves ii. a theory of traffic flow on long crowded roads. Proc. R. Soc. Lond. A, 229(1178):317–345, 1955.
- [22] Kai Nagel and Michael Schreckenberg. A cellular automaton model for freeway traffic. Journal de physique I, 2(12):2221–2229, 1992.
- [23] CC Thomas and Douglas J Durian. Fraction of clogging configurations sampled by granular hopper flow. Physical review letters, 114(17):178001, 2015.
- [24] Iker Zuriguel, Daniel Ricardo Parisi, Raúl Cruz Hidalgo, Celia Lozano, Alvaro Janda, Paula Alejandra Gago, Juan Pablo Peralta, Luis Miguel Ferrer, Luis Ariel Pugnaloni, Eric Clément, et al. Clogging transition of many-particle systems flowing through bottlenecks. Scientific reports, 4:7324, 2014.
- [25] Huba Péter, András Libál, Charles Reichhardt, and Cynthia JO Reichhardt. Crossover from jamming to clogging behaviors in heterogeneous environments. arXiv preprint arXiv:1712.03307, 2017.
- [26] M Sahini and M Sahimi. Applications of percolation theory. CRC Press, 2014.
- [27] Cambridge Systematics. Ngsim us 101 data analysis: Summary report. Prepared for Federal Highway Administration, 2005.
- [28] Réka Albert, Hawoong Jeong, and Albert-László Barabási. Error and attack tolerance of complex networks. nature, 406(6794):378, 2000.
- [29] Duncan S Callaway, Mark EJ Newman, Steven H Strogatz, and Duncan J Watts. Network robustness and fragility: Percolation on random graphs. Physical review letters, 85(25):5468, 2000.
- [30] Sofiane Abbar, Tahar Zanouda, and Javier Borge-Holthoefer. Robustness and resilience of cities around the world. arXiv preprint arXiv:1608.01709, 2016.
- [31] Jiaqiu Wang. Resilience of self-organised and top-down planned cities—a case study on london and beijing street networks. PLoS one, 10(12):e0141736, 2015.
- [32] Geoff Boeing. Osmnx: New methods for acquiring, constructing, analyzing, and visualizing complex street networks. Computers, Environment and Urban Systems, 65:126–139, 2017.
- [33] Daqing Li, Bowen Fu, Yunpeng Wang, Guangquan Lu, Yehiel Berezin, H Eugene Stanley, and Shlomo Havlin. Percolation transition in dynamical traffic network with evolving critical bottlenecks. Proceedings of the National Academy of Sciences, 112(3):669–672, 2015.
- [34] Louis M. Shekhtman and Shlomo Havlin. Percolation of hierarchical networks and networks of networks. Phys. Rev. E, 98:052305, Nov 2018.
- [35] Guanwen Zeng, Daqing Li, Shengmin Guo, Liang Gao, Ziyou Gao, H Eugene Stanley, and Shlomo Havlin. Switch between critical percolation modes in city traffic dynamics. Proceedings of the National Academy of Sciences, 116(1):23–28, 2019.
- [36] Michael Behrisch, Laura Bieker, Jakob Erdmann, and Daniel Krajzewicz. Sumo–simulation of urban mobility. In The Third International Conference on Advances in System Simulation (SIMUL 2011), Barcelona, Spain, volume 42, 2011.
- [37] Connected vehicle pilot deployment program: New york city, new york. https://www.its.dot.gov/factsheets/pdf/NYCCVPliot_Factsheet_020817.pdf, 2017. Accessed: 2018-05-11.
- [38] Nyc dot advances to phases two and three of federal connected vehicle pilot program. http://www.nyc.gov/html/dot/html/pr2016/pr16-094.shtml, 2016. Accessed: 2018-05-11.
- [39] Nypd motor vehicle collisions. https://www.autoinsurancecenter.com/traffic-accidents-in-new-york-city.html, 2018. Accessed: 2018-10-15.
- [40] Sabah Shamsh and Vandana Dubey. Roaming honeypots along with ids in mobile ad-hoc networks. International Journal of Computer Applications, 69(23), 2013.
- [41] Mohammed H Almeshekah and Eugene H Spafford. Cyber security deception. In Cyber Deception, pages 23–50. Springer, 2016.
- [42] Helbing D. Treiber M. Memory effects in microscopic traffic models and wide scattering in flow-density data. Physical Review E, 2003.
- [43] Hwang J. Blitzstein JK. Introduction to probability, 2017.