Correlated disorder to order crossover in the local structure of KxFe2-ySe2-zSz
Abstract
A detailed account of the local atomic structure and disorder at 5 K across the phase diagram of the high temperature superconductor KxFe2-ySe2-zSz is obtained from neutron total scattering and associated atomic pair distribution function (PDF) approaches. Various model independent and model dependent aspects of the analysis reveal a high level of structural complexity on the nanometer length-scale. Evidence is found for considerable disorder in the -axis stacking of the FeSe1-xSx slabs without observable signs of turbostratic character of the disorder. In contrast to the related FeCh (Ch = S, Se) type superconductors, substantial Fe-vacancies are present in KxFe2-ySe2-zSz, deemed detrimental for superconductivity when ordered. Our study suggests that the distribution of vacancies significantly modifies the iron-chalcogen bond-length distribution, in agreement with observed evolution of the PDF signal. A crossover like transition is observed at a composition of , from a correlated disorder state at the selenium end to a more vacancy-ordered (VO) state closer to the sulfur end of the phase diagram. The S-content dependent measures of the local structure are found to exhibit distinct behavior on either side of this crossover, correlating well with the evolution of the superconducting state to that of a magnetic semiconductor towards the end. The behavior reinforces the idea of the intimate relationship of correlated Fe-vacancies order in the local structure and the emergent electronic properties.
I Introduction
Recently discovered 122 type iron-based superconductors, with the formula AxFe2Se2 (A = alkali metals or Tl) Guo et al. (2010); Ye et al. (2011), and relatively high transition temperatures ( K) as compared to the simpler FeSe-11 type counterparts ( K) Hsu et al. (2008), have garnered significant interest in correlated electron systems research. This class of unconventional superconductors combines unique properties such as the coexistence of superconductivity and long-range antiferromagnetic (AF) order with large magnetic moments and Néel temperatures that far exceed room temperature Bao et al. (2011); Wang et al. (2011a); Yan et al. (2012); Krzton-Maziopa et al. (2016), while spectroscopic studies suggest the presence of a superconducting gap below 8 meV Charnukha et al. (2012a). Their behavior sets the stage for a tantalizing correlated electron materials conceptual problem, somewhat contrasting the cuprates, where superconductivity emerges from the antiferromagnetic Mott insulating state. The puzzle becomes even more complex as a wide range of ensemble average Louca et al. (2013); Carr et al. (2014); Shoemaker et al. (2012); Lazarević et al. (2012) and local structure Ksenofontov et al. (2011); Ding et al. (2013); Ricci et al. (2011); Wang et al. (2012) methods have shown strong evidence for nanoscale phase separation, particularly perpendicular to the iron-selenide planes Charnukha et al. (2012b).
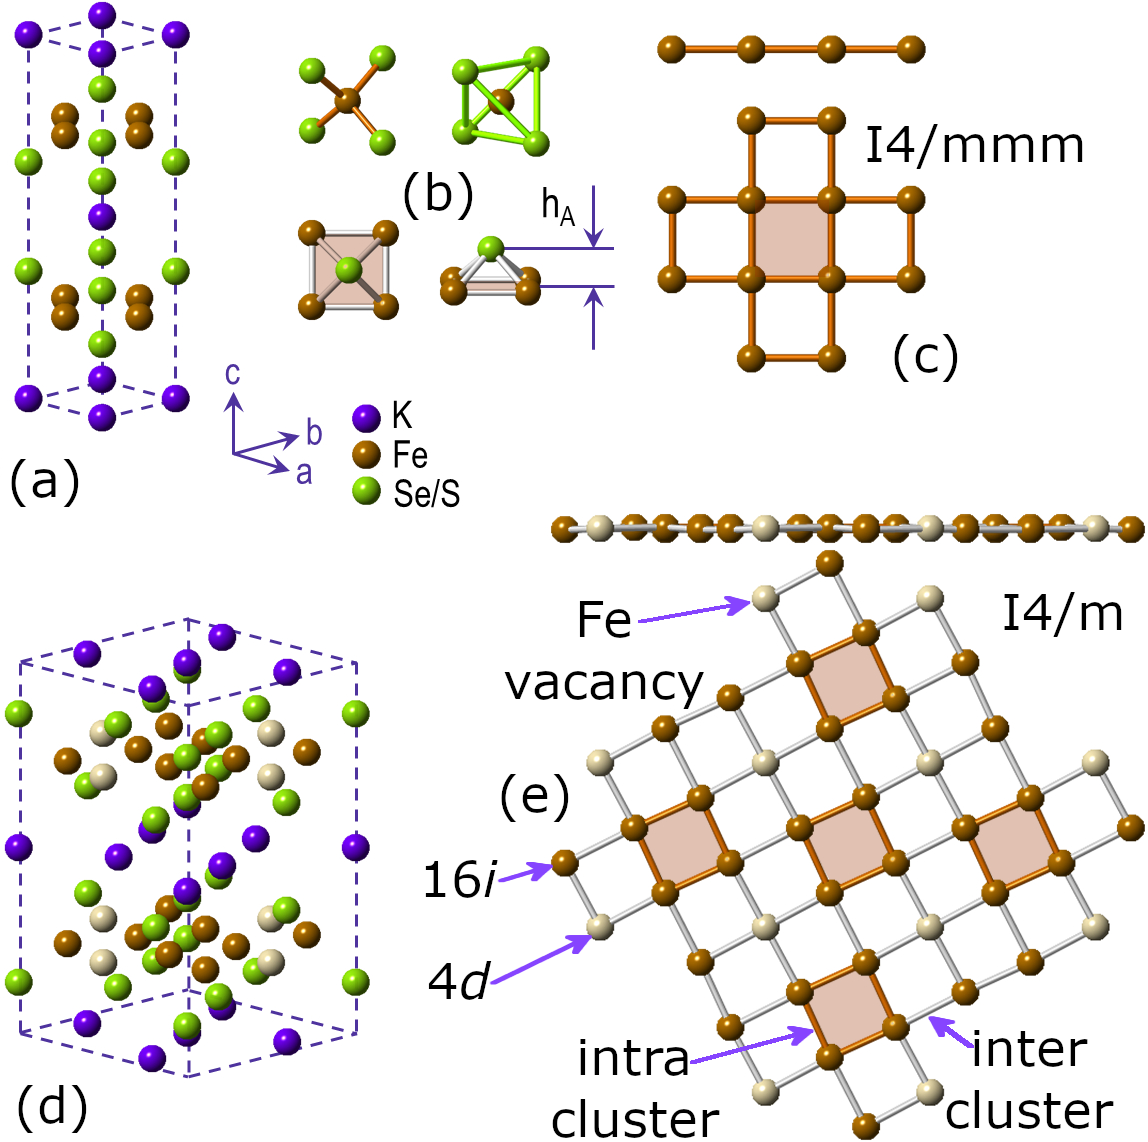
In an effort to describe the coexistence of superconducting and AF states, a common approach portrays a majority insulating AF Fe-VO A2Fe4Se5 phase (space group ), which is separated from the minority superconducting AxFe2Se2 phase (space group ) Lei et al. (2011); Texier et al. (2012); Friemel et al. (2012a). While the latter is characterized by fully occupied Fe atomic sites (Fig. 1a), the presence of Fe vacancies in the former (Fig. 1d) was believed to be detrimental to superconductivity Li et al. (2012); Friemel et al. (2012b). An understanding has then emerged inferring that what makes the materials non-superconducting is the magnetism bearing long-range ordering of Fe vacancies. This is described in the tetragonal symmetry, with two crystallographically distinct Fe-atomic sites, where one () is fully occupied, while the other () remains empty. Earlier neutron total scattering studies Mangelis et al. (2018) of KxFe2-ySe2 and the sulfide analogue KxFe2-yS2 revealed that the two-phase description reflects a sub-nanometer length scale, rendering such a model equivalent to an Fe-vacancy-disordered K2-xFe4+yCh5 (Ch = Se, S) single-phase case. The inhomogeneity and structural complexity of AxFe2-ySe2 makes it difficult to derive concrete conclusions about the nature of the relationship between the atomic structure and the observed physical properties. Since magnetic and insulating and superconducting patches are mixed on the scale of about 100 nm Wang et al. (2011b); Li et al. (2012), proximity effects of magnetic patches on superconducting islands are important Yi et al. (2009). Indeed, spectroscopy measurements have suggested the existence of a Josephson-coupled phase in the Se end-member Homes et al. (2012).
In an effort to resolve the delicate interplay of structural defects and properties, in situ scanning electron microscopy studies revealed that during the cooling of a specimen to room temperature, the formation mechanism of the superconducting phase in KxFe2-ySe2 passes through an ‘imperfect’ Fe-vacancy disorder-to-order transition, which is deemed responsible for the phase separation Liu et al. (2016). Crucial to mediating the physical response and the distribution of the vacancies appears to be the thermal treatment, including the quenching conditions Ding et al. (2013); Wang et al. (2015a, b). Indeed, the Fe-vacancy order to disorder transition can be achieved by a simple high-temperature annealing process Song et al. (2011); Wang et al. (2018), an approach which has also been pin-pointed by recent high energy, single-crystal X-ray diffraction experiments and Monte Carlo simulations, where superconductivity in quenched KxFe2-ySe2 crystals appears at the Fe-vacancy order-to-disorder boundary Duan et al. (2018). Notably, rapid quenching in KxFe2-ySe2 leads to a giant increase in the critical current density and yields specimens of higher Lei and Petrovic (2011)
In view of these intricate relationships, Wu et al. have suggested that the non-superconducting, alkali-modified FeSe-based magnetic insulators, which possess such Fe VO structures, should be considered as the parent compounds of the superconducting phases Wu et al. (2015). Disordering the Fe-vacancy order of the parent magnetic insulating phase, K2Fe4Se5, has been proposed as crucial for the emergence of superconductivity in KxFe2-ySe2 Wang et al. (2015a). Following this conceptual approach, X-ray absorption fine-structure studies Iadecola et al. (2012); Ryu et al. (2012) have prodvided evidence for local disorder in the structure of superconducting KxFe2-ySe2, suggesting that a non-zero population of Fe atoms at the site (Fig. 1e) is the key structural parameter for bulk superconductivity. As the debate still goes on as of what the role of Fe vacancies might be in the emergence of superconductivity and collapse of magnetism (or vice versa), seeking good model systems where similar features can be studied ultimately helps to broaden our knowledge base.
In this endeavor, the isostructural KxFe2-ySe2-zSz solid-solutions offer such a possibility as the substitution of Se by the isovalent S suppresses the superconducting state and gives rise to a magnetic semiconductor at Lei et al. (2011). Since the interplay of superconductivity and magnetism across the KxFe2-ySe2-zSz series seems to rely on intriguing structural details we have employed neutron total scattering combined with atomic pair distribution function (PDF) analysis to probe the local atomic structure that may correlate with such notable changes in the behavior. The study was carried over a dense grid of compositions at 5 K, the temperature at which superconductivity is observed in the selenium-rich part of the phase diagram, but gets suppressed towards the sulfur-rich end of the series. Our study corroberates previous reports of disorder in the stacking of the FeSe1-xSx slabs, which reflects yet another ingredient in an already structurally complex material, and has been previously linked to local potassium ordering and segregation, as well as superconductivity. Moreover, by complementing neutron PDF analysis with simulations based on large atomistic models, we explored the subtle nanoscale changes in the interatomic distances and the evolution of vacancy distribution in the Fe-chalcogen layers in the KxFe2-ySe2-zSz system. We demonstrate that numerous local structural quantities correlate well with , being marked by an Fe-vacancy correlated disorder to order crossover around the composition. From this we can infer that the Fe-vacancy distribution likely plays a critical role in the electronic properties
II Methods
Single crystals of KxFe2-ySe2-zSz were grown by self-flux method, and energy-dispersive x-ray spectroscopy (EDX) found no appreciable impurity elements, as described in detail elsewhere Lei et al. (2011). Crystals were pulverized into fine powders and seived to a maximum size of 40 m. Samples were thoroughly characterized by X-ray powder diffraction, magnetic susceptibility, and electrical resistivity measurements, as previously reported Lei et al. (2011).
Experiments were performed at NOMAD instrument Neuefeind et al. (2012) at the Spallation Neutron Source at Oak Ridge National Laboratory. Powdered samples were loaded in extruded vanadium containers and sealed under inert atmosphere, where helium was used as the exchange gas. Data were collected at 5 K, then corrected and reduced using standard protocols Egami and Billinge (2012). Neutron PDFs were obtained using the PDFgetN program Peterson et al. (2000) over a range from = 0.5 Å-1 to = 26 Å-1. Diffraction analysis did not find any evidence of crystal size broadining, suggesting crystal sizes were greater than 100 nm. Further details on these measurements are provided in Appendix A.
Measured and reduced data, including , and , were analyzed using various structure-model independent approaches, outlined in Appendix B. When performing structure-model dependent analysis of the same data, two structural models are relevant, with a space group of or . The details of these are summarized in Fig. 1, with finer details presented in Appendix C. Small-box PDF refinements were carried out using one or both of these models with the PDFgui software Farrow et al. (2007) as described in Appendix D. Large-box Simulated PDFs were computed with the DISCUS software package Proffen and Neder (1999) using a model with space group as described in Appendix E.
III Results and Discussion
III.1 Neutron diffraction
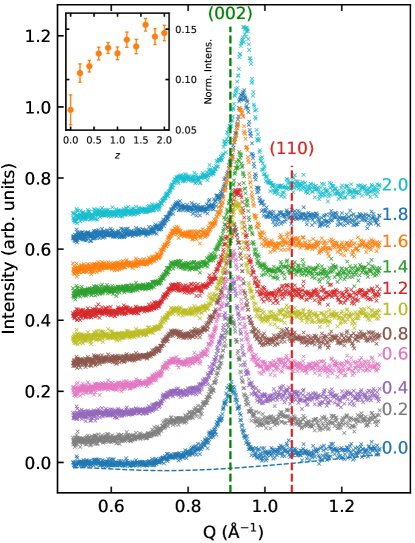
We start the KxFe2-ySe2-zSz system assessment by looking at the neutron powder diffraction data as seen by the low scattering angle detector bank of the NOMAD instrument, Fig. 2. The data across the entire composition series display a broad, diffuse feature at the expected location (red dashed line in Fig. 2) of the (110) peak associated with the long-range ordering of Fe vacancies. Macroscopic separation of a VO phase with a vacancy-free phase would not produce such a broad feature, but would instead produce a relatively sharp, albeit weak, (110) peak. The diffuse nature of the observed (110) peak suggests that idealized vacancy-order is not achieved, but rather that a type of imperfect order or “correlated disorder” Welberry (1985); Keen and Goodwin (2015) exists across the series. This is commonly observed in other order-disorder type systems such as, for example, in copper-gold intermetallic alloys Cowley (1965); Moss and Clapp (1968); Moss (2005); Owen et al. (2017).
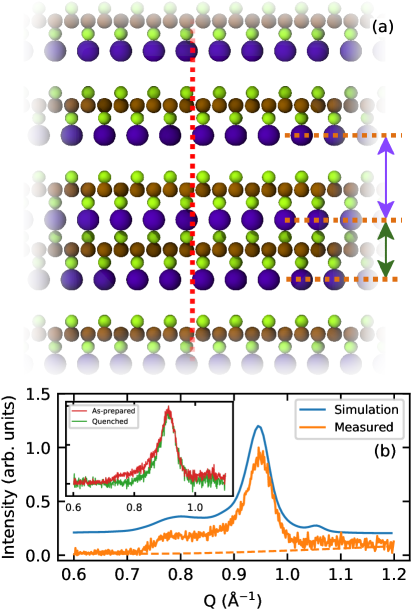
Additionally, diffraction data across the entire composition series show a broad and bi-modal distribution of intensity at the expected location of the (002) peak, as marked by a green dashed line in Fig. 2. Focusing on the specific example of KxFe2-yS2 in Fig. 3b, we note that the primary peak at Å-1 can be indexed in either the or space group as (002), but the additional low- shoulder-like feature at Å-1 cannot be indexed in either space group. Such additional diffuse intensity in the vicinity of inter-layer diffraction peaks is common in clay systems with more than one inter-layer distance Plançon (2004); Guinier (1994); Drits and Tchoubar (1990).
DISCUS simulations considering large super-cells in the KxFe2-yS2 system with two distinct inter-layer distances, 6.55 Å (66 % prevalence) and 8.0 Å (34 % prevalence) (see Fig. 3a) reproduce this experimentally observed bi-modal intensity distribution well, as seen in Fig. 3b. Importantly, these two distinct inter-layer distances exist in the same crystal, not segregated to distinct phases. A phase segregated physical mixture would produce two distinct diffraction features, rather than the continuous intensity distribution seen in Fig. 2 and Fig. 3b. The relative intensity of the additional low- shoulder-like feature increases with increasing sulfur content (Fig. 2 inset), suggesting that the prevalence of a second longer inter-layer distances increases with increasing sulfur content. Comparison of the data for two KxFe2-ySe2 samples obtained by different thermal treatment reveals that this type of disorder can be suppressed by quenching (see inset to Fig. 3(b)).
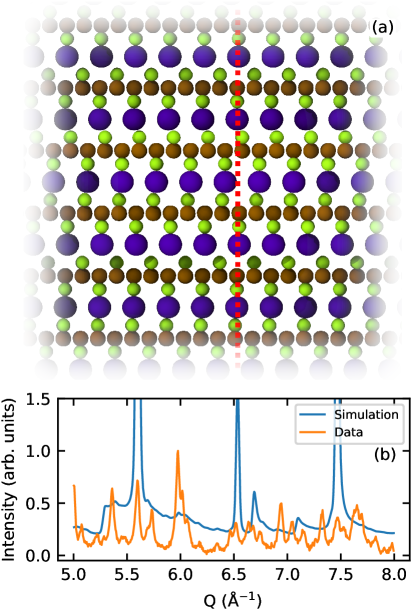
Similar DISCUS simulations with a single inter-layer distance but random shifts along the and lattice directions (known as turbostratic disorder, see Fig. 4a) produce a diffraction pattern characteristic for such disorder, where peaks are broadened into indistinct -bands Drits and Tchoubar (1990); Ufer et al. (2004). As can be seen in Fig. 4b, this significantly reduces the number of distinct Bragg peaks, and creates a characteristic saw-tooth pattern. In Fig. 4b we again present an example diffraction pattern for KxFe2-yS2, where no such saw-tooth like features are observed.
These simulations effectively demonstrate that the KxFe2-ySe2-zSz specimens exhibit at least two distinct inter-layer distances, without observable turbostratic disorder. This anisotropic crystallinity naturally suppresses inter-layer correlations, while intra-layer correlations persist. Additionally, the broad nature of the (110) ordering peak indicated that an imperfect or correlated local vacancy order is likely present, a feature which will necessarily only manifest in the local atomic structure. For these reasons, our small-box PDF modelling has focused explicitly only on the very local structure ( Å).
Such dual-interlayer distance has been reported previously, and was linked to potassium segregation and local ordering Wang et al. (2015b). This additional diffraction feature is the only evidence of such local segregation and potassium ordering found here. No evidence of this behavior was found in the PDF studies discussed below, although the PDF in this case is not particularly sensitive to potassium.
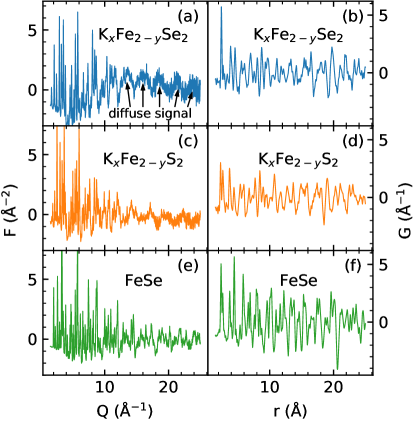
Reduced total scattering structure functions, , for the KxFe2-ySe2 and KxFe2-yS2 end-members are shown in Fig. 5a and Fig. 5c, respectively, along with the related FeSe reference in Fig. 5e. By inspecting these data one readily sees that Bragg peaks at high- get suppressed when moving from the sulfur to the selenium end-member, or even when moving from the FeSe compound to either 122-type system, and that appreciable diffuse signal appears. Suppression of Bragg peaks and appearance of diffuse intensity are indicators for the presence of disorder, suggesting that the relative amount of disorder increases when moving from the related FeSe phase to KxFe2-yS2 and then to KxFe2-ySe2.
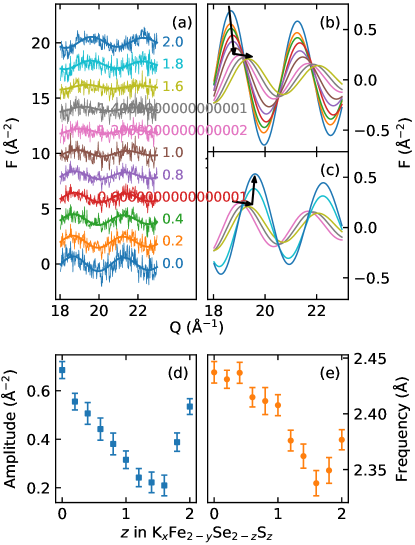
The diffuse signal in is present in the data for the entire KxFe2-ySe2-zSz series, as evident in Fig. 6a, and has a sinusoidal character at high-. Fitting with a damped Sine function in the range Å-1 allows us to quantify the amplitude and frequency of this oscillatory behavior as a function of sulfur content , shown in Fig. 6d and Fig. 6e. We note that these oscillations are the strongest in the selenium end-member, and are gradually suppressed with increasing sulfur content, reaching a minimum in the range . Above , these oscillations again increase in amplitude. This suppression and recovery is highlighted when viewing the fitted Sine functions, as can be seen in Fig. 6b and Fig. 6c. The frequency of the wave follows a similar two-regime behavior, delineated by the composition at .
III.2 PDF analysis
Interpretation of these Sine-like oscillations of the diffuse signal in -space is not straightforward. However, the presence of a sinusoidal oscillation in should map to the PDF , as the two are related by a Fourier transform. Specifically, a periodic signal in with frequency and amplitude should manifest as an enhancement (proportional to ) of the peak in at .
Indeed, this agrees with qualitative assessments of the PDFs. The frequency and relative amplitude of the periodic signal in parallels the position and relative sharpness (compared to higher- peaks) of the first PDF peak. The PDF of KxFe2-ySe2, shown in Fig 5b, has a sharp first peak at Å, followed by relatively broad features at higher-. Interestingly, the observed maximum of this feature is nearly twice as intense as any other feature in the PDF. Conversely, the PDF of KxFe2-yS2, shown in Fig 5d, shows a peak at Å which is of comparable sharpness to higher- peaks.
Typically, the observation of -dependent PDF peak widths is associated with correlated atomic motion Jeong et al. (1999). Generally speaking, these relative widths describe the nature of the bonding in the material Jeong et al. (2003). For example, an “infinitely” sharp first PDF peak would indicate that the nearest-neighbor pairs always move in phase, and that this bond is extremely rigid. Conversely, a first PDF peak that is of the same width as higher- peaks would indicate that nearest-neighbor pairs do not influence each-other strongly. The origin of this behavior in the system studied here will be addressed below.
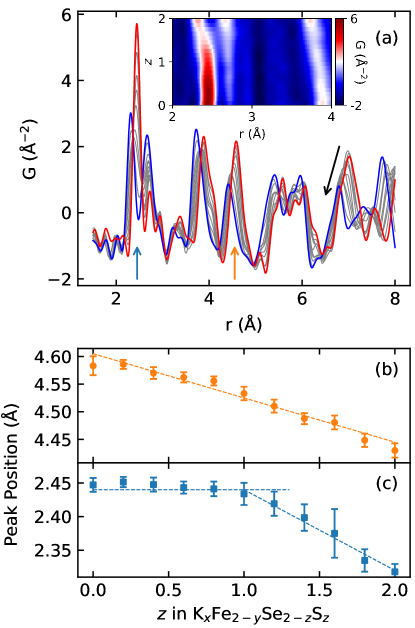
The PDFs across the composition series at 5 K are shown in Fig. 7a, and the positions of a higher- peak as well as the first peak, representing Fe-Ch correlations, are shown in Fig. 7b and Fig. 7c, respectively. Interestingly, the position of the Fe-Ch peak is nearly unchanged in the range , signifying that the Fe-Ch pair distance is unaffected by the substitution of sulfur for selenium. This is in stark contrast to the typical Vegard’s law-type behavior, predicting a linear change in lattice parameter as a function of chemical substitution due to steric effects Vegard (1921). This counter-intuitive behavior is however a strictly local effect, as the expected linear pair-distance behavior is recovered if we consider the position of most higher- peaks (Fig. 7a and 7b). This is further evidence that the very local structure has a distinct two-regime type behavior.
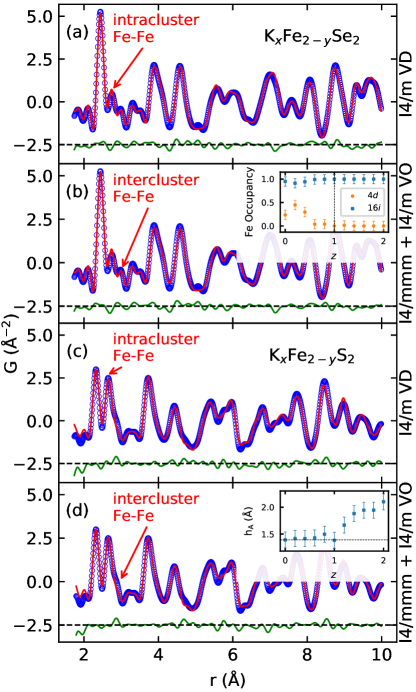
Fitting the local structure region of the observed PDFs ( Å) with a two-phase model incorporating both the VO and the vacancy-free phases yielded fits which were equivalent in quality to those done with a single-phase VD model, where the occupancy of Fe on the two distinct crystallographic sites is allowed to vary. Examples of these fits for the S- and Se-end-members are shown in Fig. 8. In these two-phase models, all samples across the series possess the minority phase with an average refined volume percentage of ca. 8 %.
Importantly, only the lower symmetry model supports the existence of two unique Fe-Fe correlation peaks representing inter- and intra-cluster Fe-Fe correlations (see Fig. 1e and Fig. 8), and these two unique Fe-Fe correlation peaks were observed throughout the entire composition range (see Fig. 7a). Additionally, the absence of well-defined sharp (110) reflections (Fig. 2) indicates that perfect vacancy order cannot be present, and thus the presence of a model with exactly zero Fe 4 site-occupancy is inconsistent with the diffraction data. The single-phase VD model is also a simpler model with fewer free parameters compared to the two-phase description. For these reasons, the single-phase VD model was preferred and utilized here.
While single-phase fits using a VD model may seem inappropriate, as other earlier studies have found evidence for phase separation, it is important to note that the PDF analysis presented here considers only very local (less than 1 nm) structural features. Our small-box modeling approach, shown in Fig. 8, suggests that over sub-nm length scales the -VD model and -VO+ model are equivalent descriptions in terms of explaining the observed data. It is important to highlight that this single phase description is not intended to contest the accepted phase separation picture of this system. It is possible and perhaps even likely that local correlated vacancy order may manifest as phase separation over longer length scales, but our results show that the two (phase separation and a single phase with partial vacancy site occupancy) are both equivalent descriptions of the local structure when using small-box fitting approaches.
The inset in Fig. 8b shows the refined occupancy of the two symmetry-distinct Fe sites, at 4 and 16 extracted from the single-phase VD PDF fits. This Fe site occupancy allows for the presence of both vacancy-free domains, attributed to the superconducting behavior, as well as VO AF domains. Any refinement to a non-zero Fe 4 site occupancy suggests that both domains are present. The refined 4 site occupancy then acts as an estimate of the fraction of the vacancy-free phase.
As sulfur is substituted for selenium, the 4 site moves from partially occupied to completely empty, whereas the 16 site moves from partially vacant to completely occupied. The situation where the 4 Fe is completely vacant and the 16 is completely occupied represents the VO phase, associated with suppression of superconductivity Wu et al. (2015), whereas a partial occupancy suggests imperfect vacancy ordering, or the presence of both vacancy-free and VO domains in a single coherent lattice. Thus, we note a cross-over behavior in the vacancy distribution or phase separation of the local structure, from partial to nearly ideal ordering. According to our PDF fits, this transformation occurs locally in this system at , or about 50 % sulfur substitution at 5 K.
The inset in Fig. 8d shows the refined anion height in presumed the superconducting phase from the two phase fits. The horizontal dashed line represents the reported optimal anion height for superconductivity Mizuguchi et al. (2010). For , is constant and adopts the ideal value, whereas for , increases beyond the ideal value. The evolution of anion height across the series corroborates the Mizuguchi rule Mizuguchi et al. (2010) and parallels the observed suppression of superconductivity for ,.
The results presented so far all demonstrate a two-regime behavior, and this is consistent with the electronic phase diagram. Electrical transport measurements suggest that is appreciably suppressed, beginning at , with no evidence of superconductivity above Lei et al. (2011). The structure function shows high- oscillations which decrease in magnitude and frequency up to and then recover for (Figs. 5 and 6). The frequency and magnitude of these oscillations correlate with the position and relative sharpness, respectively, of the Fe-Ch NN peak as observed in the PDFs of the KxFe2-ySe2-zSz series at 5 K. Furthermore, this Fe-Ch NN peak disobeys Vegard’s law up to about (Fig. 7c) as shown by both the and analysis.
While each aspect of our analysis highlights that the KxFe2-ySe2-zSz series exhibits a two-regime behavior at 5 K, it is not immediately apparent how each individual element of this analysis is related to the others. The exaggerated sharpness of the Fe-Ch NN peak (relative to higher- PDF peaks) in the selenium rich regime signifies that the Fe-Ch bond length distribution (BLD) is significantly narrower compared to Fe-Ch BLD in the sulfur rich regime Mangelis et al. (2018). This Fe-Ch BLD in KxFe2-ySe2 (Fig. 5b) is also much sharper even than that seen in FeSe, observed under similar conditions (Fig. 5f). This is intriguing, as the Fe-Ch NN correlations in both KxFe2-ySe2 and FeSe are due to the same structural motif of FeSe4 edge-shared tetrahedra. Thus, the observed differences in the Fe-Se BLDs between KxFe2-ySe2 and FeSe cannot be due to chalcogen size mismatch. It is then also possible that something other than simple steric differences between sulfur and selenium contribute to the differences in relative Fe-Ch BLDs (peak sharpness) across the KxFe2-ySe2-zSz series.
Notably, the results presented so far further suggest that the two regime behavior is marked by a crossover from a correlated disorder state to more complete vacancy-order within the local structure. While it is expected that vacancy ordering impacts the overall disorder of the structure, it is also possible that it directly impacts the Fe-Ch BLD as observed through the first PDF peak.
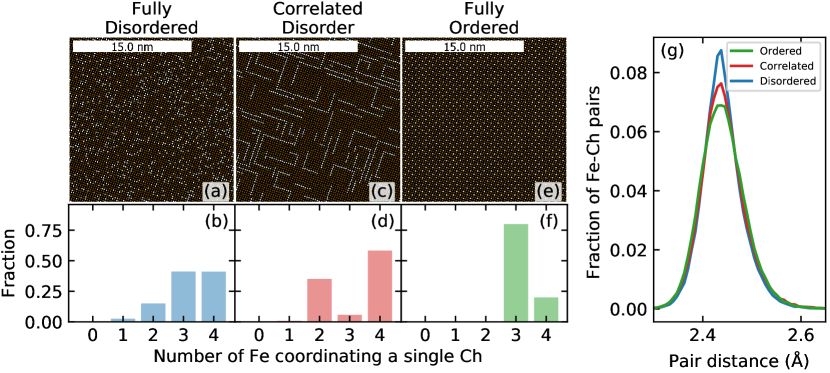
To explore this aspect further, we considered three large atomistic models with different local vacancy distributions but similar average structure. The first was built with a uniformly disordered arrangement of vacancies (Fig. 9a), the second with correlated vacancy disorder (Fig. 9c), and the third with a completely ordered arrangement of vacancies (Fig. 9e). Importantly, these three configurations were created with identical overall vacancy concentrations (20 %, as suggested by previous EDX studies on these samples Lei et al. (2011)) using the same space-group () and unit cell parameters.
If each of these large configurations are folded into a single unit cell, they would appear nearly identical, with the primary difference being the occupancy of the distinct Fe sites in the space group. It is clear however, that the local structure of each is quite distinct. This local vs. average discrepancy highlights the shortcomings of traditional crystallography in describing such materials Welberry (1985); Proffen (2000); Keen and Goodwin (2015), and reiterates our earlier observations of pervasive anisotropic broadening of the (110) diffraction peak as demonstrated in Fig. 2.
In these atomic configurations, each chalcogen species can be coordinated by either four Fe, four vacancies, or permutations of both Fe and vacancies. For each atomistic model, we quantified the total number of each of the five possible configurations. These results are presented in Fig. 9b,d,f in form of normalized histograms showing the distribution of Ch with a specific number of Fe neighbors for the VD, correlated-disorder, and VO atomistic models, respectively.
For the VO case, the results are as expected, 20 % of chalcogens are fully coordinated by four Fe, whereas 80 % of chalcogens are coordinated by three Fe and a single vacancy, and no chalcogens are coordinated by two or more vacancies.
The VD case is more interesting: a significant fraction of chalcogens ( %) are severely under-coordinated, with two or more missing Fe NN. Moreover, and importantly, the percentage of fully coordinated chalcogens nearly doubles compared to the VO case. These vacancy-free configurations can be associated with the presumed superconducting phase Lei et al. (2011). Surprisingly, and somewhat counter-intuitively, the increase in fully coordinated chalcogens is a result of disordering the vacancies in this system. The atomic configuration exhibiting correlated disorder however shows the greatest prevalence of fully coordinated chalcogens, notably the vacancy-free domains represent more than %, greater than the percolation threshold in a square lattice.
It is interesting to note that the atomic arrangement depicted in Fig. 9c shows a distinct pattern, where linear stripes of vacancies meet at right angles and are arranged around vacancy-free domains. This mirrors the striking microstructures observed in many cases in the Se-end-member (KxFe2-ySe2) system Ding et al. (2013); Wang et al. (2015b); Liu et al. (2016).
If the three configurations exemplified by Fig. 9a,c,e are energy minimized in the presence of an identical Lennard-Jones potential between Fe and Ch NNs, as outlined fully in in Appendix E, the resulting Fe-Ch BLDs, shown in Fig. 9g, are different. Specifically, the Fe-Ch BLD of the energy minimized VD configuration is noticeably sharper than the VO configuration, whereas the configuration showing correlated disorder represents an intermediate case. It is important to note that the energy minimization did not involve site swapping or vacancy rearrangement, and as such the resulting atomistic models are indistinguishable from those shown in Fig. 9a,c,e. Our finding is quite surprising, given that the sharpest distribution originates from a system with the most overall disorder.
Our simulations demonstrates that the relative arrangement of vacancies has an intrinsic impact on the Fe-Ch BLD, even in the presence of identical pair-wise interactions. This idea makes intuitive sense, as the VD state shows a greater prevalence of severely undercoordinated chalcogen species. Using the language of “correlated motion” of nearest neighbors, this could imply that these severely under-coordinated chalcogens will form a more rigid bond with the fewer Fe species they are coordinated by, leading to a relatively narrower Fe-Ch BLD.
The result also offers an explanation of the two-regime behavior. Specifically, for the selenium-rich cases the local structure may show correlated or imperfect vacancy order, characterized by domains with no vacancies coexisting in the same lattice with domains showing ordered vacancies. Conversely, in the sulfur-rich cases, a vacancy redistribution may create more idealized ordering. This is further supported by the increased prevalence of the longer inter-layer spacing towards the sulfur end of the phase diagram, as shown in Fig. 2 and discussed in Fig. 3b. This longer inter-layer spacing has been linked in previous work on the Se-end-member to localized domains with larger than average potassium concentrations Wang et al. (2015b). This same study has further shown that Fe-vacancy ordering is linked closely to superconductivity and the distribution of potassium Wang et al. (2015b).
This effect manifests in through suppression of Bragg peaks at high- (Fig. 6), leading to the observation of a strong sinusoidal intensity oscillation. In this oscillation manifests as a relatively sharp first peak followed by broader high- peaks (Fig. 7), corresponding to a sharper Fe-Ch BLD.
It is likely that the local structure of each sample sits somewhere between the fully VD and fully ordered case, represented by Fig. 9a and Fig. 9e respectively. To further quantify the degree of correlated disorder, we have conducted structure-model independent analysis of the first three measured PDF peaks across the series. These peaks correspond to Fe-Ch, Fe-Fe intra- and inter-cluster correlations, in order of increasing .
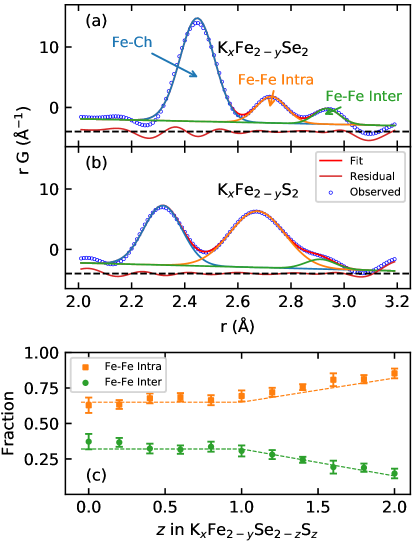
Fig. 10a,b shows example fits of Gaussian profiles to the radial pair distribution function for the selenium and sulfur end-members, respectively. As the Fe-Fe intra- and inter-cluster peaks are a result only of Fe-Fe correlations, their mutual relative contributions to the PDF are not impacted by the overall system chemistry, and their area normalized to the area of the pair give an indication of the prevalence of the distinct Fe-Fe environments. In Fig. 10c we show the relative fraction of Fe-Fe intra- and inter-cluster pairs as obtained from this analysis. We see that for the selenium-rich phases up to the relative abundance of each type of Fe-Fe pair is largely unchanged. In the sulfur-rich portion when there is a monotonic increase in the fraction of intra-cluster pairs at the expense of inter-cluster pairs. This is consistent with vacancy redistribution and an increase in vacancy ordering when moving from Se-rich toward S-rich end of the phase diagram, as the fully ordered configuration should maximize the fraction of intra-cluster Fe-Fe pairs. This analysis further supports the two regime behavior of this system in phase-space.
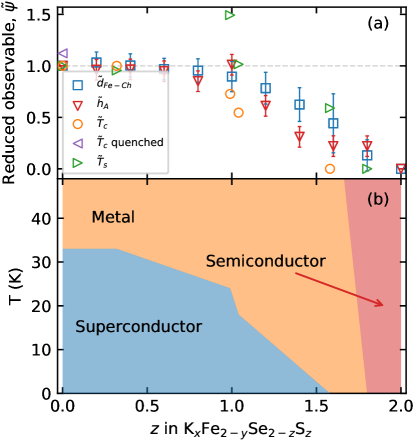
Finally, we explore the correlation between the measures of local structure outlined here to the electronic properties in this system in the context of “reduced observables” computed as a function of sulfur content, . We define a reduced observable as the observed quantity at a given composition normalized by the same observed quantities at the composition end-members ( and ) such that . By design, and .
Results for the superconducting temperature and metal-insulator transition temperature , reported previously Lei et al. (2011) and the Fe-Ch distance , as well as the anion height derived from the present PDF analysis, are plotted in Fig. 11a. Also included for reference is the of a quenched KxFe2-ySe2 sample. Importantly, for quenched sample is higher than for as-prepared, in line with the idea that stacking disorder and potassium distribution play an important role for superconducting properties of this system Lei and Petrovic (2011).
The results are striking, as each of these reduced quantities largely follow the same trend, remaining essentially constant up to , then decreasing steadily in the range . This serves to emphasize the apparent connection between the sub-nanometer atomic structure at 5 K, as studied here, and the electronic properties (see e.g. Fig. 11b and Ref. Lei et al. (2011)), which invites further complementary experimental and theoretical considerations.
IV Conclusions
In summary, the local atomic structure and structural disorder have been characterized across the phase diagram of KxFe2-ySe2-zSz system, displaying both superconductivity and magnetism, by means of neutron total scattering and associated atomic PDF analysis of 5 K data. Using various structure-model independent and model dependent approaches we find a high level of structural complexity on the nanometer length-scale. The analysis highlights the presence of considerable disorder in the -axis stacking of the Fe2Se2-zSz slabs, which has a non-turbostratic character, and can be suppressed by thermal quenching. PDF fitting suggests that over sub-nanometer length scales a simple two-phase physical mixture description (VO and vacancy-free) is equivalent to a single phase description allowing for partial Fe occupancy of the vacancy site. Within this description, a non-zero Fe occupancy of the site indicates the presence of vacancy free superconducting domains. Complementary aspects of the analysis reveal a crossover like behavior, with an onset at , from predominantly correlated disorder state towards the selenium end of the phase diagram, to a more ordered vacancy distribution closer to the sulfur end of the phase diagram. Through simulations based on large scale atomistic models we demonstrate that the distribution of vacancies can significantly modify the NN bond length distribution, observably affecting the NN environment, as corroborated by the features in the data. The correlation of electronic properties with the Fe vacancy distribution may imply that the disorder of Fe vacancies in the local structure creates ‘domains’ resembling Fe-vacancy-free superconducting phase, which may be suppressed with the correlated disorder to order crossover across the series. This could imply that the SC bearing vacancy-free phase is suppressed with S substitution, although our analysis does not directly probe this aspect. The local structure observations and their correlation with electronic properties presented here add to the nuanced picture of the role of atomic structure in this system, and should help to inform future experimental and theoretical work seeking to understand the mechanisms behind these correlations.
V acknowledgments
Work at Brookhaven National Laboratory was supported by U.S. Department of Energy, Office of Science, Office of Basic Energy Sciences (DOE-BES) under contract DE-SC0012704. Alexandros Lappas acknowledges support by the U.S. Office of Naval Research Global, NICOP grant award No. N62909-17-1-2126. This research used resources at the Spallation Neutron Source, a U.S. Department of Energy Office of Science User Facility operated by the Oak Ridge National Laboratory. Notice this paper has been co-authored by UT-Battelle, LLC under Contract No. DE-AC05-00OR22725 with the U.S. Department of Energy. The United States Government retains and the publisher, by accepting the article for publication, acknowledges that the United States Government retains a nonexclusive, paid-up, irrevocable, world wide license to publish or reproduce the published form of this paper, or allow others to do so, for United States Government purposes. The Department of Energy will provide public access to these results of federally sponsored research in accordance with the DOE Public Access Plan (http://energy.gov/downloads/doepublic-access-plan)
Appendix A Neutron total scattering
Experiments were performed using powder samples, 0.5 g of each, equally spaced across the Se/S compositional space , loaded into 6 mm diameter extruded vanadium containers under inert atmosphere and sealed. Each sample was mounted in the diffractometer equipped with Orange cryostat. The instrument was calibrated using diamond powder standard. Powder diffraction data were collected after thorough equilibration at 5 K for 2 h of total counting time for each sample. Neutron PDFs were obtained via Sine Fourier transforms over a range from = 0.5 Å-1 to = 26 Å-1.
Appendix B Structure-model independent analysis
Fitting of PDF data for decomposition into constituent peaks was done with the fityk v 1.3.1 software package Wojdyr (2010) using Gaussian functions and a linear baseline function where the intercept term was fixed at zero. The data for each sample were fitted with a damped Sine function after subtracting a fitted linear background.
Appendix C Structural models
Within the system, two possible structural models have been put forward. The simplest model, with space group , consists of FeCh (Ch = Se/S) slabs featuring a Fe square planar sublattice (Fig. 1a-c). Each Fe is coordinated by four Ch creating layers of edge-shared FeCh4-tetrahedra, stacked along the c lattice direction and interleaved with K species equidistant from each layer. In this model, the asymmetric unit contains a single Fe at 4 , Ch at 4 , and K at 2 . The relatively simple structure, with only one unique Fe site, gives little flexibility for handling vacancies on the Fe sub-lattice, which are common in this system Carr et al. (2014); Ding et al. (2013); Wu et al. (2015).
A more complicated model, with space group , is related to the higher symmetry model through a rotation in the plane and a increase in the lattice parameters (Fig. 1d,e). The increase in unit cell size doubles the number of atoms in the asymmetric unit, with two symmetry-distinct Fe at 4 and 16 , Ch at 4 and 16 , and K at 2 and 8 . Importantly, within both these symmetries the FeCh4 tetrahedra of adjacent layers are translated in the x and y direction by half unit cell lengths. This can be contrasted with the related FeCh-11 group of superconductors, where adjacent layers of FeCh4-tetrahedra contain no such relative and translation.
Appendix D Small-box refinements
The experimental PDF data were fit with the structural models described over a 10 Å range using the PDFgui software Farrow et al. (2007). Over wider -ranges the experimental PDF is dominated by the inter-layer correlations, and our analysis reveals that these are affected by appreciable stacking disorder, which is highly non-trivial to handle using conventional PDF approaches and is beyond the scope of this study. Two alternative modeling approaches were attempted in sub nanometer regime. The first approach used a mixture of vacancy-free and fully Fe VO phase components. The second approach utilized only a VD version of . The two approaches were found to yield effectively identical fit qualities and comparable descriptions of the underlying structure Mangelis et al. (2018). The VD model with symmetry, systematically applied to all data, used a total of 19 fitting parameters. These included the unit cell parameters , a scale factor, and a correlated motion parameter Jeong et al. (1999). Further, the fractional coordinates were refined according to the space group constraints (9 parameters), and the atomic displacement parameters (ADP) were set to be isotropic () and identical for all atomic species of the same type (3 parameters). The occupancies of the two symmetry-distinct Fe crystallographic sites (4 and 16) were allowed to vary separately, while the occupancies of potassium atoms in 2 and 8 sites were constrained to be equal because of relative insensitivity of the neutron PDF to potassium (3 occupancy parameters). The occupancies of Ch species were fixed at their nominal values as refinements did not suggest chalcogen sub-lattice ordering. Refinements were done sequentially, such that for any given composition the PDF refinement was initialized using the converged model of the previous composition. Additionally, appropriately constrained two-phase fits were used to track the evolution of the anion height estimated from the vacancy-free component.
Appendix E Large-box simulations
Simulated PDFs were computed with aid of the DISCUS v 5.30.0 software package Proffen and Neder (1999) using a model with space group . The global concentration of Fe was fixed at the nominal concentration, with full occupancy of the 16 site and full vacancy occupancy of the 4 site. The global concentration of K was fixed at the nominal concentration, spread uniformly across the 2 and 8 sites. For stacking fault simulations, the stack module of the DISCUS software package was used, with a layer supercell of unit cells and total thickness of 1,500 layers. The powder pattern was computed using the Fast Fourier method in DISCUS, with a 0.001 reciprocal length unit (r.l.u) mesh for powder integration. For simulations on the impact of vacancy disorder, a supercell of unit cells was used. Atoms were initialized with a random thermal displacement such that their mean squared displacement across the whole supercell was consistent with the ADP parameters refined from the KxFe2-ySe2-zSz PDF data. Following this, atomic displacement vectors were swapped between atoms of like identity to minimize the total energy composed of a pairwise Lennard Jones (LJ) potential between NN Fe-Ch pairs, specifically
| (1) |
over all atoms , with
| (2) |
The LJ potential was constructed such that the equilibrium NN Fe-Ch bond distance was that refined from the KxFe2-ySe2-zSz PDF data ( Å) with potential depth . Swaps were always accepted if they decreased the total energy, and conditionally accepted if they increased the total energy, with probability , where is the change in energy associated with the swap, is the Boltzmann constant, and is the temperature, in this case 5 K. The total number of swaps was fixed at 100 times the number of atoms in the supercell.
References
- Guo et al. (2010) J. Guo, S. Jin, G. Wang, S. Wang, K. Zhu, T. Zhou, M. He, and X. Chen, Physical Review B 82 (2010), ISSN 1098-0121, 1550-235X, URL https://link.aps.org/doi/10.1103/PhysRevB.82.180520.
- Ye et al. (2011) F. Ye, S. Chi, W. Bao, X. F. Wang, J. J. Ying, X. H. Chen, H. D. Wang, C. H. Dong, and M. Fang, Physical Review Letters 107 (2011), ISSN 0031-9007, 1079-7114, URL https://link.aps.org/doi/10.1103/PhysRevLett.107.137003.
- Hsu et al. (2008) F.-C. Hsu, J.-Y. Luo, K.-W. Yeh, T.-K. Chen, T.-W. Huang, P. M. Wu, Y.-C. Lee, Y.-L. Huang, Y.-Y. Chu, D.-C. Yan, et al., Proceedings of the National Academy of Sciences 105, 14262 (2008), ISSN 0027-8424, eprint 0807.2369, URL http://www.pnas.org/cgi/doi/10.1073/pnas.0807325105.
- Bao et al. (2011) W. Bao, Q.-Z. Huang, G.-F. Chen, D.-M. Wang, J.-B. He, and Y.-M. Qiu, Chinese Physics Letters 28, 086104 (2011), ISSN 0256-307X, 1741-3540, URL http://stacks.iop.org/0256-307X/28/i=8/a=086104?key=crossref.f901c13ab3f52735c5ed4ab5ec60b52e.
- Wang et al. (2011a) M. Wang, M. Wang, G. N. Li, Q. Huang, C. H. Li, G. T. Tan, C. L. Zhang, H. Cao, W. Tian, Y. Zhao, et al., Phys. Rev. B 84, 094504 (2011a), URL https://link.aps.org/doi/10.1103/PhysRevB.84.094504.
- Yan et al. (2012) Y. J. Yan, M. Zhang, A. F. Wang, J. J. Ying, Z. Y. Li, W. Qin, X. G. Luo, J. Q. Li, J. Hu, and X. H. Chen, Scientific Reports 2, 212 (2012), ISSN 2045-2322, URL https://www.nature.com/articles/srep00212.
- Krzton-Maziopa et al. (2016) A. Krzton-Maziopa, V. Svitlyk, E. Pomjakushina, R. Puzniak, and K. Conder, Journal of Physics: Condensed Matter 28, 293002 (2016), ISSN 0953-8984, 1361-648X, URL http://stacks.iop.org/0953-8984/28/i=29/a=293002?key=crossref.69cc6457d4c8d16193378c7658a543e4.
- Charnukha et al. (2012a) A. Charnukha, J. Deisenhofer, D. Pröpper, M. Schmidt, Z. Wang, Y. Goncharov, A. N. Yaresko, V. Tsurkan, B. Keimer, A. Loidl, et al., Physical Review B 85, 100504 (2012a), URL https://link.aps.org/doi/10.1103/PhysRevB.85.100504.
- Louca et al. (2013) D. Louca, K. Park, B. Li, J. Neuefeind, and J. Yan, Scientific Reports 3 (2013), ISSN 2045-2322, URL http://www.nature.com/articles/srep02047.
- Carr et al. (2014) S. V. Carr, D. Louca, J. Siewenie, Q. Huang, A. Wang, X. Chen, and P. Dai, Physical Review B 89 (2014), ISSN 1098-0121, 1550-235X, URL https://link.aps.org/doi/10.1103/PhysRevB.89.134509.
- Shoemaker et al. (2012) D. P. Shoemaker, D. Y. Chung, H. Claus, M. C. Francisco, S. Avci, A. Llobet, and M. G. Kanatzidis, Physical Review B 86 (2012), ISSN 1098-0121, 1550-235X, URL https://link.aps.org/doi/10.1103/PhysRevB.86.184511.
- Lazarević et al. (2012) N. Lazarević, M. Abeykoon, P. W. Stephens, H. Lei, E. S. Bozin, C. Petrovic, and Z. V. Popović, Physical Review B 86 (2012), ISSN 1098-0121, 1550-235X, URL https://link.aps.org/doi/10.1103/PhysRevB.86.054503.
- Ksenofontov et al. (2011) V. Ksenofontov, G. Wortmann, S. A. Medvedev, V. Tsurkan, J. Deisenhofer, A. Loidl, and C. Felser, Physical Review B 84 (2011), ISSN 1098-0121, 1550-235X, URL https://link.aps.org/doi/10.1103/PhysRevB.84.180508.
- Ding et al. (2013) X. Ding, D. Fang, Z. Wang, H. Yang, J. Liu, Q. Deng, G. Ma, C. Meng, Y. Hu, and H.-H. Wen, Nature Communications 4 (2013), ISSN 2041-1723, URL http://www.nature.com/articles/ncomms2913.
- Ricci et al. (2011) A. Ricci, N. Poccia, G. Campi, B. Joseph, G. Arrighetti, L. Barba, M. Reynolds, M. Burghammer, H. Takeya, Y. Mizuguchi, et al., Physical Review B 84 (2011), ISSN 1098-0121, 1550-235X, URL https://link.aps.org/doi/10.1103/PhysRevB.84.060511.
- Wang et al. (2012) Z.-W. Wang, Z. Wang, Y.-J. Song, C. Ma, Y. Cai, Z. Chen, H.-F. Tian, H.-X. Yang, G.-F. Chen, and J.-Q. Li, The Journal of Physical Chemistry C 116, 17847 (2012), ISSN 1932-7447, 1932-7455, URL http://pubs.acs.org/doi/10.1021/jp306310m.
- Charnukha et al. (2012b) A. Charnukha, A. Cvitkovic, T. Prokscha, D. Pröpper, N. Ocelic, A. Suter, Z. Salman, E. Morenzoni, J. Deisenhofer, V. Tsurkan, et al., Physical Review Letters 109, 017003 (2012b), URL https://link.aps.org/doi/10.1103/PhysRevLett.109.017003.
- Lei et al. (2011) H. Lei, M. Abeykoon, E. S. Bozin, K. Wang, J. B. Warren, and C. Petrovic, Physical Review Letters 107 (2011), ISSN 0031-9007, 1079-7114, URL https://link.aps.org/doi/10.1103/PhysRevLett.107.137002.
- Texier et al. (2012) Y. Texier, J. Deisenhofer, V. Tsurkan, A. Loidl, D. S. Inosov, G. Friemel, and J. Bobroff, Physical Review Letters 108, 237002 (2012), URL https://link.aps.org/doi/10.1103/PhysRevLett.108.237002.
- Friemel et al. (2012a) G. Friemel, J. T. Park, T. A. Maier, V. Tsurkan, Y. Li, J. Deisenhofer, H.-A. Krug von Nidda, A. Loidl, A. Ivanov, B. Keimer, et al., Physical Review B 85, 140511 (2012a), URL https://link.aps.org/doi/10.1103/PhysRevB.85.140511.
- Li et al. (2012) W. Li, H. Ding, P. Deng, K. Chang, C. Song, K. He, L. Wang, X. Ma, J.-P. Hu, X. Chen, et al., Nature Physics 8, 126 (2012), ISSN 1745-2473, 1745-2481, URL http://www.nature.com/articles/nphys2155.
- Friemel et al. (2012b) G. Friemel, W. P. Liu, E. A. Goremychkin, Y. Liu, J. T. Park, O. Sobolev, C. T. Lin, B. Keimer, and D. S. Inosov, EPL (Europhysics Letters) 99, 67004 (2012b), ISSN 0295-5075, URL https://doi.org/10.1209%2F0295-5075%2F99%2F67004.
- Mangelis et al. (2018) P. Mangelis, H. Lei, M. McDonnell, M. Feygenson, C. Petrovic, E. Bozin, and A. Lappas, Condensed Matter 3, 20 (2018), ISSN 2410-3896, URL http://www.mdpi.com/2410-3896/3/3/20.
- Wang et al. (2011b) Z. Wang, Y. J. Song, H. L. Shi, Z. W. Wang, Z. Chen, H. F. Tian, G. F. Chen, J. G. Guo, H. X. Yang, and J. Q. Li, Physical Review B 83 (2011b), ISSN 1098-0121, 1550-235X, URL https://link.aps.org/doi/10.1103/PhysRevB.83.140505.
- Yi et al. (2009) M. Yi, D. H. Lu, J. G. Analytis, J.-H. Chu, S.-K. Mo, R.-H. He, M. Hashimoto, R. G. Moore, I. I. Mazin, D. J. Singh, et al., Phys. Rev. B 80, 174510 (2009), URL https://link.aps.org/doi/10.1103/PhysRevB.80.174510.
- Homes et al. (2012) C. C. Homes, Z. J. Xu, J. S. Wen, and G. D. Gu, Physical Review B 85, 180510 (2012), URL https://link.aps.org/doi/10.1103/PhysRevB.85.180510.
- Liu et al. (2016) Y. Liu, Q. Xing, W. E. Straszheim, J. Marshman, P. Pedersen, R. McLaughlin, and T. A. Lograsso, Physical Review B 93 (2016), ISSN 2469-9950, 2469-9969, URL https://link.aps.org/doi/10.1103/PhysRevB.93.064509.
- Wang et al. (2015a) C.-H. Wang, T.-K. Chen, C.-C. Chang, C.-H. Hsu, Y.-C. Lee, M.-J. Wang, P. M. Wu, and M.-K. Wu, EPL (Europhysics Letters) 111, 27004 (2015a), ISSN 0295-5075, 1286-4854, URL http://stacks.iop.org/0295-5075/111/i=2/a=27004?key=crossref.2c1188a6ae92f29a1922c045e230150c.
- Wang et al. (2015b) Z. Wang, Y. Cai, Z. W. Wang, C. Ma, Z. Chen, H. X. Yang, H. F. Tian, and J. Q. Li, Phys. Rev. B 91, 064513 (2015b), URL https://link.aps.org/doi/10.1103/PhysRevB.91.064513.
- Song et al. (2011) Y. J. Song, Z. Wang, Z. W. Wang, H. L. Shi, Z. Chen, H. F. Tian, G. F. Chen, H. X. Yang, and J. Q. Li, EPL (Europhysics Letters) 95, 37007 (2011), ISSN 0295-5075, URL https://doi.org/10.1209%2F0295-5075%2F95%2F37007.
- Wang et al. (2018) C. Wang, T. Chen, C. Chang, Y. Lee, M. Wang, K. Huang, P. Wu, and M. Wu, Physica C: Superconductivity and its Applications 549, 61 (2018), ISSN 09214534, URL https://linkinghub.elsevier.com/retrieve/pii/S0921453417303283.
- Duan et al. (2018) C. Duan, J. Yang, Y. Ren, S. M. Thomas, and D. Louca, Physical Review B 97 (2018), ISSN 2469-9950, 2469-9969, URL https://link.aps.org/doi/10.1103/PhysRevB.97.184502.
- Lei and Petrovic (2011) H. Lei and C. Petrovic, Phys. Rev. B 84, 212502 (2011), URL https://link.aps.org/doi/10.1103/PhysRevB.84.212502.
- Wu et al. (2015) M. K. Wu, P. M. Wu, Y. C. Wen, M. J. Wang, P. H. Lin, W. C. Lee, T. K. Chen, and C. C. Chang, Journal of Physics D: Applied Physics 48, 323001 (2015), ISSN 0022-3727, 1361-6463, URL http://stacks.iop.org/0022-3727/48/i=32/a=323001?key=crossref.7263814e420ff6b6a87858a9e1322440.
- Iadecola et al. (2012) A. Iadecola, B. Joseph, L. Simonelli, A. Puri, Y. Mizuguchi, H. Takeya, Y. Takano, and N. L. Saini, Journal of Physics: Condensed Matter 24, 115701 (2012), ISSN 0953-8984, 1361-648X, URL http://stacks.iop.org/0953-8984/24/i=11/a=115701?key=crossref.66d2a7c66dd3ba7a1548a1ff1aa22312.
- Ryu et al. (2012) H. Ryu, H. Lei, A. I. Frenkel, and C. Petrovic, Physical Review B 85 (2012), ISSN 1098-0121, 1550-235X, URL https://link.aps.org/doi/10.1103/PhysRevB.85.224515.
- Neuefeind et al. (2012) J. Neuefeind, M. Feygenson, J. Carruth, R. Hoffmann, and K. K. Chipley, Nuclear Instruments and Methods in Physics Research Section B: Beam Interactions with Materials and Atoms 287, 68 (2012), ISSN 0168583X, URL https://linkinghub.elsevier.com/retrieve/pii/S0168583X12003291.
- Egami and Billinge (2012) T. Egami and S. J. L. Billinge, Underneath the Bragg peaks: structural analysis of complex materials (Elsevier, Amsterdam, 2012), 2nd ed., URL http://store.elsevier.com/product.jsp?lid=0&iid=73&sid=0&isbn=9780080971414.
- Peterson et al. (2000) P. F. Peterson, M. Gutmann, T. Proffen, and S. J. L. Billinge, J. Appl. Crystallogr. 33, 1192 (2000), URL http://dx.doi.org/10.1107/S0021889800007123.
- Farrow et al. (2007) C. L. Farrow, P. Juhás, J. Liu, D. Bryndin, E. S. Božin, J. Bloch, T. Proffen, and S. J. L. Billinge, J. Phys: Condens. Mat. 19, 335219 (2007), URL http://iopscience.iop.org/0953-8984/19/33/335219/.
- Proffen and Neder (1999) T. Proffen and R. B. Neder, Journal of Applied Crystallography 32, 838 (1999), ISSN 00218898, URL http://scripts.iucr.org/cgi-bin/paper?hw0052http://scripts.iucr.org/cgi-bin/paper?S002188989600934X.
- Welberry (1985) T. R. Welberry, Reports on Progress in Physics 48, 1543 (1985), ISSN 00344885, URL http://iopscience.iop.org/0034-4885/48/11/002.
- Keen and Goodwin (2015) D. A. Keen and A. L. Goodwin, Nature 521, 303 (2015), ISSN 0028-0836, URL http://www.nature.com/doifinder/10.1038/nature14453.
- Cowley (1965) J. M. Cowley, Physical Review 138, A1384 (1965), ISSN 0031-899X, URL https://link.aps.org/doi/10.1103/PhysRev.138.A1384.
- Moss and Clapp (1968) S. C. Moss and P. C. Clapp, Physical Review 171, 764 (1968), ISSN 0031899X, URL https://link.aps.org/doi/10.1103/PhysRev.171.764.
- Moss (2005) S. C. Moss, Journal of Applied Physics 35, 3547 (2005), ISSN 0021-8979, URL http://aip.scitation.org/doi/10.1063/1.1713268.
- Owen et al. (2017) L. R. Owen, H. Y. Playford, H. J. Stone, and M. G. Tucker, Acta Materialia 125, 15 (2017), ISSN 13596454, URL http://dx.doi.org/10.1016/j.actamat.2016.11.048http://linkinghub.elsevier.com/retrieve/pii/S1359645416309156.
- Plançon (2004) A. Plançon, Clays and Clay Minerals 52, 47 (2004), ISSN 00098604, URL http://ccm.geoscienceworld.org/content/52/1/47.fullhttp://www.ingentaselect.com/rpsv/cgi-bin/cgi?ini=xref{&}body=linker{&}reqdoi=10.1346/CCMN.2004.0520106.
- Guinier (1994) A. Guinier, X-ray Diffraction in Crystals, Imperfect Crystals, and Amorphous Bodies, Dover Books on Physics Series (Dover, 1994), ISBN 9780486680118, URL https://books.google.it/books?id=vjyZFo5nGUoC.
- Drits and Tchoubar (1990) V. A. Drits and C. Tchoubar, X-Ray Diffraction by Disordered Lamellar Structures. Theory and applications to microdivided silicates and carbons (Springer-Verlag, Berlin, Heidelberg, New York, 1990), ISBN 0-387-51222-5.
- Ufer et al. (2004) K. Ufer, G. Roth, R. Kleeberg, H. Stanjek, R. Dohrmann, and J. Bergmann, Zeitschrift fur Kristallographie 219, 519 (2004), ISSN 00442968.
- Jeong et al. (1999) I. Jeong, T. Proffen, F. Mohiuddin-Jacobs, and S. J. L. Billinge, J. Phys. Chem. A 103, 921 (1999), URL http://pubs.acs.org/doi/abs/10.1021/jp9836978.
- Jeong et al. (2003) I. K. Jeong, R. H. Heffner, M. J. Graf, and S. J. L. Billinge, Phys. Rev. B 67, 104301 (2003), URL http://journals.aps.org/prb/abstract/10.1103/PhysRevB.67.104301.
- Vegard (1921) L. Vegard, Z. Phys. 5, 17 (1921).
- Mizuguchi et al. (2010) Y. Mizuguchi, Y. Hara, K. Deguchi, S. Tsuda, T. Yamaguchi, K. Takeda, H. Kotegawa, H. Tou, and Y. Takano, Superconductor Science and Technology 23, 054013 (2010), ISSN 0953-2048, 1361-6668, URL http://stacks.iop.org/0953-2048/23/i=5/a=054013?key=crossref.f8a1dceb6f13639ca6c8f6d965b4c81f.
- Proffen (2000) T. Proffen, Zeitschrift für Kristallographie - Crystalline Materials 215 (2000), ISSN 2196-7105, 2194-4946, URL http://www.degruyter.com/view/j/zkri.2000.215.issue-11/zkri.2000.215.11.661/zkri.2000.215.11.661.xml.
- Wojdyr (2010) M. Wojdyr, Journal of Applied Crystallography 43, 1126 (2010), ISSN 00218898, URL http://scripts.iucr.org/cgi-bin/paper?S0021889810030499.