Gemini IFU, VLA, and HST observation of the OH Megamaser Galaxy IRAS17526+3253111Based partly on observations made with the NASA/ESA Hubble Space Telescope, obtained at the Space Telescope Science Institute, which is operated by the Association of Universities for Research in Astronomy, Inc., under NASA contract NAS 5-26555.
Abstract
We present a multiwavelength study of the OH megamaser galaxy (OHMG) IRAS17526+3253, based on new Gemini Multi-Object Spectrograph Integral Field Unit (GMOS/IFU) observations, Hubble Space Telescope F814W and H+[Nii] images, and archival 2MASS and 1.49GHz VLA data. The HST images clearly reveal a mid-to-advanced stage major merger whose northwestern and southeastern nuclei have a projected separation of 8.5kpc. Our HST/H+[Nii] image shows regions of ongoing star-formation across the envelope on 10kpc scales, which are aligned with radio features, supporting the interpretation that the radio emission originates from star-forming regions. The measured H luminosities imply that the unobscured star-formation rate is 10-30 M⊙yr-1. The GMOS/IFU data reveal two structures in northwestern separated by 850 pc and by a discontinuity in the velocity field of 200 km s-1. We associate the blue-shifted and red-shifted components with, respectively, the distorted disk of northwestern and tidal debris, possibly a tail originating in southeastern. Star-formation is the main ionization source in both components, which have SFRs of 2.6-7.9 M⊙yr-1 and 1.5-4.5 M⊙yr-1, respectively. Fainter line emission bordering these main components is consistent with shock ionization at a velocity 200 km s-1 and may be the result of an interaction between the tidal tail and the northwestern galaxy’s disk. IRAS17526+3253 is one of only a few systems known to host both luminous OH and H2O masers. The velocities of the OH and H2O maser lines suggest that they are associated with the northwestern and southeastern galaxies, respectively.
keywords:
galaxies: active – galaxies: nuclei – galaxies: individual: IRAS17526+3253 – galaxies: kinematics and dynamics – techniques: spectroscopic1 Introduction
Galaxy mergers are generally believed to play an important role in galaxy evolution, with the assembly of massive haloes via multiple mergers being the central mechanism for structure formation in CDM cosmologies (e.g., Blumenthal et al., 1984; Springel et al., 2005; Boylan-Kolchin et al., 2009; Angulo et al., 2012). Observational evidence and cosmology simulations suggest that the most massive galaxies are formed in major mergers, whilst the growth of intermediate mass galaxies is largely driven by minor mergers or cold gas accretion (e.g., reviews by Silk & Mamon, 2012; Kormendy & Ho, 2013; Conselice, 2014). In this context, the population of optically faint but infrared luminous galaxies discovered by the Infrared Astronomical Satellite (IRAS) in the 1980’s (Soifer et al., 1984) is of great interest, since it includes many examples of gas-rich major mergers, or strong interactions (e.g., Sanders et al., 1988; Veilleux et al., 2002; Haan et al., 2011). The immense infrared luminosities of these objects arise from dust heated by embedded starbursts and/or active galactic nuclei (AGN), both of which are thought to be triggered by gas inflows driven by tidal torques generated by the interaction (e.g., Barnes & Hernquist, 1992; Mihos & Hernquist, 1996; Hopkins et al., 2006). Two main subdivisions of this population are recognized: Luminous infrared galaxies (LIRGs) have far infrared luminosities of , whereas the most luminous systems, ultra-luminous infrared galaxies (ULIRGs), have quasar-like luminosities of (see Sanders & Mirabel, 1996, for a review). It has been proposed that (U)LIRGs represent different phases in the evolution of gas rich mergers, with LIRGs evolving into ULIRGs as the merger progresses, eventually followed by the emergence of a luminous AGN in a massive elliptical host, as the remaining circum-nuclear gas and dust is dispersed by starburst and AGN-induced outflows (Sanders et al., 1988; Veilleux et al., 2002).
Many studies of local (U)LIRGs broadly support this idea. For example, merger morphology correlates with FIR luminosity, with advanced mergers becoming more prevalent at higher luminosities (e.g., Sanders et al., 1988; Veilleux et al., 2002; Hwang et al., 2010; Haan et al., 2011; Carpineti et al., 2015), and the fraction hosting powerful active galactic nuclei (AGN) increases with both FIR luminosity, and merger stage (e.g., Veilleux et al., 2002, 2009; Nardini et al., 2010). At higher redshifts () (U)LIRGs are much more common than in the local universe (e.g., Caputi et al., 2007), and similar morphological trends are seen, although with a wider range of merger states at high luminosity (Kartaltepe et al., 2012). Beyond , the morphological properties of the most luminous submillimeter galaxies (SMGs) are also consistent with mergers and interacting systems (e.g., Tacconi et al., 2008; Engel et al., 2010; Hayward et al., 2013). Massive outflows in neutral, ionized and molecular gas have been detected in an most ULIRGs, both in the local universe (e.g., Heckman et al., 2000; Rupke et al., 2002; Martin, 2005; Feruglio et al., 2010; Sturm et al., 2011; Rupke & Veilleux, 2013; Spoon et al., 2013; Veilleux et al., 2013; Cicone et al., 2014) and at higher redshifts in both ULIRGs (e.g., George et al., 2014) and SMGs (e.g., Banerji et al., 2011). (U)LIRGs are therefore crucial to understanding the role of mergers in galaxy evolution and black hole growth.
Integral field spectroscopy is a powerful tool with which to study these complex systems, providing spatially resolved information on gas and stellar kinematics and a range of spectral diagnostics. Using such information (for example) gas flows can be mapped and contributions of various ionization mechanisms (AGN or stellar photoionization, or shocks) can be inferred (e.g., Monreal-Ibero et al., 2006, 2010; Rich et al., 2012, 2015).
Here, we present a high-spatial resolution analysis of the morphology, gaseous excitation and kinematics of the brightest radio nucleus of the merger system IRAS17526+3253. This system, which has a redshift (de Vaucouleurs et al., 1991), was first identified as a possible interacting galaxy by Andreasian & Alloin (1994). In the Digitized Sky Survey image, it appears as a warped, elongated structure oriented approximately southeastern – northwestern, and has two bright knots separated by .
It has a far-infrared (FIR) luminosity, as calculated from the 60 and 100m IRAS fluxes, of L⊙ (taken from The Imperial IRAS-FSC Redshift Catalogue; Wang & Rowan-Robinson (IIFSCz 2009)), which places it just above the lower limit for LIRGs. An optical spectrum obtained using a 2″ wide slit by Baan et al. (1998) shows line ratios characteristic of a starburst spectrum.
Baan & Klöckner (2006) observed IRAS17526+3253 with the VLA A-array in the L and C bands (1.49 and 4.9 GHz), finding that the radio source consists of a linear chain of knots, with 3 main components, spanning ″ ( kpc) and extending along PA 119∘, closely aligned with the optical PA. These authors used three indicators to distinguish between AGN and starburst activity as the origin of the radio emission: the brightness temperature at 4.85 GHz, the FIR-radio flux ratio at 4.85 GHz, and the 1.4–4.8 GHz spectral index, . Based on these, all three main components were classified as starburst-powered, although in the case of the northwestern component the peak spectral index has a value (Baan & Klöckner, 2006), which may indicate a typical of AGN or the flat spectrum is due to te free-free emission (Gioia et al., 1982; Condon et al., 1983; Condon & Broderick, 1991).
Garwood et al. (1987) were the first to look for the 1665 MHz and 1667 MHz OH maser lines in IRAS17526+3253, but reported a non-detection. A detection was subsequently reported by Martin et al. (1989a), with an integrated luminosity log()=0.99 and recession velocity km s-1 (see also Martin, 1989b), although McBride & Heiles (2013) were unable to confirm the detection in more recent Arecibo Telescope observations due to strong radio frequency interference. Martin (1989b) also observed the H I 21 cm emission line in IRAS17526+3253, at a velocity km s-1, close to the heliocentric systemic velocity ( km s-1; de Vaucouleurs et al., 1991) but redshifted by km s-1 with respect to the OH maser. Molecular line observations by (Baan et al., 2008) detected CO emission in the 12CO(1-0) and 12CO(2-1) transitions, revealing (in the latter) two velocity components, a broad peak at km s-1 and a narrower peak at km s-1. IRAS17526+3253 is also known to host a 22 GHz H2O kilo-maser source (Wagner, 2013), which exhibits a cluster of three narrow (km s-1) features at km s-1, close to the systemic velocity. The H2O maser lines have an integrated luminosity L⊙ and possibly arise from a region of shocked gas.
Our study is based on new HST/ACS images and integral field spectroscopy obtained with the GMOS/IFU at the Gemini North Telescope. The paper is organized as follows. In Section 2 we describe the data reduction procedures and the measurements derived from the HST imaging and GMOS/IFU data. Section 3 describes our results on the overall morphology of the IRAS17526+3253 system, and the gas excitation and kinematics within a field of view covering the northwestern of the two optical nuclei. We discuss the implications of our results in Section 4. The main results and conclusions are summarized in Section 5. Throughout this paper, we adopt the Hubble constant as H0 = 70.5 km s-1 Mpc-1, =0.73, and =0.27 (Planck Collaboration at al., 2013; Lahav & Liddle, 2014), corresponding to a scale at the galaxy of 497 pc arcsec-1.
2 Observation and Data Reduction
2.1 Hubble Space Telescope Images
We acquired HST images of IRAS17526+3253 with the Advanced Camera for Surveys (ACS), as part of a snapshot program of a large sample of OHMGs (Program ID 11604; PI: D.J. Axon). The ACS wide-field channel (WFC) with broad (F814W), narrow (FR656N) and medium (FR914M) band filters was used.
The F814W filter was required to map the continuum morphology of the host galaxy. The ramp filter images were selected to cover the H line in the narrow-band filter and the nearby continuum in the medium-band filter. The FR656N ramp filter includes the H and the [Nii] lines at the redshift of IRAS17526+3253. The total integration times were 600s in the broad-band (I) F814W filter, 200s in the medium-band FR914M filter and 600s in the narrow band H FR656N filter.
We used the pipeline image products for further processing with the IRAF222IRAF is distributed by the National Optical Astronomy Observatory, which is operated by the Association of Universities for Research in Astronomy (AURA), Inc., under cooperative agreement with the National Science Foundation. package. We removed cosmic rays from individual images using the IRAF task (van Dokkum, 2001). Standard IRAF tasks were used to yield the final reduced images (see figure 1).
The continuum-free H[Nii] image of IRAS17526+3253 was derived using the following procedure (see Hoopes et al., 1999; Rossa & Dettmar, 2000, 2003; Sales et al., 2015). First, we calculated the mean ratio of count rates, FR656NFR914M, for several foreground stars that appear in both images. We then scaled the FR914M image by the mean count rate ratio and subtracted it from the FR656N image. The resulting, continuum-subtracted H[Nii] image was checked to verify that the residuals at the positions of the foreground stars were negligible compared to the expected noise level. This method gives typical uncertainties of 5-10% (see Hoopes et al., 1999; Rossa & Dettmar, 2000, 2003).
2.2 VLA Radio Data
IRAS17526+3253 was observed at 1.49 GHz using the VLA A-array configuration on March 7, 1990 (Project code: AM293). These data have previously been presented by Baan & Klöckner (2006). We re-reduced these data following standard procedures in the Astronomical Imaging Processing System (AIPS). The final 1.49 GHz VLA image with a beam-size of 1.35 arcsec x 1.11 arcsec at a PA = -39 degrees (figure 2) was obtained after several iterations of phase and amplitude self-calibration, using the AIPS tasks CALIB and IMAGR.
The final resultant rms noise in the image was 67 Jy beam-1. The radio image showing two unresolved cores, has been used to derive the astrometry of the HST, Gemini/IFU, and 2MASS Ks images
2.3 Gemini Multi-Object Spectrograph Integral Field Unit Data
Two-dimensional spectroscopic observations of IRAS17526+3253 were obtained using the Gemini Multi-Object Spectrograph with the Integral Field Unit (GMOS/IFU, Allington-Smith et al., 2002). The observations were made at the Gemini North telescope on 2013 May, 15-16 UT, as part of program GS-2013A-Q-92. We used the IFU 1-slit mode with the B600GG455 grating, which encompassed the spectral range ÅÅ and spectral resolution of 3.9Å, covering a field of view (FOV) of roughly 51 x 34. The IFU/FOV was centered on the complex of bright H[Nii] emission associated with the northwestern galaxy of the interacting pair (figure 1) and oriented along PA = 221∘. The total on-source integration time was 2 hours, taken as six individual exposures of 1200s.
Data reduction was performed using the sub-packages of gemini.gmos iraf package and followed standard procedures including trimming of the images, bias subtraction, flat-fielding, wavelength calibration, sky subtraction, and relative flux calibration. We collapsed the individual data cubes in the spectral range of 5500-6500ÅÅ to create a GMOS/IFU continuum image similar to the HST F814W image.
Thereafter, we determined the centroid of each dithered image, and then spatially shifted and median combined the data cubes using the IRAF imcombine task with a sigclip algorithm to eliminate the remaining cosmic rays and bad pixels. In order to suppress high-frequency noise in our data, we also applied the Butterworth filter333http://www.exelisvis.com/docs/BANDPASSFILTER.html of 0.2Ny set as upper limits of the pass-through frequency band to the data cube.
The final cube contains 7000 spectra, each of which corresponds to a “fiber” of dimensions 0101. The angular resolution of was derived from the FWHM of the spatial profile of the standard star. This resolution corresponds to a spatial scale of pc at the redshift of IRAS17526+3253.
 |
 |
 |
 |
 |
|
 |
 |
 |
|
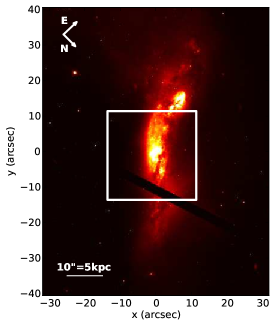
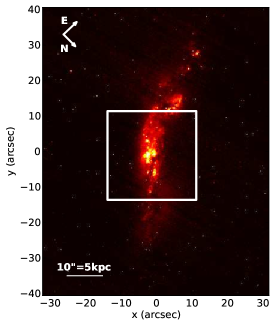
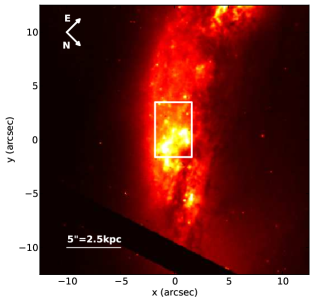
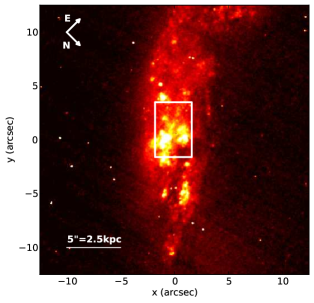
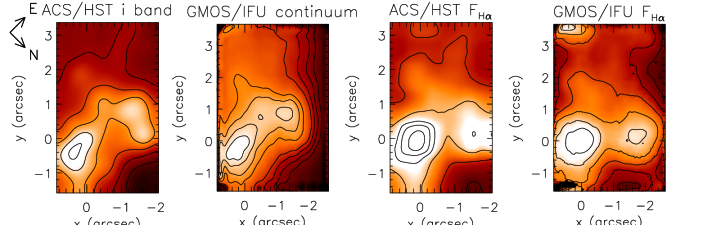
In figure 1 the HST/ACS broad-band and continuum-subtracted H[Nii] images are compared with corresponding continuum and H images derived from the GMOS/IFU observations. The top left and right panels show, respectively, HST i-band and emission line images of the IRAS17526+3253 system. The middle panels show a region of centered at the northwestern nucleus, with the GMOS/IFU FOV being represented by a white box. The bottom panels show the HST and corresponding GMOS/IFU images within the IFU FOV. The GMOS/IFU continuum image was constructed by collapsing the data cube along the spectral axis between 5500 and 6500Å. The H image was obtained by fitting the emission line profiles in each spaxel (see Section 3.2). The HST images were convolved by a Gaussian function with sigma equal to 5 pixels (0.25”) and spatial registration was carried out by cross-matching these images with the corresponding IFU images in order to make the spatial resolution closer to that of the GMOS/IFU data. Throughout this paper, we define the origin of the spatial scale to be that of the spaxel in the GMOS/IFU H FOV corresponding to the peak surface brightness of the brightest knot (bottom left in rightmost bottom panel of figure 1), whose coordinates are RA: 17h54m29.4s and DEC: +32d53m12.8s
3 Results
3.1 Optical to Near-IR Morphologies
The HST/ACS images in the top row of figure 1 clearly reveal a merger system in mid-stage with two main galaxy nuclei separated by a projected distance of 8.8 kpc. The northwestern galaxy appears to present a nearly edge-on aspect, and is crossed by a prominent dust lane, suggesting that the northern side is the near side. The disrupted disk of the second galaxy (Eastern nucleus) of the interacting pair appears to the merging with that of its companion and features a complex system of dust lanes.
The two nuclei are embedded in an elongated irregular envelope, which is interspersed with extensive dust lanes and extends over at least 60” (30 kpc), with its major axis oriented approximately northwestern–southeastern. The elongation suggests that we are observing the interaction quite close to the orbital plane. The H[Nii] emission image, which is a tracer of young stars via Hii regions, shows numerous compact regions of ongoing star formation across the envelope over scales of a few 10’s of kpc. Baan & Klöckner (2006) have shown that the radio emission of these smaller knots in IRAS17526+3253 is probably associated with SNRs in massive star-forming regions.
The middle panels of figure 1 show a region of centered on the northwestern nucleus with the GMOS/IFU FOV being represented by a white box. The HST/ACS -band continuum image shows a very disturbed morphology with two bright “blobs” within the IFU field. These features are also prominent in the H[Nii] image, indicating that they are star-forming regions. The IFU field was placed to sample these bright star-forming regions and it is located just south of the extensive wide dust lane crossing the nucleus; the dust lane can be seen in both the -band and H[Nii] images and crosses the northwestern corner of the IFU field. In the bottom row of figure 1, the seeing-convolved HST -band and H[Nii] images are compared with corresponding images reconstructed from our GMOS/IFU data. The morphological features appearing in the IFU images match those seen in the HST well and in particular, the two bright blobs are clearly resolved in the IFU data.
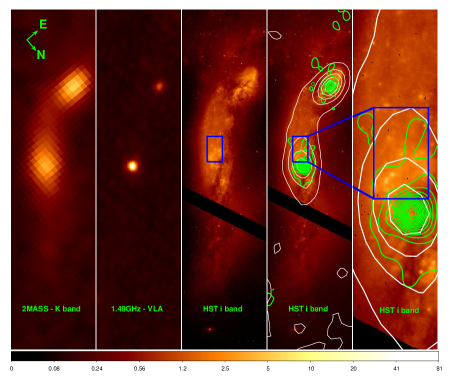
The optical (HST/ACS F814W), near-IR (2MASS K-band) and radio (VLA 1.49 GHz) morphologies of the whole IRAS17526+3253 system are compared in figure 2. The K-band image is less affected by dust extinction and highlights the old stellar population, which can be used as an indication of stellar mass distribution of the compact central cores. The overall morphology in the NIR is similar to that seen at much higher resolution in the -band, although the two nuclei are much more prominent relative to the surrounding envelope. From Ks band photometry we find that the two nuclei have very similar fluxes, 12.1 mag, which translates to a bulge mass of M⊙, using the scale factor inferred by Bell et al. (2003). We also modelled the surface brightness distribution of the 2MASS K band image using GALFIT (Peng et al., 2002). It turns out that both nuclei have similar Sérsic indices, indicative of radial brightness profiles consistent with classical bulges (n 2.2). The main features in the VLA 1.49 GHz image are two bright, compact cores (beam size of 135 111) that are clearly associated with the two galaxy nuclei, as shown by the contours over plotted on the HST -band image in the leftmost two panels.
3.2 GMOS/IFU data analysis: emission line fitting and kinematics
This section describes the techniques employed to derive quantitative information from the GMOS/IFU data cube. To accomplish this, we used customized profit routines written in the IDL444Interactive Data Language, http://ittvis.com/idl programming language. More information about the profit code can be found in Riffel (2010).
3.2.1 Single component Gauss-Hermite fits
The set of spectra in the GMOS/IFU datacube present narrow emission lines, with an average FWHM of ÅThe emission line profiles clearly change over the FOV which various regions exhibiting profiles with different characteriistics: (i) narrow emission lines displaying a single peak; (ii) emission lines characterized by a single peak with asymmetric extended wings due to blueshifted or redshifted components; and (iii) line profiles showing a clear double peak.
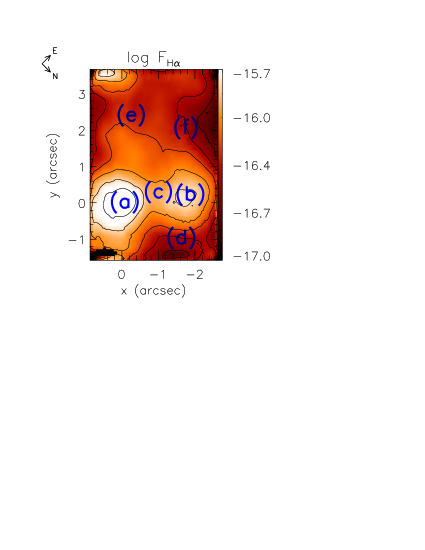
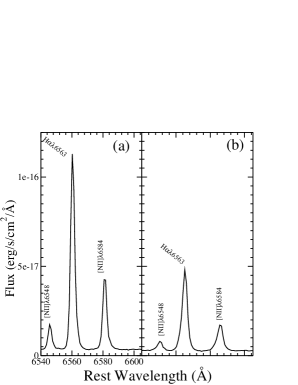
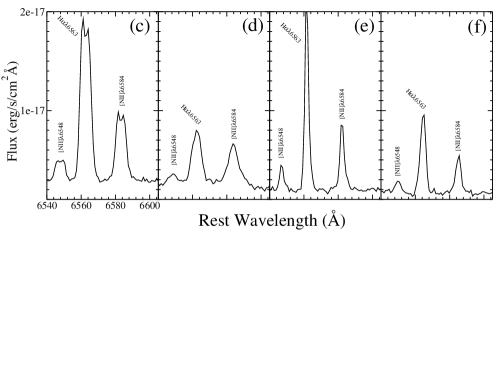
We present in figure 3 spectra extracted from spaxels () at 6 locations within the GMOS/IFU FOV, including the peak flux positions of the two bright blobs, labeled as (a) and (b) in the figure (top right panels). The other four extractions (labelled as (c), (d), (e) and (f)) were selected to illustrate the different emission line profiles and excitation conditions that are present within the FOV. In the spectra from regions (e) and (f) as well as those from the blobs (a) and (b), H is much stronger than [Nii] and the profiles are relatively narrow. In region (c), which is located between the two blobs, the lines are broader but double-peaked, suggesting partial blending of two components associated with blobs (a) and (b), which present a discontinuity in velocity, as discussed below. Region (d) on the other hand, exhibits much broader profiles and H is only slightly stronger than [Nii].
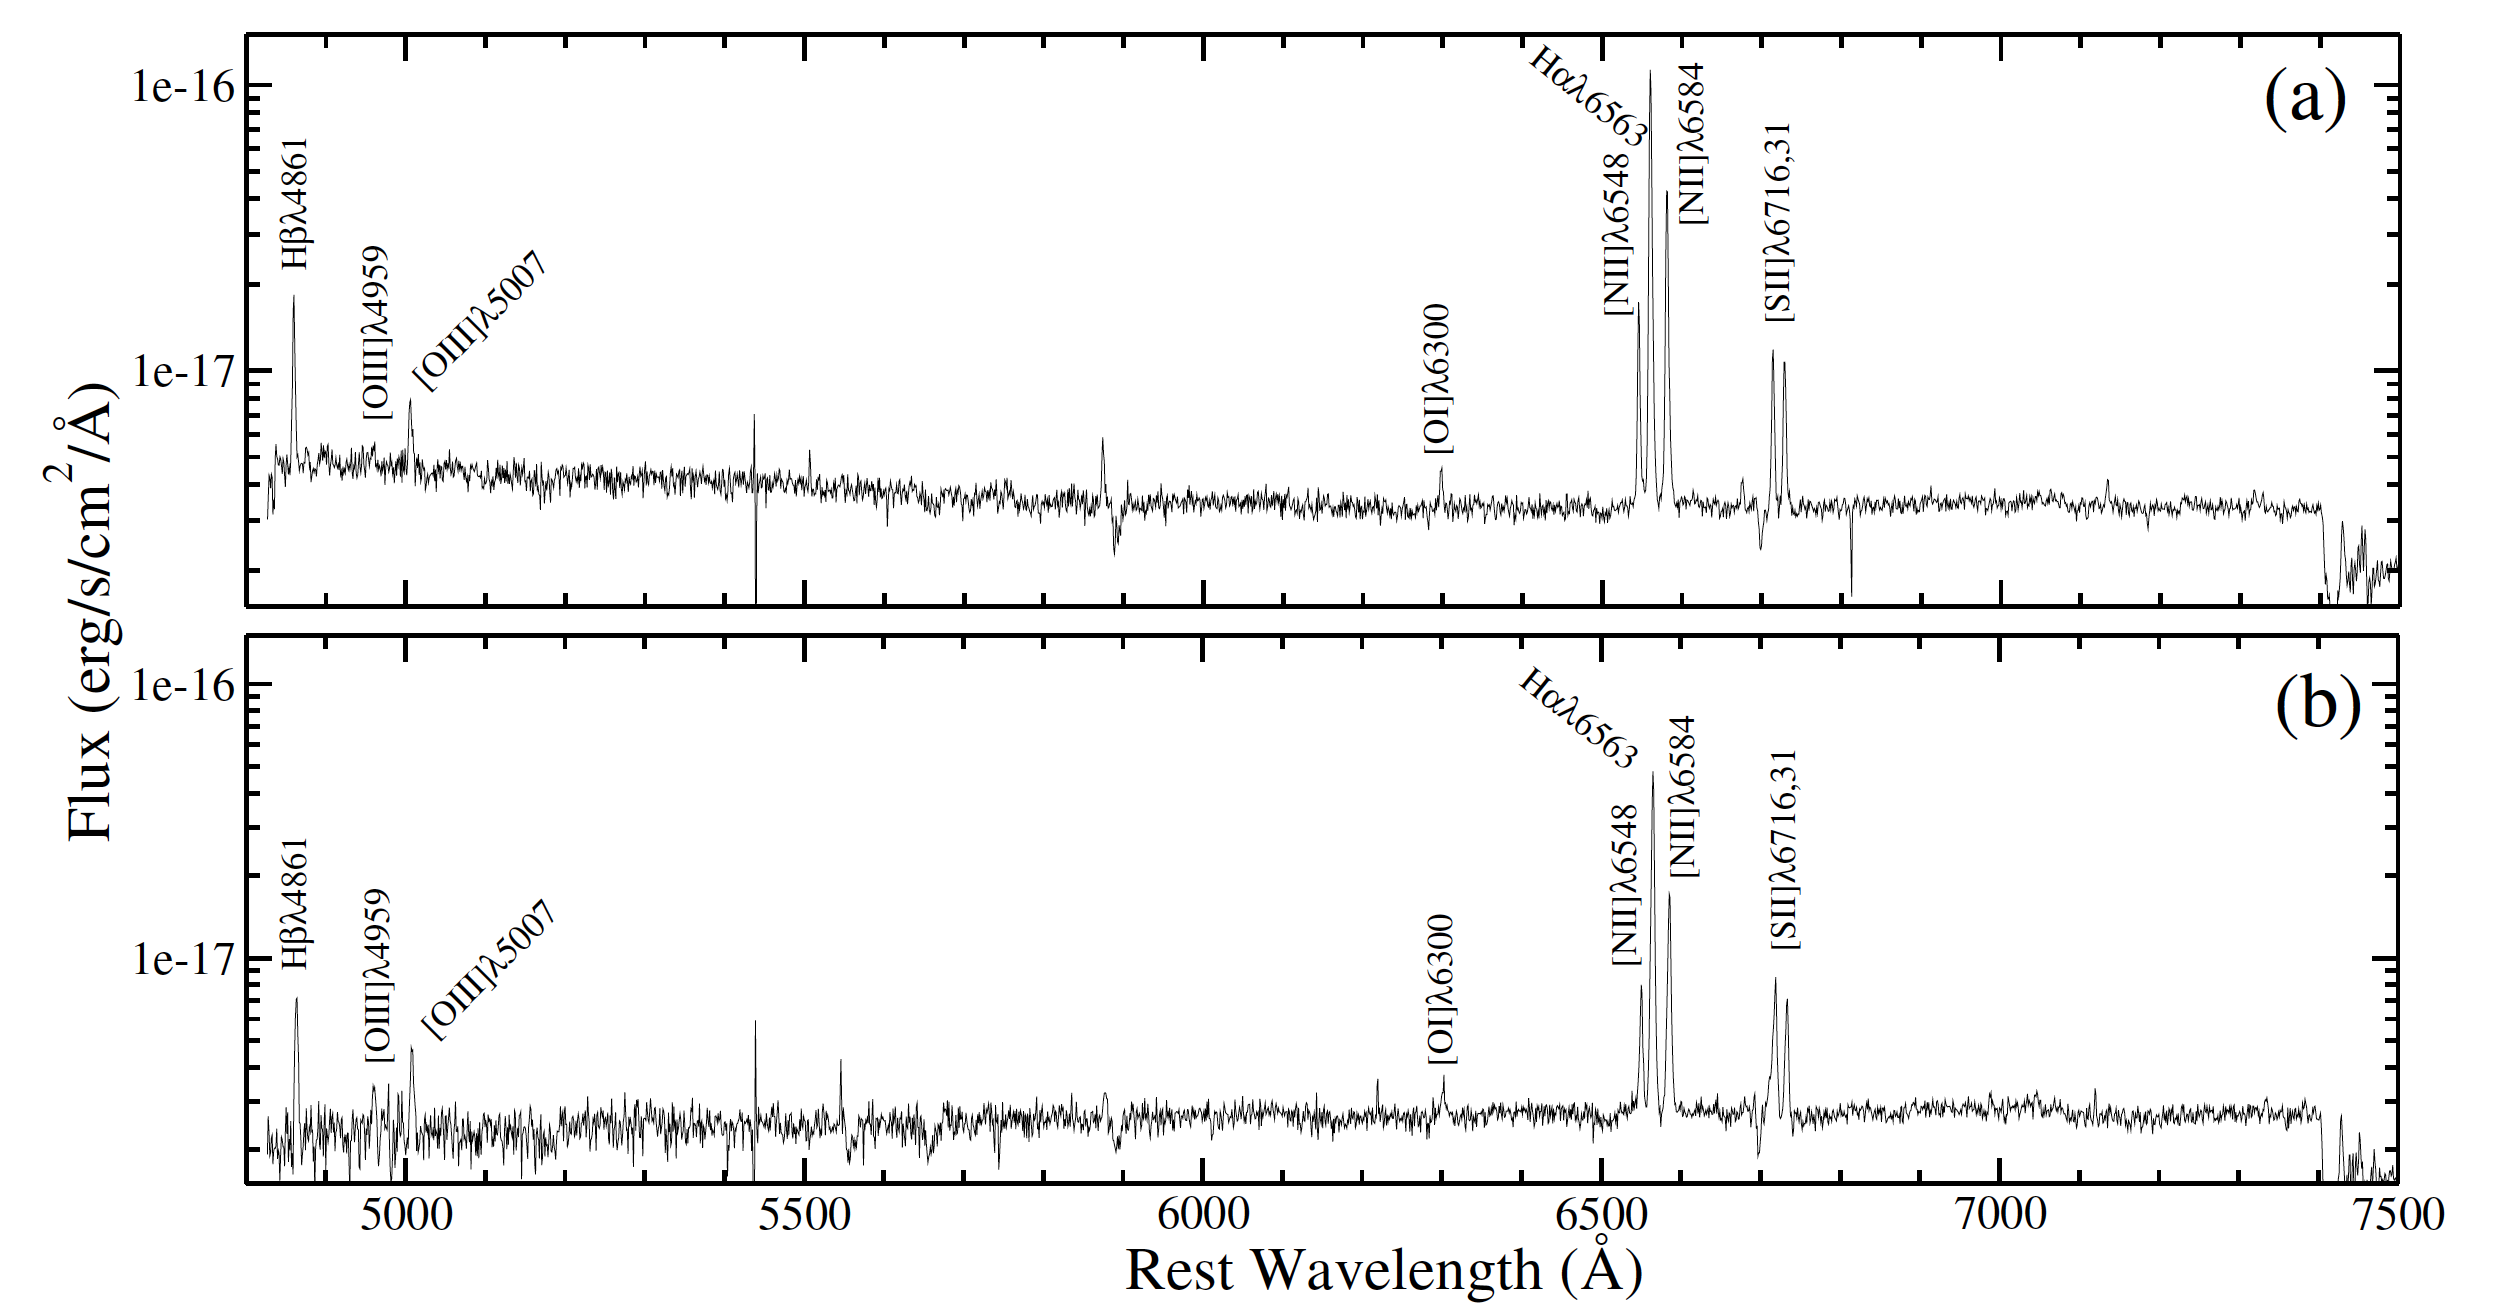
Figure 4 shows the entire spectra, covering the whole observed wavelength range, of the blobs (a) and (b). In addition to H and the [Nii] lines, H, [Oiii], [Oi] and [Sii] are also present in the spectra. The relative strengths of the lines are consistent with stellar-photoionized Hii regions.
As the emission line profiles are clearly non-Gaussian in certain regions, we used a Gauss-Hermite function to perform single component fits to each emission lines. The Gauss-Hermite series can be written as
| (1) |
where and .
represents the amplitude of the Gauss-Hermite series, is the central wavelength, and are moments of Gauss-Hermite series, which measure respectively, asymmetric and symmetric deviations from a pure Gaussian. and are Hermite polynomials. In order to fit the H+[N ii] lines we assumed that H and [N ii] have the same central velocity, while the amplitude of [N ii]6548 component was constrained to be 1/2.96 of that of [N ii]6583. Similar constrains were applied to fit the [O iii] lines. The [S ii] lines were constrained to have the same central velocity.
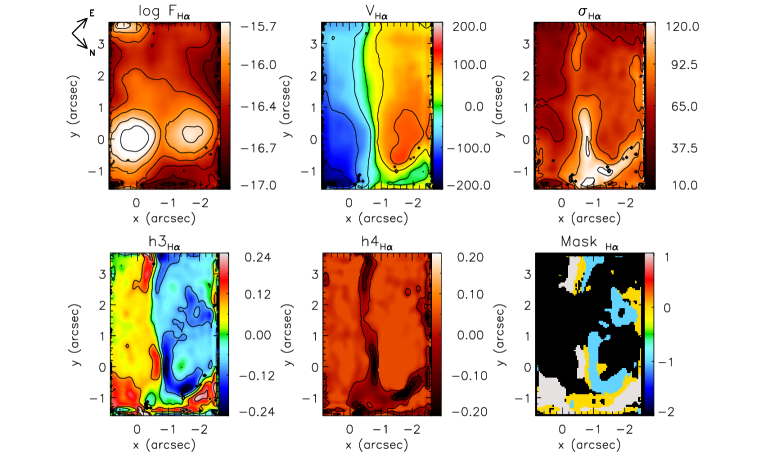
The results of the emission line fitting are shown in figure 5. The values of and vary from to 0.2. Visual inspection of the fits suggests that emission lines with blue wings show values of , while red wings appear in regions with . Values of select regions where the line profiles are broader (not as sharply peaked) than an equivalent Gaussian of the same amplitude, including profiles that have noticeable double peaks. The values of and recovered from the fits therefore allow extended asymmetric wings and double peaked profiles to be automatically identified. We used these values to generate a mask which flags spaxels that required more than one Gaussian to fit the observed emission lines. The mask image is also shown in figure 5.
The H flux map obtained by Gauss-Hermite fitting highlights the presence of the two bright blobs that are the most prominent features in the IFU FOV, as already seen in the HST -band and H[Nii] emission line images (see figure 1). A smaller and somewhat fainter third blob is located near the southern corner of the FOV, which appears to be associated with a bright knot seen in the HST H[Nii] image just beyond the southeastern border of the IFU field (see figure 1). The flux distributions of the other emission lines (with the exception of [O i]6300) show features similar to those observed in the H map, but with lower S/N, and thus we do not present them in this section.
It is immediately clear from visual inspection of the data cube that the emission lines of the brightest blob (northwestern, hereafter NWa) are blueshifted with respect to the line emission at the center of GMOS/IFU FOV, while the northeastern blob (hereafter NWb) appears to have redshifted emission lines. We therefore determined the systemic velocity for the IFU field by averaging the velocities of two bright blobs ( = 7580 km s-1) within apertures of centered on the flux peaks. Maps of the centroid velocity, corrected for this systemic velocity, and the velocity dispersion, corrected for the instrumental resolution, are shown in figure 5.
The velocity map shows blueshifts dominating the SW side of the FOV, while redshifts dominate the NE side. These regions are very clearly segregated, with a sharp transition between the blue and redshifted sides. This velocity field does not show the “spider” diagram typical of disk rotation. Moreover, given the morphology and apparent orientation of the northwestern galaxy, we would expect the position angle of the line of nodes to be approximately northwestern-southeastern, nearly orthogonal to the direction one would infer from the velocity map. It is also notable that the two regions, or the boundary between them, are clearly distinguishable in the , and maps. Thus, shows that the emission lines in the SW (blueshifted) region are characterized by red asymmetries, whereas in the NE (redshifted) region the lines are typically blue asymmetric. The and maps both show narrow features that coincide with the sharp boundary between the blue and redshifted regions, indicating that the lines are broader and more flat-topped along the boundary. Indeed, this is where we observe double-peaked profiles as exemplified by the region (d) spectrum shown in figure 3. Taken together, the kinematic parameter maps suggest that we are observing two distinct, partially superimposed kinematic components which have a relative velocity km s-1.
There is also evidence for a third kinematic component, which is traced by the region of increased velocity dispersion close to the northwestern edge of the FOV, with a spur running NE. Similar structures are seen in the and maps, indicating red asymmetric, broader lines.
3.2.2 Two component Gaussian fits.
As described above, the results of the single-component Gauss-Hermite fits have been used to identify spaxels where the emission lines cannot be well-fitted with a single Gaussian profile (see figure 5). These include spaxels where the lines have a single peak but extended or asymmetric wings, as well as those where the lines exhibit double peaks. As these profile shapes may result from blending of kinematic components arising from distinct kinematic components, we have used two Gaussian components to fit the line profiles in those spaxels that have and . The first criteria track spaxels that have emission line with extended wings, once that second one identifies spaxels with doble peaks of the emission profile. These regions are indicated with values between and 1 in the mask image shown in figure 5. A single Gaussian component was used to fit the line profiles over the remainder of the FoV The same constraints as used in the Gauss-Hermite fits (Section 3.2.1) were applied to each gaussian component in the fits to the H+[N ii], [O iii] and [S ii] line groups.
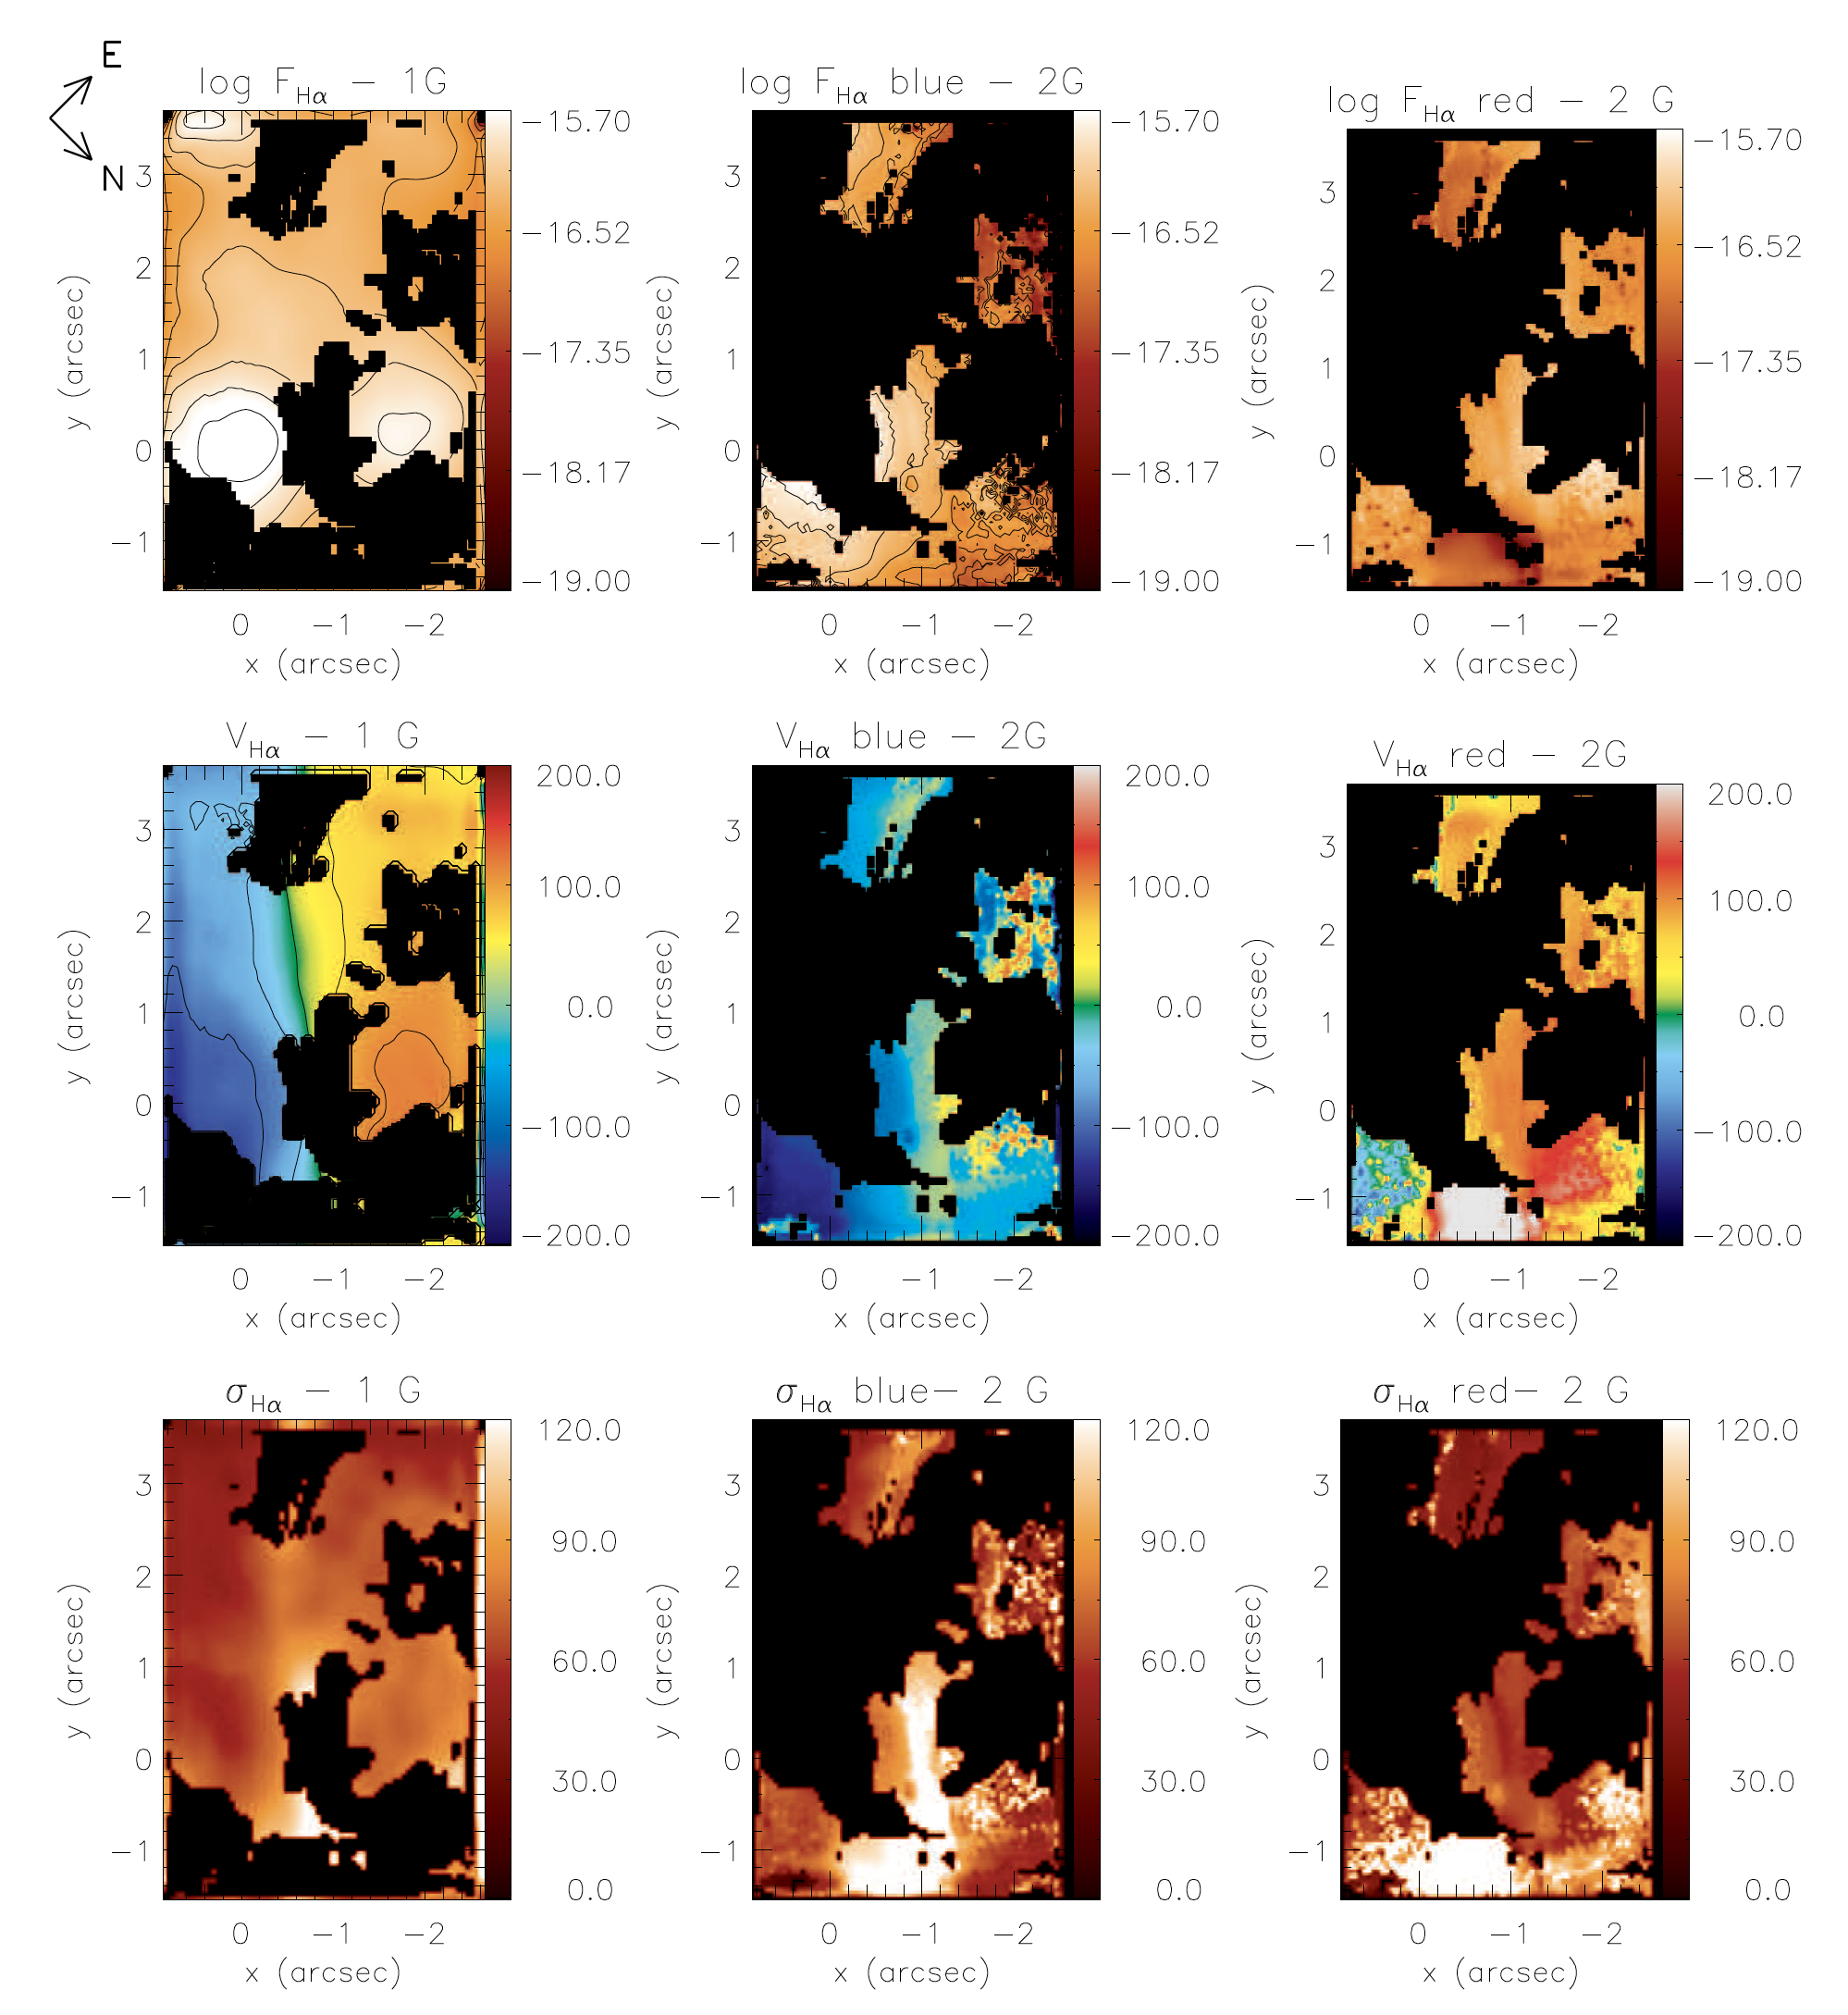
The flux distribution, velocity and velocity dispersion (after correction for instrumental resolution) maps derived from the single and double gaussian fits are presented for the H emission line in figure 6. It can be seen from the flux distributions that the region in which single gaussian fits were used includes the two prominent flux peaks previously identified as NWa and NWb, whereas the regions where the profiles exhibit splitting or extended wings and where two gaussian components were used, mainly lie between the blobs, or border them along the northwestern edge of the FOV.
Not surprisingly, the velocity field within the region where the lines were fitted with a single Gaussian component is very similar to that obtained from the single Gauss-Hermite series, exhibiting the same pattern of blueshifts on the SW side of the FOV, and redshifts on the NE side. The velocities obtained from the blue and red-shifted components of the two-component Gaussian fits are generally comparable with those obtained from the single component fits in the blue- and red-shifted sides of the FOV. The main exception is a region close the northwestern border of the FOV, where the red component has a much higher velocity ( km s-1) than is seen elsewhere. This location also coincides with a high velocity dispersion in both the red and blue components. However, the blue component in this region does not show a correspondingly large blueshift and its velocity in fact is quite comparable with the blueshifted velocities over the SW side of the FOV.
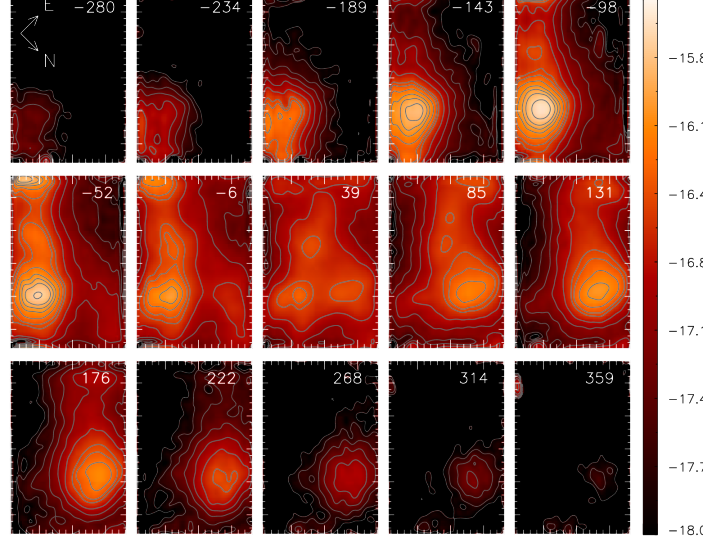
In figure 7 we present velocity channel maps extracted along the H line profile, using velocity bins of 45 km s-1. The distribution of H emission in these velocity slices also suggests that there are two distinct but partially overlapping kinematic components. Approximately half of the FOV on the SW side is covered by predominately blueshifted emission which includes the prominent flux peak, NWa, as well the fainter blob at the south corner of the FOV, which appears to be connected to NWa by a ridge of emission. These structures can be seen at velocities ranging from to km s-1 at NWa. The NE half of the FOV is dominated the redshifted emission. The main feature is NWb, but there is also a ridge of emission extending to the SE, with these structures spanning the velocity range km s-1.
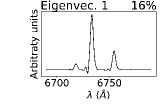
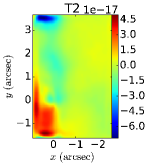
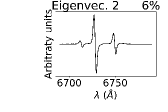
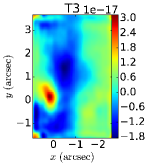
To gain further insights into the correlations between the spatial distribution of the line emitting gas and its velocity field, we applied Principal Components Analysis (PCA) to the IFU data cube. PCA is a statistical technique that has recently found various applications in astrophysics and in particular has been extensively applied to analyse IFU observations (PCA, e.g. Murtagh & Heck, 1987; Steiner et al., 2009; Ricci et al., 2011). This tool transforms the system of correlated coordinates into a system of orthogonal coordinates, and eigenvectors, ordered by principal components of decreasing variance. The projection of the data onto these coordinates produces images called tomograms, while eigenvectors correspond to the eigenspectra. The combined analysis of both can be used to identify distinct components in the IFU data, which facilitates physical interpretation.
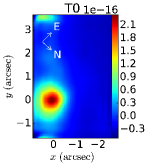
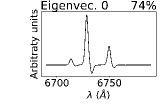
The results of our PCA analysis of the IRAS17526+3253 IFU data are shown in figure 8. The derived tomograms and their respective eigenspectra are shown in the left and right columns, respectively. The first eigenspectrum, which accounts for of the data cube variance, corresponds to the blueshifted emission and the bright NWa in the SW side of the FOV. The second, which accounts for of the variance, is mainly associated with the redshifted emission including NWb, a weaker structure extending in the direction of NWa and a diffuse feature extending to the SE. The and eigenspectra account for the remaining of the variance in the data cube and exhibit features associated, for example, with the peak of NWa, the knot at the S corner of the FOV and the boundary between the red and blueshifted regions. Overall, the structures revealed by the PCA analysis exhibit a very close correspondence with the features seen in the velocity channel maps.
 |
 |
 |
 |
 |
 |
 |
 |
Together with the channel maps, the results of the PCA analysis support the interpretation of the parameter maps derived from line-fitting, that the SW and NE sides of the FOV sample kinematically independent systems, which are respectively blue- and redshifted relative to the adopted systemic velocity. Accordingly, we have constructed separate maps of these regions for selected emission lines by combining the velocities, velocity dispersions and fluxes from the single component Gaussian fit with the corresponding values for the blue and redshifted components, respectively, of the double gaussian fits.
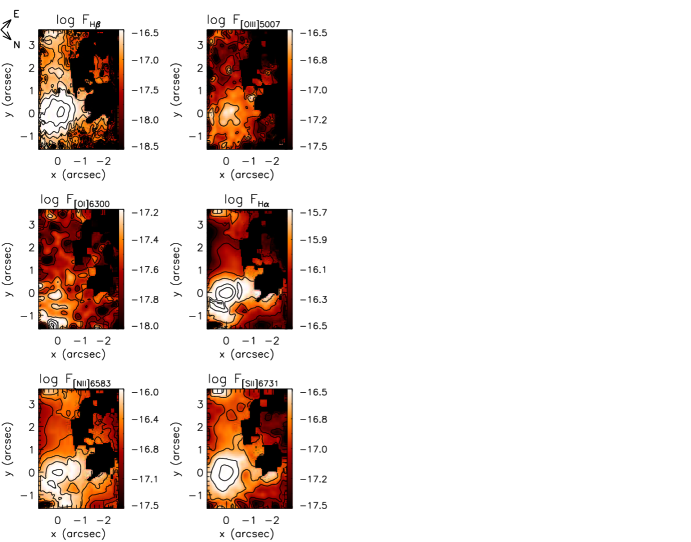
The flux maps for the H, [O iii]5007, [O i]6300, [N ii]6584, H, and [S ii]6731 emission lines are presented for the blueshifted region in figure 9. With the exception of [O i]6300, the line fluxes show similar distributions, the main feature being NWa with an angular size of roughly (pc). The fainter blob some to the SE is also seen in all lines, except for [O iii]5007 (probably due to the lower SNR). The [O i]6300 line is relatively weak over most of the FOV (SNR), but it is notable that its flux peak occurs near the northwestern edge of the field, offset by about to the North of NWa.
Figure 10 shows the centroid velocity (left-panels) and velocity dispersion (right panels) maps for the H, [O iii]5007 and [S ii]6716 lines in the blueshifted region, after subtraction of the systemic velocity ( = 7580 km s-1) and correction for instrumental resolution, respectively. As the corresponding maps for [N ii]6584 are similar to those of H line, they are not shown. As a whole, the gas in the southwestern half of the FOV exhibits a northwestern-southeastern velocity gradient, with the largest blueshifts ( km s-1) occurring in a region just south of NWa. Blob NWa itself has a velocity ( km s-1), while the diffuse emission has velocities ( km s-1). The highest velocity dispersions ( km s-1) occur in a localized region near the northwestern border of the FOV, and roughly centered between the two bright blobs. A ridge of higher velocity dispersion also extends southeastern along the border between the blue- and redshifted regions. However, outside these localized enhancements, the velocity dispersion is fairly uniform for the remainder of the blueshifted region, with a typical value km s-1 (the small-scale structure in the [O iii] map is due to the low SNR ratio). In particular, neither NWa or the secondary knot at the S corner of the FOV correspond to obvious features in the velocity dispersion map.
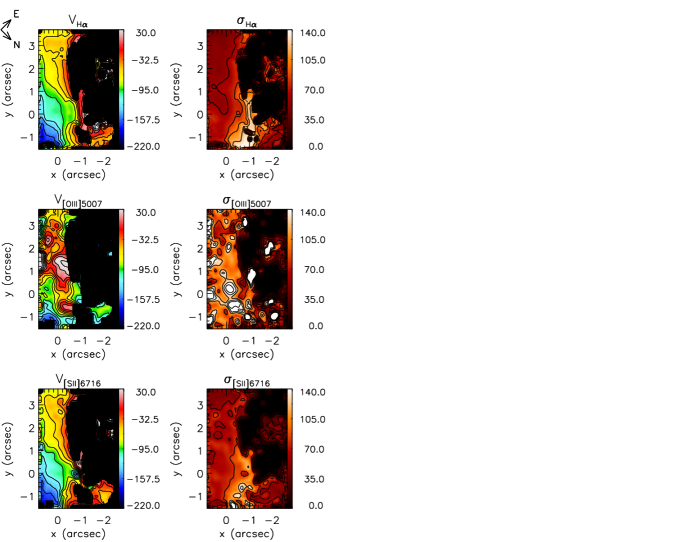
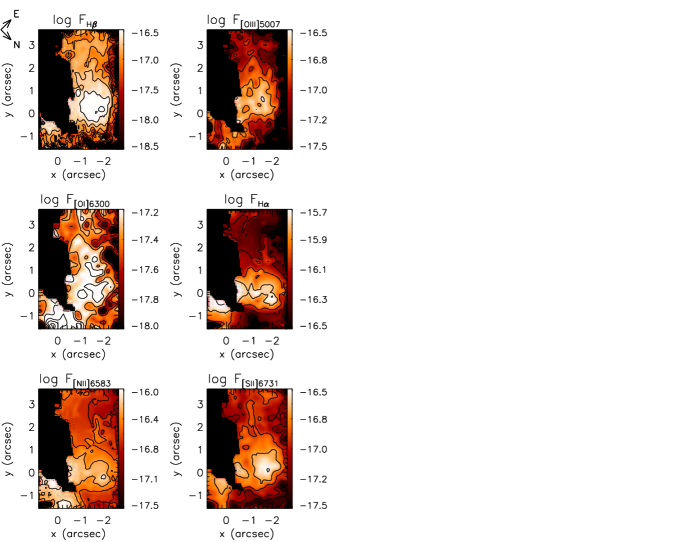
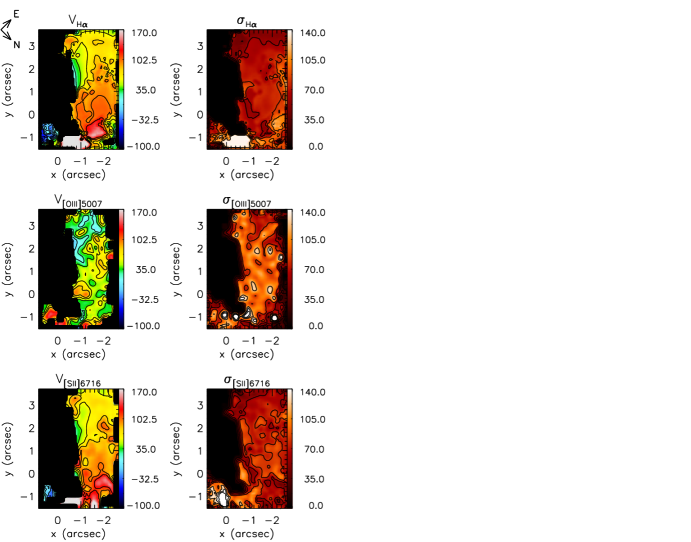
The emission-line flux, centroid velocity and velocity dispersion maps for the redshifted region are presented in figures 11 and 12. The main emission component in most lines is the component identified as NWb, which has a similar angular size to that of NWa (, and pc). However, just as in the corresponding flux map for the blueshifted region (figure 11), the strongest [O i]6300 emission is located close to the northwestern edge of the FOV, bordering NWa to the N. To a lesser extent this feature is also seen in [N ii]6584.
The velocity field of the redshifted region shows a similar gradient to that of the blueshifted region (12): the highest velocities ( km s-1) occur just northwestern of NWa, which itself has a velocity km s-1, whereas the diffuse emission to the SE has a typical velocity km s-1. However, there is also a distinct region, spatially coincident with the region where the [O i]6300 emission peaks, which clearly exhibits a high velocity ( km s-1) and velocity dispersion ( km s-1) in H, and possibly the other lines. The velocity dispersion is also generally enhanced ( km s-1) between the northwestern edge of the FOV and blobs NWa and NWb. It is worth noting that this side of the IFU FOV borders the radio source associated with the nucleus of the northwestern galaxy (see figure 2). Over the rest of the redshifted region, including NWb and the diffuse emission extending SE, the velocity dispersion is typically relatively low ( km s-1).
3.3 GMOS/IFU data analysis: emission line ratios and ionization
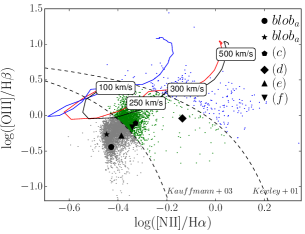
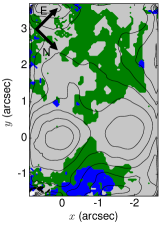
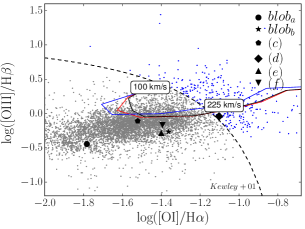
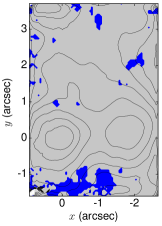
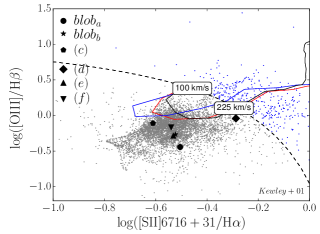
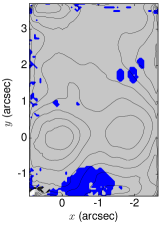
In order to investigate the ionization mechanisms responsible for the line emission in the region sampled by our IFU observations, we have used the line fluxes derived from the Gaussian fits to construct emission line ratio diagnostic BPT diagrams (Baldwin et al., 1981). In fact, we use the diagrams introduced by Veilleux & Osterbrock (1987): [O iii]5007/H versus [N ii]6584/H, [O iii]5007/H versus [O i]6300/H, and [O iii]5007/H versus [S ii]6716+31/H, as shown in figure 13 (left panels). The point cloud in each diagram represents line ratios computed for individual spaxels, using the fluxes of the blueshifted or redshifted Gaussian components as appropriate. The symbols represent line ratios derived from spectra extracted from apertures centered on regions (a)–(d) as indicated in figure 3. The dashed lines represent the empirical boundaries separating galaxies which have starburst/H ii region nuclei (grey points), active galactic nuclei (blue points) and composite nuclei (green points) derived from analyses of SDSS spectra by Kewley et al. (2001) and Kauffmann et al. (2003). The spaxels occupying each region are color-coded and their distributions over the IFU FOV are shown in the corresponding excitation maps (right-panels of figure 13).
Also plotted in the BPT diagrams are loci of radiative shock models taken from the library computed with the MAPPINGS III code provided by Allen et al. (2008). These models include a photoionized precursor and assume solar abundances and a pre-shock density 1.0 cm-3. Sequences in shock velocity ranging from 100 to 1000 km s-1 are plotted for three values of the magnetic field strength parameter: and G, and a pre-shock density of 1.0 cm-3.
It is apparent that the vast majority of the spaxels fall within the stellar photoionized “H ii region” zones in the [O iii]5007/H – [O i]6300/H and [O iii]5007/H – [S ii]6716+31/H diagrams, or in either the “H ii region” or “composite” zones in the [O iii]5007/H – [N ii]6584/H. However, the distribution also extends into the “AGN” zone in all three diagrams. Notably, the majority of the spaxels that fall within the latter zone are located in the region close to the northwestern edge of the FOV that is characterized by high velocity dispersion and relatively strong [O i]6300 emission (e.g., figures 11 and 12).
The line ratios derived from the integrated spectra of regions (a)–(c) and (d)–(f) generally cluster quite closely together within the “H ii region” zones (or close to the “H ii region”–“Composite” boundary in the O iii]5007/H – [N ii]6584/H diagram). The exception is region (d), which falls close to the “H ii region”–“AGN” or “composite”–“AGN” boundaries in all three diagrams. This region is also located near the northwestern edge of the FOV and has a relatively high velocity dispersion.
The distribution of spaxels and selected regions in the BPT diagrams indicates that stellar photoionization is the dominant ionization mechanism over most of the FOV, including the bright blobs, NWa and NWb, and the more diffuse emission covering most of the rest of the field. However, the region northwestern of the bright blobs and centered roughly between them along the -axis is characterized by a high velocity dispersion and comparatively large values of the [N ii]6584/H, [O i]6300/H and [S ii]6716+31/H ratios. The line ratios in this region are consistent with weak AGN photoionization (i.e., LINER-like) but given the high velocity dispersion, a more likely explanation is shock ionization. The shock models indeed roughly reproduce the lateral scatter towards the “AGN” zone in the BPT diagrams and in the O iii]5007/H – [O i]6300/H, and [O iii]5007/H – [S ii]6716+31/H diagrams, at least, the region (d) line ratios are consistent with a shock velocity of km s-1. On the other hand, the models do not match the observed line ratios particularly well in the [O iii]5007/H – [N ii]6584/H diagram, because the models under predict the [N ii]6584/H ratio for a given shock velocity.
Nevertheless, it seems reasonable to conclude that the line emission in region (d) and in the blue-shaded regions northwestern of the bright blobs in figure 13 predominantly arises due to shock ionization. As can be seen in the excitation map corresponding to the [O iii]5007/H – [N ii]6584/H diagram, the “shock-ionized” region is surrounded by green-shaded “composite” region spaxels. This may indicate a transition zone where both shocks and H ii regions contribute to the spectrum.
| log() | log() | log() | log() | |
|---|---|---|---|---|
| Bloba | -0.42 | -0.44 | -1.78 | -0.50 |
| Blobb | -0.45 | -0.26 | -1.36 | -0.52 |
| Region (c) | -0.33 | -0.11 | -1.52 | -0.61 |
| Region (d) | -0.14 | -0.04 | -1.10 | -0.29 |
| Region (e) | -0.39 | -0.28 | -1.40 | -0.53 |
| Region (f) | -0.34 | -0.17 | -1.39 | -0.54 |
3.4 H photometry and star formation rates
As star formation appears to dominate the line emission from most of the IFU FOV, including the two brightest blobs (Section 3.3), H fluxes measured from the continuum subtracted FR656N ramp filter image were used to estimate star formation rates. Flux measurements were made for the entire IRAS17526+3253 system and also within smaller apertures centered on each of the two merging galaxies, the IFU field and blobs NWa and NWb within the IFU field. The aperture sizes used for the photometric measurements are listed in Table 2. In order to determine the intrinsic H fluxes from these measurements it is necessary to correct for both dust extinction and the contribution of the [N ii]6548,6584 lines, which fall within the filter passband. Approximate corrections were derived using line intensity ratios obtained from the IFU data. As there are large changes in the Balmer decrement over the IFU field of view, we derived two values for the H extinction, one using the H and H line fluxes integrated over the whole FOV, and the other using average of the line fluxes measured in 1 apertures centered on blobs NWa and NWb. For the IFU/FOV, we find , yielding , using the standard Milky Way extinction curve (Cardelli et al., 1989; ) and assuming the Case B recombination value, , for the intrinsic Balmer decrement (Osterbrock & Ferland, 2006). For the blobs, the average Balmer decrement is , implying a much lower extinction, 1.3.
| Flux | Northwestern | East | System | IFU/FOV |
|---|---|---|---|---|
| Aperture radius | 5 | 5 | 27 | 51 x 34 |
| Reddening and [N ii] correction derived from IFU/FOV | ||||
| F (erg/s/cm2) | 1.4e-13 | 8.3e-14 | 6.0e-13 | 1.7e-14 |
| FHα,corr | 1.1e-12 | 6.1e-13 | 4.5e-12 | 4.0e-13 |
| LHα (erg/s) | 1.5e+42 | 8.5e+41 | 6.2e+42 | 5.6e+41 |
| SFR (M⊙/yr) | 7.9 | 4.5 | 33.1 | 2.98 |
| Reddening and [N ii] correction derived using | ||||
| an average value from IFU NWa and NWb | ||||
| F (erg/s/cm2) | 1.4e-13 | 8.3e-14 | 6.0e-13 | 1.7e-14 |
| FHα,corr | 3.5e-13 | 2.0e-13 | 1.5e-12 | 1.3e-13 |
| LHα (erg/s) | 4.9e+41 | 2.8e+41 | 2.0e+42 | 1.8e+41 |
| SFR (M⊙/yr) | 2.58 | 1.48 | 10.8 | 0.97 |
Inspection of the FR656N image suggests that it is reasonable to suppose that the extinction affecting the IFU field is fairly representative of the emission line regions elsewhere in the system. Therefore, assuming that the two values of AHα derived from the IFU data represent upper and lower limits on the amount of extinction affecting a given region, we have used both values to calculate extinction corrections for each component, with the exception of the blobs themselves for which only the corresponding local value of AHα was used.
After applying extinction corrections, values of the [N ii]6584/H ratio measured from the IFU field were used to estimate and remove the contribution of the [N ii]6548,6584 lines to the fluxes measured from the HST images. Again, separate values of this ratio were derived, corresponding to the the whole IFU/FOV, and the average of the two blobs. Assuming , we estimate H contributions to the extinction corrected fluxes of 65% and 73%, respectively. The measured [Nii] fluxes, the reddening corrected H fluxes and the H luminosities are listed for each region for both the “high” and “low” extinction cases in Table 2.
The corresponding star formation rates are also listed in Table 2 and were estimated from the H luminosity using the relationship given by Calzetti et al. (2007): SFR. The measured H luminosities imply that the unobscured star formation rate for the entire IRAS17526+3253 system is M⊙yr-1, with the central regions of the interacting galaxies contributing M⊙yr-1 and M⊙yr-1 for the northwestern and east components, respectively, and with most of the star formation in the latter being associated with the bright H ii regions within the IFU/FOV.
4 Discussion
4.1 Large-scale morphology and merger stage
Our HST/ACS observations confirm earlier suggestions (Andreasian & Alloin, 1994; Wagner, 2013) that IRAS17526+3253 is a late stage major merger. Although the northwestern nucleus appears larger and brighter in the F814W image and has a brighter radio source, the Ks magnitudes derived from the 2MASS image suggest that the two galaxies have similar bulges, with a mass ratio . Both galaxies appear to be quite highly inclined and the elongated nature of the system as a whole suggests that it is viewed close to the orbital plane of the interaction. The two galaxy nuclei are separated by a projected distance of kpc, and appear to be embedded within a complex, disturbed structure with multiple dust lanes, large-scale tidal tails or plumes and widely distributed clumps of star formation. A comparison with merger simulations (e.g. Lotz et al., 2008; Hung et al., 2016) suggests that the morphological properties of the system are consistent with an mid to advanced merger stage, probably between the second pericenter passage and final coalescence.
Both nuclei host compact, but resolved radio sources at 1.49 GHz; which have properties consistent with radio emission from starburst galaxies (Baan & Klöckner, 2006). An optical spectrum obtained by (Baan et al., 1998), is also consistent with starburst activity, but this classification probably relates only to the NW nucleus (private communication).
Our IFU observation was designed to sample the brightest emission line region in the northwestern galaxy. As discussed in 3, this region has a complex structure with at least two kinematically distinct components, but over most of the field of view, the emission line ratios are consistent with photoionization in star formation regions. However, the radio source associated with this galaxy is centered within the prominent dust lane that borders the northern corner of the IFU field. Thus, assuming that the radio source core corresponds to the nucleus of the galaxy, it is evidently embedded in the dust lane and heavily obscured at optical wavelengths. It is likely, therefore, that the IFU field does not include the nucleus itself, but samples the surrounding star formation regions.
The Imperial IRAS-FSC Redshift Catalogue (IIFSCz Wang & Rowan-Robinson, 2009) gives a far infrared luminosity of L⊙ for the IRAS17526+3253 system, implying a global star formation rate M⊙ yr-1. This is approximately consistent with the total of the obscured and unobscured star formation rates estimated from the 1.4 GHz radio sources (Baan & Klöckner, 2006) and the continuum-subtracted H image, respectively (Section 3.4). The FIR luminosity and global star formation rate are both somewhat higher than the median values ( and M⊙ yr, respectively) for the sample of local mergers studied by (Carpineti et al., 2015), but are very close to the peaks of the respective distributions. Evidently, IRAS17526+3253 is a fairly typical example of a spiral-spiral merger in the local universe, insofar as its star formation rate is concerned.
4.2 Ionized gas excitation and kinematics
As noted above, the IFU field samples a bright emission line region within the northern galaxy, bordering the compact radio source that we presume locates the obscured nucleus. As discussed in Section 3.2, the emission line region is divided into two main components by a discontinuity in the velocity field of magnitude km s-1, one of which (on the SW side) is blue-shifted and the other (NE side) red-shifted, relative to the mean velocity. These components are also present in the velocity channel maps and are also clearly visible in the PCA tomograms as eigenvectors 1 and 2, which together account for 95% of the variance. In addition, the increased velocity dispersion and line splitting along the boundary defined by the velocity field discontinuity are also consistent with physically distinct components at different velocity shifts, with one slightly overlapping the other in projection. Morphologically, each kinematic component is dominated by a bright blob (NWa and NWb, respectively), appearing both in continuum and in line emission, which are separated by 850 pc, and surrounded by more diffuse ionized gas.
The emission line ratios indicate that star formation is the main source of the line emission in both kinematic components, including the two bright blobs. However, the fainter line emission bordering the blobs to the northwest is characterized by a higher velocity dispersion and line ratios consistent with shock ionization for shock velocities km s-1. This shock ionized region is situated between the bright blobs and both the nuclear radio source and the prominent dust lane, which crosses the northern corner of the IFU field.
The origin of the two kinematic components is unclear. However, it seems plausible that one is associated with the disrupted disk of the northwestern galaxy, while the other is tidal debris, seen in projection and partially overlapping the disk. It is possible that this “debris” is a tidal tail originating in the southeastern galaxy since the longslit spectrum obtained by Andreasian & Alloin (1994) suggests that this galaxy is redshifted by km s-1 relative to its NW counterpart. The HST F814W image suggests that the prominent dust lane crossing the core of NW galaxy may also be associated with the tidal tail. In this scenario, the shocked gas may be the result of an interaction between the tidal tail and part of the NW galaxy’s disk.
4.3 Maser sources
As noted in Section 1, the identification of an OH maser source in IRAS17526+3253 rests on the feature reported by Martin (1989b), which has a velocity km s-1. In comparison, the H I 21 cm emission observed by the same author peaks at km s-1, approximately the same velocity as the H2O maser lines (Wagner, 2013). In addition, CO emission has been detected both at km s-1 and km s-1 (Baan et al., 2008). There are evidently two velocity systems present in the IRAS17526+3253 system, which are most probably associated with the two galaxies revealed by the HST image. The OH maser emission and the blueshifted component of the CO(2-1) line have velocities comparable with that of the blueshifted component of ionized gas, which we have identified with the NW galaxy. As discussed above (Section 4.2), the SE galaxy appears to be redshfted by km s-1 with respect to the latter. Based on the kinematics, therefore, we can conclude that the OH maser source is located in the NW galaxy, whereas the H2O masers are associated with the SE galaxy.
4.4 Comparison with previously studied OHMG
IRAS17526+3253 is the fourth OH megamaser galaxy that we have studied in detail to date. These systems exhibit a range of morphological and gas excitation characteristics. Multiwavelength imaging and spectral energy distribution analysis of IRAS16399-0937 (Sales et al., 2015) revealed that it is an mid to advanced merger with two nuclei embedded in a tidally distorted envelope, with a total SFR M⊙ yr-1. The nuclei are separated by kpc and the northwestern hosts a dust embedded AGN of luminosity erg s-1. IRASF23199+0123 was studied using HST and VLA images as well Gemini IFU spectroscopy (Hekatelyne et al., 2018a). This is an interacting pair, connected by a tidal tail, whose two galaxies are separated by 24 kpc. The detection of a broad H emission line revealed that the eastern member of the pair hosts a Seyfert 1 nucleus. In this, case we were also able to obtain VLA maps the OH maser emission, showing that the eastern galaxy also hosts two masing sources, which appear to be closely associated with the AGN. The OH masers are located in the vicinity of a region of enhanced velocity dispersion and higher [NII]/H ratios, suggesting that they are associated with shocks driven by AGN outflows. In contrast, IRAS03056+2034 is a barred spiral with morphological irregularities suggesting interactions and a circum-nuclear ring (radius kpc) of star-forming regions, with an SFR M⊙ yr-1 (Hekatelyne et al., 2018b). As in IRAS17526+3253, there is no clear evidence that the galaxy hosts an AGN.
These four systems are too small a sample upon which to base any firm conclusions. However, it is perhaps notable that OH masers are present in mid to advanced major mergers (IRAS16399-0937, IRAS17526+3253) as well as in a galaxy that may be in an early stage of a possible merger (IRASF23199+0123) and one that is not undergoing any noticeable interaction with a similarly sized companion (IRAS03056+2034). Two of these systems harbour moderately luminous embedded AGN in at least one of their components (IRAS16399-0937 and IRASF23199+0123), but the other two appear to be dominated by star formation. In the one case for which we have so far been able to establish the location of the OH maser sources, they are associated with the AGN, perhaps arising in shocks driven by the latter.
IRAS17526+3253 is one of only a handful of galaxies known to host both luminous OH and H2O masers Wiggins et al. (2016). Of these, only two are dual megamaser hosts, Arp 299, (Tarchi et al., 2011) and II Zw 96, (Wagner, 2013; Wiggins et al., 2016) (a possible third candidate, UGC5101, has a dubious OH detection; Wiggins et al.). The apparent dearth of systems hosting megamasers of both species may be due to the different physical conditions required for maser emission in each case, with OH masers typically occurring in (U)LIRG systems, whereas H2O masers are usually associated with AGN (Lo, 2005). The two dual megamaser hosts are both merging systems with spatially distinct nuclei and both are spectroscopically classified as H II galaxies. Although IRAS 7526+3253 does not quite qualify as an OH megamaser host by the criteria adopted by Wiggins et al. (), it’s OH maser luminosity is only slightly less than that of Arp 299. On the other hand, IRAS 7526+3253 has an H2O maser luminosity comparable with that of the other two systems. In several respects, therefore, IRAS 17526+3253 is similar to the two known dual megamaser hosts. In Arp 299, the H2O maser emission was detected in the nucleus that also hosts the OH maser source (Tarchi et al., 2011). The II Zw 96 system appears to be a complex advanced merger in which the OH maser source is associated with a tidally stripped and heavily reddened nucleus that may contain an embedded AGN (Migenes et al., 2011), but it is not clear if the H2O maser comes from the same region. In IRAS 7526+3253, the evidence suggests that the OH and H2O masers are associated with different nuclei (NW and SE, respectively). There is no evidence supporting the presence an AGN in either nucleus, although this possibility cannot be ruled based on the existing data, and we currently lack a spectroscopic classification for the SE nucleus. Thus, further observations of IRAS 17526+3253, in particular, to determine if either nucleus hosts an AGN may shed light on any connections between OH and H2O masers and galaxy merger stage.
 |
 |
 |
 |
 |
 |
5 Summary and Conclusion
We have presented a multiwavelength study of the luminous infrared galaxy IRAS17526+3253, using Gemini GMOS/IFU, HST, 2MASS and VLA data. Previous radio studies have classified the two major components of the IRAS17526+3253 system as starburst galaxies. This system has also been reported to host OH megamaser emission, although strong radio frequency interference frustrated a more recent attempt to confirm the detection.
The data set analyzed here combines new emission line (H+[Nii) and broad-band (FR914M, F814W) imaging obtained with the HST ACS Wide Field Camera with archival VLA radio imaging. We also present a two-dimensional analysis of the gas excitation and kinematics of a bright emission line region in the northwestern galaxy. The main results from this analysis are summarized below:
-
•
The HST/ACS, 2MASS Ks-band and 1.49 GHz VLA images clearly reveal a mid-stage major merger with two main galaxy nuclei separated by a projected distance of 8.5 kpc, embedded in an elongated irregular envelope. The northwestern galaxy is quite highly inclined, with the second component appearing to be merging with its companion and probably between the second pericenter passage and final coalescence. The morphological elongation of the system suggests that we are observing it from a viewpoint quite close to the orbital plane. The two nuclei are clearly distinguished in the near-IR (2MASS Ks-band) and each is associated with a compact (but resolved) 1.49 GHz radio source, previously attributed to star formation. The HST/ACS F814W image shows that the two galaxies are embedded in a large tidally distorted envelope with a complex structure including numerous dust lanes and bright knots.
-
•
The HST H+[Nii emission line image shows at least 27 compact regions of ongoing star formation across the envelope over scales of several 10’s of kpc. IRAS17526+3253 has previously been classified, based on an optical spectrum as a star-forming galaxy.
-
•
Our Gemini/IFU observation was designed to sample the brightest emission line region in the northern galaxy, which lies just outside the galaxy nucleus. Assuming that the radio core corresponds to the position of the latter, it is evidently obscured by a prominent dust lane that borders the northern corner of the Gemini/IFU FOV. Two distinct kinematic components, divided by a discontinuity in the velocity field of magnitude 200 km s-1, are present in the IFU field. One component (on the SW side) is blue-shifted and the other (NE side) red-shifted, relative to the mean velocity. These components are also present in the velocity channel maps and are also clearly visible in the PCA tomograms. Each kinematic component is dominated by a bright blob (NWa and NWb, respectively), appearing both in optical continuum and in line emission, which are separated by 850 pc, and surrounded by more diffuse ionized gas.
-
•
The emission line ratio diagnostic diagrams indicate that star formation is the main source of the line emission in both kinematic components, including the two bright blobs. However, the fainter line emission bordering the blobs to the northwestern is characterized by a higher velocity dispersion and line ratios consistent with shock ionization for shock velocities 200 km s-1. This shock ionized region is situated between the bright blobs and both the nuclear radio source and the prominent dust lane crossing the northern corner of the field.
-
•
We suggest that the two kinematic components represent, on the SW side of the IFU field, the disrupted disk of the northwestern galaxy, and on the NE side, tidal debris, seen in projection and partially overlapping the disk. This material may be part a tidal tail from the southeastern galaxy. The shocked gas may be the result of an interaction between the tidal tail and part of the NW galaxy’s disk.
-
•
The measured H luminosities imply that the unobscured star formation rate of the whole IRAS17526+3253 system is M⊙yr-1, with the central regions of the interacting galaxies contributing M⊙yr-1 and M⊙yr-1 for the northwestern and east components, respectively, and with most of the star formation in the northwestern being associated with the bright H ii regions within the IFU/FOV.
-
•
IRAS17526+3253 is one of only a few systems known to host luminous OH and H2O masers. The velocities of the OH and H2O masers suggest that they are associated with the NW and SE galaxies, respectively.
Support for program HST-SNAP 11604 was provided by NASA through a grant from the Space Telescope Science Institute, which is operated by the Association of Universities for Research in Astronomy, Inc., under NASA contract NAS 5-26555. This material is based upon work partly supported by the National Aeronautics and Space Administration under Grant No. NNX11AI03G issued through the Science Mission Directorate. D. A. Sales gratefully acknowledge for partial financial support received from FAPERGS/CAPES n.05/2013 and CNPq Universal 01/2016. A. R and D. A. Sales acknowledge the Sociedade Brasileira de Física (SBF) and the American Physical Society (APS) for financial support received from the Brazil-U.S. Exchange Program. The work of S.B. and C.O. was supported by NSERC (Natural Science and Engineering Research Council of Canada). Based on observations obtained at the Gemini Observatory [include additional acknowledgement here, see section 1.2], which is operated by the Association of Universities for Research in Astronomy, Inc., under a cooperative agreement with the NSF on behalf of the Gemini partnership: the National Science Foundation (United States), the National Research Council (Canada), CONICYT (Chile), Ministerio de Ciencia, Tecnología e Innovaci n Productiva (Argentina), and Ministério da Ciência, Tecnologia e Inovacação (Brazil). This research has made use of the NASA/IPAC Extragalactic Database (NED) which is operated by the Jet Propulsion Laboratory, California Institute of Technology, under contract with the National Aeronautics and Space Administration.
References
- Allen et al. (2008) Allen M. G., Groves B. A., Dopita M. A., et al., 2008, ApJS, 178, 20
- Allington-Smith et al. (2002) Allington-Smith, J., Murray, G., Content, R., et al. 2002, PASP, 114, 892
- Andreasian & Alloin (1994) Andreasian, N., & Alloin, D. 1994, A&AS, 107, 23
- Angulo et al. (2012) Angulo, R. E., Springel, V., White, S. D. M., et al. 2012, MNRAS, 426, 2046
- Baan et al. (1998) Baan, W. A., Salzer, J. J., & LeWinter, R. D. 1998, ApJ, 509, 633
- Baan & Klöckner (2006) Baan, W. A., & Klöckner, H.-R. 2006, A&A, 449, 559
- Baan et al. (2008) Baan, W. A., Henkel, C., Loenen, A. F., Baudry, A., & Wiklind, T. 2008, A&A, 477, 747
- Baldwin et al. (1981) Baldwin, J. A., Phillips, M. M., & Terlevich, R. 1981, PASP, 93, 5
- Banerji et al. (2011) Banerji, M., Chapman, S. C., Smail, I., et al. 2011, MNRAS, 418, 1071
- Barnes & Hernquist (1992) Barnes, J. E., & Hernquist, L. 1992, ARA&A, 30, 705
- Bell et al. (2003) Bell, E. F., McIntosh, D. H., Katz, N., & Weinberg, M. D. 2003, ApJS, 149, 289
- Blumenthal et al. (1984) Blumenthal, G. R., Faber, S. M., Primack, J. R., & Rees, M. J. 1984, Nat, 311, 517
- Boylan-Kolchin et al. (2009) Boylan-Kolchin, M., Springel, V., White, S. D. M., Jenkins, A., & Lemson, G. 2009, MNRAS, 398, 1150
- Calzetti et al. (2007) Calzetti, D., Kennicutt, R. C., Engelbracht, C. W., et al. 2007, ApJ, 666, 870
- Caputi et al. (2007) Caputi, K. I., Lagache, G., Yan, L., et al. 2007, ApJ, 660, 97
- Cardelli et al. (1989) Cardelli, J. A., Clayton, G. C., & Mathis, J. S. 1989, ApJ, 345, 245
- Carpineti et al. (2015) Carpineti, A., Kaviraj, S., Hyde, A. K., et al. 2015, A&A, 577, A119
- Cicone et al. (2014) Cicone, C., Maiolino, R., Sturm, E., et al. 2014, A&A, 562, A21
- Condon et al. (1983) Condon, J. J., Condon, M. A., Broderick, J. J., & Davis, M. M. 1983, AJ, 88, 20
- Condon & Broderick (1991) Condon, J. J., & Broderick, J. J. 1991, AJ, 102, 1663
- Conselice (2014) Conselice, C. J. 2014, ARA&A, 52, 291
- de Vaucouleurs et al. (1991) de Vaucouleurs, G., de Vaucouleurs, A., Corwin, H. G., Jr., et al. 1991, Third Reference Catalogue of Bright Galaxies. Volume I: Explanations and references. Volume II: Data for galaxies between 0h and 12h. Volume III: Data for galaxies between 12h and 24h., by de Vaucouleurs, G.; de Vaucouleurs, A.; Corwin, H. G., Jr.; Buta, R. J.; Paturel, G.; Fouqué, P.. Springer, New York, NY (USA), 1991, 2091 p., ISBN 0-387-97552-7, Price US$ 198.00. ISBN 3-540-97552-7, Price DM 448.00. ISBN 0-387-97549-7 (Vol. I), ISBN 0-387-97550-0 (Vol. II), ISBN 0-387-97551-9 (Vol. III).
- Gioia et al. (1982) Gioia, I. M., Gregorini, L., & Klein, U. 1982, A&A, 116, 164
- Engel et al. (2010) Engel, H., Tacconi, L. J., Davies, R. I., et al. 2010, ApJ, 724, 233
- Feruglio et al. (2010) Feruglio, C., Maiolino, R., Piconcelli, E., et al. 2010, A&A, 518, L155
- Fullmer & Lonsdale (1989) Fullmer, L., & Lonsdale, C. 1989, Cataloged Galaxies and Quasars Observed in the IRAS Survey (Pasadena: JPL)
- Garwood et al. (1987) Garwood, R. W., Dickey, J. M., & Helou, G. 1987, ApJ, 322, 88
- George et al. (2014) George, R. D., Ivison, R. J., Smail, I., et al. 2014, MNRAS, 442, 1877
- Haan et al. (2011) Haan, S., Surace, J. A., Armus, L., et al. 2011, AJ, 141, 100
- Hayward et al. (2013) Hayward, C. C., Narayanan, D., Kereš, D., et al. 2013, MNRAS, 428, 2529
- Hekatelyne et al. (2018a) Hekatelyne, C., Riffel, R. A., Sales, D., et al. 2018, MNRAS, 474, 5319
- Hekatelyne et al. (2018b) Hekatelyne, C., Riffel, R. A., Sales, D., et al. 2018, MNRAS, 479, 3966
- Heckman et al. (2000) Heckman, T. M., Lehnert, M. D., Strickland, D. K., & Armus, L. 2000, ApJs, 129, 493
- Hoopes et al. (1999) Hoopes, C. G., Walterbos, R. A. M., & Rand, R. J. 1999, ApJ, 522, 669
- Hopkins et al. (2006) Hopkins, P. F., Hernquist, L., Cox, T. J., et al. 2006, ApJs, 163, 1
- Hung et al. (2016) Hung, C.-L., Hayward, C. C., Smith, H. A., et al. 2016, ApJ, 816, 99
- Hwang et al. (2010) Hwang, H. S., Elbaz, D., Lee, J. C., et al. 2010, A&A, 522, A33
- Kartaltepe et al. (2012) Kartaltepe, J. S., Dickinson, M., Alexander, D. M., et al. 2012, ApJ, 757, 23
- Kauffmann et al. (2003) Kauffmann, G., Heckman, T. M., Tremonti, C., et al. 2003, MNRAS, 346, 1055
- Kewley et al. (2001) Kewley, L. J., Dopita, M. A., Sutherland, R. S., Heisler, C. A., & Trevena, J. 2001, ApJ, 556, 121
- Kormendy & Ho (2013) Kormendy, J., & Ho, L. C. 2013, ARA&A, 51, 511
- Lahav & Liddle (2014) Lahav, O., & Liddle, A. R 2014, arXiv:1401.1389
- Lo (2005) Lo, K. Y. 2005, ARA&A, 43, 625
- Lotz et al. (2008) Lotz, J. M., Jonsson, P., Cox, T. J., & Primack, J. R. 2008, MNRAS, 391, 1137
- Martin et al. (1989a) Martin, J.-M., Bottinelli, L., Gouguenheim, L., Le Squeren, A.-M., & Dennefeld, M. 1989, Academie des Sciences Paris Comptes Rendus Serie Sciences Mathematiques, 308, 287
- Martin (1989b) Martin, S. J. 1989, Ph.D. Thesis, University de Paris VII.
- Martin (2005) Martin, C. L. 2005, ApJ, 621, 227
- Migenes et al. (2011) Migenes, V., Coziol, R., Cooprider, K., et al. 2011, MNRAS, 416, 1267
- Mihos & Hernquist (1996) Mihos, J. C., & Hernquist, L. 1996, ApJ, 464, 641
- Monreal-Ibero et al. (2006) Monreal-Ibero, A., Arribas, S., & Colina, L. 2006, ApJ, 637, 138
- Monreal-Ibero et al. (2010) Monreal-Ibero, A., Arribas, S., Colina, L., et al. 2010, A&A, 517, A28
- Murtagh & Heck (1987) Murtagh, F., & Heck, A. 1987, Astrophysics and Space Science Library, 131, 236
- Nardini et al. (2010) Nardini, E., Risaliti, G., Watabe, Y., Salvati, M., & Sani, E. 2010, MNRAS, 405, 2505
- Osterbrock & Ferland (2006) Osterbrock, D. E. & Ferland, G. J., Astrophysics of gaseous nebulae and active galactic nuclei, 2nd. ed. by D.E. Osterbrock and G.J. Ferland. Sausalito, CA: University Science Books, 2006
- Peng et al. (2002) Peng, C. Y., Ho, L. C., Impey, C. D., & Rix, H.-W. 2002, AJ, 124, 266
- Planck Collaboration at al. (2013) Planck Collaboration, Ade, P. A. R., Aghanim, N., et al. 2013, arXiv:1303.5076
- Ricci et al. (2011) Ricci, T. V., Steiner, J. E., & Menezes, R. B. 2011, ApJL, 734, L10
- Rich et al. (2012) Rich, J. A., Torrey, P., Kewley, L. J., Dopita, M. A., & Rupke, D. S. N. 2012, ApJ, 753, 5
- Rich et al. (2015) Rich, J. A., Kewley, L. J., & Dopita, M. A. 2015, arXiv:1509.08468
- Riffel (2010) Riffel, R. A. 2010, Ap&SS, 327, 239
- Rossa & Dettmar (2000) Rossa, J., & Dettmar, R.-J. 2000, A&A, 359, 433
- Rossa & Dettmar (2003) —. 2003, A&A, 406, 505
- Rupke et al. (2002) Rupke, D. S., Veilleux, S., & Sanders, D. B. 2002, ApJ, 570, 588
- Rupke & Veilleux (2013) Rupke, D. S. N., & Veilleux, S. 2013, ApJ, 768, 75
- Sanders et al. (1988) Sanders, D. B., Soifer, B. T., Elias, J. H., et al. 1988, ApJ, 325, 74
- Sanders & Mirabel (1996) Sanders, D. B., & Mirabel, I. F. 1996, ARA&A, 34, 749
- Sales et al. (2015) Sales, D. A., Robinson, A., Axon, D. J., et al. 2015, ApJ, 799, 25
- Silk & Mamon (2012) Silk, J., & Mamon, G. A. 2012, Research in Astronomy and Astrophysics, 12, 917
- Soifer et al. (1984) Soifer, B. T., Rowan-Robinson, M., Houck, J. R., et al. 1984, ApJl, 278, L71
- Spoon et al. (2013) Spoon, H. W. W., Farrah, D., Lebouteiller, V., et al. 2013, ApJ, 775, 127
- Springel et al. (2005) Springel, V., Di Matteo, T., & Hernquist, L. 2005, MNRAS, 361, 776
- Steiner et al. (2009) Steiner, J. E., Menezes, R. B., Ricci, T. V., & Oliveira, A. S. 2009, MNRAS, 395, 64
- Sturm et al. (2011) Sturm, E., González-Alfonso, E., Veilleux, S., et al. 2011, ApJl, 733, L16
- Tacconi et al. (2008) Tacconi, L. J., Genzel, R., Smail, I., et al. 2008, ApJ, 680, 246
- Tarchi et al. (2008) Tarchi, A., Castangia, P., Henkel, C., Surcis, G., & Menten, K. M. 2011, A&A, 525, A91
- Tarchi et al. (2011) Tarchi, A., Castangia, P., Henkel, C., Surcis, G., & Menten, K. M. 2011, A&A, 525, A91
- van Dokkum (2001) van Dokkum, P. G. 2001, PASP, 113, 1420
- Veilleux & Osterbrock (1987) Veilleux, S. & Osterbrock, D.E. 1987, ApJS, 63, 295
- Veilleux et al. (2002) Veilleux, S., Kim, D.-C., & Sanders, D. B. 2002, ApJs, 143, 315
- Veilleux et al. (2009) Veilleux, S., Rupke, D. S. N., Kim, D.-C., et al. 2009, ApJs, 182, 628
- Veilleux et al. (2013) Veilleux, S., Meléndez, M., Sturm, E., et al. 2013, ApJ, 776, 27
- Wagner (2013) Wagner, J. 2013, A&A, 560, A12
- McBride & Heiles (2013) McBride, J., & Heiles, C. 2013, ApJ, 763, 8
- Wang & Rowan-Robinson (2009) Wang, L., & Rowan-Robinson, M. 2009, MNRAS, 398, 109
- Wiggins et al. (2016) Wiggins, B. K., Migenes, V., & Smidt, J. M. 2016, ApJ, 816, 55