High-magnetic field phase diagram and failure of magnetic Grüneisen scaling in LiFePO4
Abstract
We report the magnetic phase diagram of single-crystalline LiFePO4 in magnetic fields up to 58 T and present a detailed study of magneto-elastic coupling by means of high-resolution capacitance dilatometry. Large anomalies at in the thermal expansion coefficient imply pronounced magneto-elastic coupling. Quantitative analysis yields the magnetic Grüneisen parameter mol/J. The positive hydrostatic pressure dependence K/GPa is dominated by uniaxial effects along the -axis. Failure of Grüneisen scaling below K, i.e., below the peak temperature in the magneto-electric coupling coefficient [Toft-Petersen et al., 2015], implies several competing degrees of freedom and indicates relevance of recently observed hybrid excitations [Yiu et al., 2017]. A broad and strongly magnetic-field-dependent anomaly in in this temperature regime highlight the relevance of structure changes. Upon application of magnetic fields -axis, a pronounced jump in the magnetisation implies spin-reorientation at T as well as a precursing phase at 29 T and K. In a two-sublattice mean-field model, the saturation field T enables the determination of the effective antiferromagnetic exchange interaction meV as well as the anisotropies meV and meV.
I Introduction
In addition to exceptionally high applicability of lithium orthophosphates Padhi et al. (1997); Chung et al. (2011); Park et al. (2010) for electrochemical energy storage in Li-ion batteries, competing magnetic interactions, magnetic anisotropy and coupling of spin and electric degrees of freedom yield complex magnetic behaviour in LiPO4 ( = Mn, Fe, Co, Ni). The rich resulting physics is, e.g., demonstrated by ferrotoroidicity in LiCoPO4 and LiNiPO4 Van Aken et al. (2007, 2008); Zimmermann et al. (2009). In general, depending on the actual transition metal, LiPO4 develops long-range antiferromagnetic order at low temperatures and exhibits a large magneto-electric effect in the magnetically ordered phase Vaknin et al. (2004a); Rivera (1994); Toft-Petersen et al. (2015). The known magnetic phase diagrams of this family are rather complex, featuring incommensurate spin configurations, frustration, and usual magnetic excitations Vaknin et al. (2004b); Jensen et al. (2009); Baek et al. (2014); Rudisch et al. (2013); Fogh et al. (2017); Toft-Petersen et al. (2012, 2011).
Magnetic phase diagrams have been reported for all lithium orthophosphates Fogh et al. (2017); Toft-Petersen et al. (2012, 2011) except for LiFePO4. At T, LiFePO4 develops long-range antiferromagnetic order of spins of the magnetic Fe2+-ions below = 50 K Santoro and Newnham (1967). The ordered moment amounts to 4.09 Rousse et al. (2003); Toft-Petersen et al. (2015) and the spins are mainly directed along the crystallographic -axis (space group ) Rousse et al. (2003). Notably, the ground state features a collinear rotation of the spins towards the -axis as well as spin canting along the -axis with an overall rotation of the ordered moments of 1.3(1)∘ off the -axis Toft-Petersen et al. (2015); Yiu et al. (2017). The observed spin canting suggests the presence of Dzyaloshinsky-Moriya (DM) interactions which may account for the magneto-electric coupling in LiFePO4. In particular, as spin canting is not compatible with symmetry, a lower crystal symmetry might appear below Li et al. (2006); Toft-Petersen et al. (2015). Even in the absence of spin canting, an alternative mechanism to the ME effect may originate from orbital magnetic moments responding to polar distortions induced by an applied electric field Scaramucci et al. (2012). Magnetic interactions have been studied by various groups using inelastic neutron scattering (INS) which imply competing antiferromagnetic interactions of however contradicting magnitude Li et al. (2006); Toft-Petersen et al. (2015); Yiu et al. (2017). When the INS data are analyzed including single-ion anisotropy which is strongly suggested by the results presented at hand, the dominating magnetic exchange is found in the -direction, i.e., and 0.77 meV, respectively, which is by a factor of 2 - 4 smaller than . Toft-Petersen et al. (2015); Yiu et al. (2017) Notably, rather dispersionless low-energy excitations have been found to persist up to 720 K which are discussed in terms of single-ion spin splitting. Yiu et al. (2017)
Here we report the magnetic phase diagram and magneto-elastic coupling in LiFePO4. Pronounced anomalies in the thermal expansion coefficients as well as pulsed-field magnetisation data are used to construct the magnetic phase diagram. The data imply spin-reorientation at T as well as a precursing phase at 29 T. and are discussed in a two-sublattice mean-field model which yields effective antiferromagnetic exchange interaction meV and anisotropies meV and meV. High-resolution dilatometry enables detailed studies of the interplay of spin, structure, and dielectric degrees of freedom. The magnetic Grüneisen parameter is determined as mol/J for K. At lower temperatures, failure of Grüneisen scaling indicates relevance of electric and/or structure degrees of freedom. Notably, a broad feature in the thermal expansion coefficient in the same temperature range further demonstrates the intimate coupling of spin, charge, and structure in LiFePO4.
II Experimental
Single crystals of LiFePO4 were grown by the high-pressure optical floating-zone method as reported in detail in Ref. Neef et al., 2017. Magnetisation in static magnetic fields up to 5 T was studied by means of a Quantum Design MPMS-XL5 SQUID magnetometer and in fields up to 15 T in a home-built vibrating sample magnetometer (VSM) Klingeler et al. (2006). Pulsed-magnetic-field magnetisation was studied up to 58 T at Helmholtz Zentrum Dresden Rossendorf by the induction method using a coaxial pick-up coil system Skourski et al. (2011). The pulse raising time was 7 ms. The pulsed-field magnetisation data were calibrated using static magnetic field measurements. The relative length changes were studied on a cuboidally-shaped crystal with a dimension of 3x3x2 mm3. The measurements were done by means of a three-terminal high-resolution capacitance dilatometer. Werner et al. (2017) In order to investigate the effect of magnetic fields, the linear thermal expansion coefficients were studied in magnetic fields up to 15 T which were applied along the direction of the measured length changes . In addition, the field-induced length changes were measured at various fixed temperatures in magnetic fields up to 15 T and the longitudinal magnetostriction coefficient was derived.
III Experimental results
III.1 Static magnetic susceptibility
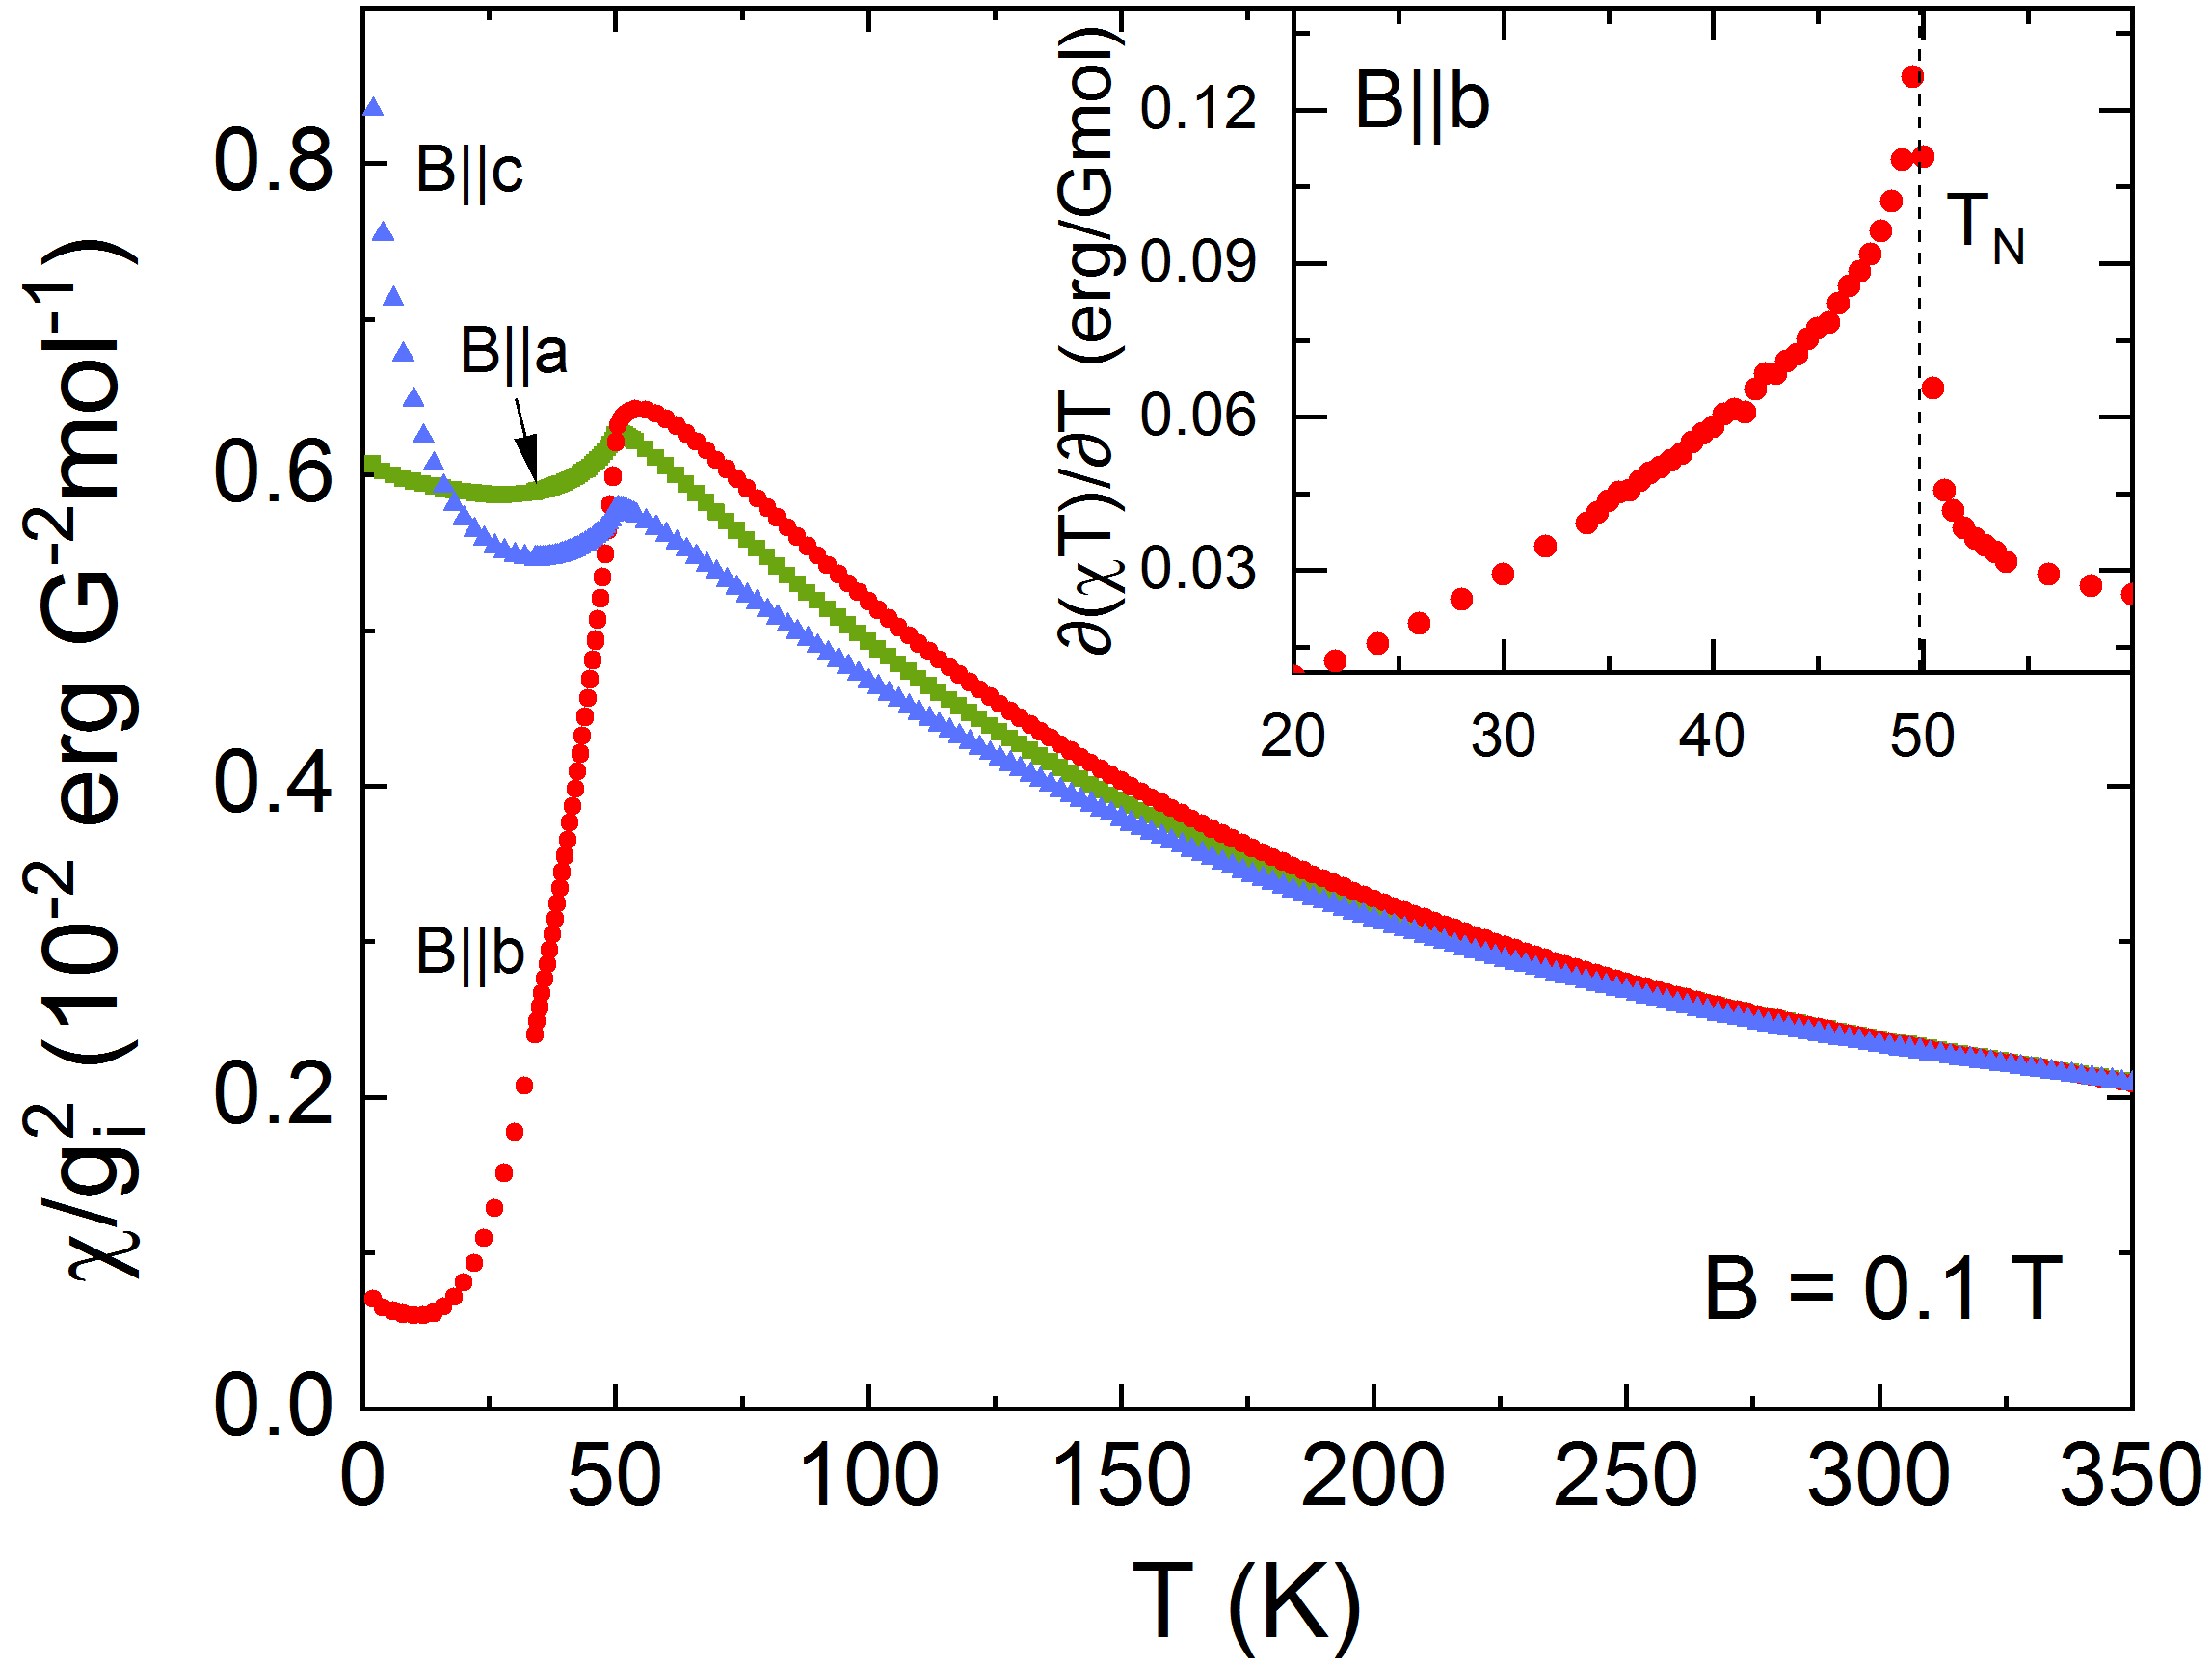
The onset of long-range antiferromagnetic order in LiFePO4 at = 50.0(5) K is associated with pronounced anomalies in the magnetic susceptibility and in the thermal expansion (Figs. 1 and 2). The magnetic susceptibility implies that the crystallographic -axis is the easy magnetic axis in agreement with previous studies. Santoro and Newnham (1967); Rousse et al. (2003) At high temperatures, the magnetic susceptibility obeys Curie-Weiss behaviour and the differences in magnetisation along the crystallographic axes can be associated to the anisotropy of the -tensor. The data have hence been corrected by respective values of the -factors, , which have been obtained by fitting the volume susceptibility by means of a Curie-Weiss-law and obtaining best overlap of at high temperatures. This procedure yields , and . However, the data imply anisotropy below 250 K which is not associated with the -tensor, as visualized by Fig. 1. 111Correlation effects may extend to even higher temperatures which would affect the obtained -values. Independent of that, magnetic anisotropy beyond the -tensor extends to at least 250 K. We also note a Curie-like upturn at low temperatures which is particularly pronounced for -axis, thereby indicating the presence of anisotropic quasi-free magnetic moments (cf. also Fig. 4a).
III.2 Thermal expansion
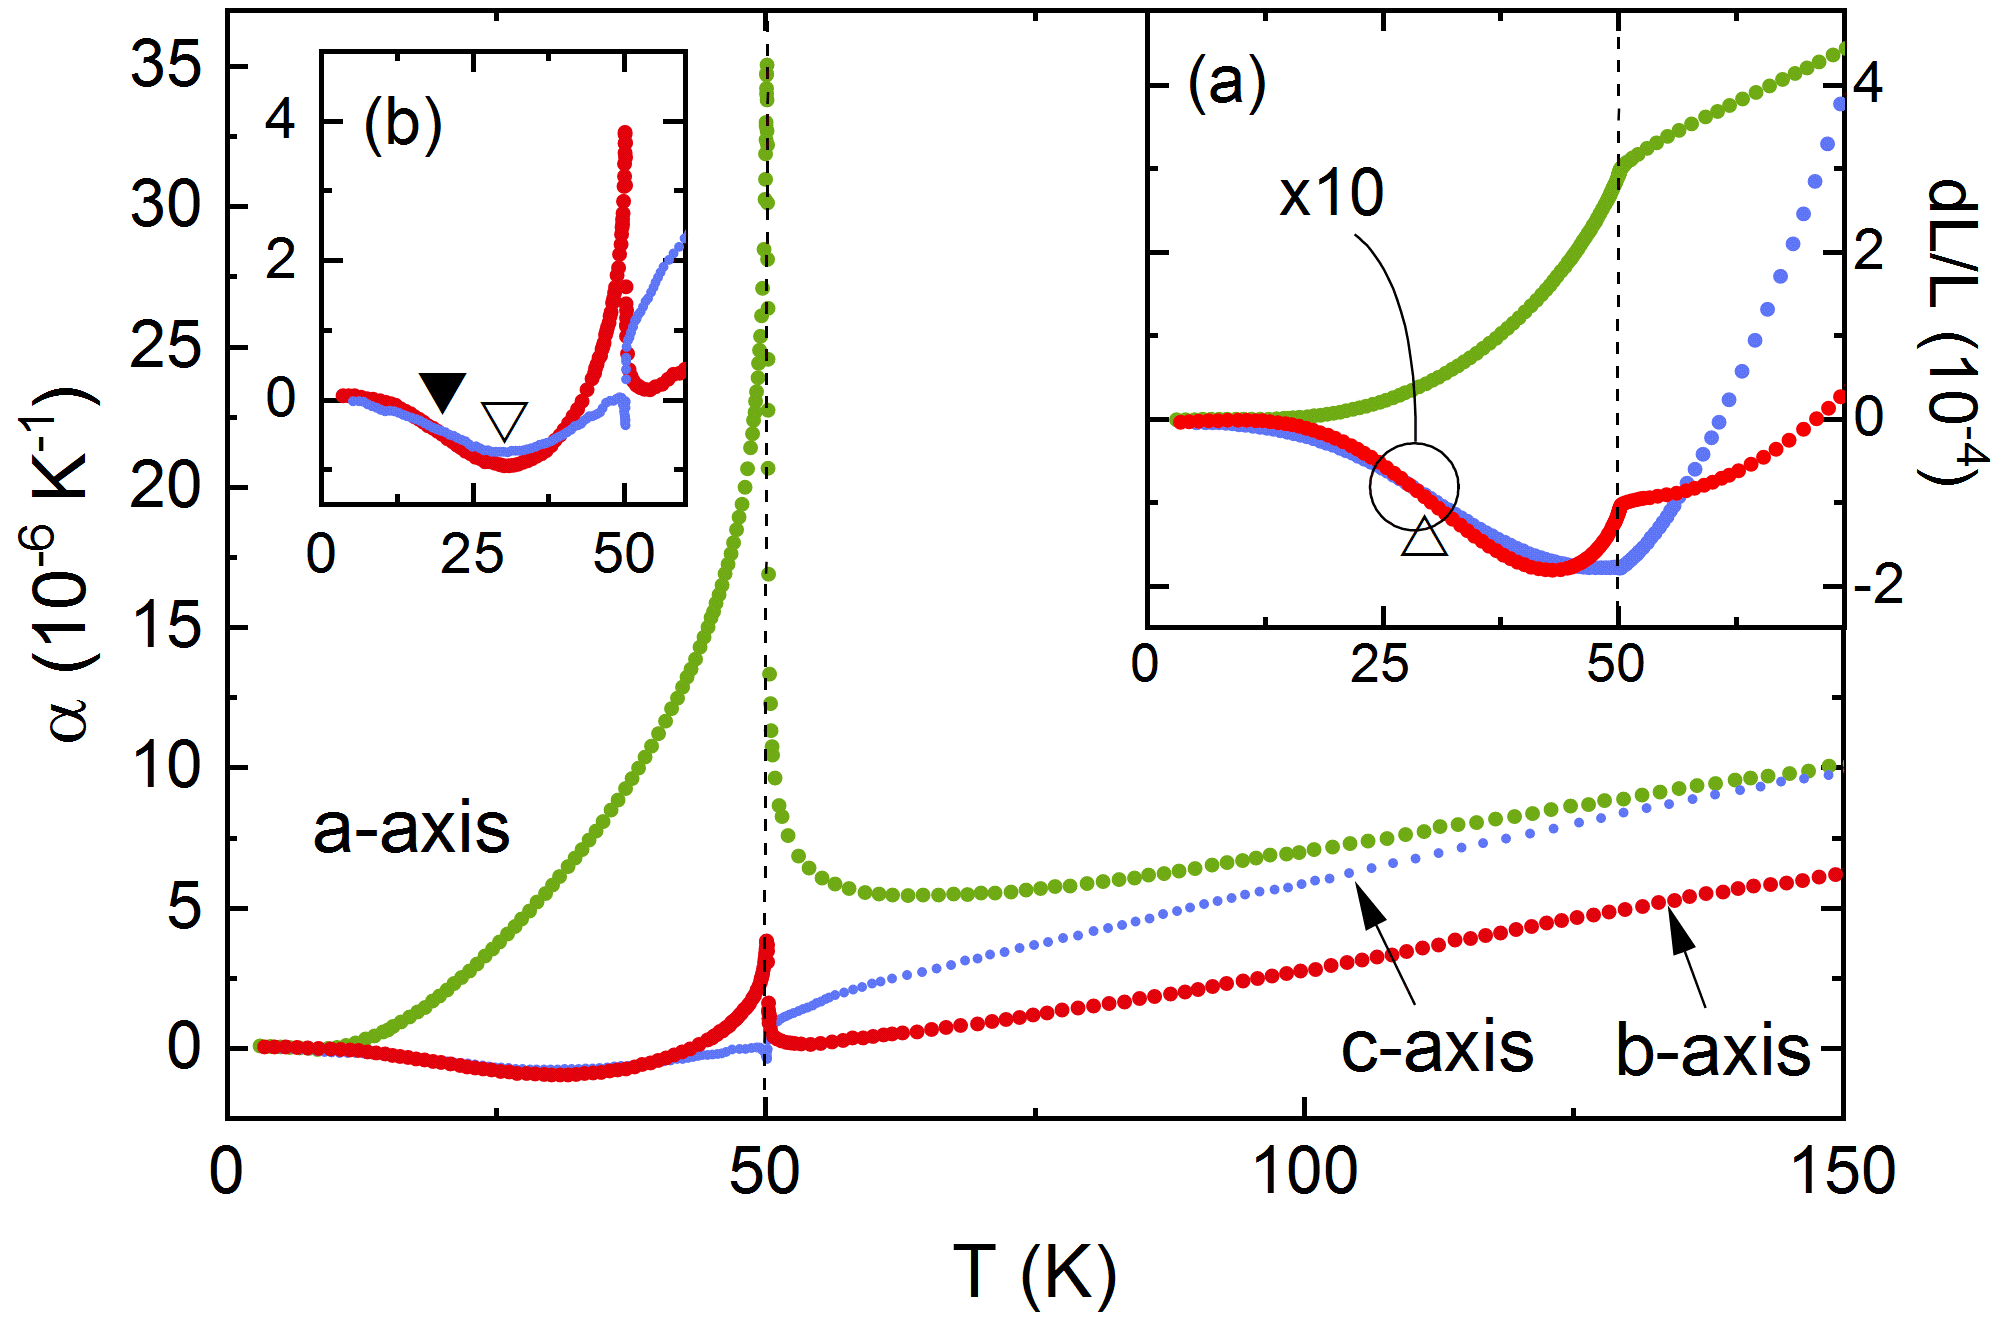
The evolution of long-range magnetic order at is confirmed by sharp anomalies of the uniaxial thermal expansion coefficients () (Fig. 2). The -shaped anomalies confirm the continuous nature of the phase transition. The measured length changes shown in Fig. 2a signal shrinking of the - and -axis upon evolution of long-range magnetic order at while there is a slight increase of the -axis. The anomalies confirm significant magneto-elastic coupling in LiFePO4. The signs of the anomalies show positive uniaxial pressure dependence of for pressure along the - and -axis, i.e., for . On the other hand, there is only a tiny anomaly in indicating being negative and small. also shows significant positive hydrostatic pressure dependence as shown by a very large anomaly of the volume thermal expansion coefficient (see the inset of Fig. 7).
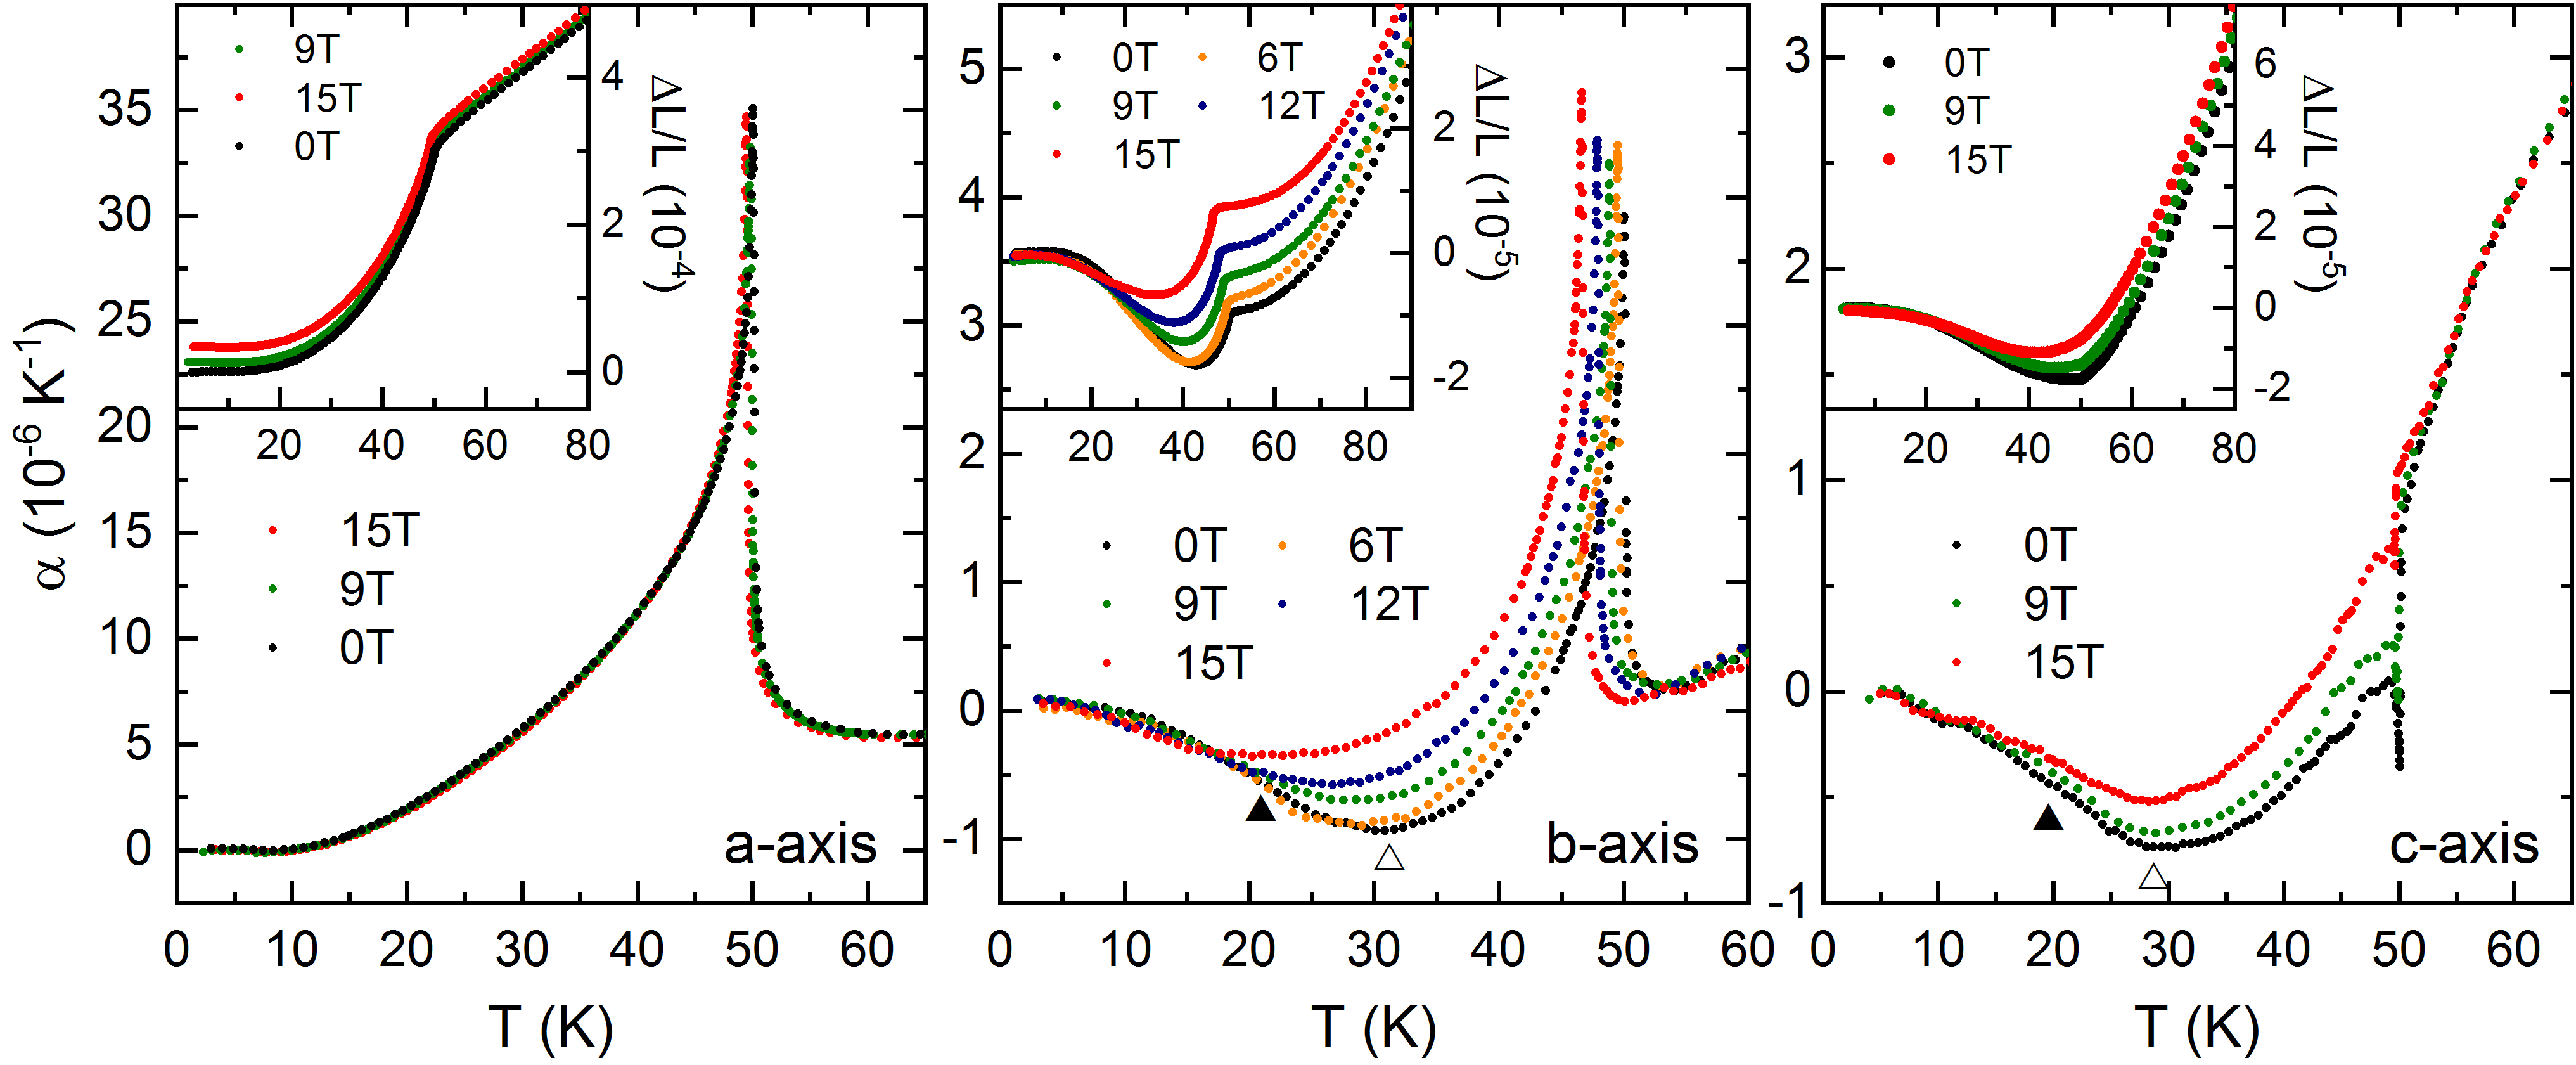
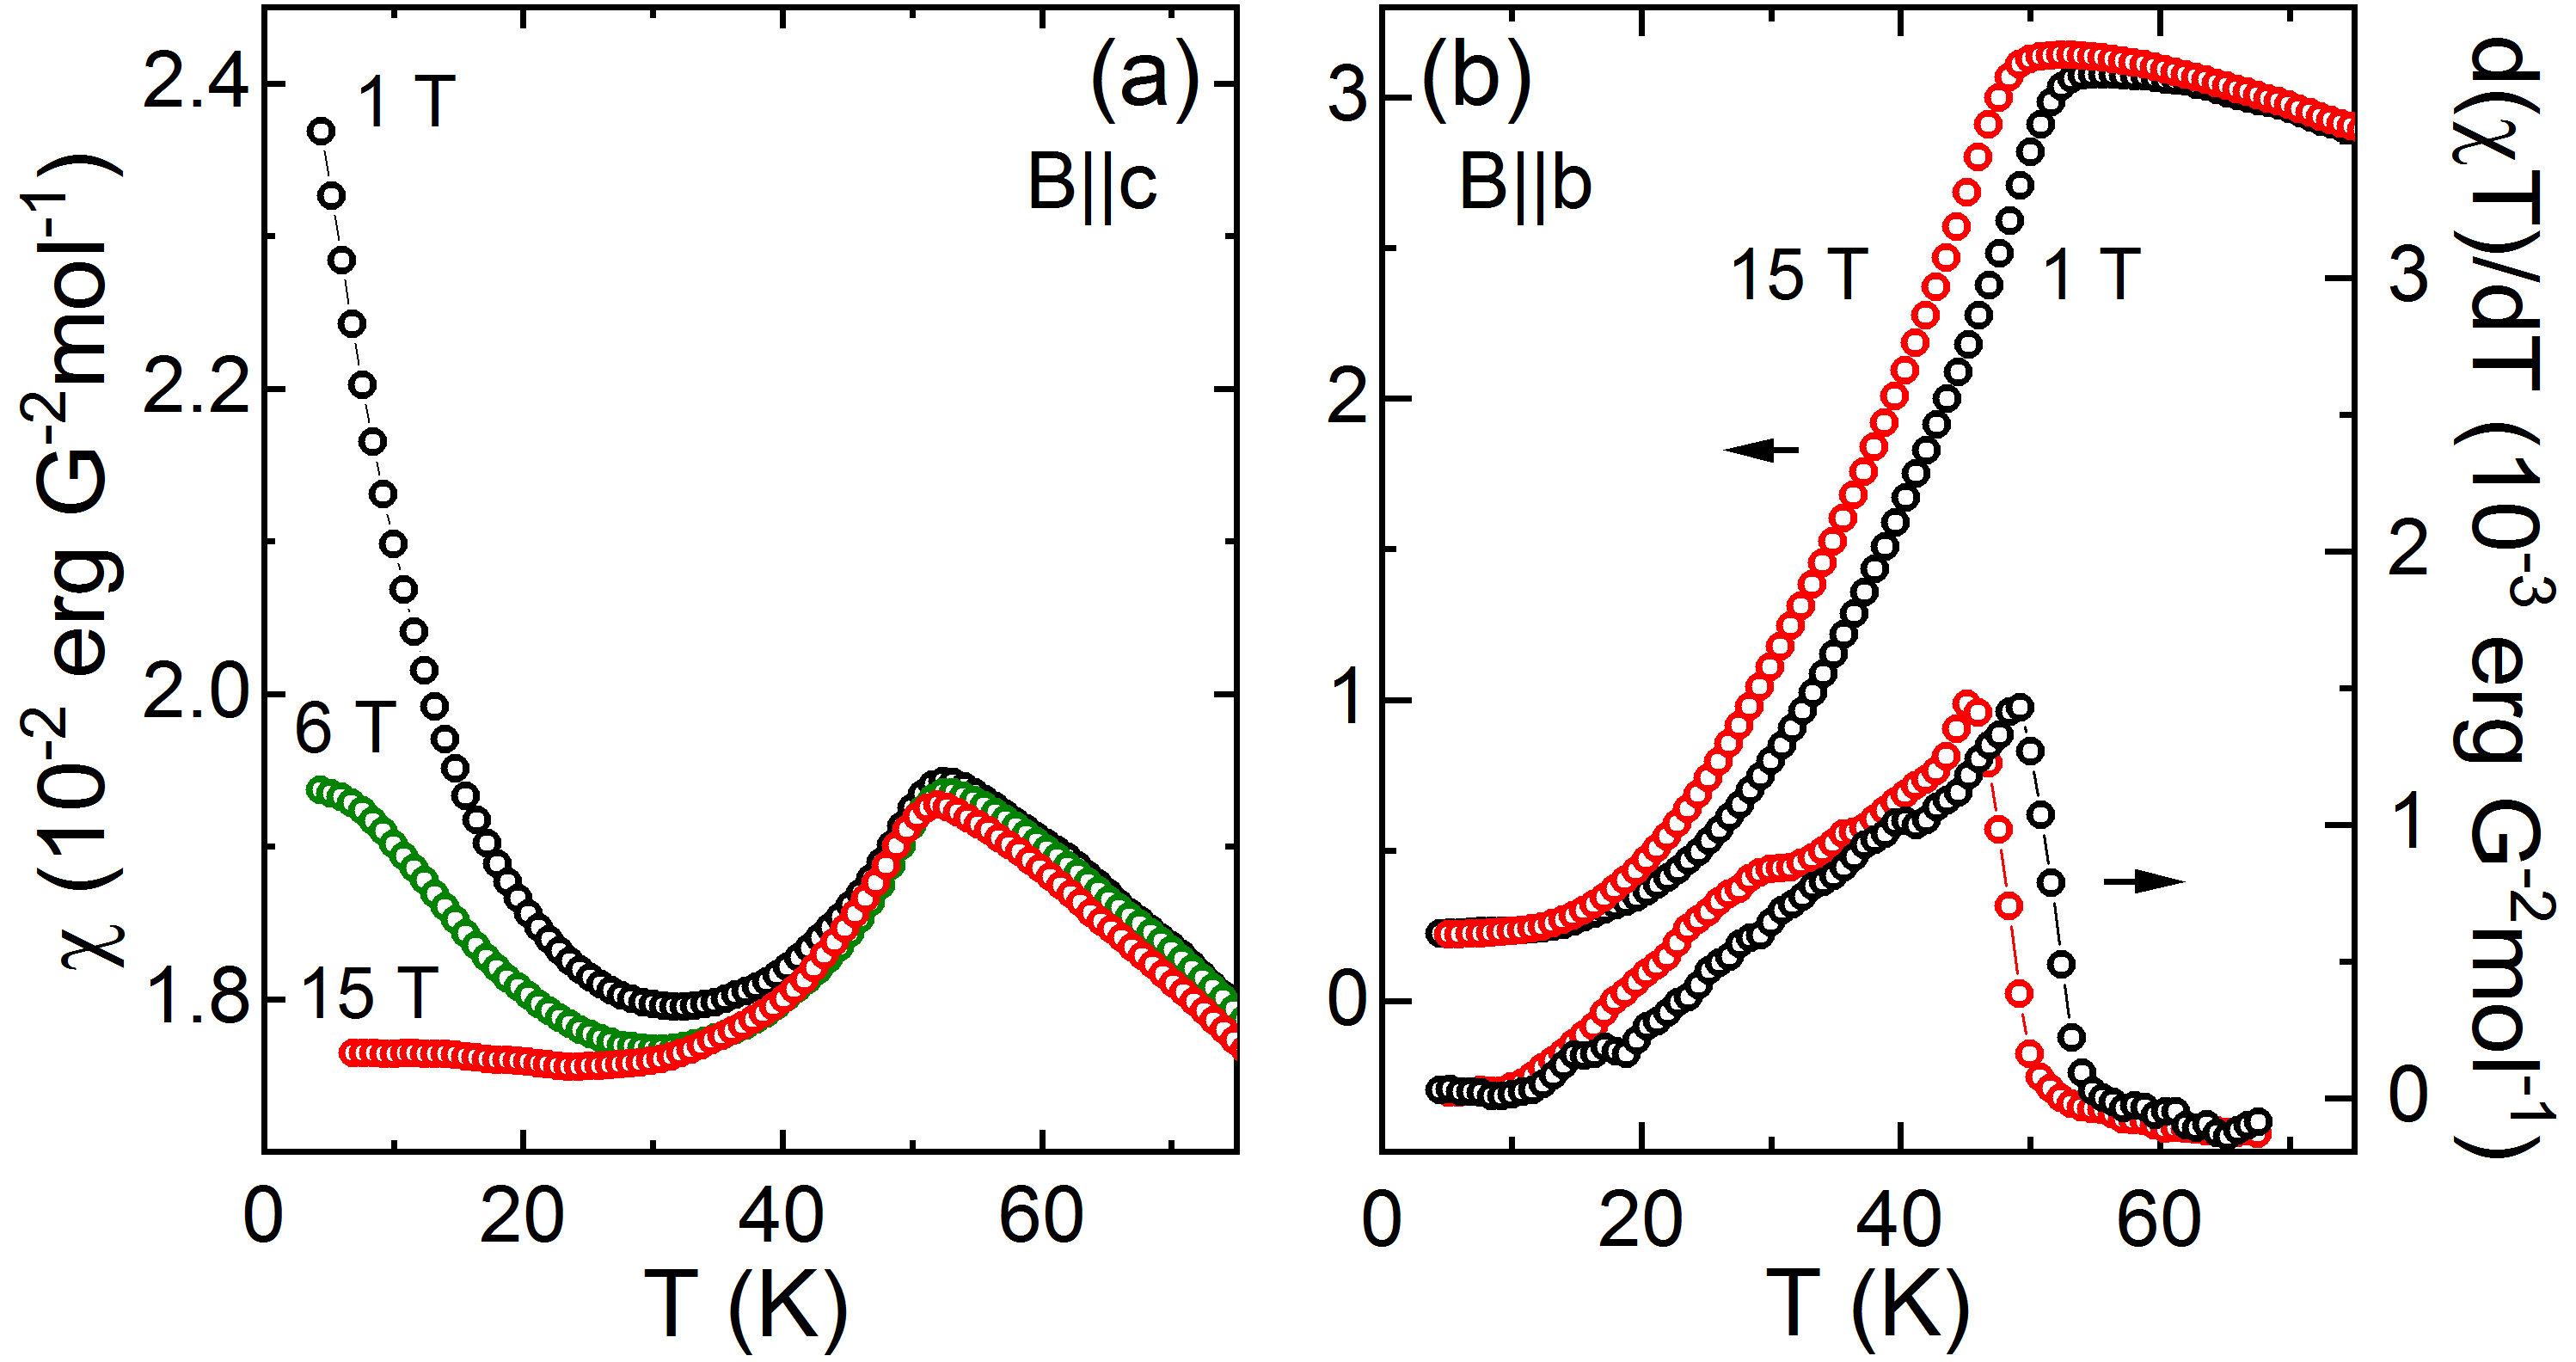
Application of external magnetic fields suppresses the long-range antiferromagnetically ordered phase, as visible by the effects of T applied along the - and -axis on the magnetic susceptibility shown in Fig. 4. Sharp anomalies of the thermal expansion coefficients studied in various magnetic fields applied along the three crystallographic axes (Fig. 3) enable detailed determination of the phase boundaries. These measurements are backed-up by magnetostriction data at various temperatures (see Fig. S2 of the supplement). While for - and -axis, neither nor the shape of the anomalies in are significantly affected by magnetic fields up to 15 T, there is a more sizeable effect for . Specifically, is shifted at T by K (see Fig. 3b) while the shape of the anomalies in is only very weakly affected. This observation corresponds to the effect of T on Fisher’s specific heat Fisher (1962) presented in Fig. 4b.
Notably, at T, the thermal expansion coefficients and exhibit an additional feature in the ordered phase, i.e., at . As illustrated in Fig. 2a, the length changes towards lowest temperatures undergo a minimum at approximately 43 K followed by a broad step-like increase. Correspondingly, there is a minimum in (, open triangles in Fig. 2) followed by a step-like feature (, filled triangles). Note that a similar feature may be present in but masked by the large anomaly at . Qualitatively, the data in Fig. 3b and c imply suppression of the associated phenomenon in applied magnetic fields, as indicated by reduction of the characteristic temperatures and as well as of the minimum- and step-size. For a quantitative estimate of the field effect, in addition to the temperature of the minimum we extract a characteristic temperature at the inflection point of which shifts from K to about 11 K at T.
III.3 Magnetisation
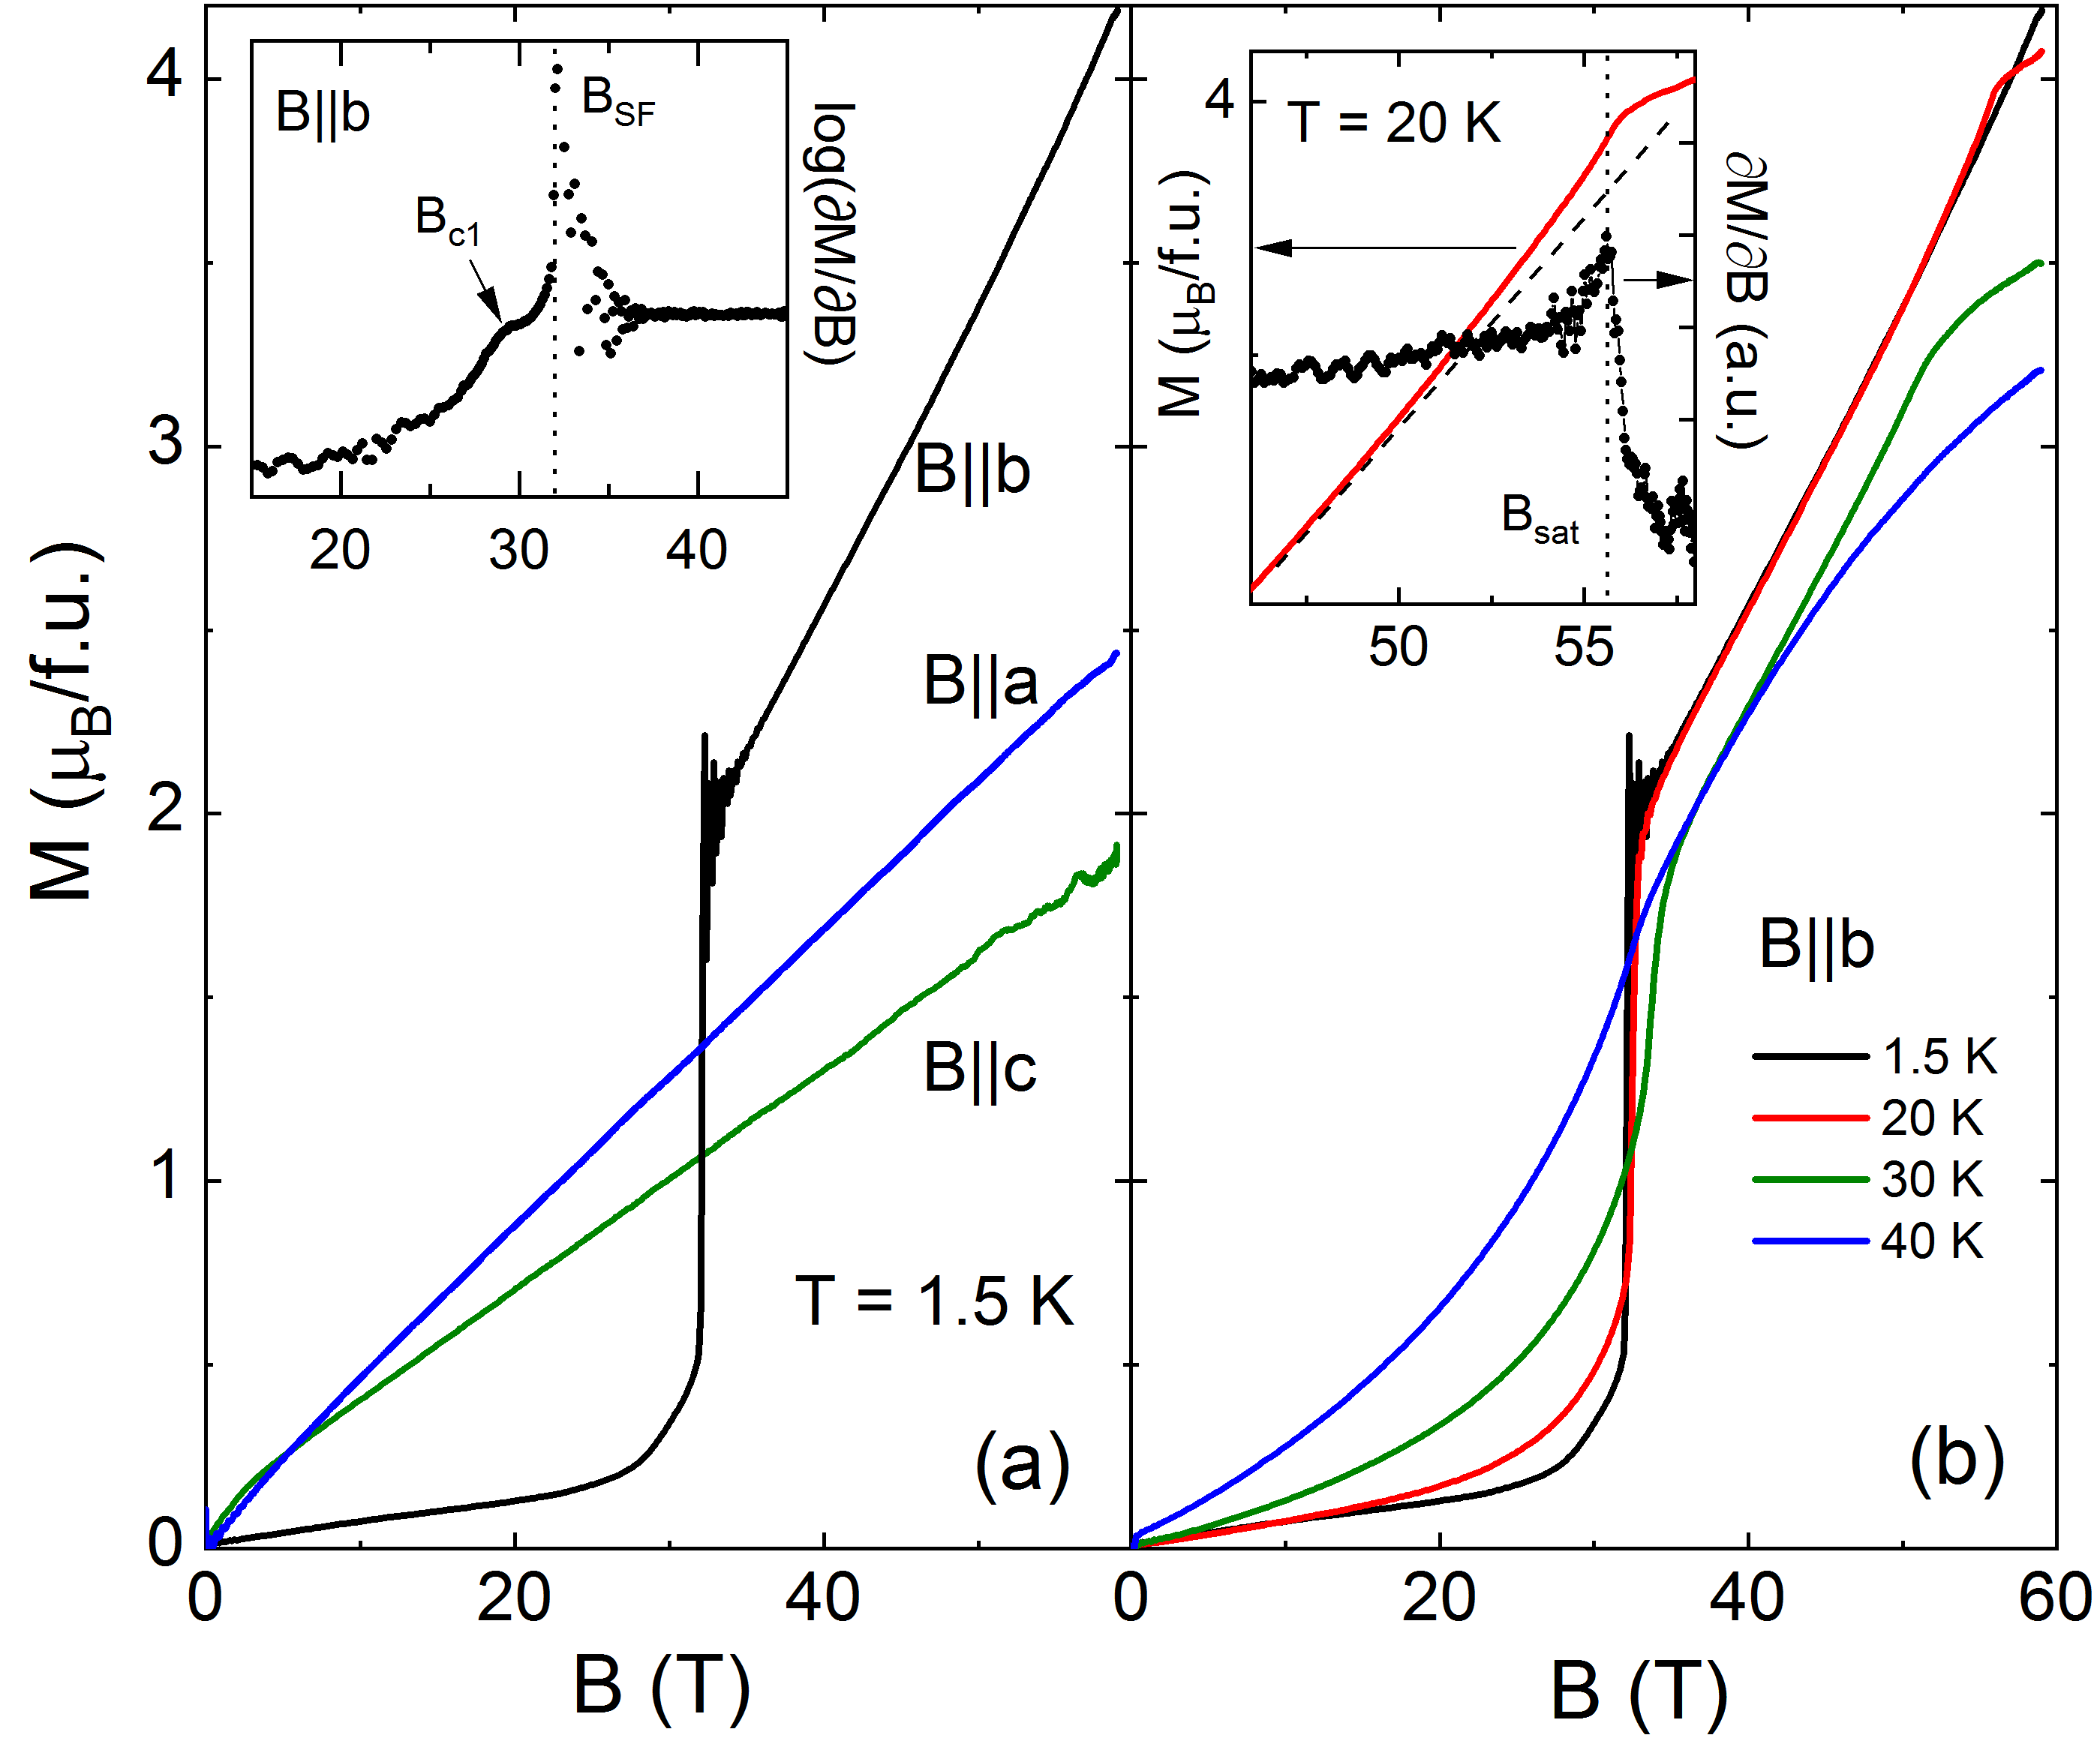
The magnetisation vs. at K along the three crystallographic axes is shown in Fig. 5. At K, there is a jump-like increase of () suggesting spin-reorientation at T in accord with the easy axis inferred from Fig. 1. The anomaly amounts to /f.u.. Note that in the two-sublattice model presented below, corresponds to a change of the angle between the spins from antiparallel to about 145∘. For , increases linearly, which is also observed for (). At K, none of the high-field magnetisation curves show signatures of saturation up to 58 T. At small magnetic fields, there is a right-bending of the magnetisation curves which implies the presence of quasi-free spins. Notably, this behaviour significantly depends on the magnetic field direction. It is most pronounced for , in agreement with the Curie-like contribution to () which is largest for this field direction (cf. Fig. 1). Quantitatively, fitting the magnetisation curves by a Brillouin function plus a linear term describes the data for very well. The data indicate /f.u. for the response associated with quasi-free (qf) spins. Whereas, the curvature seen in vs. suggests much larger moments or a strongly anisotropic -factor. The behaviour in vs. agrees to the effect on vs. . As shown in Fig. 4a, the Curie-like upturn at K is most pronounced for but completely suppressed at T.
The rather linear behaviour () does not extrapolate to the origin of the graph. Hence, while the transition may be attributed to spin-reorientation, it is not associated with a simple spin-flop behaviour. This is corroborated by a more detailed inspection of the anomaly, as highlighted by the susceptibility in Fig. 5. In addition to the jump at , there is a precursing broad step-like increase of towards a small plateau. The small step extends from to 29 T (the latter is labelled in the inset of Fig. 5a). All non-linear changes associated with and sum up to /f.u. While there is no visible hysteresis for neither nor , a small but sizeable difference between magnetisation in the up- and down-sweeps (data not shown) confirms the discontinuous nature of the spin-reorientation process at .
Upon heating, the anomaly at vanishes. The magnetisation jump at decreases and is smeared out while the critical field changes only very weakly (Fig. 5b). At the same time, at higher temperatures the saturation field appears to be visible in the accessible field range. At K, we find = 56(3) T which is well identified by a peak in (see the inset of Fig. 5b). In addition, there is a slight left-bending of vs. just below . However, the almost constant slope of the vs. curve evidences a predominant 3D character of magnetism, which is in accord with the size of the ordered magnetic moment observed in the ordered phase at low temperatures. Toft-Petersen et al. (2015); Nishimoto et al. (2011)
III.4 Magnetic phase diagram
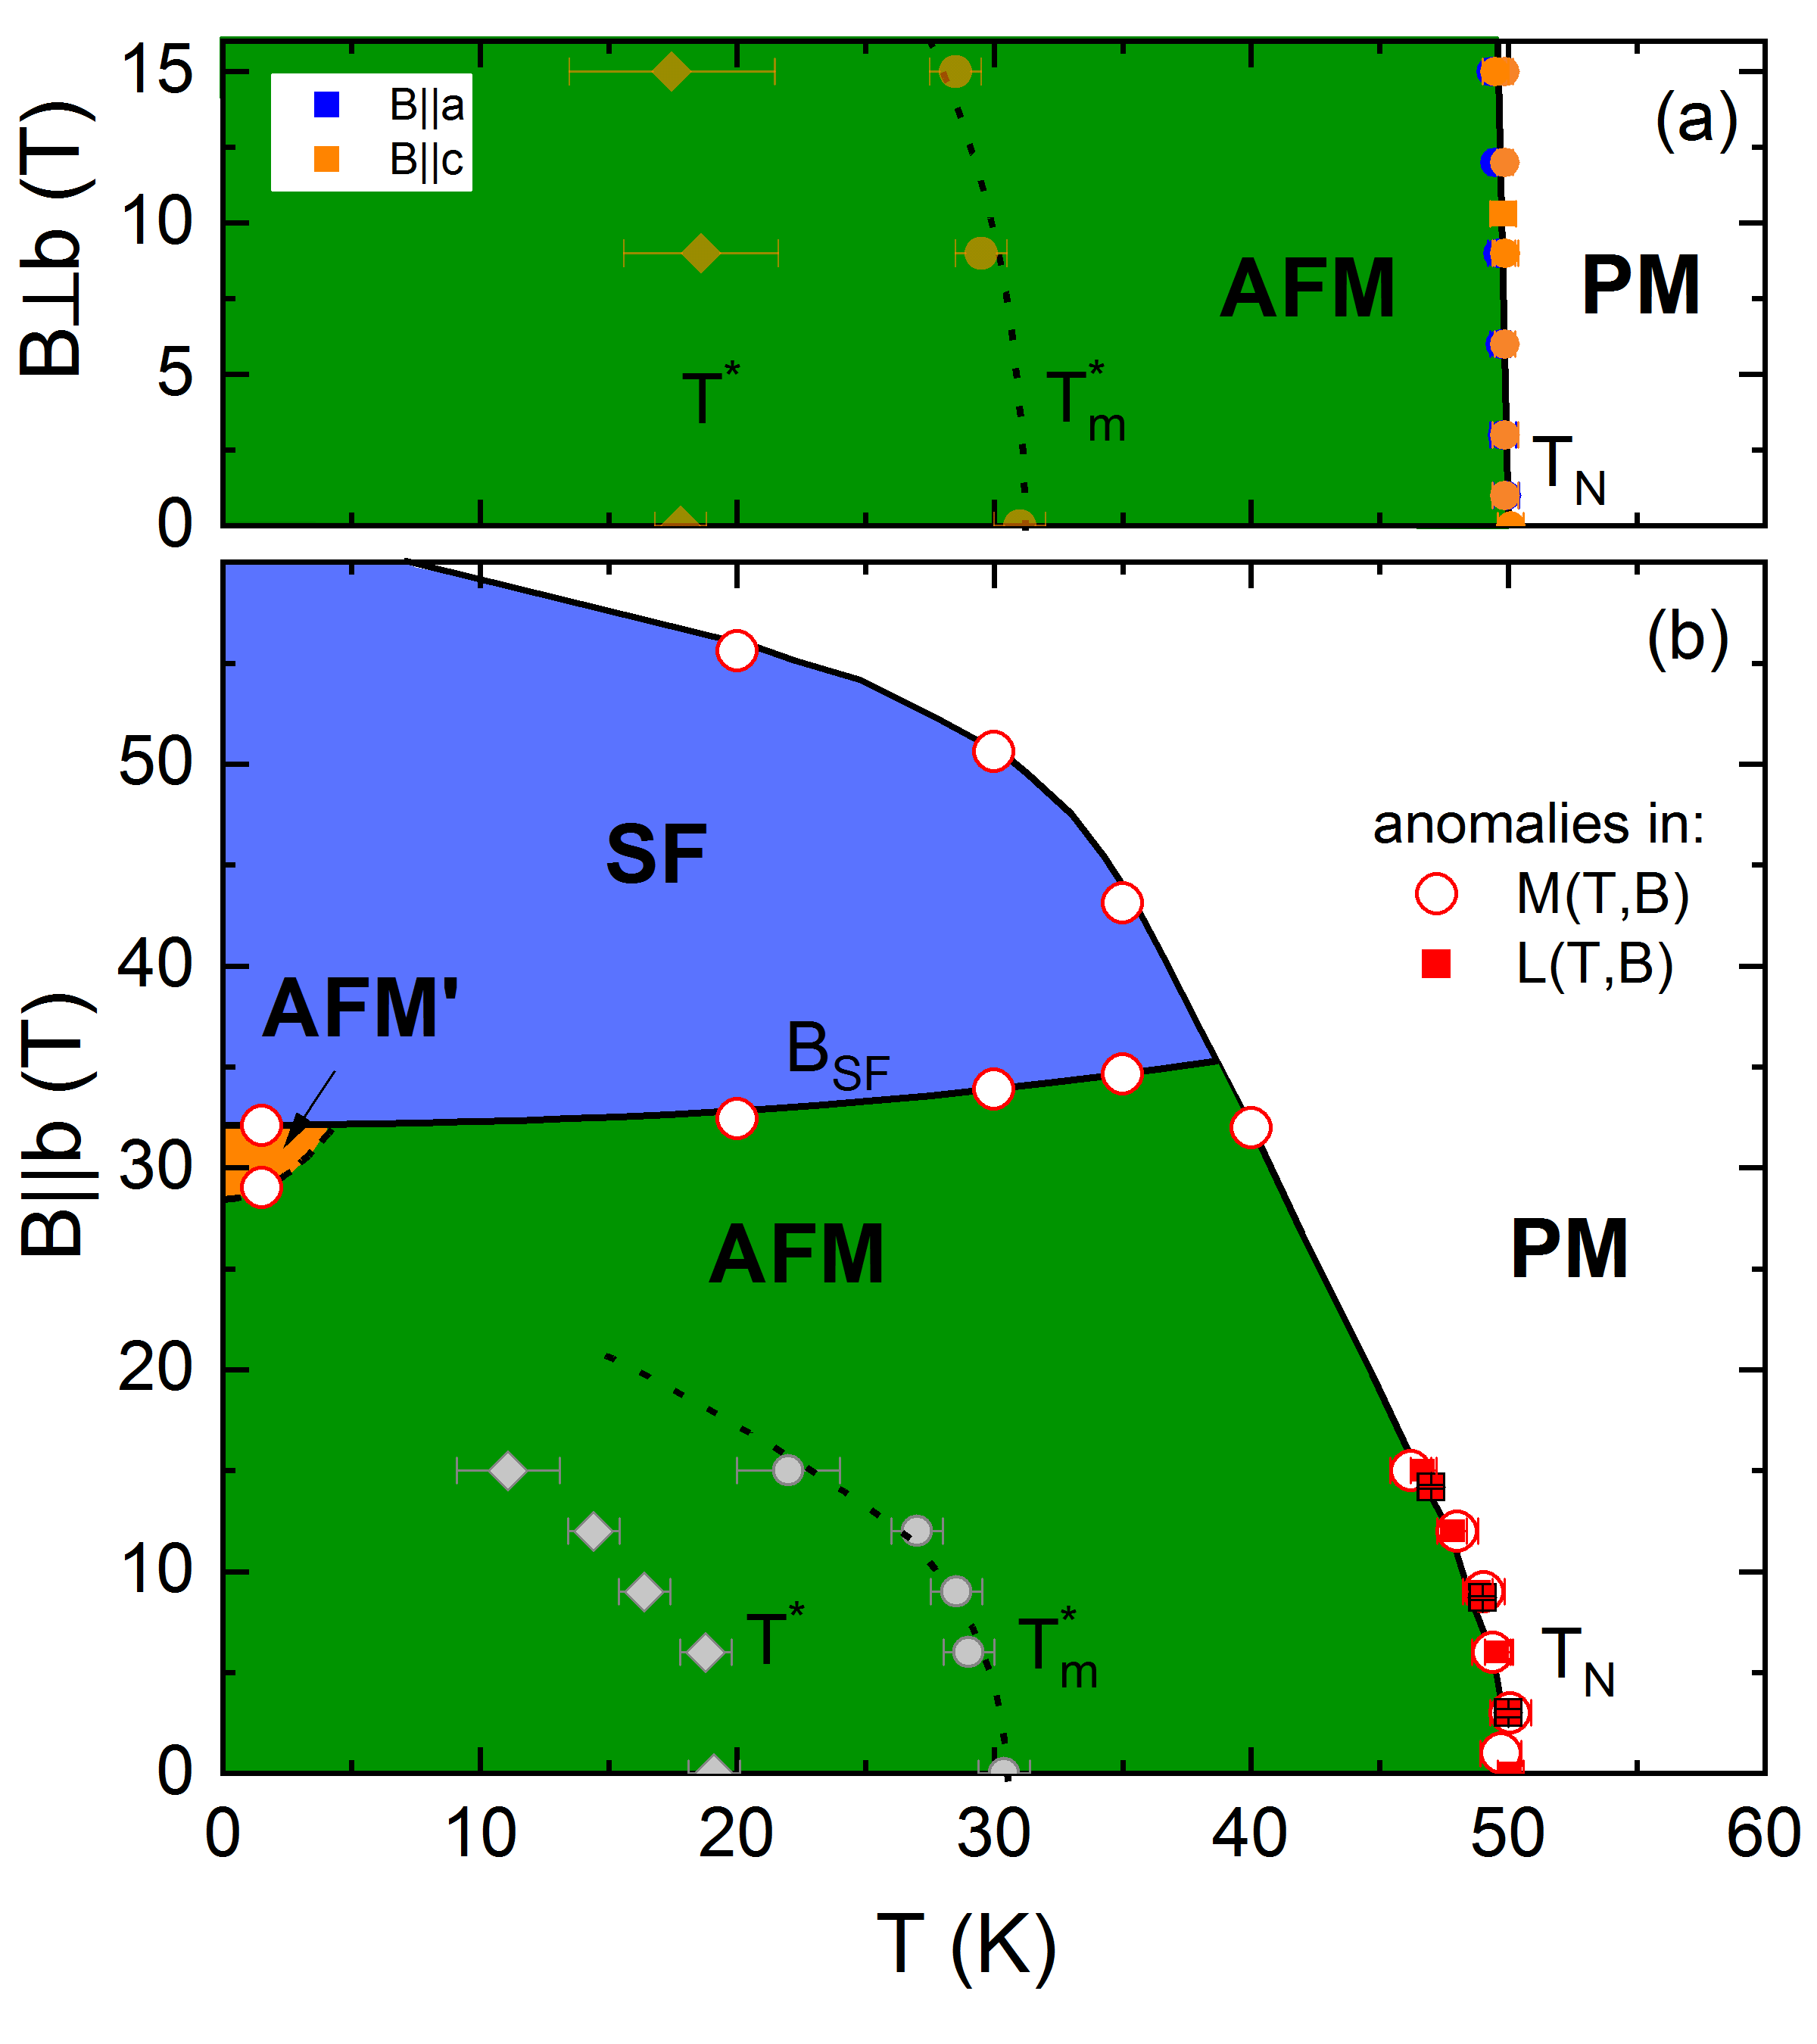
The magnetic phase diagram shown in Fig. 6 summarizes the evolution of the anomalies observed in the thermal expansion, magnetostriction, and magnetisation upon application of external magnetic fields. For , the data display the anomaly at () which is only weakly field-dependent. In particular, the phase boundaries for fields parallel to the - and -axis overlap, and magnetisation, specific heat and thermal expansion measurements show K/T.
For -axis, a much more pronounced field effect is observed. For small , i.e., in the vicinity of , K/T is revealed. Extrapolating the phase boundary () to low temperatures suggests () = 64(2) T. In addition, at (=1.5 K) T, a spin-reoriented phase (SF) evolves. is almost temperature-independent. A rough estimate by means of a Clausius-Clapeyron relation J/(mol K) implies only insignificant entropy changes associated with this transition. Stockert et al. (2012) At K, there is a precursing anomaly in () indicating the presence of a competing antiferromagnetic phase AFM’ evolving at = 29 T. Finally, the phase diagram in Fig. 6 presents characteristic temperatures/fields associated with the above-discussed feature in the thermal expansion coefficient which signals a structure-dielectric coupling. Fig. 6 displays the characteristic temperatures and of the step-like behaviour and the minimum in , respectively.
IV Discussion
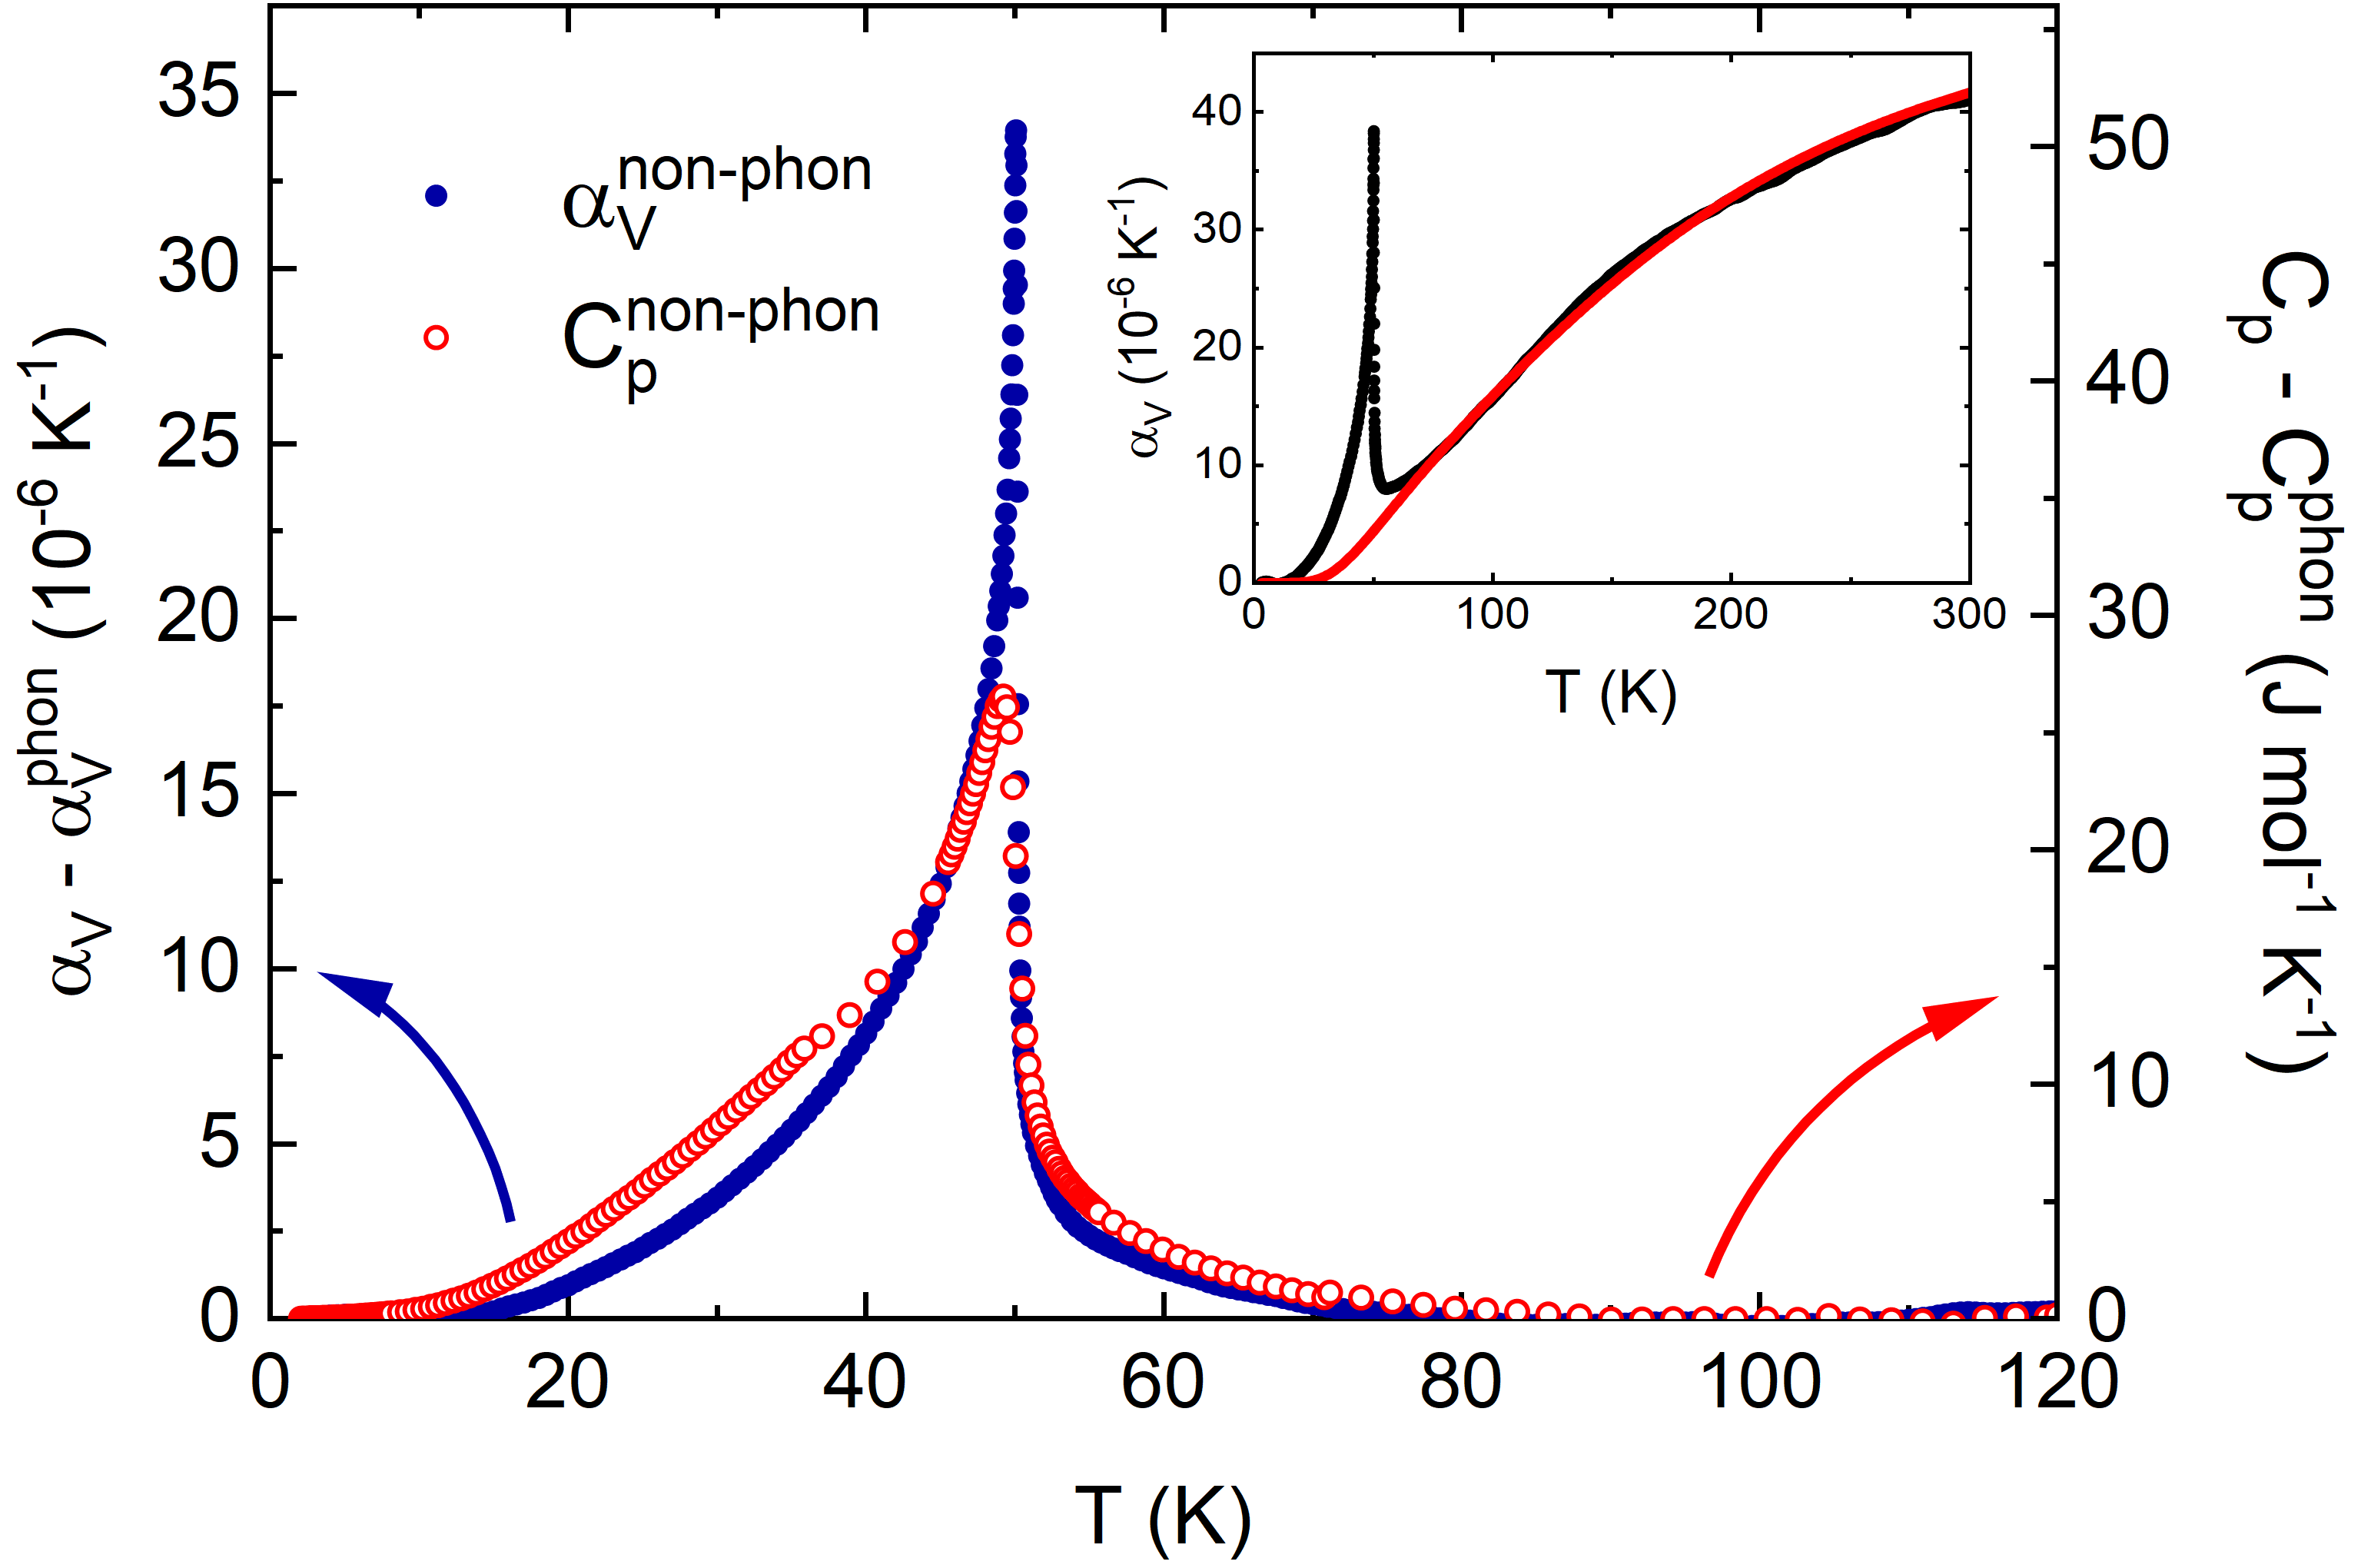
Comparing the non-phononic contributions to the specific heat and to the thermal expansion coefficient enables further conclusions on the nature of the associated ordering phenomena. In order to clarify the presence of one or more relevant energy scales, the volume thermal expansion coefficient (Fig. 7 inset), as derived by adding the uniaxial coefficients , is to be compared with the respective entropy changes, as measured by the specific heat. For this comparison we use specific heat data by Loos et al. Loos et al. (2015) obtained on polycrystalline LiFePO4. To be specific, for a comprehensive Grüneisen analysis, the lattice contributions of both and have to be separated. Extending the analysis of lattice contributions to in Ref. Loos et al., 2015, and are simultaneously fitted at temperatures well above the magnetic anomalies by means of a combined model consisting of a sum of Debye and Einstein terms:
| (1) | ||||||
| (2) |
Debye- and Einstein-function depend on their characteristic temperatures and , respectively. and denote the number of modes associated with each contribution such that their sum yields the number of atoms in the unit cell. The use of two Grüneisen parameters and accounts for different Grüneisen scalings for the individual summands and is necessary, as the contributions cannot be treated separately in the investigated temperature range. The fit for is depicted together with the measured data in the inset of Fig. 7. The procedure yields a good description of the high temperature behaviour with mol-1, mol-1, K, K. These values are consistent with the previous analysis of the specific heat data Loos et al. (2015). The Grüneisen parameters amount to mol/J and mol/J. Due to the fact that the present analysis employs a concomitant fit of both the length and entropy changes, it may be valuable to report the resulting entropy changes J/(mol K) obtained by integrating the data by Loos et al. corrected by the hereby obtained phononic background. This value is larger than in Ref. Loos et al., 2015 and closer to the theoretically expected value of 13.38 J/(mol K).
Comparison of the non-phononic parts of and , i.e., the respective differences of the measured data to the phononic fits, enables investigating the Grüneisen ratio of the associated length and entropy changes. Accordingly, the (magnetic) thermal expansion coefficient and the specific heat are shown in the main of Fig. 7. Firstly, the data imply that the above mentioned procedure yields reliable results as there is a large temperature regime where and are proportional to each other. The experimental data and their analysis hence clearly show that the entropy and length changes in this temperature regime are driven by one degree of freedom. It is tempting to attribute this mainly to the spin degrees of freedom, i.e., the entropy changes are of magnetic nature which is supported by the fact that the extracted non-phononic entropy changes nearly agree to the expected spin entropy. To be specific, while there is no magnetic contribution to and above K, the two quantities match well down to about 40 K, including the behaviour at . Scaling yields a Grüneisen parameter of mol/J. This value is associated with the pressure dependence of being K/GPa which is deduced using the molar volume cm3. Neef et al. (2017)
Notably, however, the scaled data show a significant deviation from each other well below at temperatures between roughly 10 and 45 K, i.e., Grüneisen scaling by means of is not valid in this temperature regime. In general, failure of Grüneisen scaling implies the presence of additional relevant degrees of freedom. Here, it provides thermodynamic evidence that several dominant degrees of freedom are concomitantly relevant in the ordered phase. Phenomenologically, failure of Grüneisen scaling can be associated with the low temperature upturn in length changes of the - and -axis, respectively, upon reducing the temperature. It also agrees to the temperature regime below the peak of the magneto-electric coupling coefficient . Toft-Petersen et al. (2015) One must conclude that the low-temperature feature observed in the thermal expansion must be ascribed to one or more additional degrees of freedom not corresponding to only magnetic entropy which drives antiferromagnetic order at .
One may speculate about linking the observed failure of Grüneisen scaling to spectroscopic properties of LiFePO4. Yiu et al. Yiu et al. (2017) have detected rather dispersionless hybrid excitations which are discussed in terms of electron states arising from the crystal-field splitting and spin-orbit coupling. Employing the parameters from Ref. Yiu et al., 2017 for a Schottky-like model would imply broad humps in the specific heat and the thermal expansion coefficient which are centered around 32 K. As pressure dependence of the underlying energy scale of this phenomenon is supposed to be different from that driving long-range spin order, one must expect a different Grüneisen parameter for this expected hump. Failure of Grüneisen scaling in LiFePO4 may hence be straightforwardly associated with the reported hybrid excitations.
The measured spin-flop field at 1.5 K, and the extrapolated saturation field () = 64(2) T allow to determine the effective antiferromagnetic exchange interaction and the anisotropy difference between the easy axis (-axis) and the intermediate axis (-axis) in a two-sublattice mean-field model. It is described by
| (3) |
with the magnetic field , , the spin component in -direction and the Bohr magneton. is the effective exchange interaction between the sublattices and . Inter-sublattice exchange interactions are not considered for this analysis. The model yields meV and meV. The minus sign of signals that at T, spins align along the -axis. Extending the Hamiltonian by an additional anisotropy in -direction, i.e., similar to , enables to account for the different susceptibilities measured along the - and -axis (see Fig. 5a). Quantitatively, we obtain the plane-type anisotropy meV.
Although the Hamiltonian (Eq. 3) provides only a basic model for evaluating magnetism in LiFePO4 which neither covers the two-step nature of spin-reorientation (i.e., the presence of the intermediate phase AFM’) nor takes into account that () does not resemble a simple spin-flop scenario, the obtained anisotropy of meV is in good agreement to values obtained by inelastic neutron scattering (INS) where -0.62(2) meVLi et al. (2006) and -0.86(1) meV Yiu et al. (2017) have been reported. 222In Refs. Yiu et al., 2017; Li et al., 2006, the anisotropy tensor was chosen such that , whereas the present work uses a notation with . Therefore, cited values have been converted into the notation of the present work. Moreover, the effective exchange interaction meV deduced from the macroscopic data at hand is in a good agreement with meV Li et al. (2006) and meV Yiu et al. (2017) from INS. On the other hand, meV does not agree with the INS results 0.94(4) meV Li et al. (2006) and 1.37(2) meV Yiu et al. (2017). 333Note that the actual numbers depend on the -factors used in the analyses. In the present work, -values from high-temperature Curie-Weiss fitting is used while the INS models employ .
The low-temperature upturn of static susceptibility as well as the right-bending of the magnetisation curves below T indicate the presence of anisotropic quasi-free moments. It has been shown Neef et al. (2017) for single-crystals LiMn1-xFexPO4 that the presence of such anisotropic moments evolves with increasing iron content . One may speculate that the quasi-free moments originate from Fe2+ anti-site disorder Gardiner and Islam (2009); Neef et al. (2017), whereby some Fe2+-ions reside on Li-positions due to the similar radii of the two respective ions. Anti-site disorder in the investigated crystal has been estimated to about Neef et al. (2017).
V Summary
The reported experimental studies of pulsed- and static-field magnetisation, thermal expansion, and magnetostriction of single-crystalline LiFePO4 enable constructing the magnetic phase diagram. In addition, high-resolution dilatometry is used for quantitative analysis of the pronounced magneto-elastic coupling in LiFePO4. The macroscopic data imply antiferromagnetic correlations well above , up to about 250 K. This is corroborated by observation of magnetic contributions to the thermal expansion which obey Grüneisen scaling far above . Notably, recently reported temperature dependence of the magneto-electric coupling coefficient [Toft-Petersen et al., 2015] is linked to the failure of Grüneisen scaling. Our data hence provide direct thermodynamic experimental evidence for the essential role of structure changes for magneto-electric coupling in LiFePO4. Upon application of magnetic fields, associated features are suppressed. In addition, for -axis and K, a pronounced jump in the magnetisation implies spin-reorientation at T as well as a precursing competing phase at 29 T. In a two-sublattice mean-field model, the saturation field T and the spin-flop field enable the determination of the effective antiferromagnetic exchange interaction meV as well as the anisotropies meV and meV.
Acknowledgements.
The project is supported by Deutsche Forschungsgemeinschaft (DFG) through KL 1824/13-1. We acknowledge the support of the HLD at HZDR, member of the European Magnetic Field Laboratory (EMFL). JW acknowledges support from the HGSFP and IMPRS-QD. SS acknowledges support by DFG through KL 1824/6.References
- Toft-Petersen et al. (2015) R. Toft-Petersen, M. Reehuis, T. B. Jensen, N. H. Andersen, J. Li, M. D. Le, M. Laver, C. Niedermayer, B. Klemke, K. Lefmann, et al., Physical Review B 92, 024404 (2015).
- Yiu et al. (2017) Y. Yiu, M. D. Le, R. Toft-Petersen, G. Ehlers, R. J. McQueeney, and D. Vaknin, Physical Review B 95, 104409 (2017).
- Padhi et al. (1997) A. K. Padhi, K. S. Nanjundaswamy, and J. B. Goodenough, Journal of the electrochemical society 144, 1188 (1997).
- Chung et al. (2011) S.-Y. Chung, J. T. Bloking, and Y.-M. Chiang, in Materials For Sustainable Energy: A Collection of Peer-Reviewed Research and Review Articles from Nature Publishing Group (World Scientific, 2011), pp. 205–210.
- Park et al. (2010) M. Park, X. Zhang, M. Chung, G. B. Less, and A. M. Sastry, Journal of Power Sources 195, 7904 (2010).
- Van Aken et al. (2007) B. B. Van Aken, J.-P. Rivera, H. Schmid, and M. Fiebig, Nature 449, 702 (2007).
- Van Aken et al. (2008) B. B. Van Aken, J.-P. Rivera, H. Schmid, and M. Fiebig, Physical Review Letters 101, 157202 (2008).
- Zimmermann et al. (2009) A. S. Zimmermann, B. B. Van Aken, H. Schmid, J.-P. Rivera, J. Li, D. Vaknin, and M. Fiebig, The European Physical Journal B 71, 355 (2009).
- Vaknin et al. (2004a) D. Vaknin, J. L. Zarestky, J.-P. Rivera, and H. Schmid, Physical Review Letters 92, 207201 (2004a).
- Rivera (1994) J.-P. Rivera, Ferroelectrics 161, 147 (1994).
- Vaknin et al. (2004b) D. Vaknin, J. L. Zarestky, J.-P. Rivera, and H. Schmid, Physical Review Letters 92, 207201 (2004b).
- Jensen et al. (2009) T. B. S. Jensen, N. B. Christensen, M. Kenzelmann, H. Rønnow, C. Niedermayer, N. H. Andersen, K. Lefmann, M. Jiménez-Ruiz, F. Demmel, J. Li, et al., Physical Review B 79, 092413 (2009).
- Baek et al. (2014) S.-H. Baek, R. Klingeler, C. Neef, C. Koo, B. Büchner, and H.-J. Grafe, Physical Review B 89, 134424 (2014).
- Rudisch et al. (2013) C. Rudisch, H.-J. Grafe, J. Geck, S. Partzsch, M. v. Zimmermann, N. Wizent, R. Klingeler, and B. Büchner, Physical Review B 88, 054303 (2013).
- Fogh et al. (2017) E. Fogh, R. Toft-Petersen, E. Ressouche, C. Niedermayer, S. L. Holm, M. Bartkowiak, O. Prokhnenko, S. Sloth, F. W. Isaksen, D. Vaknin, et al., Physical Review B 96, 104420 (2017).
- Toft-Petersen et al. (2012) R. Toft-Petersen, N. H. Andersen, H. Li, J. Li, W. Tian, S. L. Bud’ko, T. B. Jensen, C. Niedermayer, M. Laver, O. Zaharko, et al., Physical Review B 85, 224415 (2012).
- Toft-Petersen et al. (2011) R. Toft-Petersen, J. Jensen, T. B. S. Jensen, N. H. Andersen, N. B. Christensen, C. Niedermayer, M. Kenzelmann, M. Skoulatos, M. D. Le, K. Lefmann, et al., Physical Review B 84, 054408 (2011).
- Santoro and Newnham (1967) R. Santoro and R. Newnham, Acta Crystallographica 22, 344 (1967).
- Rousse et al. (2003) G. Rousse, J. Rodriguez-Carvajal, S. Patoux, and C. Masquelier, Chemistry of materials 15, 4082 (2003).
- Li et al. (2006) J. Li, V. O. Garlea, J. L. Zarestky, and D. Vaknin, Physical Review B 73, 024410 (2006).
- Scaramucci et al. (2012) A. Scaramucci, E. Bousquet, M. Fechner, M. Mostovoy, and N. A. Spaldin, Physical Review Letters 109, 197203 (2012).
- Neef et al. (2017) C. Neef, H. Wadepohl, H.-P. Meyer, and R. Klingeler, Journal of Crystal Growth 462, 50 (2017).
- Klingeler et al. (2006) R. Klingeler, B. Büchner, K.-Y. Choi, V. Kataev, U. Ammerahl, A. Revcolevschi, and J. Schnack, Physical Review B 73, 014426 (2006).
- Skourski et al. (2011) Y. Skourski, M. D. Kuz’min, K. P. Skokov, A. V. Andreev, and J. Wosnitza, Phys. Rev. B 83, 214420 (2011).
- Werner et al. (2017) J. Werner, W. Hergett, M. Gertig, J. Park, C. Koo, and R. Klingeler, Physical Review B 95, 214414 (2017).
- Fisher (1962) M. E. Fisher, Philosophical Magazine 7, 1731 (1962).
- Nishimoto et al. (2011) S. Nishimoto, S.-L. Drechsler, R. Kuzian, J. van den Brink, J. Richter, W. Lorenz, Y. Skourski, R. Klingeler, and B. Büchner, Physical Review Letters 107, 097201 (2011).
- Stockert et al. (2012) U. Stockert, N. Leps, L. Wang, G. Behr, S. Wurmehl, B. Büchner, and R. Klingeler, Physical Review B 86, 144407 (2012).
- Loos et al. (2015) S. Loos, D. Gruner, M. Abdel-Hafiez, J. Seidel, R. Hüttl, A. U. Wolter, K. Bohmhammel, and F. Mertens, The Journal of Chemical Thermodynamics 85, 77 (2015).
- Gardiner and Islam (2009) G. R. Gardiner and M. S. Islam, Chemistry of Materials 22, 1242 (2009).