Structural, electronic, and dynamical properties
of the tetragonal and collapsed tetragonal phases of KFe2As2
Abstract
Compounds with a tetragonal ThCr2Si2-type structure are characterized by the possibility of the isostructural phase transition from the tetragonal phase to the collapsed tetragonal phase induced by the external pressure. An example of a compound with such a phase transition is KFe2As2, which belongs to the family of the iron-based superconductors. In this paper, we investigate the effects of the phase transition on the structural, electronic, and dynamical properties of this compound. Performing the ab initio calculations, we reproduce the dependence of the lattice constants on pressure and analyze the changes of the inter-atomic distances in the tetragonal and collapsed tetragonal phases. Using the tight binding model with maximally localized Wannier orbitals, we calculate and discuss the influence of pressure on the electronic band structure as well as on the shape of the Fermi surface. We found a precursor of the phase transition in the form of enhancement of overlapping between two Wannier orbitals of As atoms. In order to better understand the superconducting properties of KFe2As2, we study the orbital-projected Cooper pairs susceptibility as a function of pressure. We found a decrease of susceptibility with the increasing pressure in a good qualitative agreement with experimental observation. The structural transition also influences the phonon spectrum of KFe2As2, which exhibits pronounced changes induced by pressure. Some phonon modes related with the vibrations of Fe and As atoms show an anomalous, nonmonotonic dependence on pressure close to the phase transition.
I Introduction
A discovery of the high temperature iron-based superconductors (IBSC) in 2008 Kamihara et al. (2008) opened a period of intensive studies of these compounds Stewart (2011); Dagotto (2013); Dai (2015); Hosono et al. (2017). One of the most investigated family is AFe2As2 (or shortly A122), where A is an alkali metal or rare-earth metal. In this family, a heavily hole-doped K122, which crystallizes in the tetragonal ThCr2Si2-type structure (I4/mmm, space group 139), is particularly interesting. It is the end-member of the Ba1-xKx122 series, where the maximum K is achieved at optimal doping Rotter et al. (2008). K122 with 3.5 K Sato et al. (2009); Fukazawa et al. (2009), in contrary to the Ba122 compound, does not show any magnetic order Avci et al. (2012).
In a general case the IBSC exhibit a structural phase transition from the tetragonal phase to the orthorhombic one due to changes in temperature or chemical pressure Wang and Lee (2011). K122 crystallizes in the tetragonal phase and under external pressure exhibits a phase transition from the tetragonal (T) to the collapsed tetragonal (cT) phase, with the same symmetry but with strongly and not uniformly modified lattice parameters. The T–cT phase transition has been reported not only for the IBSC (like e.g. K122 Nakajima et al. (2015); Ying et al. (2015), Ca122 Kreyssig et al. (2008), Ba122 Uhoya et al. (2010a); Mittal et al. (2011) and Eu122 Uhoya et al. (2010b)), but also for other compounds with the ThCr2Si2-type structure (e.g. SrRh2P2 Johrendt et al. (1997), CaFe2P2 Coldea et al. (2009), EuFe2P2 Huhnt et al. (1998), SrCo2As2 Jayasekara et al. (2015) or BaCr2As2 Naumov et al. (2017)).
External pressure changes the superconducting properties of the K122 tetragonal phase. shows a non-monotonic behavior on pressure Taufour et al. (2014); Ying et al. (2015); Nakajima et al. (2015); Wang et al. (2016a, b); Tafti et al. (2013), with a minimum at 1.8 GPa Tafti et al. (2013). Around this point, shows a universal V–shape dependence in the weak pressure regime Tafti et al. (2015), what has been reported not only in the case of K122 Tafti et al. (2013), but also for Rb122 Tafti et al. (2015) and Cs122 Tafti et al. (2014). Early experimental studies at higher pressures report two different superconducting domes around the structural phase transition with the enhanced critical temperature in the collapsed tetragonal phase Nakajima et al. (2015). The band structure calculations predicted the occurrence of the Lifshitz transition and the change of gap symmetry from d-wave to -wave when entering the cT phase Guterding et al. (2015). However, more recent studies indicated a gradual suppression of superconductivity under pressure with going to zero at GPa and an absence of superconductivity in the cT phase Wang et al. (2016b).
The isostructural phase transition also influences the dynamical properties of 122 crystals. Significant changes in the atomic vibrations, mainly along the direction, have been observed in high-pressure measurements using the inelastic x-ray and neutron scattering for Ca122 Mittal et al. (2010) and the nuclear resonant inelastic scattering for Sr122 Wang et al. (2016c). One should expect similar effects in K122, however, the phonon properties of this compound have not been studied yet.
In this paper, in order to obtain a deeper insight in the structural phase transition from the T phase to the cT phase, structural, electronic, and dynamical properties of K122 under hydrostatic pressure have been studied using the density functional theory (DFT). We analyze in details changes in the electron band structure and discuss the Lifshitz transition induced by pressure. Using the tight binding model (TBM) constructed within maximally localized Wannier (MLW) functions, we study the effect of pressure on the pairing susceptibility and discuss the mechanism that leads to suppression of superconductivity in K122. Our studies can be generalized to other members of the family and help to explain the partial cT phase in a new IBSC 1144 family Iyo et al. (2016); Song et al. (2018); Borisov et al. (2018) (e.g. CaKFe4As4 Mou et al. (2016); Kaluarachchi et al. (2017), RbEuFe4As4 and CsEuFe4As4 Jackson et al. (2018)). The present paper is organized as follows. In Section II, we show and describe the influence of the external hydrostatic pressure on physical properties of the system, especially: the main structural properties (Sec. II.1), electronic properties (Sec. II.2), superconducting properties II.3, and dynamical properties (Sec. II.4). Finally, we summarize the results in Section III.
II Numerical results and discussion
Main DFT calculations were performed using the projector augmented-wave method Blöchl (1994), within the generalized gradient approximation Perdew et al. (1996) to the exchange-correlation functional, implemented in the VASP program Kresse and Furthmüller (1996a, b). The method of Methfessel-Paxton broadening technique Methfessel and Paxton (1989) with eV width of smearing was adopted to describe the partial occupancies for each wave function. A -mesh of points in the Monkhorst-Pack scheme Monkhorst and Pack (1976) was used for integration in the reciprocal space and the energy cut-off for plane wave expansion of eV was applied. The crystal structure was optimized using the conjugate gradient technique with the energy convergence criteria set at eV and eV for electronic and ionic iterations, respectively, in the conventional cell. During calculations, the lattice constants and as well as the position of As atoms () were optimized. The optimization procedure was repeated for various hydrostatic pressures imposed on the K122 structure. The numerical results and characterization of the optimized parameters will be shown in Sec. II.1.
Next, for the optimized structures, we present the electronic properties of the system in the normal phase, i.e., not superconducting one (Sec. II.2). Additionally, we predict properties of the K122 in the superconducting state by using the Cooper pairs susceptibility, described in details in Ref. Ptok et al. (2017). To do this, we express the Bloch states in the form of the TBM using the MLW orbitals Marzari et al. (2012). These calculations were performed by the Wannier90 program Mostofi et al. (2008, 2014). We chose d orbitals centered at Fe atoms and p orbitals centered at As atoms building the -orbitals TBM. The calculations were performed in a primitive unit cell. The TBM was also used to find the shape of the Fermi surfaces (FS) on a -grid and orbital projections.
In the last part, the phonon calculations are presented (Sec. II.4). The dynamical properties of K122 were calculated using the direct force constant approach (the Parlinski–Li–Kawazoe method) Parlinski et al. (1997) implemented in the Phonon program Parlinski (208). In these calculations, we used the supercell containing conventional cells, with simultaneous reduction of the -mesh to . The force constants were obtained from first-principle calculations of the Hellmann-Feynman forces by VASP and they were used to build a dynamical matrix of the crystal. Phonon frequencies were obtained by the diagonalization of the dynamical matrix.
II.1 Isostructural phase transition
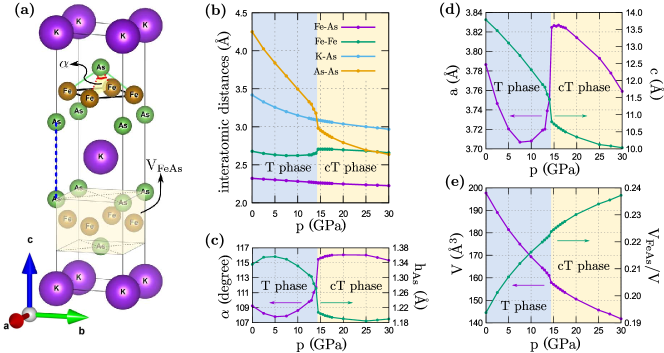
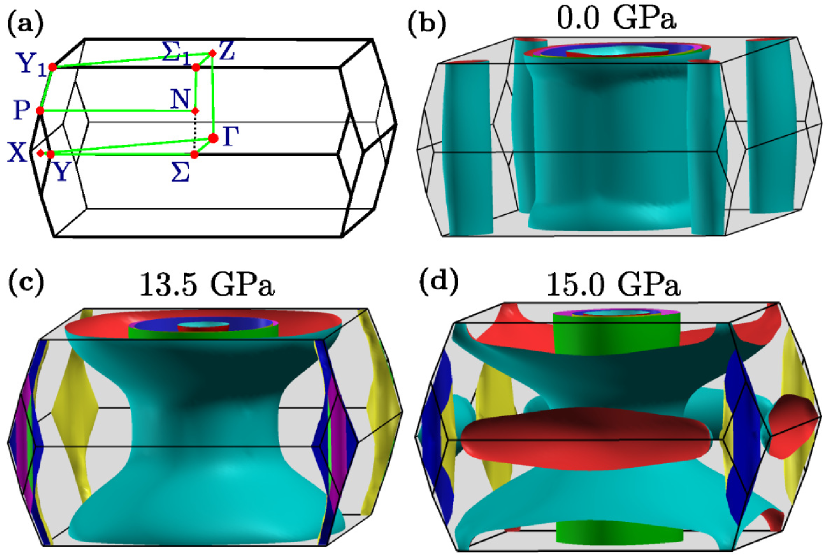
As it was mentioned, K122 crystallizes in a tetragonal ThCr2Si2-type structure (I4/mmm, space group: ), which consists of Fe2As2 layers separated by potassium layers. With increasing hydrostatic pressure, the phase transition from T to cT structure occurs around 16 GPa. At this transition the crystal structure does not change its symmetry. In both phases, the primitive unit cell contains single KFe2As2 chemical formula, but it is more convenient to use the crystallographic cell, which is shown in Fig. 1(a). In this cell three non-equivalent atoms K, Fe, and As are placed at the crystallographic sites: , and , respectively, defining all remaining atomic positions. In the absence of pressure, the structural parameters of the K122 tetragonal phase were specified as Å, Å, and Sándor and Hans-Uwe (1981). Within our numerical calculations we found Å, Å, and .
The pressure dependence of the optimized structural parameters (distances between atoms, an angle between two Fe–As bonds, lattice constants as well as volumes of the crystallographic cell and the FeSe layer) are presented in Fig. 1(b)–(e). The differences beetween the theoretical lattice constants and the experimental data Nakajima et al. (2015) in the entire range of pressure are smaller than 1.5%. This is a typical error in DFT calculations and it does not depend much on pressure. Therefore, our structural studies under pressure are reliable and sufficiently accurate to reproduce the relationship between the lattice parameters and pressure observed experimentally by the diffraction studies Nakajima et al. (2015). This can clearly be demonstrated by comparing Fig. 1(d) with Fig.3(c) shown in Ref.Nakajima et al. (2015). The lattice parameter first decreases up to GPa and then starts to increase. The lattice constant decreases in a whole range of pressures. A sharp enlargement of parameter and sudden reduction of parameter point out that the T–cT phase transition occurs at GPa. The measured x-ray diffraction spectra taken at room temperature indicate an abrupt change of lattice parameters around GPa. Such discrepancy between the measured and calculated pressure of the isostructural transition is not surprising taking into account that the calculated lattice constants correspond to temperature 0 K. Above the phase transition, parameter decreases again with pressure.
The unusual modifications of lattice parameters with pressure are induced by the changes of interatomic distances [Fig. 1(b)]. Especially, the relation between the As–As interlayer distance and the distances of Fe–As and Fe–Fe in the FeAs plane seems to be crucial. Results of detailed analysis of the crystal geometry (Fig. 1) are presented below:
-
(i)
The shortest interatomic distance is that between the Fe and As atoms within one FeAs layer [Fig.1(b)]. Its length, 2.32 Å, is slightly smaller than the sum of Fe and As covalent radii indicating strong Fe–As bonds within the layers. With increasing pressure the Fe–As distance decreases very slowly.
-
(ii)
The second shortest distance between neighboring Fe atoms, which initially equals 2.68 Å, decreases with increasing pressure achieving minimum around 10 GPa. Then it grows up around the phase transition and under higher pressure it starts slow decreasing again.
-
(iii)
The interlayer distance between two As atoms [labeled as As-As in Fig.1(b) and shown as a blue dashed line in Fig.1(a)] equals to 4.25 Å at zero pressure and drops dramatically to 2.94 Å under compression to 15 GPa. In cT phase, the increasing pressure leads to further shortening of this distance, however, the rate of distance decrease is notably slower.
- (iv)
-
(v)
The internal parameter , denoting a distance between As–atoms and Fe–atom planes (a half of the FeAs layer width), first increases and then decreases with increasing pressure, showing the abrupt reduction at the phase transition [Fig. 1(b)]. Additional increase of the pressure leads to only small decrease of its value.
- (vi)
-
(vii)
Above the isostructural phase transition, all interatomic distances slowly decrease with an approximately linear dependence on pressure.
The sharp decrease of the As–As distance with pressure is the common feature of compounds belonging to 122 family and exhibiting the T–cT phase transition. The distance between interlayer arsenic atoms decreases with pressure reaching a value that is lower than a sum of the van der Waals radii in the cT phase. For this reason the tetragonal collapse observed in the 122 compounds under pressure is discussed taking into account the direct bond formation between interlayer As atoms or the overlap of arsenic orbitals Yildirim (2009); Kasinathan et al. (2011); Stavrou et al. (2015). At the same time, the strong in-plane Fe–As and Fe–Fe bonds become weaker and consequently the system changes its characteristic two-dimensional character to the three-dimensional collapsed phase at high pressure.
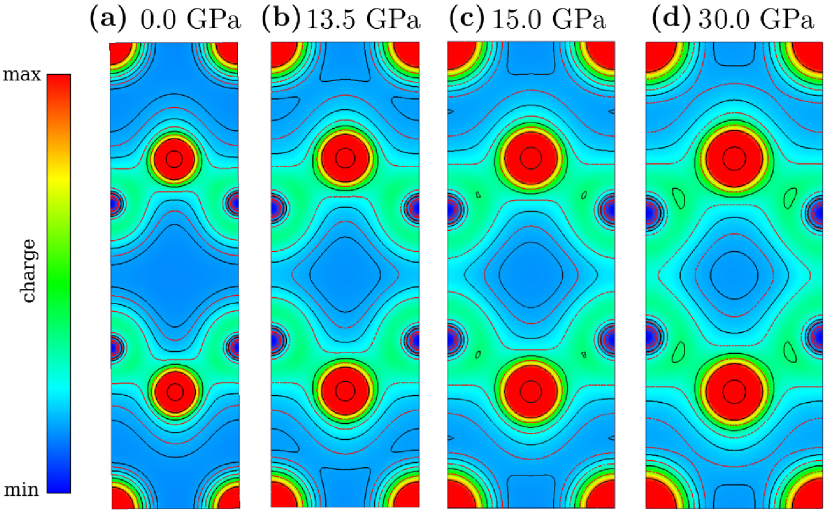
The evolution of charge density distribution with pressure in KFe2As2 presented in – plane passing through the As atoms (Fig. 2) confirms previous findings. At zero pressure [Fig. 2(a)] the strong covalent As–Fe bonds are characterized by the high charge density between these atoms while the weakly bonded neighboring FeAs planes are separated by the regions with a low charge density. The isocharge lines plotted in logarithmic mode (as implemented in VESTA software) demonstrate the significant differences of densities. Due to the very low charge density between two As atoms the large As–As distance is easily shortened by the imposed pressure until the T–cT transition pressure is achieved and the charge density is substantially higher. Finally, at 30 GPa the charge density between interlayer As atoms is just as high as that between atoms belonging to the single FeAs layer.
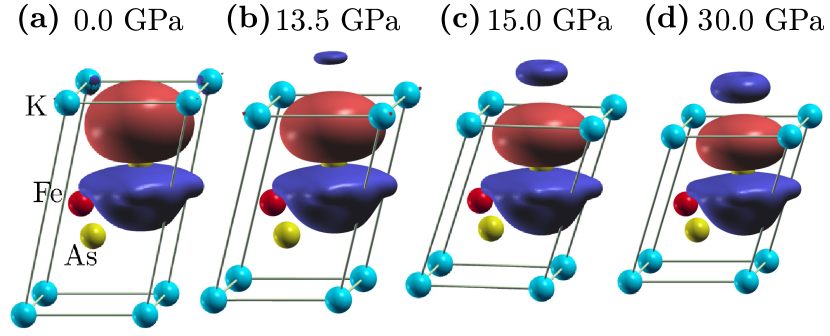
In the orbital representation, the formation of As–As bonds is related to the overlap between the orbitals of As atoms from neighboring FeAs layers. In Fig. 3 we show the evolution of -like MLW orbital centered at one As atom. With increasing pressure the shape of this orbital is changing. We can observe the emergence of an additional part of the orbital located outside the primitive cell. Since the 122 structure exhibits the mirror point symmetry, the orbital associated with the nearest As atom (in the same unit cell) exists with the opposite phase. Initially focused in one unit cell [Fig. 3(a)], the orbitals begin to play a more important role in the bonding between the neighboring primitive cells along the direction. As we can see, in contrary to the behavior of the isocharge surface at GPa, the -like Wannier orbitals show a precursor of bonding between two neighboring cells along the direction below the structural phase transition.
II.2 Electronic structure
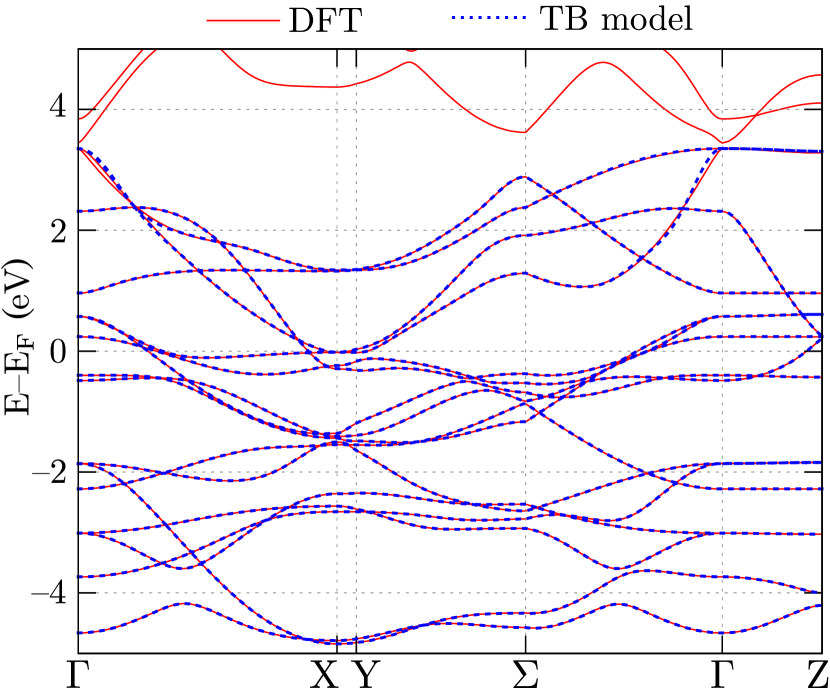
As we mentioned above, for a reproduction of the electron band structure of the K122 compound, we fitted the TBM using the MLW orbitals basis. To construct bands in the TBM, we take the Fe 3 orbitals and As 4 orbitals Cao et al. (2008). A comparison of the band structure obtained within the ab initio (DFT) calculations and that extracted from the TBM (in the absence of the external pressure) is shown in Fig. 4. Around the Fermi level and far below, the model very well reproduces the band structure obtained within the DFT. As we can see, the used model is more adequate than the previous ones, e.g. the 5-orbital/10-band model Suzuki et al. (2011); Li et al. (2012). For each pressure, we fit the parameters of the TBM, independently.
The obtained TBM defines the hopping integrals between different orbitals in several neighboring unit cells in every direction (precisely to all cells included in the supercell built of unit cells, while the initial cell is located at the center of the supercell). It should be noted that near the structural phase transition, hopping integral changes its value due to larger overlap between orbitals along the axis. The largest modifications are found for the orbitals localized on two neighboring As atoms along the direction [shown as blue dashed line in Fig. 1(a)]. For this bond the hopping integral changes its value from eV to eV. This change is associated with the emergence of stronger As–As interlayer bonding Yildirim (2009); Kasinathan et al. (2011); Stavrou et al. (2015), described in the previous section.
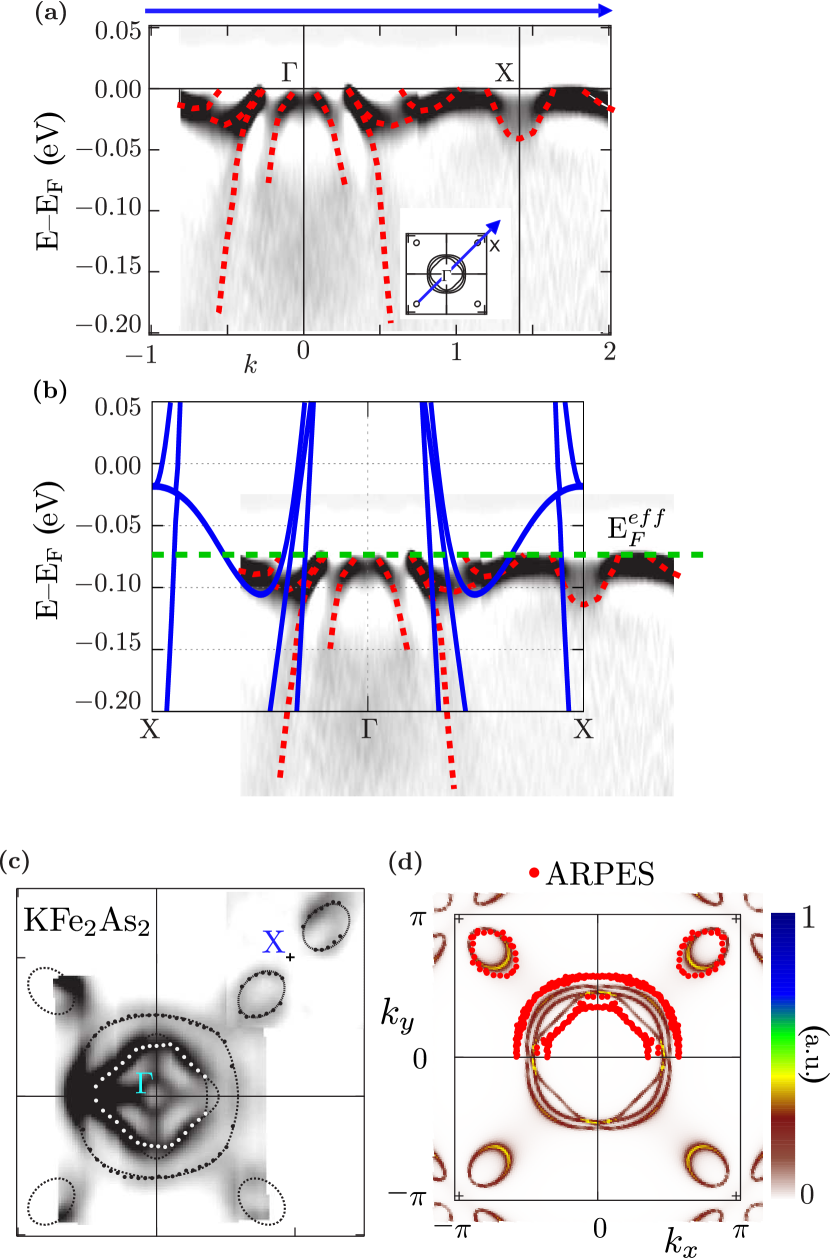
The spectra measured by the angle resolved photoemission spectroscopy (ARPES) showed the existence of three hole pockets centred at the point and four small hole pockets around the X point Sato et al. (2009); Yoshida et al. (2011); Terashima et al. (2013); Yoshida et al. (2014). A comparison of these results with the DFT calculations is presented in Fig. 5. To achieve a consistency of these results with our DFT calculations it is necessary to shift theoretical results of approximately 75 meV to lower energies [cf. blue and red lines Fig. 5(b)]. A similar comparison can be done for the FS obtained by ARPES [Fig. 5(c)]. To do this, we have calculated the spectral function at the “new” shifted Fermi level . The obtained result is shown as a color map in Fig. 5(d). As we can see, the structure of shifted bands found by the DFT calculations very well reproduces the shape and size of the experimental FS. Such a small shift of the Fermi level can be treated effectively as doping that changes the average number of particles by Wang et al. (2013). Here, it should be noted that such small doping does not change qualitatively the obtained electronic structure. This fixed “shift” of the band energies was also applied in the remaining calculations carried out for the crystal under pressure. We should also note that real samples may include some small deviations from the ideal stoichiometry, which are very difficult to observe experimentally.
One should also have in mind that the DFT calculations for IBSC, e.g., Refs. Mazin et al. (2008a); Singh and Du (2008); Kuroki et al. (2008); Zabidi et al. (2009); Terashima et al. (2010); Miyake et al. (2010); Thomale et al. (2011); Suzuki et al. (2011); Skornyakov et al. (2014), often give the band structure shifted with respect to the experimental ARPES data Evtushinsky et al. (2009); Kordyuk (2012); Richard et al. (2011); Borisenko et al. (2015); Yoshida et al. (2014). Moreover, from a comparison of the band structure obtained from the ARPES and DFT calculations, we can observe not only the shift of the Fermi level, but also different effective masses , i.e., different . The experimental value of the effective electron mass is reported in the range from to Terashima et al. (2010); Mizukami et al. (2016); Eilers et al. (2016). This discrepancy is a consequence of the incorrect description of correlations in IBSC by the DFT approach. This is a well-know problem, which has been discussed many times in the literature Subedi et al. (2008); Qazilbash et al. (2009); Aichhorn et al. (2010) and can be solved by the band renormalization Murai et al. (2018) or the combination of DFT with the dynamic mean field theory (DMFT) Haule et al. (2008); Lee et al. (2012); Ferber et al. (2012); Backes et al. (2014, 2015); Derondeau et al. (2017); Yang et al. (2017) . A better inclusion of the correlation effects gives more realistic band structures, ordering of magnetic moments, effective masses as well as Fermi surfaces Yin et al. (2011). However, in the present work, the main objective is the influence of pressure on properties of K122, therefore, the purpose of the Fermi level shift is to obtain the proper band structure at zero pressure.
The FS of the IBSC have a characteristic cylindrical shape Borisenko et al. (2010); Kordyuk (2012); Kordyuk et al. (2013); Derondeau et al. (2017). The FS calculated for K122 at GPa using the shifted Fermi level, shown in Fig. 6(b), agrees with the experimental results obtained by ARPES Sato et al. (2009); Yoshida et al. (2014). It is formed by three hole-like bands, which participate in a creation of three pockets in the middle of the Brillouin zone (BZ) along the –Z line and four small pockets located close to the corners of the BZ (at the X–P line).
With increasing pressure, a shape of the FS is modified both in the neighborhood of the BZ boundary at and close to the X–P–Y1 boundary [cf. Fig. 6(b) and Fig. 6(c)]. The pocket observed close to the X point at GPa is shifted to the zone boundary and changes its character from hole-like to the electron-like at higher pressures. This type of changes in the FS of K122 has been already discussed Nakajima et al. (2015) and reported also for other 122 family members Gonnelli et al. (2016); Tresca and Profeta (2017).
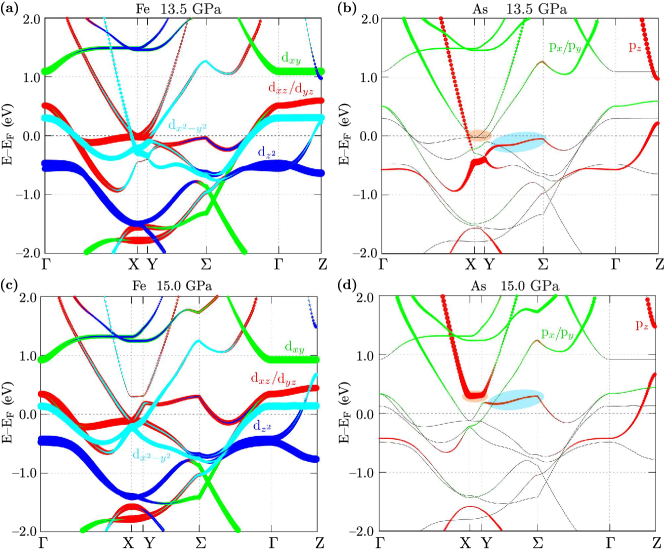
A further increase of pressure causes the occurrence of a new structure in the –X () plane of the FS when the system passes through the structural transition pressure [Fig. 6(d)]. This phenomenon is known as Lifshitz transition induced by the pressure Lifshitz (1960). To discuss it more precisely we calculate the orbital-projection band structure. Details of these calculations are presented in Appendix B. The results of numerical calculations are shown in Fig. 7 for the Fe orbitals and As orbitals (left and right columns, respectively). K ions do not have considerable contribution in the presented energy range and do not play any role in the construction of the TBMs. In the case of the Fe orbitals, the structural transition modifies the bands close to the Fermi level mainly along the X–Y– line [cf. Fig. 7(a) and (c)]. Some parts of the bands located just below the Fermi level in the T phase are shifted above it in the cT phase. Similar behavior is observed for the As orbitals, where the modifications of the bands in this part of the BZ are even more pronounced [cf. Fig. 7(b) and (d)]. Two bands associated with the -like orbitals (marked by the red and blue ovals) located below the Fermi level are shifted by increasing pressures above it. The band projections on the - and -like orbitals do not change.
The Lifshitz transition associated with the T–cT phase transition in K122 is mainly caused by shift of bands lying along X–Y– line. These bands initially located below Fermi level are moved above it. Another change observed above the transition pressure is the enhanced band energy dispersions along the –Z. It is interesting to note that filling of all bands is changed at the Lifshitz transition. This is experimentally observed, e.g., in Hall coefficient , which is proportional to the inverse of the total filling Madsen and Singh (2006). For K122 the Hall coefficient changes its sign at the structural transition Tafti et al. (2013); Ying et al. (2015).
The Lifshitz transition leads to the modification of the FS topology. It also changes contributions of given orbitals, which forms the FS. A perfect nesting between electron and hole pockets of the FS Chubukov et al. (2008) reported in many families of the IBSC Winiarski et al. (2012); Bao et al. (2009); Winiarski et al. (2013); Rodriguez et al. (2011); Ciechan et al. (2013); Dai (2015); Mou et al. (2016) occurs in the absence of the external pressure. However, in K122 at pressures below the isostructural transition the perfect nesting is not observed, and one cannot expect an existence of any magnetic order or nematic phases Chubukov et al. (2016); Li and Su (2017). The situation looks different for the cT phase. In this case, the Lifshitz transtion (i.e., the emergence of new pockets of the FS around the boundary of the BZ) leads to the FS shape Nakajima et al. (2015); Tresca and Profeta (2017) resembling that observed in the magnetic YFe2Ge2, what has been suggested also in Ref. Chen et al. (2016). Similar properties can be also expected in the case of YRu2Ge2, which present the same Fermi surface structure Chajewski et al. (2018). The other indication of the presence of the magnetic order in the cT phase is the vanishing superconducting state. Its disappearance can be a consequence of the competition between magnetism and superconductivity.
II.3 Superconducting properties
IBSC are characterized by the unconventional superconductivity Scalapino (2012); Chubukov (2012); Hosono and Kuroki (2015), i.e., the anisotropic gap (symmetries other than s-wave, typically s± symmetry Mazin et al. (2008b); Kuroki et al. (2008); Ikeda et al. (2010); Wang et al. (2015)) and mediated by antiferromagnetic spin fluctuations Mazin et al. (2008b); Wang and Lee (2011); Hirschfeld et al. (2011); Suzuki et al. (2011); Li et al. (2012); Bang and Stewart (2017). In the relation to this, in the absence of the pressure, the experimental results for K122 show that this material is characterized by the d-wave-type gap with nodal lines Thomale et al. (2011); Okazaki et al. (2012), what was reported, e.g. in magnetic penetration-depth Hashimoto et al. (2010); Watanabe et al. (2014), thermal conductivity Watanabe et al. (2014); Reid et al. (2012); Dong et al. (2010); Fukazawa et al. (2009) or nuclear quadrupole resonance Fukazawa et al. (2009) measurements. However, with increasing pressure, the gap symmetry can be changed from d to s± Guterding et al. (2015).
In the low pressure regime, K122 exhibits a sudden change of behavior of critical temperature , from its initial decrease with pressure to an increase above pressure GPa Tafti et al. (2013). Moreover, the universal V–shape temperature-pressure phase diagrams of K122, Rb122 and Cs122 have been reported Tafti et al. (2015). In addition, the critical magnetic field initially decreases with the external pressure, whereas above it increases with pressure Terashima et al. (2014). Experimental analyses of the FS in the presence of weak pressure do not provide any additional information about superconducting properties Grinenko et al. (2014). At higher pressures ( GPa), the critical temperature decreases and superconductivity disappears above 11 GPa Wang et al. (2016b).
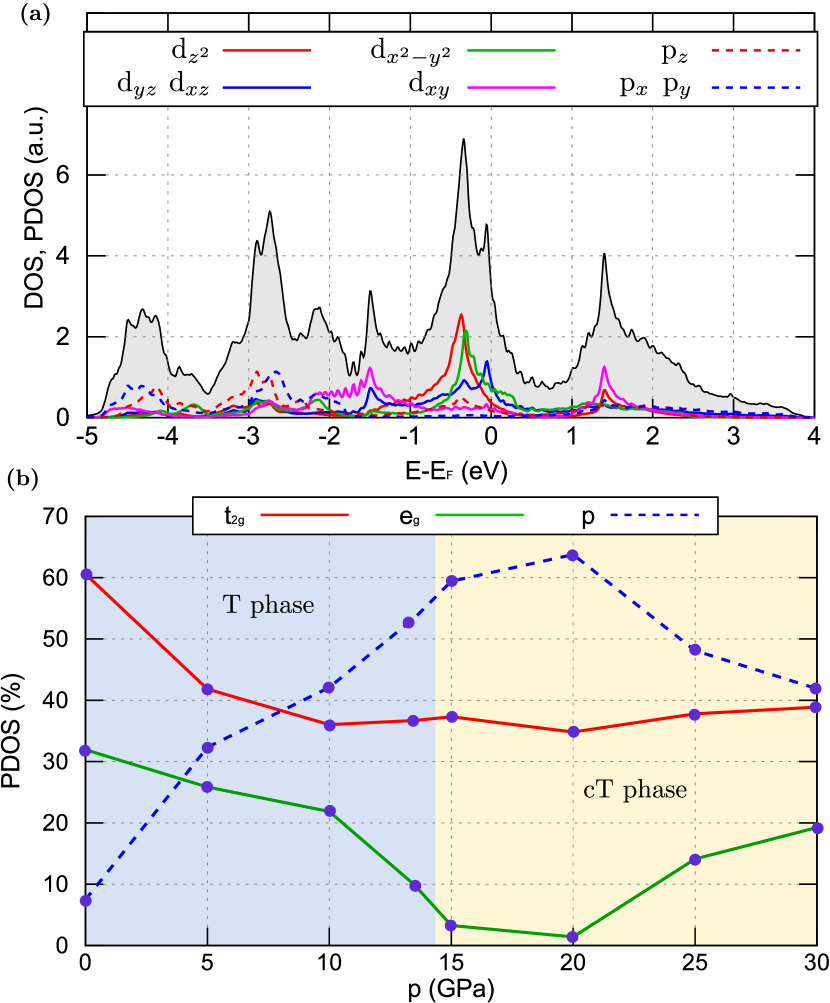
Superconducting properties of 122 systems result from the filling of -orbitals Mizukami et al. (2016). By analogy to Ba122, one can expect that strong electron pairing should be present in the Fe orbitals Evtushinsky et al. (2014). In this context, the orbital contribution to the total DOS at the FS [presented in Fig. 8(b)] can be an important indicator of the role of particular orbitals in the superconducting state. In the absence of external pressure, the local maximum in the DOS is located near the Fermi level [Fig. 8(a)]. The results of our calculations presented in Fig. 8(b) show the contributions of and orbitals to the total DOS. As we can see, with increasing pressure an influence of the orbitals at the Fermi level decreases initially from to . Next, at larger pressures, its value is approximately constant, while the contribution of the () orbitals decreases (increases) dramatically around the phase transition.
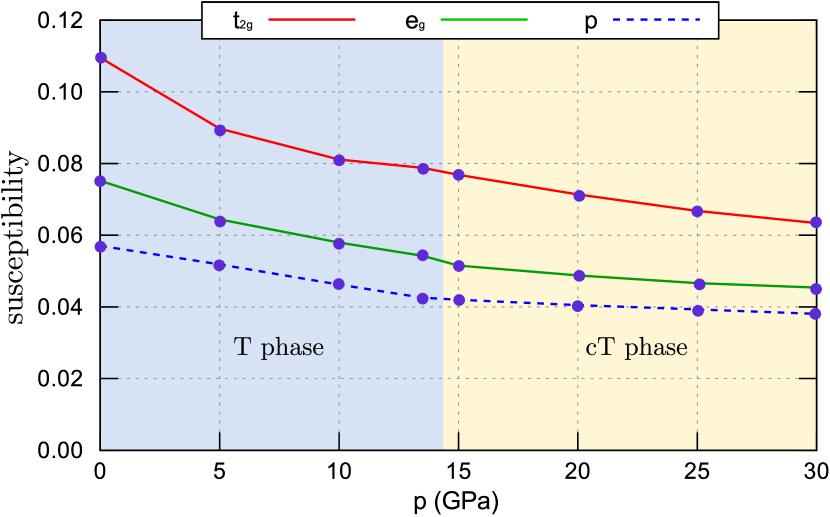
Similar analysis can be performed by using the Cooper pairs susceptibility (for details of the method see in e.g. Ref. Ptok et al. (2017)). This quantity tells us about a tendency of the system to realize superconductivity. As we can see from Fig. 9, similarly as discussed previously, a role of orbitals decreases with increasing pressure. If we assume that only orbitals on Fe atoms are responsible for superconductivity (cf. Ref. Evtushinsky et al. (2014)), the decreasing value of susceptibility in these orbitals is consistent with the diminution of superconductivity under pressure observed experimentally.
II.4 Dynamical properties
In this section, we analyze the influence of pressure and structural phase transition on lattice dynamics in K122. Details of the calculation method are described in Appendix C.
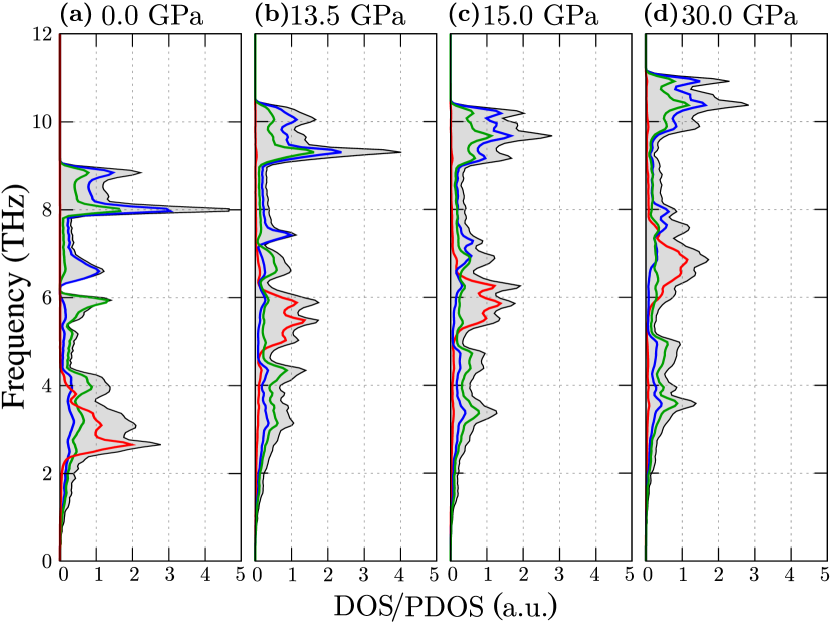
The phonon dispersion relations calculated at GPa are presented in Fig. 10. At any point in the Brillouin zone, there are vibrational normal modes as it is expected for a crystal with atoms in the primitive unit cell. Phonon frequencies cover the range up to THz including a small gap around THz. The total phonon density of states and individual contributions of atoms to the total DOS are presented in Fig. 11. At zero pressure the vibrations of potassium atoms dominate at low frequencies between and THz (red lines), while the vibrational frequencies of Fe and As atoms (blue and green lines, respectively) cover a whole frequency range. With increasing pressure all phonon frequencies shift to higher energies with the largest changes observed for the vibrations of K atoms. A small gap in the phonon DOS observed at , disappears at higher pressures. Additionally, the intensities of peaks creating the highest-frequency part of spectra dramatically change between 13.5 and 15 GPa. Overall, the spectra obtained below [Fig. 11(a) and (b)] and above [Fig. 11(c) and (d)] the structural phase transition are clearly distinct due to strong changes in the interatomic distances and interactions. The lack of any imaginary (soft) modes in the phonon DOS indicates a dynamical stability of K122 up to GPa.
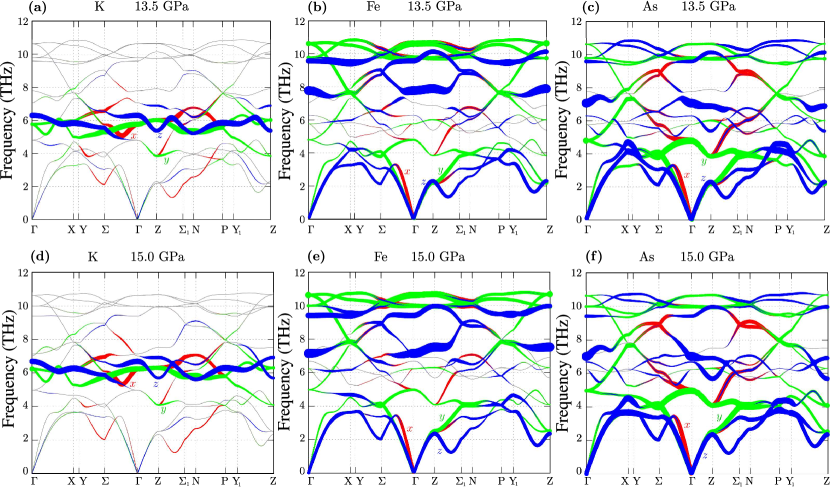
Next, we follow through the phonon dispersion relations at GPa and GPa (Fig. 12) to analyze in detail the changes in lattice dynamics induced by the phase transition. Colors of lines correspond to the phonon projection on a given direction (, , and directions correspond to red, green, and blue color, respectively), while the line thickness corresponds to the projection value. In this way, we present the contribution of vibrations of a chosen atom to a selected phonon branch in a given direction. The dispersion curves taken at both pressures are quite similar, however, some differences are noticeable. The K atom vibrations contribute strongly to optical branches in a narrow range of frequencies around THz and their frequencies increase slightly due to the phase transition. The Fe atoms contribute mainly to the highest-energy optical modes as well as to the acoustic modes. The vibrations of Fe atoms along the direction are particularly strong at well defined branches started from the point at THz. In spite of the contraction of lattice constant the Fe–Fe interatomic distance increases so the frequency of this mode decreases to THz. This effect is also very strong for the Fe modes propagating along the –Z direction. The strongest As vibrations are observed at the , X, Y, and P high-symmetry points. The frequencies of these modes are slightly lower than frequencies of the most intensive Fe phonons. The largest changes induced by the phase transition are observed for the As modes around THz with polarization along the direction.
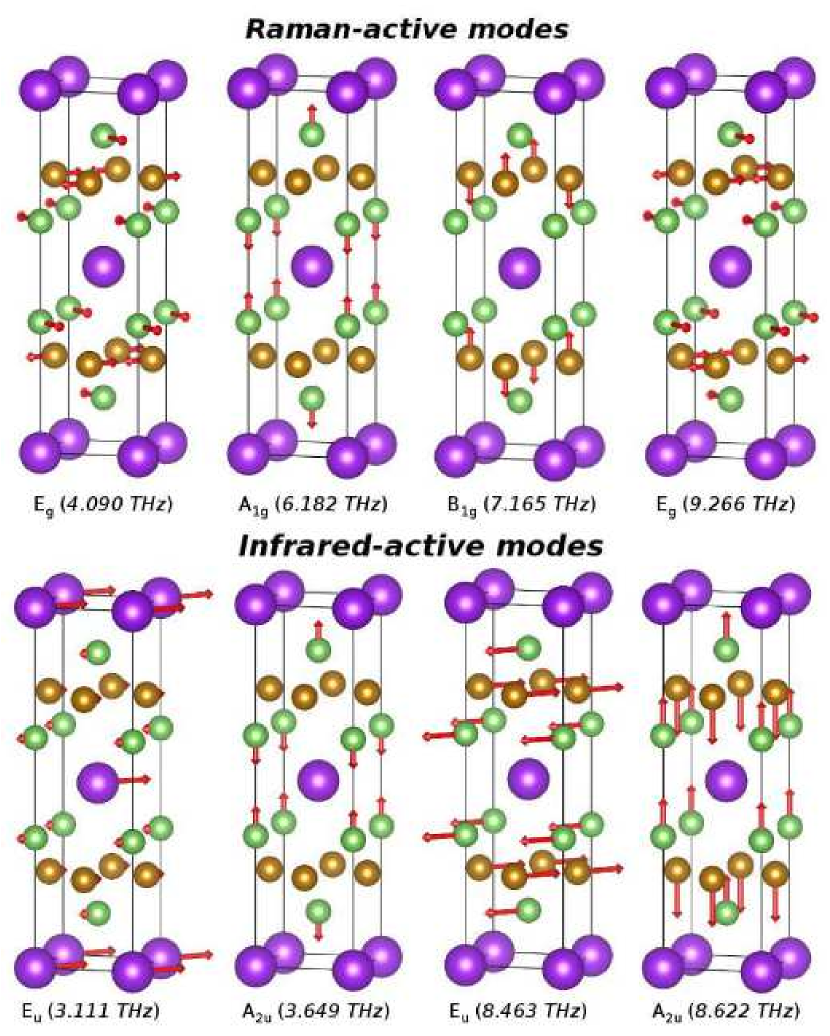
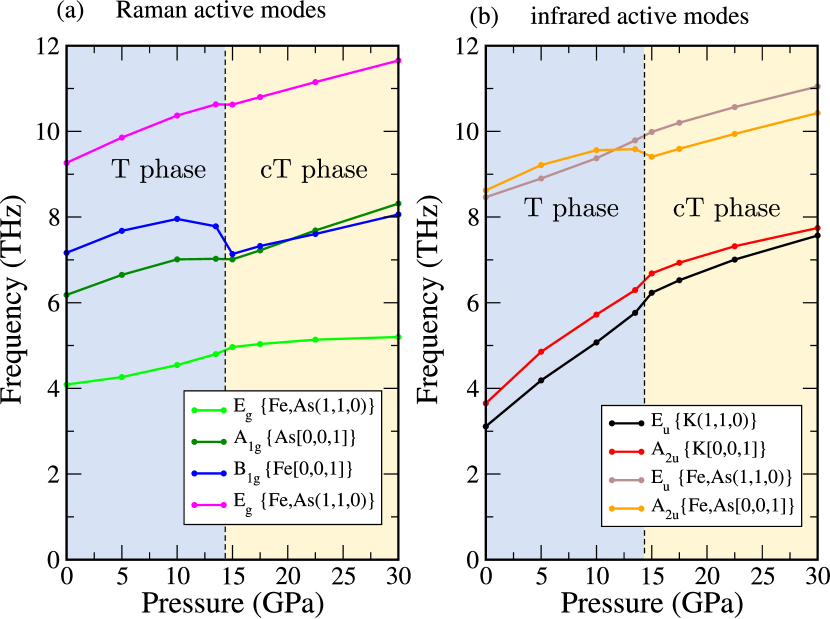
Frequencies at the point can be verified experimentally using the Raman and infrared (IR) spectroscopy. Group theory analysis indicates that the optical modes form the following irreducible representations at the Brillouin zone center, where , , and modes are Raman active and , are infrared active. In agreement with the dimension of these representations, all modes are doubly degenerate at the point. Atomic displacements corresponding to the Raman and IR active modes in K122, schematically presented in Fig. 13, are consistent with those observed previously in KCo2Se2 Wdowik et al. (2015). There are no Raman modes associated with the vibrations of the K-sublattice. In contrast, vibrations of K atoms dominate in two of the IR active modes and . The first is related to the strong atomic movements of K atoms along the direction and the other one with vibrations in perpendicular plane whereas the amplitudes of As and Fe atoms are about one tenth of K displacements.
In Fig. 14, the pressure dependence of each of eight optic modes at the point is presented. To characterize these modes, the symmetry, names of atoms that are mainly involved in, and the direction of atomic movements are given. For example, identifies vibrations of Fe atoms along the direction described by the symmetry and represents vibrations dominated by movements of As and Fe in the plane.
At zero pressure, the two lowest modes are the IR phonons related with the strong movements of K atoms in the plane and along the direction. Their frequencies systematically increase with pressure, however, the slopes of lines become steeper in close vicinity of the structural phase transition, i.e. between GPa and GPa [Fig. 14(b)]. Similarly, pronounced changes in frequencies are observed for all modes in this region of pressure. The frequency of the mode, which involves vibrations of Fe and As atoms along the direction shows a nonmonotonic behavior. First, it increases up to 10 GPa, then drops between 10-15 GPa, and increases again above the phase transition. A similar behavior is found for two Raman modes and representing vibrations of As and Fe atoms, respectively, along the direction. As it is shown in Fig. 12, these modes correspond to the most intensive phonons propagating along the –X and –Z directions. They can be promising objects for experimental and theoretical investigations of phonons or even phonon-electron interactions as it was shown in the case of Ba1-xKxFe2As2 (, superconducting Tc=29 K), Sr1-xKxFe2As2 (, Tc=29 K), and nonsuperconducting Ba122 single crystals Rahlenbeck et al. (2009), Ba0.6K0.4Fe2As2 Böhm et al. (2014) or Fe1+yTe1-xSex Um et al. (2012).
There are no experimental data on phonon dispersion relations or phonon DOS for the undoped K122 compound. Neutron scattering measurements of the phonon DOS in Sr0.6K0.4Fe2As2 (Tc=32 K) and Ca0.6Na0.4Fe2As2 (Tc=28 K) compared with the Ba122 compound show that the doping or exchange of alkali atoms affect mainly the low and intermediate frequency range of the spectra Mittal et al. (2008). The spectrum presented in Fig. 11(a) confirms this findings as the potassium atoms vibrate with low frequencies and in the high-frequency part of the spectrum only Fe and As atoms are involved. Experimental studies of the pressure dependence of vibrational frequencies in both the tetragonal and collapsed tetragonal phases have been performed for Ca122 using the inelastic x-ray and neutron scattering Mittal et al. (2010) and more recently for Sr122 using the nuclear resonant inelastic x-ray scattering Wang et al. (2016c). It has been found that the phonon frequency shifts induced by pressure are well explained by changes in relevant bond lengths throughout the entire pressure range. Our calculations also indicate that nonmonotonic changes in the distance between two neighboring Fe atoms [Fig. 1(b)] significantly influence the vibrational frequency of the Fe–Fe stretching mode along the axis. As a result, the frequency softening is observed just a few GPa below the isostructural transition. On the other hand, phonons polarized in the (1,1,0) plane stiffen under the imposed pressure. In general, in accordance with the previous studies Mittal et al. (2010); Wang et al. (2016c), the structural phase transition influences much stronger phonon modes polarized along the direction than those in the plane.
Let us stress that the IBSC are unconventional superconductors in the sense that phonons likely do not play a dominant role in their superconductivity. The calculations based on the density-functional perturbation theory lead to the conclusion that the total electron-phonon coupling is too weak to explain their high Tc Boeri et al. (2008); Mazin et al. (2008b); Naidyuk et al. (2014); Boeri et al. (2010), but strong enough to have a non-negligible effect on superconductivity, for instance, by frustrating the coupling with spin fluctuations and inducing the order parameter nodes Boeri et al. (2010). Therefore, the analysis performed in this section may be important for full understanding of the superconducting properties of K122.
III Summary
Using the ab initio calculations, we have studied the influence of pressure and the isostructural phase transition on the properties of the KFe2As2 superconductor. The obtained lattice parameters as functions of pressure show a very good agreement with the experimental data.
To explore the electronic and superconducting properties, we have built the -orbital tight biding model within the maximally localized Wannier orbitals. The compatibility between the resulted electronic structure and that obtained from DFT calculations has been mainly taken into account in the selection of TBM parameters.
We have discussed the mechanism leading to the phase transition from the tetragonal phase to the collapsed tetragonal phase, which is associated with an enhancement of bonding between As atoms along the direction. We have revealed the precursor of the phase transition in a form of an additional part of the Wannier orbital on the As atoms.
We have investigated changes of the Fermi surface induced by pressure and analyzed the Lifshitz transition that occurs when the system passes through the isostructural phase transition. The detailed studies of the pressure dependence of As-p and Fe-d bands have demonstrated that the new structure observed in the –X plane of the FS results from the shift of some bands located below the Fermi level to energies above it.
To specify the role of the particular orbitals in the superconducting state, the orbital contributions to the total DOS have been also considered. We have found that in the T phase the contributions of and orbitals to the total DOS at the Fermi energy decrease with pressure achieving at the transition pressure, the values significantly smaller then rapidly growing the orbital contribution. We have also investigated the effect of pressure on the pairing susceptibility. Modification of the electronic structure and the calculated pairing susceptibility allow us to conclude that the imposed pressure should reduce in agreement with the experiment.
Finally, we have analyzed the changes in lattice dynamics induced by pressure and found a significant modification of phonon spectra, especially the modes corresponding to vibrations of Fe and As atoms along the directions. They show the anomalous, non-monotonic dependence of phonon frequency on pressure close to the isostructural phase transition. This result can be verified experimentally using the Raman and infrared spectroscopy.
Acknowledgements.
The authors are thankful to Jan Łażewski, Paweł Jochym, Andrzej M. Oleś, and Krzysztof Parlinski for the very fruitful discussions and comments. This work was supported by the National Science Centre (NCN, Poland) under grants UMO-2016/21/D/ST3/03385 (A.P.), UMO-2017/25/B/ST3/02586 (M.S. and P.P.), and UMO-2017/24/C/ST3/00276 (K.J.K.).Appendix A Tight binding model
The TBM in the MLW functions (orbitals) Marzari et al. (2012) can be express in the form:
| (1) |
where is the hopping elements between orbitals and localized at sites indicate by vectors and . Here, () is the creation (annihilation) operator [in the orbital (Wannier) basis] of an electron with spin at orbital of atoms. From the ab initio (DFT) calculation, the hopping integrals can be found by the Wannier90 program Mostofi et al. (2008, 2014). The Hamiltonian in the momentum space takes the form:
| (2) |
where
| (3) |
Here, we take – the distance between two atoms in the real space and . The band structure can be found by a diagonalization of the matrix (4). Then, the Hamiltonian takes the diagonal form:
| (4) |
where denotes the Fermi level and () is the new creation (annihilation) operator [in the band (Bloch) basis] of the electron with momentum and spin . Additionally, the band number is given by . Relations between the operators in the Wannier basis and the Bloch basis are given by the unitary transformation:
| (5) |
Matrix is composed by the eigenvectors of the matrix (3) and diagonalizes (transforms) the Hamiltonian from the form (2) into (4).
Appendix B Orbital projections of electronic band structure
The density of states (DOS) from its definition is given as:
where is the spectral function. Substituting (4) and (5) to (B) we can find an exact expression of the DOS:
Coefficients denote projections of the -th electronic (spin ) band (at momentum ) with energy onto the Wannier orbital . Here, plays the role of the partial electronic DOS, projected onto orbital.
Appendix C Dynamical matrix
The dynamical properties of the system are given by the dynamical matrix:
| (8) |
where is the phonon wave vector and denotes the mass of the atom . Here, is the force constants tensor ( and is the direction index: , , and ) between atoms and localized in the initial () and -th primitive unit cell, which can be find from the ab initio method using, e.g., the Parlinski–Li–Kawazoe method Parlinski et al. (1997).
Energy spectrum of vibrations with a wave vector is given as an eigenproblem of dynamical matrix (8):
| (9) |
where corresponds to the frequency of branch phonon. Here, -component eigenvector describes the polarization of the phonon with frequency and wavevector . Additionally, from the definition, the chosen components of the polarization vector describe the oscillations of the atom in the direction .
Similarly as for electrons, we can define the total phonon DOS for frequency , which is given by:
| (10) |
It can be expressed by the partial phonon DOS [denoted as ]:
along directions and/or atoms . As a consequence, a coefficient denotes the influence of phonon with a wavevector on to the oscillations of atom in direction.
References
- Kamihara et al. (2008) Y. Kamihara, T. Watanabe, M. Hirano, and H. Hosono, “Iron-based layered superconductor La[O1-xFx]FeAs () with Tc=26 K,” J. Am. Chem. Soc. 130, 3296 (2008).
- Stewart (2011) G. R. Stewart, “Superconductivity in iron compounds,” Rev. Mod. Phys. 83, 1589 (2011).
- Dagotto (2013) E. Dagotto, “Colloquium: the unexpected properties of alkali metal iron selenide superconductors,” Rev. Mod. Phys. 85, 849 (2013).
- Dai (2015) P. Dai, “Antiferromagnetic order and spin dynamics in iron-based superconductors,” Rev. Mod. Phys. 87, 855 (2015).
- Hosono et al. (2017) H. Hosono, A. Yamamoto, H. Hiramatsu, and Y. Ma, “Recent advances in iron-based superconductors toward applications,” Materials Today (2017), 10.1016/j.mattod.2017.09.006.
- Rotter et al. (2008) M. Rotter, M. Tegel, and D. Johrendt, “Superconductivity at 38 K in the iron arsenide (Ba1-xKx)Fe2As2,” Phys. Rev. Lett. 101, 107006 (2008).
- Sato et al. (2009) T. Sato, K. Nakayama, Y. Sekiba, P. Richard, Y.-M. Xu, S. Souma, T. Takahashi, G. F. Chen, J. L. Luo, N. L. Wang, and H. Ding, “Band structure and Fermi surface of an extremely overdoped iron-based superconductor KFe2As2,” Phys. Rev. Lett. 103, 047002 (2009).
- Fukazawa et al. (2009) H. Fukazawa, Y. Yamada, K. Kondo, T. Saito, Y. Kohori, K. Kuga, Y. Matsumoto, S. Nakatsuji, H. Kito, P. M. Shirage, K. Kihou, N. Takeshita, Ch.-H. Lee, A. Iyo, and H. Eisaki, “Possible multiple gap superconductivity with line nodes in heavily hole-doped superconductor KFe2As2 studied by 75As nuclear quadrupole resonance and specific heat,” J. Phys. Soc. Jpn. 78, 083712 (2009).
- Avci et al. (2012) S. Avci, O. Chmaissem, D. Y. Chung, S. Rosenkranz, E. A. Goremychkin, J. P. Castellan, I. S. Todorov, J. A. Schlueter, H. Claus, A. Daoud-Aladine, D. D. Khalyavin, M. G. Kanatzidis, and R. Osborn, “Phase diagram of Ba1-xKxFe2As2,” Phys. Rev. B 85, 184507 (2012).
- Wang and Lee (2011) F. Wang and D.-H. Lee, “The electron-pairing mechanism of iron-based superconductors,” Science 332, 200 (2011).
- Nakajima et al. (2015) Y. Nakajima, R. Wang, T. Metz, X. Wang, L. Wang, H. Cynn, S. T. Weir, J. R. Jeffries, and J. Paglione, “High-temperature superconductivity stabilized by electron-hole interband coupling in collapsed tetragonal phase of KFe2As2 under high pressure,” Phys. Rev. B 91, 060508 (2015).
- Ying et al. (2015) J.-J. Ying, L.-Y. Tang, V. V. Struzhkin, H.-K. Mao, A. G. Gavriliuk, A.-F. Wang, X.-H. Chen, and X.-J. Chen, “Tripling the critical temperature of KFe2As2 by carrier switch,” (2015), arXiv:1501.00330 .
- Kreyssig et al. (2008) A. Kreyssig, M. A. Green, Y. Lee, G. D. Samolyuk, P. Zajdel, J. W. Lynn, S. L. Bud’ko, M. S. Torikachvili, N. Ni, S. Nandi, J. B. Leão, S. J. Poulton, D. N. Argyriou, B. N. Harmon, R. J. McQueeney, P. C. Canfield, and A. I. Goldman, “Pressure-induced volume-collapsed tetragonal phase of CaFe2As2 as seen via neutron scattering,” Phys. Rev. B 78, 184517 (2008).
- Uhoya et al. (2010a) W. Uhoya, A. Stemshorn, G. Tsoi, Y. K. Vohra, A. S. Sefat, B. C. Sales, K. M. Hope, and S. T. Weir, “Collapsed tetragonal phase and superconductivity of BaFe2As2 under high pressure,” Phys. Rev. B 82, 144118 (2010a).
- Mittal et al. (2011) R. Mittal, S. K. Mishra, S. L. Chaplot, S. V. Ovsyannikov, E. Greenberg, D. M. Trots, L. Dubrovinsky, Y. Su, Th. Brueckel, S. Matsuishi, H. Hosono, and G. Garbarino, “Ambient- and low-temperature synchrotron x-ray diffraction study of BaFe2As2 and CaFe2As2 at high pressures up to 56 GPa,” Phys. Rev. B 83, 054503 (2011).
- Uhoya et al. (2010b) W. Uhoya, G. Tsoi, Y. K Vohra, M. A McGuire, A. S Sefat, B. C. Sales, D. Mandrus, and S. T. Weir, “Anomalous compressibility effects and superconductivity of EuFe2As2 under high pressures,” J. Phys.: Condens. Matter 22, 292202 (2010b).
- Johrendt et al. (1997) D. Johrendt, C. Felser, O. Jepsen, O. K Andersen, A. Mewis, and J. Rouxel, “LMTO band structure calculations of ThCr2Si2-type transition metal compounds,” J. Solid State Chem. 130, 254 (1997).
- Coldea et al. (2009) A. I. Coldea, C. M. J. Andrew, J. G. Analytis, R. D. McDonald, A. F. Bangura, J.-H. Chu, I. R. Fisher, and A. Carrington, “Topological change of the fermi surface in ternary iron pnictides with reduced ratio: A de Haas–van Alphen study of CaFe2P2,” Phys. Rev. Lett. 103, 026404 (2009).
- Huhnt et al. (1998) C. Huhnt, W. Schlabitz, A. Wurth, A. Mewis, and M. Reehuis, “First- and second-order phase transitions in ternary europium phosphides with ThCr2Si2-type structure,” Physica B 252, 44 (1998).
- Jayasekara et al. (2015) W. T. Jayasekara, U. S. Kaluarachchi, B. G. Ueland, Abhishek Pandey, Y. B. Lee, V. Taufour, A. Sapkota, K. Kothapalli, N. S. Sangeetha, G. Fabbris, L. S. I. Veiga, Yejun Feng, A. M. dos Santos, S. L. Bud’ko, B. N. Harmon, P. C. Canfield, D. C. Johnston, A. Kreyssig, and A. I. Goldman, “Pressure-induced collapsed-tetragonal phase in SrCo2As2,” Phys. Rev. B 92, 224103 (2015).
- Naumov et al. (2017) P. G. Naumov, K. Filsinger, O. I. Barkalov, G. H. Fecher, S. A. Medvedev, and C. Felser, “Pressure-induced transition to the collapsed tetragonal phase in BaCr2As2,” Phys. Rev. B 95, 144106 (2017).
- Taufour et al. (2014) V. Taufour, N. Foroozani, M. A. Tanatar, J. Lim, U. Kaluarachchi, S. K. Kim, Y. Liu, T. A. Lograsso, V. G. Kogan, R. Prozorov, S. L. Bud’ko, J S. Schilling, and P. C. Canfield, “Upper critical field of KFe2As2 under pressure: A test for the change in the superconducting gap structure,” Phys. Rev. B 89, 220509 (2014).
- Wang et al. (2016a) P. S. Wang, P. Zhou, J. Dai, J. Zhang, X. X. Ding, H. Lin, H. H. Wen, B. Normand, R. Yu, and Weiqiang Yu, “Nearly critical spin and charge fluctuations in KFe2As2 observed by high-pressure NMR,” Phys. Rev. B 93, 085129 (2016a).
- Wang et al. (2016b) B. Wang, K. Matsubayashi, J. Cheng, T. Terashima, K. Kihou, S. Ishida, Ch.-H. Lee, A. Iyo, H. Eisaki, and Y. Uwatoko, “Absence of superconductivity in the collapsed tetragonal phase of KFe2As2 under hydrostatic pressure,” Phys. Rev. B 94, 020502 (2016b).
- Tafti et al. (2013) F. F. Tafti, A. Juneau-Fecteau, M.-E. Delage, S. Rene de Cotret, J.-Ph. Reid, A. F. Wang, X.-G. Luo, X. H. Chen, N. Doiron-Leyraud, and L. Taillefer, “Sudden reversal in the pressure dependence of Tc in the iron-based superconductor KFe2As2,” Nat. Phys. 9, 349 (2013).
- Tafti et al. (2015) F. F. Tafti, A. Ouellet, A. Juneau-Fecteau, S. Faucher, M. Lapointe-Major, N. Doiron-Leyraud, A. F. Wang, X.-G. Luo, X. H. Chen, and Louis Taillefer, “Universal V-shaped temperature-pressure phase diagram in the iron-based superconductors KFe2As2, RbFe2As2 and CsFe2As2,” Phys. Rev. B 91, 054511 (2015).
- Tafti et al. (2014) F. F. Tafti, J. P. Clancy, M. Lapointe-Major, C. Collignon, S. Faucher, J. A. Sears, A. Juneau-Fecteau, N. Doiron-Leyraud, A. F. Wang, X.-G. Luo, X. H. Chen, S. Desgreniers, Y.-J. Kim, and L. Taillefer, “Sudden reversal in the pressure dependence of Tc in the iron-based superconductor CsFe2As2: A possible link between inelastic scattering and pairing symmetry,” Phys. Rev. B 89, 134502 (2014).
- Guterding et al. (2015) D. Guterding, S. Backes, H. O. Jeschke, and R. Valentí, “Origin of the superconducting state in the collapsed tetragonal phase of KFe2As2,” Phys. Rev. B 91, 140503 (2015).
- Mittal et al. (2010) R. Mittal, R. Heid, A. Bosak, T. R. Forrest, S. L. Chaplot, D. Lamago, D. Reznik, K.-P. Bohnen, Y. Su, N. Kumar, S. K. Dhar, A. Thamizhavel, Ch. Rüegg, M. Krisch, D. F. McMorrow, Th. Brueckel, and L. Pintschovius, “Pressure dependence of phonon modes across the tetragonal to collapsed-tetragonal phase transition in CaFe2As2,” Phys. Rev. B 81, 144502 (2010).
- Wang et al. (2016c) Y. Q. Wang, P. C. Lu, J. J. Wu, J. Liu, X. C. Wang, J. Y. Zhao, W. Bi, E. E. Alp, C. Y. Park, D. Popov, C. Q. Jin, J. Sun, and J. F. Lin, “Phonon density of states of single-crystal SrFe2As2 across the collapsed phase transition at high pressure,” Phys. Rev. B 94, 014516 (2016c).
- Iyo et al. (2016) A. Iyo, K. Kawashima, T. Kinjo, T. Nishio, S. Ishida, H. Fujihisa, Y. Gotoh, K. Kihou, H. Eisaki, and Y. Yoshida, “New-structure-type Fe-based superconductors: CaAFe4As4 (A = K, Rb, Cs) and SrAFe4As4 (A = Rb, Cs),” J. Am. Chem. Soc. 138, 3410 (2016).
- Song et al. (2018) B. Q. Song, M. C. Nguyen, C. Z. Wang, and K. M. Ho, “Stability of the 1144 phase in iron pnictides,” Phys. Rev. B 97, 094105 (2018).
- Borisov et al. (2018) V. Borisov, P. C. Canfield, and R. Valentí, “Trends in pressure-induced layer-selective half-collapsed tetragonal phases in the iron-based superconductor family AeAFe4As4,” Phys. Rev. B 98, 064104 (2018).
- Mou et al. (2016) Daixiang Mou, Tai Kong, William R. Meier, Felix Lochner, Lin-Lin Wang, Qisheng Lin, Yun Wu, S. L. Bud’ko, Ilya Eremin, D. D. Johnson, P. C. Canfield, and Adam Kaminski, “Enhancement of the superconducting gap by nesting in CaKFe4As4: A new high temperature superconductor,” Phys. Rev. Lett. 117, 277001 (2016).
- Kaluarachchi et al. (2017) U. S. Kaluarachchi, V. Taufour, A. Sapkota, V. Borisov, T. Kong, W. R. Meier, K. Kothapalli, B. G. Ueland, A. Kreyssig, R. Valentí, R. J. McQueeney, A. I. Goldman, S. L. Bud’ko, and P. C. Canfield, “Pressure-induced half-collapsed-tetragonal phase in CaKFe4As4,” Phys. Rev. B 96, 140501 (2017).
- Jackson et al. (2018) D. E. Jackson, D. VanGennep, W. Bi, D. Zhang, P. Materne, Y. Liu, G.-H. Cao, S. T. Weir, Y. K. Vohra, and J. J. Hamlin, “Superconducting and magnetic phase diagram of RbEuFe4As4 and CsEuFe4As4 at high pressure,” Phys. Rev. B 98, 014518 (2018).
- Momma and Izumi (2011) K. Momma and F. Izumi, “Vesta3 for three-dimensional visualization of crystal, volumetric and morphology data,” J. Appl. Crystallogr. 44, 1272 (2011).
- Blöchl (1994) P. E. Blöchl, “Projector augmented-wave method,” Phys. Rev. B 50, 17953 (1994).
- Perdew et al. (1996) J. P. Perdew, K. Burke, and M. Ernzerhof, “Generalized gradient approximation made simple,” Phys. Rev. Lett. 77, 3865 (1996).
- Kresse and Furthmüller (1996a) G Kresse and J. Furthmüller, “Efficiency of ab-initio total energy calculations for metals and semiconductors using a plane-wave basis set,” Comput. Mater. Sci. 6, 15 (1996a).
- Kresse and Furthmüller (1996b) G. Kresse and J. Furthmüller, “Efficient iterative schemes for ab initio total-energy calculations using a plane-wave basis set,” Phys. Rev. B 54, 11169 (1996b).
- Methfessel and Paxton (1989) M. Methfessel and A. T. Paxton, “High-precision sampling for Brillouin-zone integration in metals,” Phys. Rev. B 40, 3616 (1989).
- Monkhorst and Pack (1976) H. J. Monkhorst and J. D. Pack, “Special points for Brillouin-zone integrations,” Phys. Rev. B 13, 5188 (1976).
- Ptok et al. (2017) A. Ptok, K. J. Kapcia, P. Piekarz, and A. M. Oleś, “The ab initio study of unconventional superconductivity in CeCoIn5 and FeSe,” New J. Phys. 19, 063039 (2017).
- Marzari et al. (2012) N. Marzari, A. A. Mostofi, J. R. Yates, I. Souza, and D. Vanderbilt, “Maximally localized Wannier functions: Theory and applications,” Rev. Mod. Phys. 84, 1419 (2012).
- Mostofi et al. (2008) A. A. Mostofi, J. R. Yates, Y.-S. Lee, I. Souza, D. Vanderbilt, and N. Marzari, “wannier90: A tool for obtaining maximally-localised Wannier functions,” Comput. Phys. Commun. 178, 685 (2008).
- Mostofi et al. (2014) A. A. Mostofi, J. R. Yates, G. Pizzi, Y.-S. Lee, I. Souza, D. Vanderbilt, and N. Marzari, “An updated version of wannier90: A tool for obtaining maximally-localised Wannier functions,” Comput. Phys. Commun. 185, 2309 (2014).
- Parlinski et al. (1997) K. Parlinski, Z. Q. Li, and Y. Kawazoe, “First-principles determination of the soft mode in cubic ZrO2,” Phys. Rev. Lett. 78, 4063 (1997).
- Parlinski (208) K. Parlinski, “Phonon,” Cracow (208).
- Sándor and Hans-Uwe (1981) R. Sándor and S. Hans-Uwe, “Zur struktur von KFe2As2, KCo2As2, KRh2As2 / crystal structure of KFe2As2, KCo2As2, KRh2As2 and KRh2P2,” Z. Naturforsch. B Chem. Sci. 36, 1668 (1981).
- Yildirim (2009) T. Yildirim, “Strong coupling of the Fe-spin state and the As-As hybridization in iron-pnictide superconductors from firstprinciple calculations,” Phys. Rev. Lett. 102, 037003 (2009).
- Kasinathan et al. (2011) D. Kasinathan, M. Schmitt, K. Koepernik, A. Ormeci, K. Meier, U. Schwarz, M. Hanfland, Ch. Geibel, Y. Grin, A. Leithe-Jasper, and H. Rosner, “Symmetry-preserving lattice collapse in tetragonal SrFe2-xRuxAs2 (): A combined experimental and theoretical study,” Phys. Rev. B 84, 054509 (2011).
- Stavrou et al. (2015) E. Stavrou, X.-J. Chen, A. R. Oganov, A. F. Wang, Y. J. Yan, X. G. Luo, X. H. Chen, and A. F. Goncharov, “Formation of As-As interlayer bonding in the collapsed tetragonal phase of NaFe2As2 under pressure,” Sci. Rep. 5, 9868 (2015).
- Cao et al. (2008) Ch. Cao, P. J. Hirschfeld, and H.-P. Cheng, “Proximity of antiferromagnetism and superconductivity in LaFeAsO1-xFx: Effective Hamiltonian from ab initio studies,” Phys. Rev. B 77, 220506 (2008).
- Suzuki et al. (2011) K. Suzuki, H. Usui, and K. Kuroki, “Spin fluctuations and unconventional pairing in KFe2As2,” Phys. Rev. B 84, 144514 (2011).
- Li et al. (2012) W. Li, J. Li, J.-X. Zhu, Y. Chen, and C. S. Ting, “Pairing symmetry in the iron-pnictide superconductor KFe2As2,” EPL 99, 57006 (2012).
- Yoshida et al. (2011) T. Yoshida, I. Nishi, A. Fujimori, M. Yi, R.G. Moore, D.-H. Lu, Z.-X. Shen, K. Kihou, P.M. Shirage, H. Kito, C.H. Lee, A. Iyo, H. Eisaki, and H. Harima, “Fermi surfaces and quasi-particle band dispersions of the iron pnictides superconductor KFe2As2 observed by angle-resolved photoemission spectroscopy,” J. Phys. Chem. Solids 72, 465 (2011).
- Terashima et al. (2013) T. Terashima, N. Kurita, M. Kimata, M. Tomita, S. Tsuchiya, M. Imai, A. Sato, K. Kihou, Ch.-H. Lee, H. Kito, H. Eisaki, A. Iyo, T. Saito, H. Fukazawa, Y. Kohori, H. Harima, and S. Uji, “Fermi surface in KFe2As2 determined via de Haas–van Alphen oscillation measurements,” Phys. Rev. B 87, 224512 (2013).
- Yoshida et al. (2014) T. Yoshida, S.-i. Ideta, I. Nishi, A. Fujimori, M. Yi, R. Moore, S.-K. Mo, D. Lu, Z.-X. Shen, Z. Hussain, K. Kihou, C. H Lee, A. Iyo, H. Eisaki, and H. Harima, “Orbital character and electron correlation effects on two- and three-dimensional Fermi surfaces in KFe2As2 revealed by angle-resolved photoemission spectroscopy,” Front. Phys. 2, 17 (2014).
- Wang et al. (2013) Y. Wang, A. Kreisel, V. B. Zabolotnyy, S. V. Borisenko, B. Büchner, T. A. Maier, P. J. Hirschfeld, and D. J. Scalapino, “Superconducting gap in LiFeAs from three-dimensional spin-fluctuation pairing calculations,” Phys. Rev. B 88, 174516 (2013).
- Kokalj (2003) A. Kokalj, “Computer graphics and graphical user interfaces as tools in simulations of matter at the atomic scale,” Comput. Mater. Sci. 28, 155 (2003).
- Mazin et al. (2008a) I. I. Mazin, M. D. Johannes, L. Boeri, K. Koepernik, and D. J. Singh, “Problems with reconciling density functional theory calculations with experiment in ferropnictides,” Phys. Rev. B 78, 085104 (2008a).
- Singh and Du (2008) D. J. Singh and M.-H. Du, “Density functional study of LaFeAsO1-xFx: A low carrier density superconductor near itinerant magnetism,” Phys. Rev. Lett. 100, 237003 (2008).
- Kuroki et al. (2008) K. Kuroki, S. Onari, R. Arita, H. Usui, Y. Tanaka, H. Kontani, and H. Aoki, “Unconventional pairing originating from the disconnected Fermi surfaces of superconducting LaFeAsO1-xFx,” Phys. Rev. Lett. 101, 087004 (2008).
- Zabidi et al. (2009) N. A. Zabidi, H. Abu Kassim, and K. N. Shrivastava, “The electronic structure band structure of KFe2As2,” AIP Conf. Proc. 1169, 261 (2009).
- Terashima et al. (2010) T. Terashima, M. Kimata, N. Kurita, H. Satsukawa, A. Harada, K. Hazama, M. Imai, A. Sato, K. Kihou, Ch.-H. Lee, H. Kito, H. Eisaki, A. Iyo, T. Saito, H. Fukazawa, Y. Kohori, H. Harima, and S. Uji, “Fermi surface and mass enhancement in KFe2As2 from de haas–van alphen effect measurements,” J. Phys. Soc. Jpn. 79, 053702 (2010).
- Miyake et al. (2010) T. Miyake, K. Nakamura, R. Arita, and M. Imada, “Comparison of ab initio low-energy models for LaFePO, LaFeAsO, BaFe2As2, LiFeAs, FeSe, and FeTe: Electron correlation and covalency,” J. Phys. Soc. Jpn. 79, 044705 (2010).
- Thomale et al. (2011) R. Thomale, Ch. Platt, W. Hanke, J. Hu, and B. A. Bernevig, “Exotic -wave superconducting state of strongly hole-doped KxBa1-xFe2As2,” Phys. Rev. Lett. 107, 117001 (2011).
- Skornyakov et al. (2014) S. L. Skornyakov, V. I. Anisimov, and D. Vollhardt, “Effect of correlations and doping on the spin susceptibility of iron pnictides: the case of KFe2As2,” JETP Letters 100, 120 (2014).
- Evtushinsky et al. (2009) D V Evtushinsky, D S Inosov, V B Zabolotnyy, M S Viazovska, R Khasanov, A Amato, H-H Klauss, H Luetkens, Ch Niedermayer, G L Sun, V Hinkov, C T Lin, A Varykhalov, A Koitzsch, M Knupfer, B Büchner, A A Kordyuk, and S V Borisenko, “Momentum-resolved superconducting gap in the bulk of Ba1-xKxFe2As2 from combined ARPES and SR measurements,” New J. Phys. 11, 055069 (2009).
- Kordyuk (2012) A. A. Kordyuk, “Iron-based superconductors: Magnetism, superconductivity, and electronic structure (Review Article),” Low Temp. Phys. 38, 888 (2012).
- Richard et al. (2011) P Richard, T Sato, K Nakayama, T Takahashi, and H Ding, “Fe-based superconductors: an angle-resolved photoemission spectroscopy perspective,” Rep. Prog. Phys. 74, 124512 (2011).
- Borisenko et al. (2015) S. V. Borisenko, D. V. Evtushinsky, Z.-H. Liu, I. Morozov, R. Kappenberger, S. Wurmehl, B. Büchner, A. N. Yaresko, T. K. Kim, M. Hoesch, T. Wolf, and N. D. Zhigadlo, “Direct observation of spin–orbit coupling in iron-based superconductors,” Nat. Phys. 12, 311 (2015).
- Mizukami et al. (2016) Y. Mizukami, Y. Kawamoto, Y. Shimoyama, S. Kurata, H. Ikeda, T. Wolf, D. A. Zocco, K. Grube, H. v. Löhneysen, Y. Matsuda, and T. Shibauchi, “Evolution of quasiparticle excitations with enhanced electron correlations in superconducting AFe2As2 (A=K, Rb, and Cs),” Phys. Rev. B 94, 024508 (2016).
- Eilers et al. (2016) F. Eilers, K. Grube, D. A. Zocco, T. Wolf, M. Merz, P. Schweiss, R. Heid, R. Eder, R. Yu, J.-X. Zhu, Q. Si, T. Shibauchi, and H. v. Löhneysen, “Strain-driven approach to quantum criticality in AFe2As2 with A=K, Rb, and Cs,” Phys. Rev. Lett. 116, 237003 (2016).
- Subedi et al. (2008) A. Subedi, L. Zhang, D. J. Singh, and M. H. Du, “Density functional study of FeS, FeSe, and FeTe: Electronic structure, magnetism, phonons, and superconductivity,” Phys. Rev. B 78, 134514 (2008).
- Qazilbash et al. (2009) M. M. Qazilbash, J. J. Hamlin, R. E. Baumbach, Lijun Zhang, D. J. Singh, M. B. Maple, and D. N. Basov, “Electronic correlations in the iron pnictides,” Nat. Phys. 5, 647 (2009).
- Aichhorn et al. (2010) M. Aichhorn, S. Biermann, T. Miyake, A. Georges, and M. Imada, “Theoretical evidence for strong correlations and incoherent metallic state in fese,” Phys. Rev. B 82, 064504 (2010).
- Murai et al. (2018) N. Murai, K. Suzuki, S.-i. Ideta, M. Nakajima, K. Tanaka, H. Ikeda, and R. Kajimoto, “Effect of electron correlations on spin excitation bandwidth in Ba0.75K0.25Fe2As2 as seen via time-of-flight inelastic neutron scattering,” Phys. Rev. B 97, 241112 (2018).
- Haule et al. (2008) K. Haule, J. H. Shim, and G. Kotliar, “Correlated electronic structure of LaO1-xFxFeAs,” Phys. Rev. Lett. 100, 226402 (2008).
- Lee et al. (2012) G. Lee, H. S. Ji, Y. Kim, Ch. Kim, K. Haule, G. Kotliar, B. Lee, S. Khim, K. H. Kim, K. S. Kim, K.-S. Kim, and J. H. Shim, “Orbital selective Fermi surface shifts and mechanism of high Tc superconductivity in correlated AFeAs (A=Li,Na),” Phys. Rev. Lett. 109, 177001 (2012).
- Ferber et al. (2012) J. Ferber, K. Foyevtsova, R. Valentí, and H. O. Jeschke, “LDA+DMFT study of the effects of correlation in LiFeAs,” Phys. Rev. B 85, 094505 (2012).
- Backes et al. (2014) S. Backes, D. Guterding, H. O. Jeschke, and R. Valentí, “Electronic structure and de haas–van alphen frequencies in KFe2As2 within LDA+DMFT,” New J. Phys. 16, 083025 (2014).
- Backes et al. (2015) S. Backes, H. O. Jeschke, and R. Valentí, “Microscopic nature of correlations in multiorbital AFe2As2 (A=K,Rb,Cs): Hund’s coupling versus Coulomb repulsion,” Phys. Rev. B 92, 195128 (2015).
- Derondeau et al. (2017) G. Derondeau, F. Bisti, M. Kobayashi, J. Braun, H. Ebert, V. A. Rogalev, M. Shi, T. Schmitt, J. Ma, H. Ding, V. N. Strocov, and . J. Minár, “Fermi surface and effective masses in photoemission response of the (Ba1-xKx)Fe2As2 superconductor,” Sci. Rep. 7, 8787 (2017).
- Yang et al. (2017) R. Yang, Z. Yin, Y. Wang, Y. Dai, H. Miao, B. Xu, X. Qiu, and Ch. C. Homes, “Observation of an emergent coherent state in the iron-based superconductor KFe2As2,” Phys. Rev. B 96, 201108 (2017).
- Yin et al. (2011) Z. P. Yin, K. Haule, and G. Kotliar, “Kinetic frustration and the nature of the magnetic and paramagnetic states in iron pnictides and iron–chalcogenides,” Nat. Mat. 10, 932 (2011).
- Borisenko et al. (2010) S. V. Borisenko, V. B. Zabolotnyy, D. V. Evtushinsky, T. K. Kim, I. V. Morozov, A. N. Yaresko, A. A. Kordyuk, G. Behr, A. Vasiliev, R. Follath, and B. Büchner, “Superconductivity without nesting in LiFeAs,” Phys. Rev. Lett. 105, 067002 (2010).
- Kordyuk et al. (2013) A. A. Kordyuk, V. B. Zabolotnyy, D. V. Evtushinsky, A. N. Yaresko, B. Büchner, and S. V. Borisenko, “Electronic band structure of ferro-pnictide superconductors from ARPES experiment,” J. Supercond. Nov. Magn. 26, 2837 (2013).
- Gonnelli et al. (2016) R. S. Gonnelli, D. Daghero, M. Tortello, G. A. Ummarino, Z. Bukowski, J. Karpinski, P. G. Reuvekamp, R. K. Kremer, G. Profeta, K. Suzuki, and K. Kuroki, “Fermi-surface topological phase transition and horizontal order-parameter nodes in CaFe2As2 under pressure,” Sci. Rep. 6, 26394 (2016).
- Tresca and Profeta (2017) C. Tresca and G. Profeta, “Compressed tetragonal phase in XFe2As2 (X=Na, K, Rb, Cs) and in the alloy Na0.5K0.5Fe2As2,” Phys. Rev. B 95, 165129 (2017).
- Lifshitz (1960) I. M. Lifshitz, “Anomalies of electron characteristics of a metal in the high pressure region,” Zh. Eksp. Teor. Fiz. 38, 1569 (1960), [Sov. Phys. JETP 11, 1130–1135 (1960)].
- Madsen and Singh (2006) G. K.H. Madsen and D. J. Singh, “BoltzTraP. a code for calculating band-structure dependent quantities,” Comput. Phys. Commun. 175, 67 (2006).
- Chubukov et al. (2008) A. V. Chubukov, D. V. Efremov, and I. Eremin, “Magnetism, superconductivity, and pairing symmetry in iron-based superconductors,” Phys. Rev. B 78, 134512 (2008).
- Winiarski et al. (2012) M. J. Winiarski, M. Samsel-Czekała, and A. Ciechan, “Strain effects on the electronic structure of the iron selenide superconductor,” EPL 100, 47005 (2012).
- Bao et al. (2009) W. Bao, Y. Qiu, Q. Huang, M. A. Green, P. Zajdel, M. R. Fitzsimmons, M. Zhernenkov, S. Chang, Minghu Fang, B. Qian, E. K. Vehstedt, Jinhu Yang, H. M. Pham, L. Spinu, and Z. Q. Mao, “Tunable (, )-type antiferromagnetic order in -Fe(Te,Se) superconductors,” Phys. Rev. Lett. 102, 247001 (2009).
- Winiarski et al. (2013) M.J. Winiarski, M. Samsel-Czekała, and A. Ciechan, “Strain effects on the electronic structure of the FeSe0.5Te0.5 superconductor,” J. Alloy. Comp. 566, 187 (2013).
- Rodriguez et al. (2011) E. E. Rodriguez, C. Stock, P. Zajdel, K. L. Krycka, C. F. Majkrzak, P. Zavalij, and M. A. Green, “Magnetic-crystallographic phase diagram of the superconducting parent compound Fe1+xTe,” Phys. Rev. B 84, 064403 (2011).
- Ciechan et al. (2013) A. Ciechan, M. J. Winiarski, and M. Samsel-Czekała, “The substitution effects on electronic structure of iron selenide superconductors,” Intermetallics 41, 44 (2013).
- Chubukov et al. (2016) A. V. Chubukov, M. Khodas, and R. M. Fernandes, “Magnetism, superconductivity, and spontaneous orbital order in iron-based superconductors: Which comes first and why?” Phys. Rev. X 6, 041045 (2016).
- Li and Su (2017) T. Li and Y. Su, “Driving force of the orbital-relevant electronic nematicity in Fe-based superconductors,” J. Phys.: Condens. Matter 29, 425603 (2017).
- Chen et al. (2016) J. Chen, K. Semeniuk, Z. Feng, P. Reiss, P. Brown, Y. Zou, P. W. Logg, G. I. Lampronti, and F. M. Grosche, “Unconventional superconductivity in the layered iron germanide YFe2Ge2,” Phys. Rev. Lett. 116, 127001 (2016).
- Chajewski et al. (2018) G. Chajewski, M. Samsel-Czekała, A. Hackemer, P. Wiśniewski, A.P. Pikul, and D. Kaczorowski, “Superconductivity in YTE2Ge2 compounds (te = d-electron transition metal),” Physica B 536, 767 (2018).
- Scalapino (2012) D. J. Scalapino, “A common thread: The pairing interaction for unconventional superconductors,” Rev. Mod. Phys. 84, 1383 (2012).
- Chubukov (2012) A. Chubukov, “Pairing mechanism in fe-based superconductors,” Annu. Rev. Condens. Matter Phys. 3, 57 (2012).
- Hosono and Kuroki (2015) H. Hosono and K. Kuroki, “Iron-based superconductors: Current status of materials and pairing mechanism,” Physica C 514, 399 (2015).
- Mazin et al. (2008b) I. I. Mazin, D. J. Singh, M. D. Johannes, and M. H. Du, “Unconventional superconductivity with a sign reversal in the order parameter of LaFeAsO1-xFx,” Phys. Rev. Lett. 101, 057003 (2008b).
- Ikeda et al. (2010) H. Ikeda, R. Arita, and J. Kuneš, “Phase diagram and gap anisotropy in iron-pnictide superconductors,” Phys. Rev. B 81, 054502 (2010).
- Wang et al. (2015) Y. Wang, T. Berlijn, P. J. Hirschfeld, D. J. Scalapino, and T. A. Maier, “Glide-plane symmetry and superconducting gap structure of iron-based superconductors,” Phys. Rev. Lett. 114, 107002 (2015).
- Hirschfeld et al. (2011) P. J. Hirschfeld, M. M. Korshunov, and I. I. Mazin, “Gap symmetry and structure of Fe-based superconductors,” Rep. Prog. Phys. 74, 124508 (2011).
- Bang and Stewart (2017) Y. Bang and G. R. Stewart, “Superconducting properties of the s±-wave state: Fe-based superconductors,” J. Phys.: Condens. Matter 29, 123003 (2017).
- Okazaki et al. (2012) K. Okazaki, Y. Ota, Y. Kotani, W. Malaeb, Y. Ishida, T. Shimojima, T. Kiss, S. Watanabe, C.-T. Chen, K. Kihou, C. H. Lee, A. Iyo, H. Eisaki, T. Saito, H. Fukazawa, Y. Kohori, K. Hashimoto, T. Shibauchi, Y. Matsuda, H. Ikeda, H. Miyahara, R. Arita, A. Chainani, and S. Shin, “Octet-line node structure of superconducting order parameter in KFe2As2,” Science 337, 1314 (2012).
- Hashimoto et al. (2010) K. Hashimoto, A. Serafin, S. Tonegawa, R. Katsumata, R. Okazaki, T. Saito, H. Fukazawa, Y. Kohori, K. Kihou, C. H. Lee, A. Iyo, H. Eisaki, H. Ikeda, Y. Matsuda, A. Carrington, and T. Shibauchi, “Evidence for superconducting gap nodes in the zone-centered hole bands of KFe2As2 from magnetic penetration-depth measurements,” Phys. Rev. B 82, 014526 (2010).
- Watanabe et al. (2014) D. Watanabe, T. Yamashita, Y. Kawamoto, S. Kurata, Y. Mizukami, T. Ohta, S. Kasahara, M. Yamashita, T. Saito, H. Fukazawa, Y. Kohori, S. Ishida, K. Kihou, C. H. Lee, A. Iyo, H. Eisaki, A. B. Vorontsov, T. Shibauchi, and Y. Matsuda, “Doping evolution of the quasiparticle excitations in heavily hole-doped Ba1-xKxFe2As2: A possible superconducting gap with sign-reversal between hole pockets,” Phys. Rev. B 89, 115112 (2014).
- Reid et al. (2012) J.-Ph. Reid, M. A. Tanatar, A. Juneau-Fecteau, R. T. Gordon, S. René de Cotret, N. Doiron-Leyraud, T. Saito, H. Fukazawa, Y. Kohori, K. Kihou, C. H. Lee, A. Iyo, H. Eisaki, R. Prozorov, and L. Taillefer, “Universal heat conduction in the iron arsenide superconductor KFe2As2: Evidence of a -wave state,” Phys. Rev. Lett. 109, 087001 (2012).
- Dong et al. (2010) J. K. Dong, S. Y. Zhou, T. Y. Guan, H. Zhang, Y. F. Dai, X. Qiu, X. F. Wang, Y. He, X. H. Chen, and S. Y. Li, “Quantum criticality and nodal superconductivity in the feas-based superconductor KFe2As2,” Phys. Rev. Lett. 104, 087005 (2010).
- Terashima et al. (2014) T. Terashima, K. Kihou, K. Sugii, N. Kikugawa, T. Matsumoto, S. Ishida, Ch.-H. Lee, A. Iyo, H. Eisaki, and S. Uji, “Two distinct superconducting states in KFe2As2 under high pressure,” Phys. Rev. B 89, 134520 (2014).
- Grinenko et al. (2014) V. Grinenko, W. Schottenhamel, A. U. B. Wolter, D. V. Efremov, S.-L. Drechsler, S. Aswartham, M. Kumar, S. Wurmehl, M. Roslova, I. V. Morozov, B. Holzapfel, B. Büchner, E. Ahrens, S. I. Troyanov, S. Köhler, E. Gati, S. Knöner, N. H. Hoang, M. Lang, F. Ricci, and G. Profeta, “Superconducting properties of K1-xNaxFe2As2 under pressure,” Phys. Rev. B 90, 094511 (2014).
- Evtushinsky et al. (2014) D. V. Evtushinsky, V. B. Zabolotnyy, T. K. Kim, A. A. Kordyuk, A. N. Yaresko, J. Maletz, S. Aswartham, S. Wurmehl, A. V. Boris, D. L. Sun, C. T. Lin, B. Shen, H. H. Wen, A. Varykhalov, R. Follath, B. Büchner, and S. V. Borisenko, “Strong electron pairing at the iron 3 orbitals in hole-doped BaFe2As2 superconductors revealed by angle-resolved photoemission spectroscopy,” Phys. Rev. B 89, 064514 (2014).
- Wdowik et al. (2015) U. D. Wdowik, G. Jagło, and P. Piekarz, “Effect of ferromagnetic ordering on phonons in KCo2Se2,” J. Phys.: Condens. Matter 27, 415403 (2015).
- Rahlenbeck et al. (2009) M. Rahlenbeck, G. L. Sun, D. L. Sun, C. T. Lin, B. Keimer, and C. Ulrich, “Phonon anomalies in pure and underdoped R1-xKxFe2As2 (R=Ba, Sr) investigated by raman light scattering,” Phys. Rev. B 80, 064509 (2009).
- Böhm et al. (2014) T. Böhm, A. F. Kemper, B. Moritz, F. Kretzschmar, B. Muschler, H.-M. Eiter, R. Hackl, T. P. Devereaux, D. J. Scalapino, and Hai-Hu Wen, “Balancing act: Evidence for a strong subdominant d-wave pairing channel in Ba0.6K0.4Fe2As2,” Phys. Rev. X 4, 041046 (2014).
- Um et al. (2012) Y. J. Um, A. Subedi, P. Toulemonde, A. Y. Ganin, L. Boeri, M. Rahlenbeck, Y. Liu, C. T. Lin, S. J. E. Carlsson, A. Sulpice, M. J. Rosseinsky, B. Keimer, and M. Le Tacon, “Anomalous dependence of -axis polarized Fe B1g phonon mode with Fe and Se concentrations in Fe1+yTe1-xSex,” Phys. Rev. B 85, 064519 (2012).
- Mittal et al. (2008) R. Mittal, Y. Su, S. Rols, M. Tegel, S. L. Chaplot, H. Schober, T. Chatterji, D. Johrendt, and Th. Brueckel, “Phonon dynamics in Sr0.6K0.4Fe2As2 and Ca0.6Na0.4Fe2As2 from neutron scattering and lattice-dynamical calculations,” Phys. Rev. B 78, 224518 (2008).
- Boeri et al. (2008) L. Boeri, O. V. Dolgov, and A. A. Golubov, “Is LaFeAsO1-xFx an electron-phonon superconductor?” Phys. Rev. Lett. 101, 026403 (2008).
- Naidyuk et al. (2014) Yu. G. Naidyuk, O. E. Kvitnitskaya, N. V. Gamayunova, L. Boeri, S. Aswartham, S. Wurmehl, B. Büchner, D. V. Efremov, G. Fuchs, and S.-L. Drechsler, “Single 20 mev boson mode in kfe2as2 detected by point-contact spectroscopy,” Phys. Rev. B 90, 094505 (2014).
- Boeri et al. (2010) L. Boeri, M. Calandra, I. I. Mazin, O. V. Dolgov, and F. Mauri, “Effects of magnetism and doping on the electron-phonon coupling in BaFe2As2,” Phys. Rev. B 82, 020506 (2010).