IRIDIUM SATELLITE SIGNALS: A CASE STUDY IN INTERFERENCE CHARACTERIZATION AND MITIGATION FOR RADIO ASTRONOMY OBSERVATIONS
Abstract
Several post-detection approaches to the mitigation of radio-frequency interference (RFI) are compared by applying them to the strong RFI from the Iridium satellites. These provide estimates for the desired signal in the presence of RFI, by exploiting distinguishing characteristics of the RFI, such as its polarization, statistics, and periodicity. Our data are dynamic spectra with full Stokes parameters and 1 ms time resolution. Moreover, since most man-made RFI is strongly polarized, we use the data to compare its unpolarized component with its Stokes I. This approach on its own reduces the RFI intensity by many tens of dBs. A comprehensive approach that also recognizes non-Gaussian statistics, and the time and frequency structure inherent in the RFI permits exceedingly effective post-detection excision provided full Stokes intensity data are available.
keywords:
methods: data analysis, radio lines: general, radio-frequency interference, techniques: polarimetric1Avinash Deshpande desh@rri.res.in
1 INTRODUCTION
Some sources of radio frequency interference (RFI) are inescapable. While radio astronomers can minimize the effects of many terrestrial sources by placing their telescopes at remote sites, none can escape from RFI generated by satellite transmitters, such as those of the Iridium System. So astronomers are now studying a variety of diverse approaches to mitigating the effects of RFI on their observations (Ellingson 2005, and references therein). The pre-detection approaches to RFI excision relate to those applied to time sequence of signal voltage; that is before the stage of square-law detection or translation to intensity, such that signal phase information is still available. On the other hand, the post-detection RFI mitigation methods are relevant to a more commonly available form of data sets of intensity, estimated in general as a function of time and frequency, that is dynamic spectra with desired temporal and spectral resolutions and spans. More broadly, the post-detection data refer to any quantity proportional to average intensity, such as estimates of cross-correlation of signal voltage sequences from two elements of an interferometer or from two orthogonal polarization feed antennas, which preserves only the relative phase between the correlated signals.
Some of these exploit particular characteristics of specific sources of RFI, such as its location, if from a geostationary satellite, or its polarization. Indeed, since man-made signals are highly polarized, whereas the inherent nature of most astronomical signals is unpolarized, Deshpande (2005) proposed the use of a mitigation technique based on the unpolarized, relatively RFI-free signal. In this paper, we compare and contrast this approach with several other post-detection approaches to the identification and mitigation of RFI originating from the Iridium System.
2 OBSERVATIONS
The International Telegraphic Union (ITU) granted the Radio Astronomy Service (RAS) primary status in the 1610.6-1613.8 MHz band in 1992 to observe the 1612.235 MHz spectral line emission from the hydroxyl molecule (OH). This is typically emitted by OH/IR stars111 These are Asymptotic Giant Branch (AGB) stars that show strong OH maser emission and are unusually bright in near-infrared (IR). (see Lewis, Eder & Terzian 1985) as a pair of narrow features, with the allocated band sized to allow for Doppler shifts of the emission, as well as guard-band separation from ITU Services using adjacent spectrum. One such is the Iridium L-Band system, which presently uses a 1618.85-1626.5 MHz allocation. But this system also produces a comb of RFI, with a characteristic 333 kHz spacing (often with 8 times finer sub-spacing), extending well beyond its licensed band. The 1 Jy intensity of this comb in the RAS band for most Observatories is comparable with the signal from many of the brighter OH/IR stars. No pre-launch simulation available to the ITU or to radio-astronomers gave any hint of the existence of this noxious artifact when the System was granted spectrum. Hence the need now for RFI mitigation.
This study was made using the highly sensitive 305 m Arecibo telescope, which has 80 dB of forward gain and thus a narrow main beam. Accordingly the 66 active, low-earth-orbit satellites from the Iridium System are only generally seen at Arecibo in distant sidelobes: that lessens their impact on our observations. As most of Iridium’s customers near Puerto Rico are on yachts, local terrain generally screens us from their up-link signals. Moreover as the Iridium System is lightly loaded in the Caribbean it emits few inter-modulation products in the signal received at Arecibo from interactions within a satellite’s own components.
Iridium uses a frequency multiplexed – time multiplexed operational mode. This gives two helpful features, as the signal is strongly polarized (more specifically, has right-hand circular polarization), and, more unusually, has a satellite down-link time-multiplexed in exactly the same band as the phone handset up-link signal. Each Iridium satellite operates on a 90 ms cycle, with half assigned to the up-link, and half to the downlink. That allows the folding of our data at a secondary period of 180 ms, or twice the basic cycle. The timing operations of the entire Iridium constellation is governed by the System’s most intense signal, the 1626 MHz clock synchronization signal.
Our aim here is to explore and quantify how well the effect of RFI can be attenuated while estimating our desired signal. For this purpose, we need to clearly recognize aspects in which our signal differs from contaminating RFI, based on which the two can be separated. How well such separation is achieved in practice in the presence of inherent uncertainty in estimation of relevant quantities, will decide the effectiveness of the RFI mitigation. Here, we exploit distinguishing characteristics in aspects such as polarization, statistics, and periodicity, in addition to differences in structure across time and frequency. In the discussion to follow, we compare the effectiveness of these criteria when applied in isolation, as well as in combination.
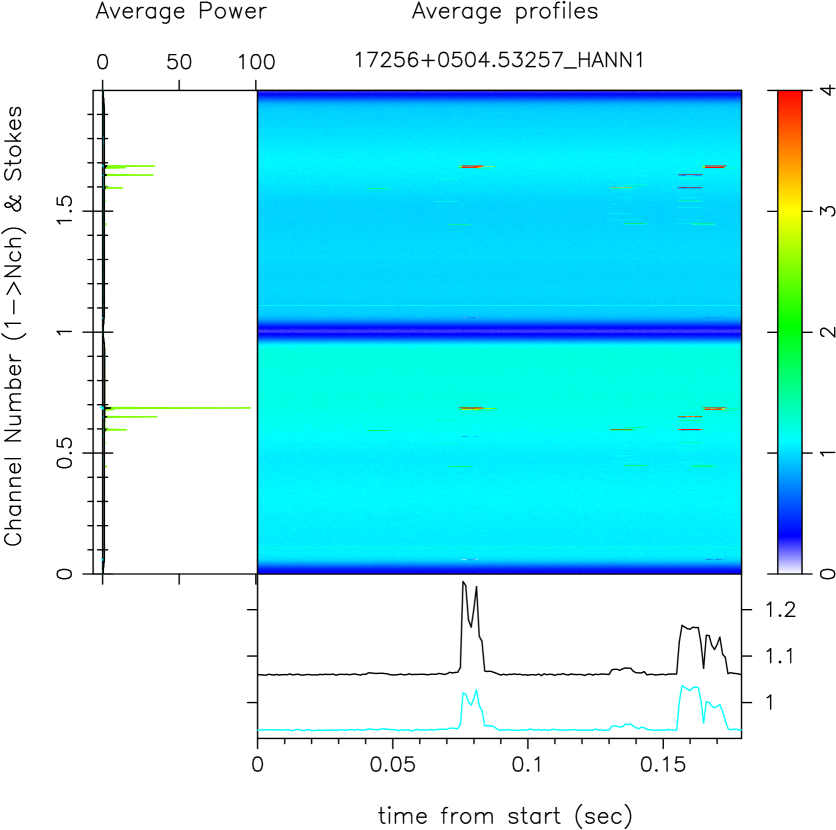
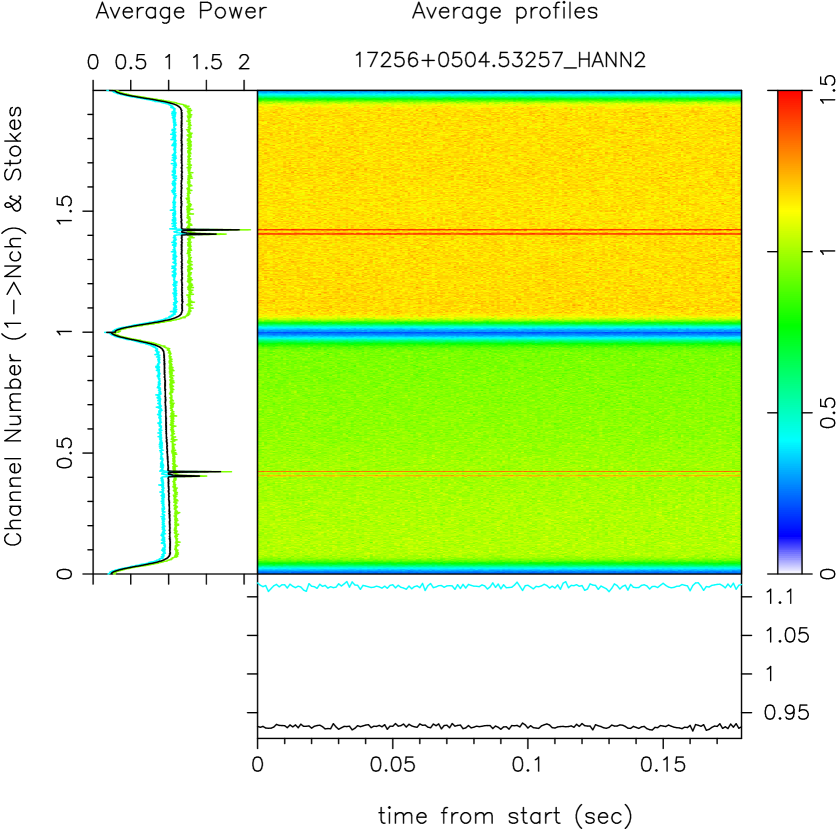
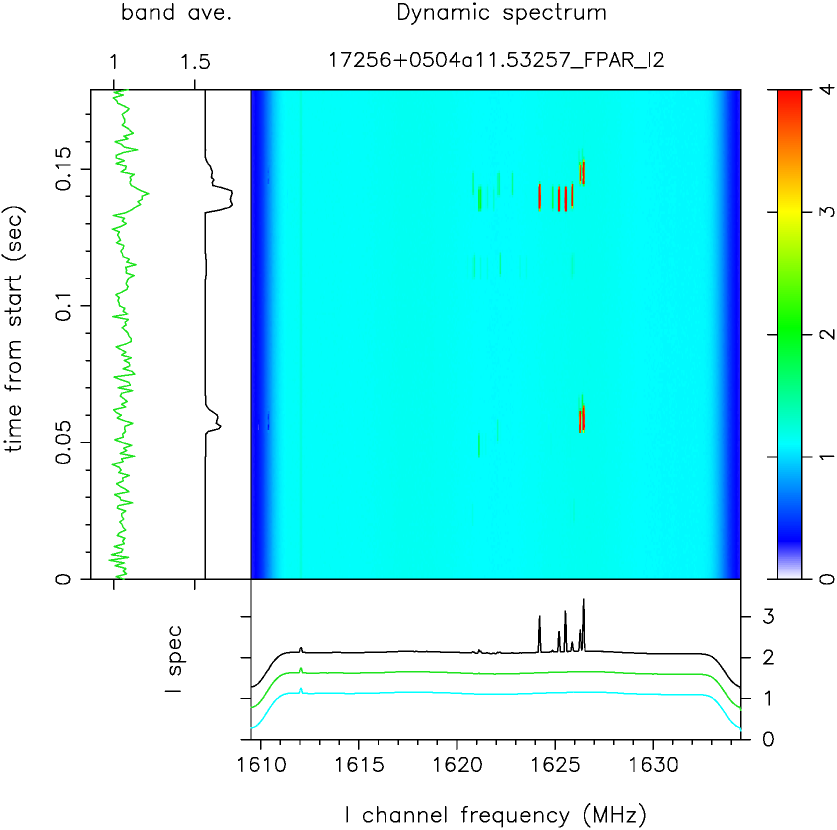
Our data were acquired with full Stokes (I, Q, U, V) parameters as high time-resolution, single-dish spectra. Dynamic 1024 channel spectra were recorded every millisecond using the 9-level sampling mode of an auto-correlator simultaneously in both the Iridium band, using a 25 MHz bandwidth centered at 1622 MHz, and in the RAS band using a 3.125 MHz bandwidth with proportionately finer spectral resolution. Figures 1 and 2 show examples of typical dual-polarization channel dynamic spectra for the broad and the narrow bands, respectively, obtained from the recorded auto-correlations after Hanning smoothing. As can be seen from Fig. 1, the peak intensities of Iridium RFI in some of the spectral channels (see the green peaks in the left side panel) can be orders of magnitude larger than the average spectral contribution dictated by the system temperature. Fortunately, the spectral dilution (typically by the number of spectral channels, which is here 1024) leads to a total power (or band-averaged power) increase of only 10-20%. The RAS band spectra in Fig. 2 (shown for the same time interval as in Fig. 1), on the other hand, are contrastingly mostly free of the Iridium RFI. This does indeed document the absence any RFI into the RAS band in the form of a 333 kHz comb, thanks to the Iridium system being lightly loaded in the Caribbean region. Hence, we will focus hereafter on the mitigation of RFI in the Iridium band itself, although the same techniques are equally applicable to RFI mitigation in the RAS band.
The data were checked for inter-modulation products and gain-compression effects induced in the receiving system by the Iridium signal by generating correlation maps (following Deshpande 2005). These accumulate the net temporal correlation between fluctuations in every possible combination of spectral channels from every possible pairing of spectra: they are produced as cross-correlations between spectra in the native linears, in I, in the unpolarized flux, ( = ), as well as between the two observed bandwidths, and as autocorrelations of spectra. After folding 2 minutes of data at the period of the Iridium clock cycle, the only Iridium artifacts in our RAS band data are momentary gain compression episodes (see Deshpande & Lewis 2005). Hence, it is not surprising that in this band, the statistical measures (such as the average spectrum and the rms values of the noise) during the cycle phases corresponding to the Iridium RFI are found to be very similar to those for the rest of the cycle (without the RFI).
The intensity of the Iridium clock synchronization signal (at 1626 MHz) generates some ringing in the adjacent spectrum, despite our nine-level sampling, so our data is always Hanning smoothed, as, for instance, in Figures 1,2,3. Detailed channel by channel examination of the data, shows that there is still a noticeable under-correction of data in frequency bins immediately before and after the synchronization impulse, and we find that this exaggerates the residuals in comparisons with : data in Figures 5 & 6 are therefore Hanning smoothed twice. The bandpass gain calibration is applied to the linear polarization data before computing Q & from the Stokes I, Q, U, & V of each channel of each spectrum as = (where the polarized component is estimated as = ), which reduces the residuals from .
3 MITIGATING
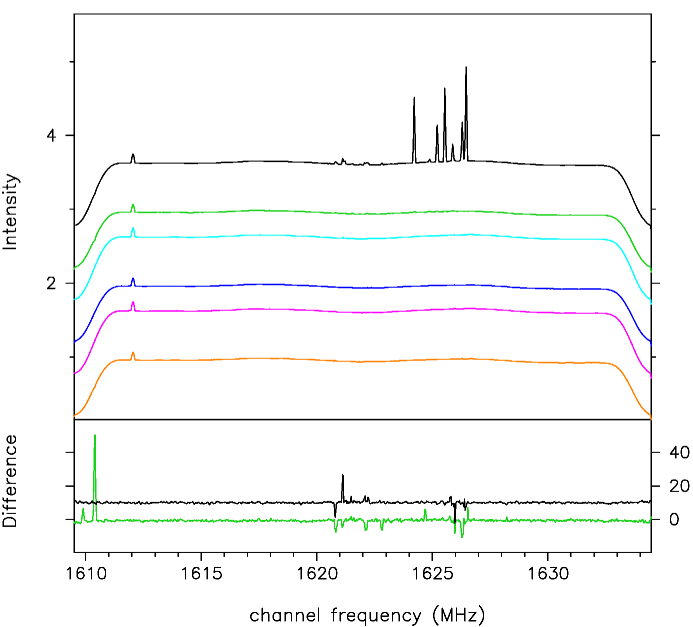
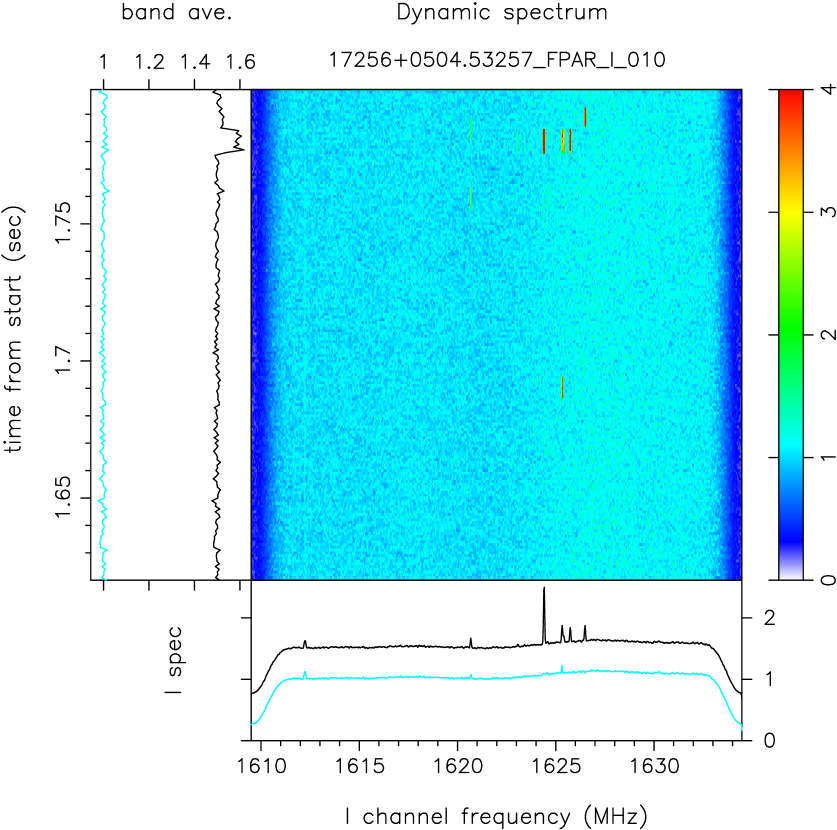
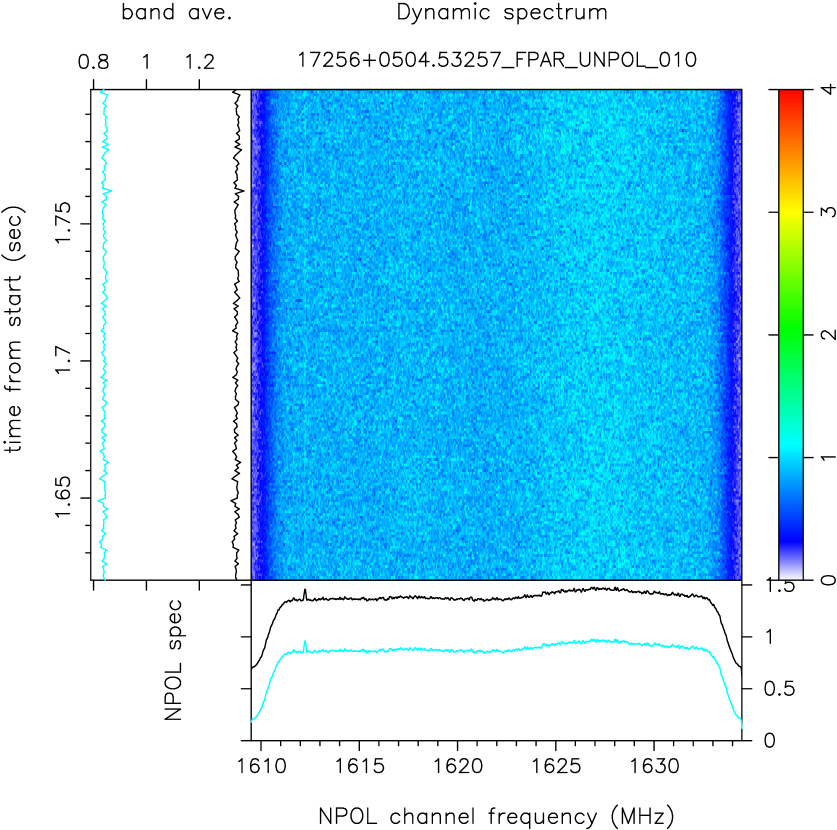
All of the Figures, except Fig.2, use 25 MHz bandwidth data obtained towards the OH/IR star IRAS 17256+0504 on 9th September 2004 (azimuth and zenith angle of 330 and 15, respectively). Fig. 3 shows a typical, 180 ms (two-cycle) sequence of Stokes I spectra with the OH/IR star at 1612 MHz and Iridium’s signal between 1620-1627 MHz. The mean side-lobe response of the strongest Iridium Stokes I feature here, which is only seen for 5% of the time, has 7 times the intensity of our strong OH/IR star which is seen with the main beam. So Iridium can easily saturate an astronomical receiver (for examples, see Deshpande & Lewis 2005). Perhaps the simplest mitigation approach is to use the robust mean222 Robust mean and robust rms refer to respectively the arithmetic mean and the standard deviation associated with a distribution of an ensemble of values after excluding identifiable outliers from the ensemble. Outliers are the samples with values outside the expected range , where defines the threshold in units of on either side of the mean. For an ensemble of size , the can be specified such that the probability of value being outside the above range is less than 1/N, for a Gaussian distribution. An iterative procedure refining the ensemble is expected to converge in a few iterations., which only discriminates against obviously non-Gaussian components in a series. It is computed from (and may modify) the temporal sequence of each frequency channel. While the robust mean excises most of the strong RFI in Fig. 3, though leaving a clear residue in the average spectrum circa 1621 & 1625.5 MHz and a broad, slight one circa 1624.5 MHz, the vertical panel shows that it otherwise tracks I. The residues from the robust mean in the average spectrum in effect arise from integrating up features below the robust threshold. On the other hand a similar plot, as in Fig. 4, for the second mitigation approach using shows no evident sign of an Iridium signal. So over short, one-on-one, time comparisons appears to provide better mitigation, and its output is improved further by applying a robust mean. Yet the efficacy of relies on the estimation of the polarized component , which is both over-estimated (due to direct contribution from variance of random noise in the , and on squaring) and least accurate for weak features: indeed the strongest RFI features are the most accurately excised, as the estimation of the polarized flux is then done with the best S/N, while that of the weakest is subject to a statistical bias, for which no allowance is made here. And also leaves residuals when the apparent polarization of RFI is reduced as a result of depolarization due to averaging of different polarization states (such as while folding), as Fig. 5 shows at 1622 MHz, and Fig. 6 for features circa 1624 & 1626 MHz. Apparent reduction in fractional polarization could result from poor calibration of the Stokes parameters, due to uncertainties in the relative (complex) gains, as well as due to saturation-induced gain calibration errors, if any.
But folding spectra, as Fig. 5 does, permits both weak RFI features below the robust mean’s threshold and, as the second panel in Fig. 6 shows, any coherent distortions in the estimation of , to emerge from the noise. Finally the folded spectra of Fig. 5 offer a third approach to mitigation, as portions of the Iridium cycle without RFI are readily identified from its left-hand panel. We select “RFI-free” spectra by additionally requiring that their integrated total power lies within 3 of the mean of the set. Figures 5 & 6 include RFI-free means.
Fig. 6 enables the integrated-up, coherent deviations to be exhibited. It shows that much the largest deviation occurs in on the ascending edge of the bandpass at 1610.5 MHz, near a resonance in the ortho-mode transducer where the polarization properties of the receiver change rapidly. Since its specific properties were not addressed here, we discount it. All of the other excursions in the difference sets occur in the vicinity of evident RFI, with the strongest (circa 1621 MHz) linked to weak RFI in both the robust and unpolarized means, and the largest linked to the robust means. Nevertheless there are no systematic deviations in either approach over most of the spectrum. Table 1 shows the attenuation in dB achieved with the features in Fig. 6. It should be noted that the Iridium data stream is more than usually amenable to treatment by the robust approach on its own, as its occupancy of its band is both episodic and less than 50%. In cases where strong RFI has a much larger fractional occupancy, so there is little uncontaminated data, the robust mean on its own will fail, whereas that situation is usually greatly improved if is appropriate and available.
[h] Attenuation achieved on the 9 Stokes I features in Fig. 6 in order of increasing frequency. \toprulemethod (dB) 1 2 3 4 5 6 7 8 9 \colrulerobust -32 -33 -29 -29 -34 -15 -43 -19 -09 unpolarized () -32 -22 -14 -21 -18 -08 -20 -08 -13 + robust -32 -28 -38 -27 -28 -15 -33 -18 -23 \botrule
Our analysis has been carried through on a data stream corrected for the polarized flux estimate on the time-scale of the shortest integrations, which is usually the worst case. This processing could be adjusted to improve on Hanning smoothing, and by using statistical bias corrections. It could also be better adapted to the needs of spectral-line observers, by iterating the analysis on data processed for longer integration times generated after synchronously averaging the dynamic spectra from each sub-interval within the Iridium cycle. On the other hand when only a band-averaged power level measurement is wanted, any source of narrow-band RFI can be attenuated by a further 15 dB, which is the factor granted by the square root of the number of spectral channels being averaged.
In summary, we find that a comprehensive approach which recognizes the inherent time, frequency and polarization structure of an RFI source allows for its exceedingly effective excision in the post-detection stage when full Stokes data with suitable time and frequency resolutions are available.
Acknowledgments
This work was supported by the Arecibo Observatory, which was then operated by Cornell University on behalf of the National Science Foundation under a cooperative management agreement.
References
- Ellingson (2005) Ellingson, S. W. [2005] Radio Science 40 (5), RS5S01.
- Deshpande (2005) Deshpande, A. A. [2005] Radio Science 40 (5), RS5S12.
- Deshpande and Lewis (2005) Deshpande, A. A. & Lewis, B. M. [2005] Supplementary plots at http://www.naic.edu/desh/IRIDIUM
- Lewis, Eder & Terzian (1985) Lewis, B. M., Eder, J. & Terzian, Y. [1985], Nature, 313, 200.