When does the onset of multiple stellar populations in star clusters occur? Detection of enriched stellar populations in NGC 2121
Abstract
Star-to-star light-element abundance variations, know as multiple stellar populations (MPs), are common in almost all Galactic globular clusters. Recently, MPs have also been detected in a number of massive clusters with ages in excess of 2 Gyr in the Large Magellanic Cloud (LMC), thus indicating that age is likely a control parameter for the presence of MPs. However, to conclusively confirm this notion, additional studies of star clusters in the LMC’s ‘age gap’ of 3–6 Gyr are required. Here, we use Hubble Space Telescope observations to study the 3 Gyr-old cluster NGC 2121. Compared with so-called ‘simple’ stellar population models, the cluster’s red-giant branch exhibits an apparent spread in a specific color index that is sensitive to intrinsic chemical spreads. The observed spread can be explained by an intrinsic spread in nitrogen abundance of 0.5–1.0 dex. NGC 2121 has a comparable mass to its younger counterparts without MPs, indicating that cluster mass might not be the dominant parameter controlling the presence of MPs. The transition phase between the occurrence of clusters with or without MPs seems to occur at ages of 2–3 Gyr, indicating that cluster age may play a dominant role in the establishment of MPs.
1 Introduction
The notion that all star clusters are simple stellar populations (SSPs), with color–magnitude diagrams (CMDs) described by a single isochrone of fixed age and metallicity, is a view of the past. Current observations show that almost all Galactic globular clusters (GCs) are composed of multiple stellar populations (MPs), exhibiting multiple subgiant branches (SGBs; Piotto et al., 2012), red-giant branches (RGBs; Piotto et al., 2015), main sequences (MSs; Piotto et al., 2007), and sometimes combinations of these features. Spectroscopic studies have demonstrated conclusively that such multiple features can be explained by star-to-star chemical variations, including spreads in C, N, O, Na, Mg, Al, and in some cases iron content (Cannon et al., 1998; Carretta et al., 2009; Marino et al., 2009; Pancino et al., 2017). Although common in GCs, variations in the light elements are rarely found in the field or in open clusters (e.g., MacLean et al., 2015). Sometimes, chemically enriched field stars also have kinematics that are similar to those of GCs (Tang et al., 2019). These results all lead to the suggestion that GCs represent the only known environment that appears capable of producing enriched stellar populations.
Various models for the origin of MPs have been proposed (e.g., Meynet et al., 2006; Decressin et al., 2007; D’Ercole et al., 2008; Denissenkov & Hartwick, 2014; Bekki, 2017). Most draw on self-pollution of the intra-cluster gas during the early stages of cluster evolution, and they all identify massive single or binary stars as the main polluters. All of these models imply that the total cluster mass is the key parameter that controls the appearance and significance of MPs: after all, the more massive the cluster is, the deeper is its gravitational potential well capable of accreting the polluted intra-cluster gas.
Although this correlation between the significance of the MPs and cluster mass has been confirmed for old Galactic GCs (Milone et al., 2017), it is unclear if the fraction of the enriched population also correlates with cluster mass in other galaxies. First, the fractions of enriched stars in extragalactic clusters are highly uncertain (Niederhofer et al., 2017). In addition, to date only the stellar populations in clusters of satellite galaxies (e.g., in the Large and Small Magellanic Clouds (LMC and SMC) or the Fornax dwarf; Martocchia et al., 2018) have been resolved; most of these clusters are younger than the Galactic GCs (Larsen et al., 2014; Dalessandro et al., 2016; Martocchia et al., 2018). Since clusters will lose mass during their evolution, younger clusters with comparable masses to those of the Galactic GCs will eventually evolve to become less massive than most GCs by the time they reach similar ages. The 2.2 Gyr-old LMC cluster NGC 1978 is, thus far, the youngest cluster known to exhibit MPs (Martocchia et al., 2018). Intriguingly, its slightly younger, 1–2 Gyr-old counterparts appear to be fully chemically homogeneous (e.g., NGC 1806; Mucciarelli et al., 2014). These results suggest that age might be another important factor controlling the appearance of MPs.
One popular hypothesis suggests that the observed MPs may have formed through non-standard stellar evolutionary effects associated with stellar rotation (e.g., Bastian & Lardo, 2018). Most clusters younger than 2 Gyr exhibit extended main-sequence turn-off regions (eMSTOs) in their CMDs (e.g., Milone et al., 2009; Cordoni et al., 2018), which are likely caused by differential stellar rotation (Cordoni et al., 2018). Note, however, that MPs seem to occur at ages where the eMSTOs have already disappeared. Martocchia et al. (2018) suggest that magnetic fields may play a role in generating chemical anomalies. They suggest that MPs might be a specific feature of low-mass stars featuring strong magnetic fields. Such stars cannot be rapidly rotating because of magnetic braking (Cardini & Cassatella, 2007). This hypothesis, although as yet speculative, implies that older clusters without eMSTOs should exhibit MPs.
To date, NGC 1978 is the only known cluster exhibiting MPs that is younger than 3 Gyr. The stellar populations of clusters with ages between 3 and 6 Gyr are still poorly studied, however. To determine the exact age of the onset of MPs, it is important to study clusters with ages in the LMC’s so-called ‘age gap’ between 3 and 6 Gyr (Piatti et al., 2002). NGC 2121 is one of the few suitable clusters in this context. The most recent dedicated study of NGC 2121 dates from 18 years ago (Rich et al., 2001). Its authors derived a cluster age of Gyr, with a metallicity of only one-quarter solar ([Fe/H] = dex). In addition, unlike most intermediate-age LMC clusters (e.g., Milone et al., 2009), NGC 2121 exhibits a sharp MSTO, indicating that most of its member stars are non- or slowly rotating stars, which in turn implies that most have been affected by magnetic braking. NGC 2121 thus provides a unique case to (i) examine whether the occurrence of MPs is a specific feature associated with low-mass stars (since the masses of the RGB and MS turn-off stars in NGC 2121 have decreased to below the critical mass for magnetic braking to cease being important), and (ii) constrain the age range associated with the onset of MPs.
In this paper, we examine whether NGC 2121 hosts MPs among its RGB population. Using ultraviolet (UV)–optical–infrared (IR) observations obtained with the Hubble Space Telescope (HST), we will show that MPs are indeed present along the cluster’s RGB. This paper is organized as follows. In Section 2 we introduce our data reduction. In Section 3 we summarize our analysis approach and present our main results. We also compare our results with SSP models. In Section 4 we present a discussion and our conclusions.
2 Data Reduction
We use observations obtained with both the HST’s Ultraviolet and Visual Channel of the Wide Field Camera 3 (UVIS/WFC3) and the Wide Field and Planetary Camera (WFPC2). The UVIS/WFC3 images obtained from the HST Data Archive were observed through the F343N and F438W passbands (program ID: GO-15062, PI: N. Bastian), while the WFPC2 images provide the corresponding observations in the F555W and F814W passbands (program ID: GO-8141, PI: R. M. Rich). The UVIS/WFC3 data set is composed of three frames taken through the F343N passband, with exposure times of 540 s and 1060 s (twice), as well as three frames taken through the F438W passband, with exposure times of 120 s and 550 s (twice). For both the F555W and F814W passbands, the WFPC2 data set contains four frames each, for each frame, the exposure time is 400 s.
Similarly to our previous papers (e.g., Li et al., 2017), we applied point-spread-function (PSF) photometry to the ‘_flt’ and ‘_c0f’ frames based on the standard recipes recommended by the Dolphot2.0 package (Dolphin., 2011a, b, 2013). Dolphot2.0 is a photometric package specifically designed for HST photometric analysis. We use its WFC3 and WFPC2 modules to deal with the relevant observational data. They include built-in charge-transfer efficiency corrections and photometric calibration routines such as aperture and zeropoint corrections. Dolphot2.0 has been validated extensively; it is one of the most powerful tools for HST photometric analyses (e.g., Monelli et al., 2010).
In our photometry, only objects meeting the following criteria were selected as ‘good’ stars: (1) flagged by Dolphot2.0 as a ‘bright star.’ (2) Not centrally saturated. (3) Sharpness is between 0.3 and 0.3. (4) Crowding parameter . Our photometric approach resulted in identification of 19,507 and 10,915 stars in the UVIS/WFC3 and WFPC2 frames, respectively. We carefully combined both output catalogs by cross-matching the stars in common. Our final, combined stellar catalog contains 6856 stars.
3 Main Results
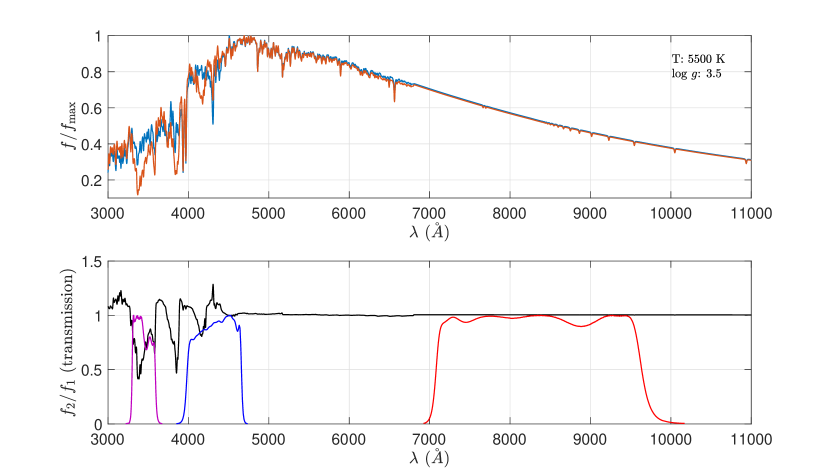
The most salient feature of the MPs in most GCs and intermediate-age clusters is the star-to-star variations in light elements (e.g., C, N, O, Na). Stars in these clusters usually have different C, N, and He abundances, and variations in these elements could broaden or split the clusters’ RGBs. Specifically, an N spread would strengthen the NH molecular feature at Å, thus causing a variable RGB morphology in CMDs partially defined by UV filters (specifically, F343N). In addition, the HST’s F438W passband includes the CH absorption feature (Å). Pristine and enriched stellar populations will exhibit different F343NF438W colors owing to their different N (and, to a lesser extent, C) abundances. N-rich stars will appear redder than N-poor stars. On the other hand, since N-rich stars should, in principle, also be He-rich, they are generally hotter than He-poor stars of the same luminosity. Helium variations among cluster member stars could thus also be revealed by examination of their F438WF814W colors. This is illustrated in Figure 1: in the top panel we show two model spectra for stars at the base of the RGB, with normal and enriched nitrogen abundances ([Fe/H]=0.65 dex, [N/Fe]=1.0 dex). For the model characterized by an enriched nitrogen abundance, we also reduced its carbon and oxygen abundances so that the total CNO abundance does not vary (i.e., [C+N+O/Fe]=0 dex). Our model spectra were calculated using the Spectrum 2.77 package (Gray & Corbally, 1994)111http://www.appstate.edu/~grayro/spectrum/spectrum.html and based on the ATLAS9 stellar atmosphere models (Kurucz, 1970, 1993)
We note that the RGB of NGC 2121 is severely contaminated by a young field-star population in CMDs involving the F343N and F438W filters. This problem can only be ameliorated by introducing additional observations in the F814W passband (i.e., the WFPC2 observations). Figure 2 shows three CMDs involving the F343N, F438W, and F555W passbands. At first glance, we find that although the cluster’s RGB is tight in the F438W–F814W vs F438W (middle) and F555W–F814W vs F555W (right) CMDs, it shows a moderate broadening in the F343N–F814W vs F343N CMD (left).
To quantify any broadening of the RGB caused by chemical variations, we simulated multi-band photometry of our target cluster. We first used the MESA Isochrone and Stellar Tracks (MIST; Paxton et al., 2011, 2013, 2015; Choi et al., 2016; Dotter, 2016) models to generate the best-fitting isochrones representative of the observations. Recently, Barker & Paust (2018) reported a problem associated with isochrone fitting to HST photometry in UV–optical–IR passbands. This problem has also been recognized by the community at large (e.g., Gontcharov et al., 2019; Howes et al., 2019). Specifically, model parameters determined through isochrone fitting to the optical–IR CMD cannot be used to adequately describe photometric measurements involving UV passbands. In this paper, we encountered the same problem. We found that we were unable to identify a set of model parameters that allow us to simultaneously fit all three CMDs in Figure 2. Our best-fitting age, metallicity, and distance modulus were determined based on the CMD involving the F555W and F814W passbands, resulting in , [Fe/H] = dex, and mag. The associated uncertainties were determined by the size of grids used for the fit. We determined the best-fitting age by visually inspecting the fit to the SGB. The metallicity was determined by fitting the slope of the cluster’s RGB. The best-fitting distance modulus was determined by fitting the magnitude of the red clump. We found that once we had fixed the best-fitting extinction based on one of our diagnostic CMDs, the relevant isochrone would exhibit a moderate offset in UV passbands. We would have to adopt different extinction values for each CMD to obtain best fits, specifically = 0.09, 0.10, and 0.12 mag (for the CMDs from the left to the right in Figure 2). Since this is unphysical, it is more likely that these offsets may have been caused by some unknown calibration limitation of the MIST models across different photometric systems. We agree with Barker & Paust (2018), who warned that “until the models are fixed, they should not be used for fitting or determining stellar populations in the UV.” Therefore, in this paper we only focus on the width of the cluster’s RGB, which should not be affected by the model’s limitations. We also suggest that the extinction derived from the optical–IR CMD likely represents the most accurate value, 0.12 mag.
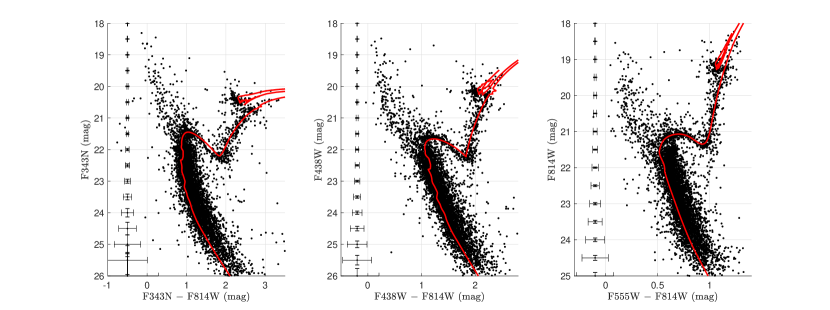
Our best-fitting age and metallicity are consistent with the values obtained by Rich et al. (2001). However, previously determined extinction values vary from mag to 0.14 mag (Udalski, 1998; Kerber et al., 2007). Our newly derived distance modulus to NGC 2121 is slightly smaller than the canonical LMC value ( mag; e.g., de Grijs et al., 2014). We visually confirmed that our fits adequately describe most of the CMD sequences. The best-fitting isochrones to each of the CMDs are presented in Figure 2.
To quantify whether NGC 2121 has a broadened RGB caused by a chemical spread, we need to compare the observed CMD with that of a simulated SSP. In principle, in addition to chemical spreads, several other factors may also cause a broadening of the RGB, including (i) photometric uncertainties, (ii) photometric artefacts (cosmic rays, bad or hot pixels, etc.), (iii) differences in distances to individual stars, (iv) differential reddening, and (v) field-star contamination. Any broadening caused by distance differences to the cluster stars is negligible because of the large distance to the LMC. Photometric uncertainties and artefacts can be assessed based on artificial-star tests. For the images observed with each camera, we generated 28,000 artificial stars located on the best-fitting isochrone between the onset of the SGB and the upper part of the RGB. Their spatial distributions were homogeneous. To avoid a situation where artificial stars dominate the background and crowding levels, we only added 100 artificial stars to the raw images at any one time. We used the same photometric method to measure these input stars and applied the same data reduction as used for the observations to the artificial stellar catalog. Finally, we recovered 24,943 artificial stars from the WFPC2 frames, corresponding to a completeness level of 89% for the SGB and RGB stars. From the UVIS/WFC3 observations, we recovered 27,792 artificial stars, indicating a completeness level of close to 99%.
The recovered artificial stellar population should be affected by the same photometric uncertainties and artefacts as the observations. However, it cannot reveal the level of internal differential reddening. Milone et al. (2012) developed a statistical method to study the reddening distribution in small areas (such as the core regions of GCs). However, this method is not applicable to our target cluster, because the number of stars is small (i.e., less than 10% of the numbers observed for most GCs; see Milone et al., 2012)). Fortunately, NGC 2121 exhibits a tight SGB. In the CMD based on the F555W and F814W filters, any broadening caused by chemical inhomogeneities is negligible. Therefore, any additional broadening that cannot be reproduced by photometric uncertainties or artefacts must be caused by differential reddening. As such, we compared the width of the simulated SGB to the observations and determined the best-fitting differential reddening level. We conclude that the degree of differential reddening in NGC 2121 is likely of order (): see Figure 3
Using artificial stars, we can also explore if NGC 2121 may host an eMSTO similar to its younger counterparts (Milone et al., 2009). We generated 20,000 artificial stars based on the observational MS ridge-line. We added these artificial stars to the observational images and measured them using the same photometric method as used for the real observations. We also applied differential reddening to these artificial stars. We found that the combination of photometric uncertainties and artefacts, combined with the differential reddening, is sufficient to reproduce the observed width of the MSTO region. Therefore we conclude that NGC 2121 does not feature an eMSTO. In addition, its apparently tight SGB, shown in Figure 3, is also known to represent a coeval stellar population (e.g., Li et al., 2014, 2016). In Figure 4 we show an example comparison between the observations and the simulation in the F438WF814W vs F438W CMD.
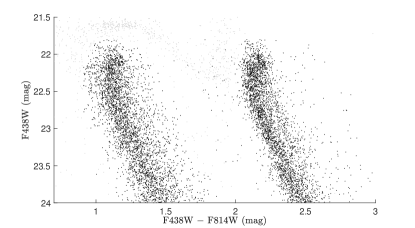
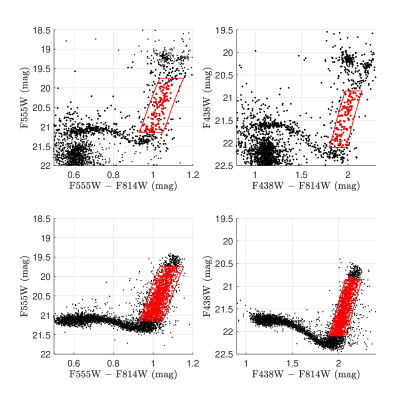
Because of the large distance to the LMC, using stellar proper motions to reduce field contamination is not possible. In addition, the field of view of the combined observations is very small, rendering selection of an appropriate field region for reference purposes troublesome. To minimize the impact of field-star contamination, we selected RGB stars according to their distribution in two of our CMDs (i.e., F555W–F814W vs F555W and F438W–F814W vs F438W). We did not select RGB stars from the CMD involving F343N photometry, because in that section of parameter space RGB stars may have been affected by star-to-star variations in N. We used the simulated CMDs to determine the typical regions occupied by the majority of RGB stars and subsequently used those regions to select RGB stars from our observational parameter space: see Figure 5. Only stars located in the RGB selection boxes in both CMDs were considered RGB stars. As shown by Martocchia et al. (2017), selecting RGB stars from multiple CMDs can be used to effectively reduce field-star contamination.
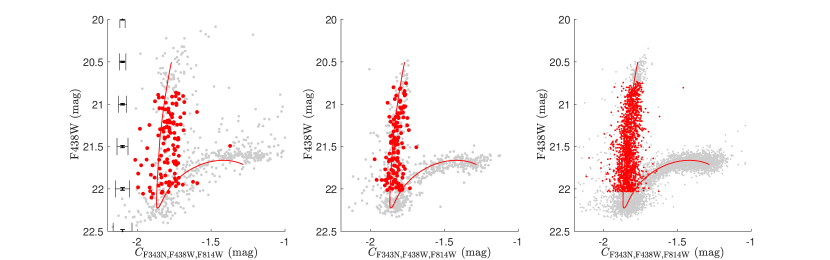
We used a similar method as Monelli et al. (2013) to quantify any broadening of the RGB caused by MPs. We constructed the color index = (F343NF438W)(F438WF814W). This pseudo-color is an effective index to uncover MPs (Monelli et al., 2013; Martocchia et al., 2017). We next compared the observational and simulated (artificial) distributions of stars in the F438W versus diagrams: see Figure 6. The simulated diagram on the right includes all 25,000 stars. We also randomly selected a subsample of our artificial stars composed of the same number of stars as in our observations, i.e., only containing 120 RGB stars (middle panel; red circles). Figure 6 shows that the observed RGB exhibits a larger spread than the simulated SSP RGB. To quantify this broadening, we adopted the best-fitting isochrone as our fiducial line and calculated the corresponding deviations of the pseudo-color indices, as illustrated in Figure 7. The distributions of the pseudo-color indices of the observed and simulated RGB stars are presented in Figure 7 as well.
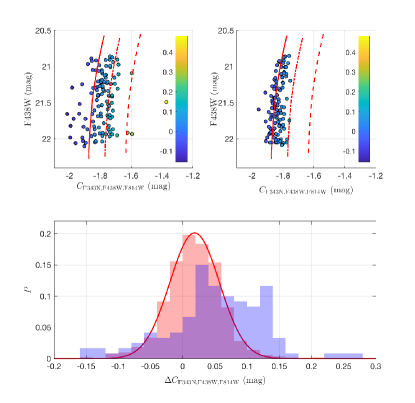
From inspection of Figure 7, we found that the peak of the observed distribution of the pseudo-colors for the simulated SSP is not consistent with the observations. Again, this is likely owing to the fitting problem encountered when UV observations are involved. Therefore, we only focus on the internal spread of the pseudo-color distribution rather than the actual pseudo-color values. We found that the distribution of the pseudo-colors for the simulated SSP can be adequately described by a single Gaussian profile,
| (1) |
with a standard deviation of mag. The observed pseudo-color distribution of the red-giant stars, however, is not well-described by a single Gaussian distribution; it is much broader than the distribution resulting from the simulation. If we were to force a single Gaussian profile to fit the distribution, the ‘best-fitting’ function would be
| (2) |
The corresponding standard deviation would be mag, about five-thirds that of the simulated SSP. To examine if the more broadened pseudo-color distribution of the observed red-giant stars could simply have been caused by small-number statistics, we selected 10 subsamples from the simulated stars containing the same numbers of stars as the observation. All subsamples exhibit more dispersed pseudo-color distributions than the observations (Figure 8).
Using ATLAS9 atmosphere models (Kurucz, 1970, 1993), we calculated 16 model spectra with atmosphere parameters ([Fe/H], , ) that were the same as those adopted by the best-fitting isochrones. These model spectra represent stars between the base and the middle of the RGB, i.e., they are for ‘standard’ stars with ‘normal’ abundances (i.e., [C/Fe] = [N/Fe] = [O/Fe] = 0.00 dex). We then calculated a set of N-enhanced models with [N/Fe] = 0.50 dex, [C/Fe] = [O/Fe] = 0.09 dex, and [N/Fe] = 1.00 dex, [C/Fe] = [O/Fe] = 0.60 dex. Thus, we calculated three sets of model spectra with no, modest, and strong N enrichment. Again, we fixed the total CNO abundance by reference to that observed in GCs (e.g., Marino et al., 2016). We calculated the flux ratio compared with its normal counterpart for every enriched star by folding their model spectra through the corresponding filter transmission curve. We converted the flux ratios in all passbands into magnitude differences. Finally, we obtained an isochrone characterized by suitable CNO abundances anomalies. As shown in the top panels of Figure 7, the loci for different CNO abundances are roughly parallel from the bottom to the middle of the RGB. This result is similar to that of Martocchia et al. (2017). Our fits show that the observed width of the RGB in the F438W versus diagram can be explained by invoking chemical variations from standard abundances up to [N/Fe] = 1.0 dex (with [C/Fe] = [O/Fe] = 0.6 dex). If we were to force the standard isochrone to meet the peak of the pseudo-color distribution, an internal abundance spread of [N/Fe] = 0.5 dex would still be required. We suggest that the actual N abundance spread among the RGB stars in NGC 2121 might be in the range 0.5–1.0 dex. Since the observed pseudo-color dispersion of the red-giant stars cannot be explained by photometric uncertainties, artefacts, differential reddening, or small-number statistics, the only viable explanation is light-element star-to-star variations, i.e., the RGB of NGC 2121 appears to be composed of MPs.
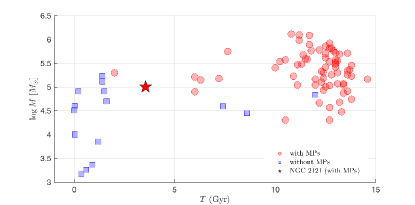
In Figure 8 we have added NGC 2121 to the age–mass plane for clusters with and without MPs, which represents a summary of results from the literature as to whether MPs occur in GCs and their younger massive counterparts of different ages and masses. Almost all old GCs show MPs, while their younger counterparts (younger than 2 Gyr) do not. In the age range of 2–10 Gyr, clusters with and without MPs overlap in both age and mass. The mass of NGC 2121, (McLaughlin & van der Marel, 2005), is only half that of NGC 1978 ( ; Baumgardt et al., 2013), and its mass is comparable to most of its younger counterparts.
4 Discussion and Summary
In this paper, we have analyzed the photometric appearance of the NGC 2121 RGB in the F438W versus diagram, which has been established as a diagnostic plot suitable for uncovering the presence of MPs. A broadening of the cluster’s RGB is apparent when compared with that of a simulated SSP. It is consistent with a model characterized by different CNO abundances, implying star-to-star chemical variations among the cluster’s red-giant stars.
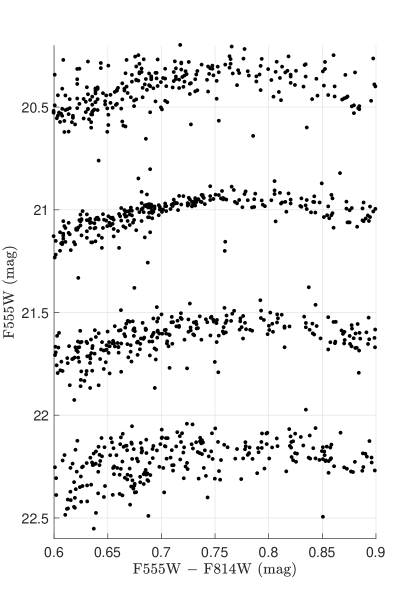
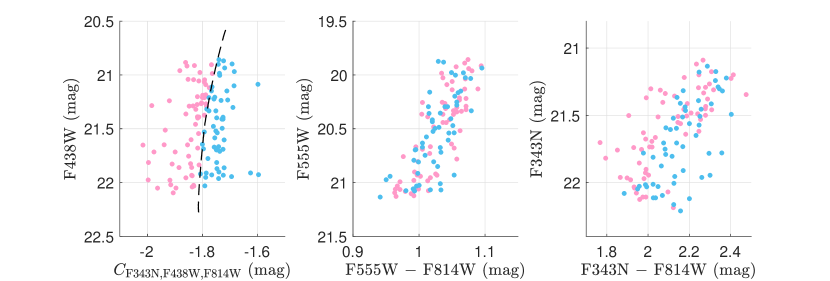
We have determined that F343N is indeed a key passband for use to unveil the presence of different stellar populations. We divided our selected RGB stars into two subsamples based on the dividing line halfway between the standard isochrone and the locus pertaining to [N/Fe] = 0.5 dex. We explored their color distributions in other CMDs, as shown in Figure 9. Indeed, both subsamples are fully mixed in the F555WF814W vs F555W CMD, but they exhibit distinct color differences in the CMD involving the F343N and F814W passbands. Stars with larger indices have redder F343NF814W colors, indicating that their total fluxes in the F343N passband are much lower than those of their blue counterparts, i.e., they are N-enriched stars. Our detection of chemical variations among the red-giant stars in NGC 2121 also makes it the second-youngest cluster with MPs (after the 2.2 Gyr-old cluster NGC 1978).
It would be interesting to examine whether the pristine and enriched stellar populations in the cluster have different central concentrations. However, the spatial distribution of stars across the WF3 chip of the WFPC2 camera exhibits numerous areas with little or no stars, indicating that source confusion caused by the spikes associated with bright stars in this region is severe. Therefore, the corresponding stellar completeness varies significantly at different radii. High-quality WFC3 observations of a larger field of view, through the F814W passband, are required to resolve this problem.
It is useful to compare the physical properties of NGC 2121 with those of its younger counterparts without MPs, i.e., NGC 1783, NGC 1806, and NGC 1846 (Mucciarelli et al., 2014; Martocchia et al., 2018; Zhang et al., 2018). The masses of NGC 1783, NGC 1806, NGC 1846, and NGC 2121 are all similar ( , , , and , respectively; McLaughlin & van der Marel, 2005; Baumgardt et al., 2013), as are their internal structural parameters (such as their core, half-mass, and tidal radii; McLaughlin & van der Marel, 2005; Li et al., 2018). These clusters also have similar metallicities and distances to the LMC’s bar region (Li et al., 2018). Thus, both the external environments and the internal dynamical properties of NGC 2121 and its younger counterparts are similar, which implies that the presence of MPs in NGC 2121 is unlikely caused by any specific formation environment or internal dynamics.
A noticeable difference with NGC 1783, NGC 1806, and NGC 1846 is that these younger clusters exhibit apparent eMSTO regions while NGC 2121 and NGC 1978 Martocchia et al. (2018) do not. Martocchia et al. (2018) proposed that the apparent chemical anomalies might be a specific feature of stars with masses below 1.5 , which is roughly the mass of main-sequence turnoff stars at an age of 2 Gyr. Stars with masses below this critical mass would be affected by magnetic braking, thus making them all slow rotators. Only stars with masses greater than 1.5 will exhibit evidence of rapid rotation in their cluster CMD, as manifested by eMSTO regions. Although the details are still unclear, strong magnetic fields may play a role in the appearance of star-to-star chemical variations. This notion is supported by our results, since the masses of the RGB and MSTO stars in NGC 2121 have decreased to below this critical mass. All of these stars should possess strong magnetic fields.
The detection of MPs in NGC 2121 underpins the hypothesis that age may be an important factor controlling the presence of MPs. The transition period between clusters with and without MPs should occur at an age of 2–3 Gyr. The mass of NGC 2121 is comparable to those of most Galactic GCs exhibiting MPs. It is unclear whether cluster mass also plays a role in the appearance of MPs. However, if so, it should not be the only factor of importance, because otherwise the detection of MPs in younger massive clusters should also be expected. This conclusion is consistent with that of Zhang et al. (2018). It is important to search for MPs in other clusters of similar ages but lower masses than NGC 2121, such as NGC 2193 and ESO-56-SC40 (Baumgardt et al., 2013). If these clusters exhibit similar CMD features as NGC 1978 and NGC 2121, this would lead to the conclusion that mass is not a crucial parameter determining the presence of MPs. Future studies should then focus on which intrinsic transitions may have led to chemical star-to-star variations at ages between 2 and 3 Gyr. On the other hand, if such clusters do not exhibit MPs, this would imply that mass may still be a secondary parameter controlling the presence of MPs.
Spectrum v2.77 (Gray & Corbally, 1994)
References
- Bastian & Lardo (2018) Bastian, N., & Lardo, C. 2018, ARA&A, 56, 83
- Barker & Paust (2018) Barker, H., & Paust, N. E. Q. 2018, PASP, 130, 034204
- Baumgardt et al. (2013) Baumgardt, H., Parmentier, G., Anders, P., & Grebel, E. K. 2013, MNRAS, 430, 676
- Bekki (2017) Bekki, K. 2017, MNRAS, 469, 2933
- Cannon et al. (1998) Cannon, R. D., Croke, B. F. W., Bell, R. A., Hesser, J. E., & Stathakis, R. A. 1998, MNRAS, 298, 601
- Cardini & Cassatella (2007) Cardini, D., & Cassatella, A. 2007, ApJ, 666, 393
- Carretta et al. (2009) Carretta, E., Bragaglia, A., Gratton, R. G., et al. 2009, A&A, 505, 117
- Choi et al. (2016) Choi, J., Dotter, A., Conroy, C., et al. 2016, ApJ, 823, 102
- Cordoni et al. (2018) Cordoni, G., Milone, A. P., Marino, A. F., et al. 2018, ApJ, 869, 139
- Decressin et al. (2007) Decressin, T., Meynet, G., Charbonnel, C., Prantzos, N., & Ekström, S. 2007, A&A, 464, 1029
- de Grijs et al. (2014) de Grijs, R., Wicker, J. E., & Bono, G. 2014, AJ, 147, 122
- Dalessandro et al. (2016) Dalessandro, E., Lapenna, E., Mucciarelli, A., et al. 2016, ApJ, 829, 77
- Denissenkov & Hartwick (2014) Denissenkov, P. A., & Hartwick, F. D. A. 2014, MNRAS, 437, L21
- D’Ercole et al. (2008) D’Ercole, A., Vesperini, E., D’Antona, F., McMillan, S. L. W., & Recchi, S. 2008, MNRAS, 391, 825
- Dolphin. (2011a) Dolphin A., DOLPHOT/WFC3 user’s guide, version 2.0. http://americano.dolphinsim.com/dolphin/dolphotWFC3.pdf
- Dolphin. (2011b) Dolphin A., DOLPHOT/WFPC2 user’s guide, version 2.0. http://americano.dolphinsim.com/dolphot/dolphotWFPC2.pdf
- Dolphin. (2013) Dolphin A., DOLPHOT user’s guide, version 2.0. http://americano.dolphinsim.com/dolphot/dolphot.pdf
- Dotter (2016) Dotter, A. 2016, ApJS, 222, 8
- Gray & Corbally (1994) Gray, R. O., & Corbally, C. J. 1994, AJ, 107, 742
- Gontcharov et al. (2019) Gontcharov, G. A., Mosenkov, A. V., & Khovritchev, M. Y. 2019, MNRAS, 483, 4949
- Howes et al. (2019) Howes, L. M., Lindegren, L., Feltzing, S., Church, R. P., & Bensby, T. 2019, A&A, 622, A27
- Kerber et al. (2007) Kerber, L. O., Santiago, B. X., & Brocato, E. 2007, A&A, 462, 139
- Krause et al. (2016) Krause, M. G. H., Charbonnel, C., Bastian, N., & Diehl, R. 2016, A&A, 587, A53
- Kurucz (1970) Kurucz, R. L. 1970, SAO Special Rep., 309, 309
- Kurucz (1993) Kurucz, R. 1993, ATLAS9 Stellar Atmosphere Programs and 2 km s-1 grid. Kurucz CD-ROM No. 13. Cambridge, MA: Smithsonian Astrophys. Obs., 1993, 13
- Larsen et al. (2014) Larsen, S. S., Brodie, J. P., Grundahl, F., & Strader, J. 2014, ApJ, 797, 15
- Li et al. (2014) Li, C., de Grijs, R., & Deng, L. 2014, Nature, 516, 367
- Li et al. (2016) Li, C., de Grijs, R., Bastian, N., et al. 2016, MNRAS, 461, 3212
- Li et al. (2017) Li, C., de Grijs, R., Deng, L., & Milone, A. P. 2017, ApJ, 844, 119
- Li et al. (2018) Li, C., Deng, L., Bekki, K., et al. 2018, AJ, 156, 110
- MacLean et al. (2015) MacLean, B. T., De Silva, G. M., & Lattanzio, J. 2015, MNRAS, 446, 3556
- Marino et al. (2009) Marino, A. F., Milone, A. P., Piotto, G., et al. 2009, A&A, 505, 1099
- Marino et al. (2016) Marino, A. F., Milone, A. P., Casagrande, L., et al. 2016, MNRAS, 459, 610
- Martocchia et al. (2017) Martocchia, S., Bastian, N., Usher, C., et al. 2017, MNRAS, 468, 3150
- Martocchia et al. (2018) Martocchia, S., Cabrera-Ziri, I., Lardo, C., et al. 2018, MNRAS, 473, 2688
- McLaughlin & van der Marel (2005) McLaughlin, D. E., & van der Marel, R. P. 2005, ApJS, 161, 304
- Meynet et al. (2006) Meynet, G., Ekström, S., & Maeder, A. 2006, A&A, 447, 623
- Milone et al. (2009) Milone, A. P., Bedin, L. R., Piotto, G., & Anderson, J. 2009, A&A, 497, 755
- Milone et al. (2012) Milone, A. P., Piotto, G., Bedin, L. R., et al. 2012, A&A, 540, A16
- Milone et al. (2017) Milone, A. P., Piotto, G., Renzini, A., et al. 2017, MNRAS, 464, 3636
- Monelli et al. (2010) Monelli, M., Hidalgo, S. L., Stetson, P. B., et al. 2010, ApJ, 720, 1225
- Monelli et al. (2013) Monelli, M., Milone, A. P., Stetson, P. B., et al. 2013, MNRAS, 431, 2126
- Mucciarelli et al. (2014) Mucciarelli, A., Dalessandro, E., Ferraro, F. R., Origlia, L., & Lanzoni, B. 2014, ApJ, 793, L6
- Niederhofer et al. (2017) Niederhofer, F., Bastian, N., Kozhurina-Platais, V., et al. 2017, MNRAS, 465, 4159
- Pancino et al. (2017) Pancino, E., Romano, D., Tang, B., et al. 2017, A&A, 601, A112
- Paxton et al. (2011) Paxton, B., Bildsten, L., Dotter, A., et al. 2011, ApJS, 192, 3
- Paxton et al. (2013) Paxton, B., Cantiello, M., Arras, P., et al. 2013, ApJS, 208, 4
- Paxton et al. (2015) Paxton, B., Marchant, P., Schwab, J., et al. 2015, ApJS, 220, 15
- Piatti et al. (2002) Piatti, A. E., Sarajedini, A., Geisler, D., Bica, E., & Clariá, J. J. 2002, MNRAS, 329, 556
- Piotto et al. (2007) Piotto, G., Bedin, L. R., Anderson, J., et al. 2007, ApJ, 661, L53
- Piotto et al. (2012) Piotto, G., Milone, A. P., Anderson, J., et al. 2012, ApJ, 760, 39
- Piotto et al. (2015) Piotto, G., Milone, A. P., Bedin, L. R., et al. 2015, AJ, 149, 91
- Rich et al. (2001) Rich, R. M., Shara, M. M., & Zurek, D. 2001, AJ, 122, 842
- Tang et al. (2019) Tang, B., Liu, C., Fernandez-Trincado, J. G., Geisler, D., Shi, J., Zamora, O., Worthey, G., & Moreno, E. 2019, ApJ, 871, 58
- Udalski (1998) Udalski, A. 1998, Acta Astronomica, 48, 383
- Ventura & D’Antona (2009) Ventura, P., & D’Antona, F. 2009, A&A, 499, 835
- Zhang et al. (2018) Zhang, H., de Grijs, R., Li, C., & Wu, X. 2018, ApJ, 853, 186