Large Second-Harmonic Generation and Linear Electro-Optic Effect in Trigonal Selenium and Tellurium
Abstract
Trigonal selenium and tellurium crystalize in helical chain-like structures and thus possess interesting properties such as current-induced spin polarization, gyrotropic effects and nonlinear optical responses. By performing systematic ab initio calculations based on density functional theory in the generalized gradient approximation plus scissors correction, we study their linear and nonlinear optical (NLO) properties. We find that the two materials exhibit significant second-harmonic generation (SHG) and linear electro-optic (LEO) effect. In particular, the SHG coefficients () of tellurium are huge in the photon energy range of 03 eV, with the magnitudes of being as large as 3640 pm/V, which are about sixteen times larger than that of GaN, a widely used NLO material. On the other hand, trigonal selenium is found to possesses large LEO coefficients which are more than six times larger than that of GaN. Therefore, trigonal tellurium and selenium may find valuable applications in NLO and LEO devices such as frequency conversion, electro-optical switch and light signal modulator. The energy positions and shapes of the principal features in the calculated optical dielectric functions of both materials agree rather well with the available experimental ones, and are also analyzed in terms of the calculated band structures especially symmetries of the involved band states and dipole transition selection rules.
I INTRODUCTION
The interaction between the intense optical fields and materials may induce strong nonlinear optical (NLO) responses.Shen1984 ; Boyd2003 Noncentrosymmetric materials with large second-order nonlinear optical susceptibility () play a crucial role in the development of modern optical and electro-optical devices such as lasers, frequency conversions, electro-optic modulator and switches.Boyd2003 Second harmonic generation (SHG), a special case of sum frequency generation, is perhaps the best-known NLO effect. Since 1960s, the SHG has been investigated extensively in bulk semiconductorsBoyd2003 ; Chang1965 ; zhong1993 ; Hughes1996 ; Gavrilenko2000 ; Cai2009 and more recently also in one dimensional (see, e.g., guo2004 ; guo2005 and references therein) and two-dimensional (see, e.g., wang2015 ; hu2017 ; wang2017 ; panday2018 and references therein) materials. Furthermore, because of its high sensitivity to local structure symmetry and also its absence in materials with inversion symmetry, the SHG has been a powerful probe of surfaces and interfaces.Shen1984 Linear electro-optic (LEO) effect, another second-order electric polarization response of a NLO material, refers to the linear refractive index variation () with the applied electric field strength (), , where is the refraction index and the LEO coefficient.Boyd2003 The LEO effect thus allows one to use an electrical signal to control the amplitude, phase or direction of light beam in the NLO material, and leads to a widely used means for high-speed optical modulation and sensing devices.
Since their discovery, trigonal selenium and tellurium have attracted considerable attention due to their unique properties, such as a high degree of anisotropy, broken inversion symmetry and chirality. Trigonal selenium has valuable technological applications such as rectifiers, photocells, photographic exposure meters and xerography to medical diagnostics due to their photoconductivity in the entire visible rangesmith1980 ; mees1995 ; johnson1999 ; fan2005 . As a narrow band gap semiconductor, tellurium possesses excellent thermoelectric property peng2014 ; lin2016 and thus can be used for thermoelectrics. Furthermore, tellurium also exhibits such interesting behaviors as current-induced spin polarizationshalygin2012 , trivial insulator to strong topological insulator transition under shear strainagapito2013 , circular photon drag effectshalygin2016 , robust control over current-induce magnetic torquescsahin2018 , and gyrotropic effectstsirkin2018 . Finally, their electronic band structures host Dirac and Weyl nodes due to the broken inversion symmetry and spin-orbit coupling (SOC)Hirayama2015 ; nakayama2017 .
As semiconductors without inversion symmetry, selenium and tellurium exhibit nonlinear optical responses. Although their optical propertiespatel1966 ; tutihasi1967 ; roberts1968 ; mcfee1970 ; day1971 ; zhong1993 have been extensively studied, their nonlinear optical effects have hardly been investigated. Only the second-order NLO susceptibility element has been measured at the CO2 laser frequency ( meV) for selenium and telluriumpatel1966 ; mcfee1970 ; day1971 and calculated at zero frequency for seleniumzhong1993 . No study on the other nonzero element has been reported. Since the SHG depends on the electronic band structure, dipole transition matrix and specific frequency and orientation of the applied optical field, it is of interest to know all the nonzero SHG elements over the entire optical frequency range. The LEO effect in these two materials has been investigated either. Therefore, the main objectives of this paper are as follows. Firstly, we want to perform systematic ab initio calculations of all the nonzero elements of the second-order NLO susceptibility tensor of both materials for the whole optical frequency range. The results will tell us whether trigonal selenium and tellurium are promising NLO materials for optical and opto-electronic devices. Secondly, we also want to calculate linear optical dielectric functions for both selenium and tellurium in order to understand the interesting observed optical phenomena. The calculated dielectric functions will also help us to understand the obtained SHG coefficients. Gavrilenko2000 ; guo2005 ; wang2015 Furthermore, since a NLO material with a large LEO coefficient needs to simultaneously posses a large second-order NLO susceptibility and a low dielectric constant, the dielectric functions are also required for evaluating the LEO coefficient. Our findings are expected to stimulate further experimental investigations on the NLO properties of these two interesting helical chain-like materials.
The paper is organized as follows. In sec. II, we present the theoretical approach and computational details. In sec. III, the calculated optical dielectric function, SHG and LEO coefficients over the entire optical frequency range are presented. Comparison of the obtained SHG and LEO coefficients of the two materials with the knowned NLO materials suggests that they are superior NLO materials. The theoretical SHG coefficients are compared with the measured values at the CO2 laser frequency, and also analyzed in terms of one- and two-photon resonances via the calculated absorptive parts of the dielectric function. Furthermore, we compare the calculated dielectric function over the whole optical frequency range with the available experimental results and also analyze their interesting features in terms of the symmetry of band states at high symmetry -points in the Brillouin zone. Finally, a summery of this work is given in sec. IV.
II STRUCTURE AND COMPUTATIONAL METHOD
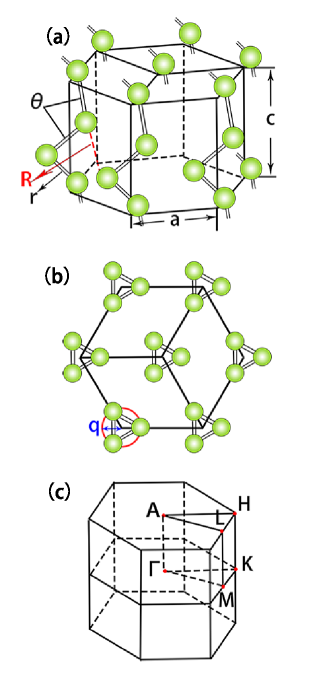
The crystal structure of trigonal selenium and telluriumteuchert1975 ; Keller1997 is schematically shown in Fig. 1. It consists of the helical chains arranged in a hexagonal arrayteuchert1975 ; Keller1997 . The three atoms in the unit cell are situated at positions (), () and (). The space group is either () or () depending on whether it has the right-handed or left-handed screw. Nonetheless, the two different helical structures are related to each other by spatial inversion. Thus their energy bands and linear optical properties should be identical. Furthermore, their nonzero elements of the second-order NLO susceptibility tensor would be the same and are also related to each other, as will be explained in sec. III(c) below. Therefore, we only consider the case here. The structures could be viewed as being derived from the Peierls distortionseifert1995 of the six-coordinated simple cubic structure. The valence electron configurations of selenium and tellurium are and , respectively, i.e., the one third bands are empty. Therefore, every atom is covalently bonded to two neighboring atoms along each chain, and interacts with four second near-neighbor atoms of the adjacent chains by van der Waals forces. The intrachain bonding and interchain bonding correspond to the bonding and the lone pair states, respectively. The overlap of electronic orbitals arising from the lone pair and antibonding states on neighbouring chains induces the covalent bond stretched to infinity. Furthermore, such overlap and the repellant exchange interaction between lone pair orbitals stabilize the helical chains. As shown in Fig. 1, lattice constant amounts to the distance between the adjacent chains. Lattice constant is equal to the height of the unit cell in the chain direction (the axis). Interestingly, the atomic position parameter can be related to lattice constant and the helix radius . Note that the ratio () of the interchain and intrachain distances of tellurium is smaller than that of selenium (Table I), thus implying that tellurium would exhibit a weaker structural anisotropy.
| (Å) | (Å) | (Å) | (Å) | (Å3) | ||||
|---|---|---|---|---|---|---|---|---|
| Se | exp11footnotemark: 1 | 4.3662 | 4.9536 | 0.2254 | 2.3732 | 3.4358 | 103.07 | 81.78 |
| the | 4.3084 | 5.0874 | 0.2315 | 2.4207 | 3.3958 | 103.66 | 81.78 | |
| Te | exp22footnotemark: 2 | 4.4511 | 5.9262 | 0.2633 | 2.8307 | 3.4919 | 103.27 | 101.67 |
| the | 4.4345 | 5.9707 | 0.2754 | 2.9044 | 3.4428 | 101.79 | 101.67 |
Reference teuchert1975, .
Reference Keller1997, .
The present ab initio calculations are performed based on the density functional theory. The exchange correlation approximation is treated with the generalized gradient approximation (GGA) of Perdew, Burke, and Ernzerhofperdew1996 . The highly accurate full-potential projector-augmented wave (PAW) methodblochl1994 , as implemented in the VASP packagekresse1996ab ; kresse1996 , is used. A large plane-wave cutoff of 450 eV is adopted throughout. The PAW potentials are used to describe the electron-ion interaction, with 6 valence electrons for Se () and also 6 for Te (). The structural optimization and self-consistent electronic structure calculations are performed by using the tetrahedron method blochl1994tetrahedron with a -point mesh of 10108. The density of states (DOS) is evaluated from the self-consistent band structure with a much denser -point mesh of 202018 for Se and of 202016 for Te.
We first perform structural optimizations of the atomic positions and lattice constants with the conjugate gradient technique. As shown in Table I, the calculated lattice constants agree rather well with that of experimentsteuchert1975 ; Keller1997 except lattice constant of selenium which is about 2.6 % too small. Nonetheles, the calculated linear and nonlinear optical spectra using the theoretical structural parameters look almost the same as that obtained using the experimental structural parameters. Therefore, only the results calculated by using the experimental structural parameters are presented in this paper.
In this work, the linear optical dielectric function and nonlinear optical susceptibility are calculated based on the linear response formalism with the independent-particle approximation, as described previouslyguo2004 ; guo2005ab . Therefore, the imaginary (absorptive) part of the dielectric function due to direct interband transition is given by the Fermi golden rulesguo2004 ; guo2005ab ,
| (1) |
where is the photon energy and is the unit cell volume. VB and CB represent the valence and conduction bands, respectively. The dipole transition matrix elements are obtained from the self-consistent band structures within the PAW formalism.Adolph2001 Here k is the th Bloch state wave function with crystal momentum k, and denotes the cartesian component. The real (dispersive) part of the dielectric function is then obtained from the calculated by the Kramer-Kronig transformationguo2004 ; guo2005ab ,
| (2) |
Here represents the principal value of the integral.
The imaginary part of the second-order optical susceptibility due to direction interband transitions is given by guo2004 ; guo2005
| (3) |
where the contribution due to the so-called virtual- electron (VE) process isguo2004 ; guo2005
| (4) |
and that due to the virtual-hole (VH) process isguo2004 ; guo2005
| (5) |
Here = - and . The real part of the second-order optical susceptibility is then obtained from the calculated by the Kramer-Kronig transformationguo2004 ; guo2005
| (6) |
The linear electro-optic coefficient is related to the second-order optical susceptibility Hughes1996 . In the zero frequency limit,
| (7) |
Furthermore, for the photon energy well below the band gap, and are nearly constant. In this case, the linear electro-optic coefficient wang2015 ; guo2004 .
To obtain numerically accurate optical properties, we perform test calculations for selenium and tellurium with several different -point meshes until the calculated optical properties converge to a few percent. As a result, dense -point meshes of 404036 and 505038 are adopted here for selenium and tellurium, respectively. Furthermore, to ensure that and obtained by the Kramer-Kronig transformation are reliable, about 27 bands per atom are adopted in the optical calculations. The function in Eqs. (1), (4) and (5) are approximated by a Gaussian function with eV.
It is well known that the band gap of a semiconductor is generally under-estimated by the local density approximation (LDA) and GGA calculations (see, e.g., Table II below) where many-body effects especially quasiparticle self-energy correction are not adequately taken into account. On the other hand, Eqs. (1), (4) and (5) indicate that correct band gaps would be important for obtaining accurate optical properties. Therefore, we further perform the band structure calculations using the hybrid Heyd-Scuseria-Ernzerhof (HSE) functional heyd2003 which is known to produce much improved band gaps for semiconductors. We then take the self-energy corrections into account by the so-called scissors correction (SC) levine_prb_1991 using either the accurate band gaps from the HSE calculations or simply the available experimental band gaps. In the SC calculation, the conduction bands are unformly upshifted so that the band gap would match either the experimental gap or the HSE gap together with the renormalized velocity matrix elements levine_prb_1991 . Indeed, such SC calculations were shown to give rise to the second order nonlinear susceptibility at zero frequency for low-dimensional materials such as trigonal selenium zhong1993 and graphene-like BN sheet that agree well with the experimental one wang2015 .
III RESULTS AND DISCUSSION
III.1 Electronic band structure
| (eV) | (eV) | (eV) | (eV) | |
|---|---|---|---|---|
| Se | 1.002 | 1.735 (1.759) | 2.011footnotemark: 1 | 0.733 |
| Te | 0.113 | 0.322 (0.546) | 0.32322footnotemark: 2 | 0.209 |
Experimental value from reference tutihasi1967, .
Experimental value from reference anzin1977, .
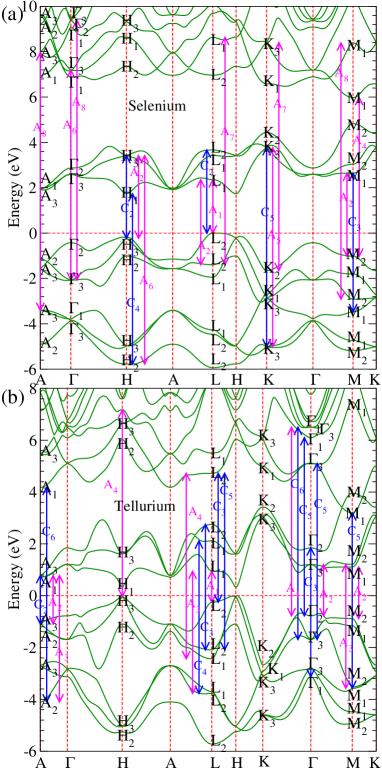
Because selenium and tellurium have the same crystalline structures, the band structure of selenium is very similar to that of the tellurium, as shown in Fig. 2. The two materials are indirect bandgap semiconductors which have the conduction band minimum (CBM) at the H point. For selenium, the valence band maximum (VBM) is located at the L point, whereas the VBM of tellurium is close to the H point along the H-K direction. The calculated band gap is 1.002 (0.113) eV in Se (Te), which is significantly smaller than the experimental values of 2.0 (0.323) eVtutihasi1967 ; anzin1977 . The ratio between the interchain and intrachain distances of tellurium, as mentioned previously, is smaller than that of selenium. Therefore, the enhanced interchain interaction in tellurium brings about more electrons transferred from lone pair states to antibonding states and this weakens the Peierls distortion. This explains why the band gap of tellurium is smaller than that of selenium, even though they have the same crystalline structure. By using the molecular orbital picture, we can further interpret the energy band as follows. There are three groups of valence bands which correspond to the bonding, bonding and lone pair states, and the three lowest conduction bands arise from the antibonding states. The calculated band structures of Se and Te agree quite well with previous calculationsHirayama2015 . The minor differences stem from the fact that the present GGA calculations are done without SOC.
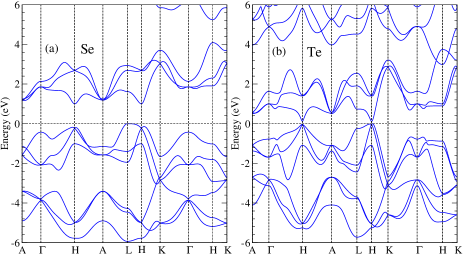
It is clear from Eqs. (1), (4) and (5) that the smaller the gap, the larger the magnitude of the dielectric function and second-order NLO susceptibility. Since the GGA calculation significantly underestimates the energy gap by nearly 50 , the dielectric function and second-order NLO susceptibility would be overestimated by the GGA calculations. Therefore, we also calculate the band structures by using the HSE functionalheyd2003 in order to get more accurate band gaps. The theoretical band gaps from the GGA and HSE calculations together with the experimental values are listed in Table II. Indeed, the band gaps of selenium and tellurium from the HSE calculations with the SOC included, are in good agreement with the corresponding experimental values (Table II). Therefore we simply use the energy differences between the HSE calculations with the SOC and GGA band gaps as the scissors correction energy within the scissors correction schemelevine_prb_1991 , to obtain accurate linear and nonlinear optical properties for both selenium and tellurium.
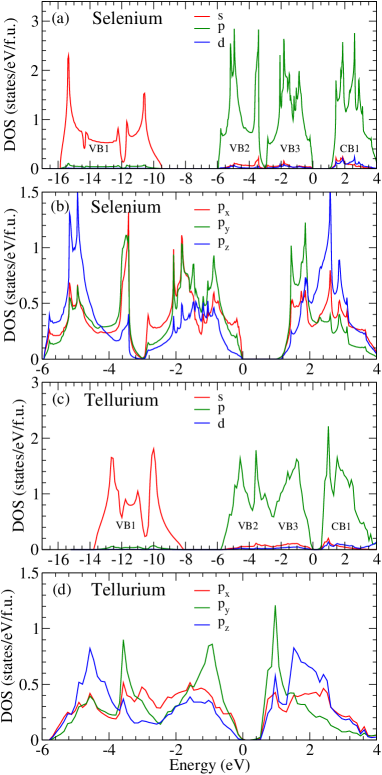
We also calculate total and orbital-projected densities of states (DOS) for selenium and tellurium. Overall, the DOS spectra of the two systems are rather similar. Hence, in what follows, we only analyze the DOS spectra of selenium as displayed in Fig. 3(a). We can see from Fig. 3(a) that the lowest valence bands of selenium ranging from -15.9 to -9.5 eV stem mainly from the orbitals. The top valence bands ranging from -5.9 to 0.0 eV and the lower conduction bands ranging from 1.0 to 4.0 eV, on the other hand, originate primarily from the orbitals.
Furthermore, we can analyze the contributions of the orbital-projected DOSs from Fig. 3(b). For example, the lower valence bands ranging from -5.9 to -4.2 eV and also the conduction bands ranging from 1.9 to 3.3 eV are dominated by the orbital with some contributions from the and orbitals. The top valence bands ranging from -4.2 to 0.0 eV are of mainly and orbitals with a certain component. Furthermore, the lower conduction bands ranging from 1.2 to 1.9 eV mainly consist of orbitals.
III.2 Linear optical property
The calculated imaginary (absorptive) part of the optical dielectric function for selenium and tellurium are shown in Fig. 4. Trigonal selenium and tellurium are of uniaxial crystalline structures due to their point group symmetry. Therefore, their optical properties depend significantly on the light polarization direction. Consequently, the imaginary part of the dielectric function for both systems consist of two distinctly different components, i.e., light polarization parallel () and perpendicular () to the axis (the principal optical axis). Furthermore, the two systems exhibit strong optical anisotropy which arises from the unique feature of their structures, i.e., the spiral chains are oriented along the -axis with relatively strong covalent bonds along each helix but with weak interchain van der waals forces. As Fig. 4(a) shows, the absorptive part of is much smaller than that of in the low energy range (about 2.38.8 eV), while it is the opposite in the energy range above 8.8 eV. Although the similar phenomena are observed in tellurium, it possesses weaker optical anisotropy than selenium (Fig. 4). This could be explained by the fact that trigonal tellurium has weaker structural anisotropy.
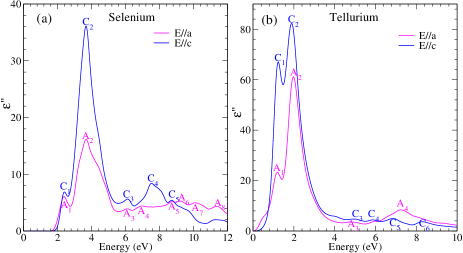
Figure 4(a) shows that there are two pronounced peaks in the imaginary part of the dielectric function for , namely, a large peak () located at 3.7 eV and a relatively small one () in the neighborhood of 7.5 eV. Furthermore, there are three shoulder peaks at 2.4 eV () , 6.1 eV () and 8.7 eV(), respectively. For , our theoretical calculations for selenium exhibit a prominent peak () near 3.7 eV. Beyond that, for , the spectrum shows multiple faint bumps (). The amplitude of the bumps above 5.6 eV increases and then decreases with the photon energy. At 5.6 eV occurs a deep minimum deriving from the fact that transition from the upper valence triplet to the lower conduction triplet are already exhausted. The amplitude of the bumps increases within the energy range between 5.6 eV and 9.2 eV due to the transitions from the lower valence triplet to the lower conduction triplet and also from the upper valence triplet to the upper conduction triplet. For Te, Fig. 4(b) shows that the spectra of the imaginary part of the dielectric function could be divided into two regions. In the low-energy region (about 0-4 eV), there are two prominent peaks for both (, ) and (, ). The larger peak () occurs at 2.0 eV and the smaller peak () is found at 1.2 eV for . For , the larger () and smaller () peaks are located at 1.9 eV and 1.2 eV, respectively. In the high-energy region (about 4-9 eV), a broad peak () centered at 7.2 eV for exists. However, the spectrum of exhibits some steadily oscillatory bulges in the energy region. Therefore, the transitions from the lower valence triplet to the lower conduction triplet and from the upper valence triplet to the upper conduction triplet are more pronounced.
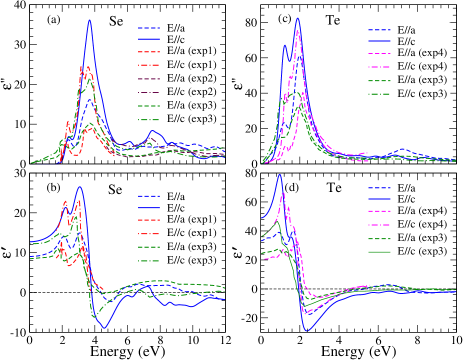
Our calculated static dielectric constants together with the experimental values Palik1985 are listed in Table VII. It is clear from Table VII that the dielectric constants of both selenium and tellurium from the GGA calculations with the scissors corrections agree very well with the measured ones while, as expected, that obtained from the GGA calculations without the scissors correction are too large. Earlier paperssandrock1971 ; bammes1972 have reported the dielectric functions for trigonal selenium and tellurium measured as a function of photon energy. Therefore, our calculations are compared with the measurements, as shown in Fig. 5. The imaginary part of the dielectric function would allow us to find out the information on the major electronic transitions. In what follows, we will compare the spectra of the imaginary part of the calculated and experimental dielectric functions. Firstly, for selenium, we find that the positions of the and peaks at 3.7 eV are consistent with the experimentsbammes1972 . Furthermore, small bumps and are also observed in the corresponding experimental spectrasandrock1971 . In particular, the position of the bump is consistent with the experimentsandrock1971 . Moreover, Fig. 5(a) shows that our calculated five small bumps (, , , , ) agree reasonably well with that of the measurementssandrock1971 , other than having the slightly larger amplitude. The experiment and our theoretical calculations have common peaks , and , although the energy position of the theoretical peaks is slightly blue-shifted compared to that of the experimental onessandrock1971 ; bammes1972 . Finally, the positions of peaks and are consistent with the experimentstutihasi1967 .
For tellurium, the positions of peaks , , , , and in the imaginary part of the dielectric function agree well with that of the experimental spectrabammes1972 ; Tutihashi1969 . Furthermore, the small , and peaks can also be observed in the experimentalbammes1972 spectra, other than being red-shifted by about 0.2 eV, 0.2 eV and 0.4 eV, respectively. In the high energy region (4.0-9.0 eV), both the calculated and experimentalbammes1972 spectra exhibit oscillatory peaks, although the positions of the peaks differ slightly. Overall, the present theoretical imaginary part of the dielectric function for both materials are in good agreement with the experiments. Furthermore, Figs. 5(b) and 5(d) show that the spectral shape of the real part of the dielectric function agree rather well with that of the experimentsbammes1972 ; Tutihashi1969 .
| group | -point | |||||
|---|---|---|---|---|---|---|
| peak | direct transitions | peak | direct transitions |
|---|---|---|---|
The electronic band structure and linear optical properties of selenium and tellurium have been studied both theoreticallymcfee1970 ; sandrock1971 ; isomaki1980 ; Treusch1980 and experimentallytutihasi1967 ; roberts1968 ; anzin1977 ; sandrock1971 ; bammes1972 before. Nevertheless, no detailed analysis on the main peaks in the imaginary part of the dielectric function in term of interband transitions has been reported. Here we perform such a detailed analysis. Equations (1), (4) and (5) show that the imaginary parts of the dielectric function and second-order NLO susceptibility are closely connected with the dipole-allowed interband transitions. Therefore, we can understand the origin of the peaks in the imaginary part of the dielectric function by analyzing the symmetry of the band states and also considering the dipole transition selection rules. First, by using the projection method of the group theory, we deduce the symmetry-adapted basis functions in terms of the atomic orbitals (Table III). Second, we determine the symmetry of the band states (Fig. 6) for six principal symmetry points () by means of the comparison between the symmetry-adapted basis functions and the calculated orbital characters of the band states at the six symmetry points. It should be noted that the atomic configurations of selenium and tellurium are , and , . Therefore, we only consider the symmetry-adapted basis functions of , , and orbitals. Such deduced symmetries at the and points are consistent with the results of previous calculationisomaki1980 . After considering the selection rules (Table IV)Treusch1980 , we could assign the peaks in the imaginary part of the dielectric function to the direct interband transitions at the six symmetry points, as shown in Fig. 6 as well as in Tables V and VI. For example, for trigonal selenium, the peak at 3.7 eV [see Fig. 4(a)] stems from transitions from the state at the top of valence band to the conduction band state ( 3.4 eV) at -point and from the valence band state at -1.4 eV to the state at the bottom of conduction band at the -point. Furthermore, the peak is associated with the transition from the state at the top of valence band to the state at the bottom of conduction band at -point. The peak at 3.7 eV could be attributed to transitions starting from the state at the top of valence band to the conduction band states (3.4 eV) at -point and from the state at the top of valence band to the conduction band state (3.7 eV) at the -point.
| peak | direct transitions | peak | direct transitions |
|---|---|---|---|
Similarly, for tellurium, we can assign the peak [see Fig. 4(b)] to the transition from the state at the top of valence band to the state at the bottom of conduction band at the -point and from the state at the top of valence band to the state at the bottom of conduction band at the -point. It is noted that the transition from the state at the top of the valence band to the conduction band state (0.8 eV) at -point contributes to the and peaks.
III.3 Second harmonic generation and linear electro-optic coefficient
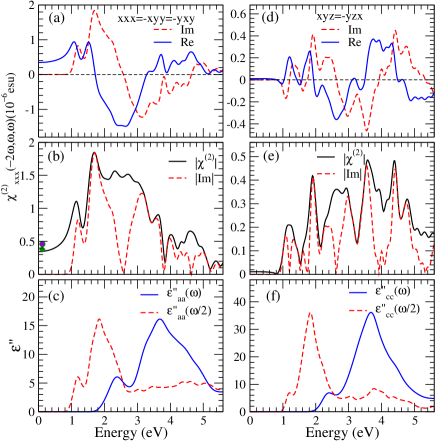
Point group has ten nonvanishing second-order NLO susceptibility elements.Shen1984 ; Boyd2003 However, the crystalline symmetry of selenium and tellurium further reduces this number to five. Our ab initio calculations show that there are only two independent elements among the five nonzero elements because , . Our calculations for selenium also reveal that the values of the element of the two helical structures ( and ) are equal but the values of the element differ in sign. Therefore, here we present only and for space group , as mentioned above in Sec. II. The calculated real and imaginary parts as well as the absolutes values of these two elements are displayed in Fig. 7 and Fig. 8 for selenium and tellurium, respectigvely. We note that with the scissor corrections, the line shapes of the calculated NLO spectra are hardly changed and thus only the NLO spectra calculated with the scissor corrections are displayed in Figs. 7 and 8. However, the peak positions are blue-shifted by about the energy of the scissors correction (). Moreover, the magnitude of the second-order susceptibility gets reduced (see Table VII).
| eV | ||||||||
|---|---|---|---|---|---|---|---|---|
| Se | GGA | 10.8 | 15.4 | 330, 440a | 6 | -5.63 | -0.10 | 335 |
| SC | 9.0 | 12.7 | 145, 194a | 5 | -3.58 | -0.12 | 146 | |
| exp. | 6.28.4b | 12.7b | 15984c | |||||
| 19450d | ||||||||
| Te | GGA | 40.6 | 57.2 | -2190 | 7927 | 2.66 | -9.63 | 3163 |
| SC | 33.2 | 49.0 | 169 | 1009 | -0.30 | -1.82 | 475 | |
| exp. | 33.0b | 54.0b | 1840560d | |||||
| 1843586e |
LDA calculations with the SC from reference zhong1993, .
Experimental value from reference Palik1985, .
Experimental value from reference patel1966, .
Experimental value from reference day1971, .
Experimental value from reference mcfee1970, .
In Table VII, we list the calculated static dielectric constant , second-order NLO susceptibility and zero frequency LEO coefficient . Note that the and are listed in the units of SI pm/V unit and 1 pm/V ( esu). Interestingly, Table VII shows that tellurium exhibits large static second-order NLO susceptibility, especially , which is up to 100 times larger than that of GaN in both zinc-blende and wurtzite structureGavrilenko2000 ; Cai2009 . Furthermore, for both materials, the static second-order NLO susceptibility exhibits strong anisotropy. The same phenomenon is observed in the LEO coefficient. Moreover, selenium has large LEO coefficient (3.6 pm/V), being more than six times larger than that of bulk GaN polytypesGavrilenko2000 ; Cai2009 .
Let us now compare our calculated and with the previous LDA calculations and available experiments. Firstly, our calculated for selenium agrees rather well with the experimental values reported in ref.patel1966 and also ref. day1971 [see Table VII and Fig. 7(b)]. Secondly, for , the agreement between our GGA calculations and the previous LDA calculations zhong1993 is also rather good (see Table VII). For tellurium, Table VII and Fig. 8(b) show that our calculated is much smaller than the available experiment valuesmcfee1970 ; day1971 . Nonetheless, we note that in the energy range of 0.00.3 eV, increases rapidly with the photon energy and the energy of 0.113 eV sits right at the middle of the steep slope [Fig. 8(b)]. Thus, a small error in the energy position could cause a large discrepancy between the theory and experiment. Indeed a small red-shift (0.1 eV) could bring the calculated and experimental values of in good agreement.
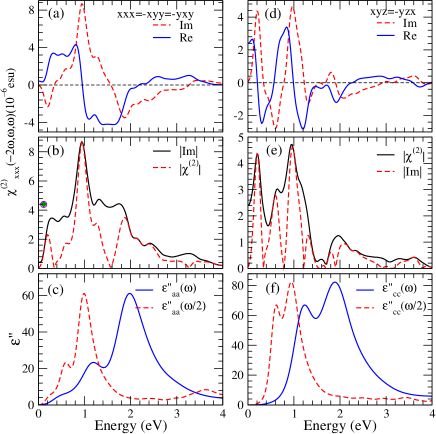
The SHG involves not only single-photon () resonance but also double-photon (2) resonance. Therefore, to further analyze the NLO responses, we plot the modulus of the imaginary parts of the second-order susceptibility as well as dielectric functions and together in Figs. 7 and 8 for selenium and tellurium, respectively, in order to understand the prominent features in the spectra of . For selenium, Fig. 7 shows that the threshold of the spectra and also the absorption edge of is at 0.87 eV (), while the absorption edge of is at 1.73 eV (). Therefore, the SHG spectra can be divided into two parts. The first part from 0.87 to 2.50 eV stems predominantly from double-photon resonances. The second part (above 2.5 eV) is mainly associated single-photon resonances with some contribution from double-photon resonances [see Figs. 7(c) and 7(f)]. These two types of resonances cause the SHG spectra to oscillate and decrease gradually in the higher energy region. Figure 7 indicates that for selenium, both the real and imaginary parts of the second-order NLO susceptibility show an oscillatory behavior with the energy. Indeed, the spectrum of oscillates rapidly and has the maximum of about 0.4910-6 esu at 3.6 eV [see Fig. 7(e)]. It is clear from Fig. 7(b) that the spectrum of the absolute value of shows a broad plateau from 1.34 eV to 3.44 eV and reaches the maximum of 1.8510-6 esu at 1.7 eV which is a few times larger than that of GaN Gavrilenko2000 ; Cai2009 , a widely used NLO semiconductor.
For tellurium, likewise, the spectral structure in the energy range from 0.16 () to 1.0 eV () is formed mainly by double-photon () resonances. The rest structure (above 1.0 eV) arises mainly from single-photon () resonances with some contribution from resonances. It is noted that all the NLO susceptibilities of tellurium are rather large in the photon energy range of 0.03.0 eV. For example, the magnitude of is around 4.7210-6 esu at 0.96 eV. Interestingly, for both systems, the real part, imaginary part and absolute value of are smaller than , and produce relatively pronounced oscillations compared to . The phenomenon is explained by the fact that the two materials are helical chains along the -axis and possess a high degree of anisotropy. In particular, the absolute value of second-order NLO susceptibility of tellurium is as high as 8.6910-6 esu at 0.94 eV, which is nearly sixteen times larger than that of GaN Gavrilenko2000 ; Cai2009 . This suggests that tellurium would be a superior NLO material and has potential application in NLO and LEO optical devices such as frequency conversion, optical switching, second-harmonic generation, optical modulation and sensing devices.
IV CONCLUSION
To conclude, we have calculated the linear and nonlinear optical properties of trigonal selenium and tellurium based on the DFT with the GGA. In order to adequately take into account of many-body effects especially quasiparticle self-energy correction, we further perform the relativistic band structure calculations using the hybrid Heyd-Scuseria-Ernzerhof functional and use the much improved band gaps to calculate the optical properties with the scissors corrections. We find that the two materials exhibit large SHG and LEO effects. Also, their linear and nonlinear optical responses are highly anisotropic due to their structural anisotropy. In particular, the second-order NLO susceptibilities of tellurium are huge in the photon energy range of 03 eV, with the magnitudes of being as large as 8.6910-6 esu, which is about sixteen times larger than that of GaN, a widely used NLO material. Furthermore, tellurium is found to exhibit gigantic static SHG coefficients with the component being up to 100 times larger than that of GaN. On the other hand, selenium is shown to possesses large LEO coefficient which are more than six times larger than that of GaN polytypes. Therefore, tellurium and selenium are excellent NLO materials and may find valuable applications in NLO and LEO devices such as electro-optical switch, frequency conversion, phase matching and light signal modulator. Interestingly, our calculations also reveal that for the two different helical structures of each material, the values of are equal but the values of differ in sign, thus suggesting that the SHG spectroscopy is a useful probe of the chirality of these helical materials. The calculated static dielectric constants and also SHG coefficients at the CO2 laser frequency are in good agreement with the experiments. Furthermore, the energy positions and shapes of the principal features in the calculated optical dielectric function spectra of both materials agree rather well with the available experimental ones. They are also analyzed in terms of the calculated electronic band structures especially symmetries of the involved band states and dipole transition selection rules. The prominent structures in the spectra of are also related to single-photon and double-photon resonances. We believe that our work will stimulate further experiments on the NLO and LEO effects in these interesting materials.
ACKNOWLEDGEMENTS
M. C. thanks Department of Physics and Center for Theoretical Physics, National Taiwan University for its hospitality during her three months visit there when parts of this work were carried out. Work at Xiamen University is supported by the National Key RD Program of China (Grant No. 2016YFA0202601), and the National Natural Science Foundation of China (No. 11574257). G. Y. G. acknowledges support from the Ministry of Science and Technology, the Academia Sinica, the National Center for Theoretical Sciences in Taiwan.
References
- (1) Y. R. Shen, The Principle of Nonlinear Optics (Wiley, New Year, 1984).
- (2) R. W. Boyd, Nonlinear Optics (Elsevier, Amsterdam, 2003).
- (3) R. K. Chang, J. Ducuing and N. Bloembergen, Dispersion of the optical nonlinearity in semiconductoros, Appl. Phys. Rev. Lett. 5, 17 (1965).
- (4) H. Zhong, Z. H. Levine, D. C. Allan and J. W. Wilkins, Band-theoretical calculation of the optical activity tensor of -quartz and trigonal Se. Phys. Rev. B 48, 1384 (1993).
- (5) J. L. P. Hughes and J. E. Sipe, Calculation of second-order optical response in semiconductors. Phys. Rev. B 53, 10751 (1996).
- (6) V. I. Gavrilenko and R. Q. Wu, Linear and nonlinear optical properties of group-III nitrides. Phys. Rev. B 61, 2632 (2000).
- (7) D. Cai and G.-Y. Guo, Tuning linear and nonlinear optical properties of wurtzite GaN by -axial stress, J. Phys. D: Appl. Phys. 42, 185107 (2009).
- (8) G. Y. Guo, K. C. Chu, D.-S. Wang and C.-G. Duan, Linear and nonlinear optical properties of carbon nanotubes from first-principles calculations. Phys. Rev. B 69, 205416 (2004).
- (9) G. Y. Guo and J. C. Lin, Second-harmonic generation and linear electro-optical coefficients of BN nanotubes. Phys. Rev. B 72, 075416 (2005).
- (10) C.-Y. Wang and G.-Y. Guo, Nonlinear optical properties of transition-metal dichalcogenide MX2 (M= Mo, W; X= S, Se) monolayers and trilayers from first-principles calculations. J. Phys. Chem. C 119,13268 (2015).
- (11) L. Hu, X. Huang, D. Wei, Layer-independent and layer-dependent nonlinear optical properties of two-dimensional GaX (X= S, Se, Te) nanosheets. Phys. Chem. Chem. Phys. 19,11131 (2017).
- (12) H. Wang and X. Qian, Giant optical second harmonic generation in two-dimensional multiferroics. Nano Lett. 17, 5027 (2017).
- (13) S. R. Panday and B. M. Fregoso, Corrigendum: Strong second harmonic generation in two-dimensional ferroelectric IV-monochalcogenides (2017 J. Phys.: Condens. Matter 29 43LT01). J. Phys.: Condens. Matter 30, 179501 (2018).
- (14) T. W. Smith and R. A. Cheatham, Functional polymers in the generation of colloidal dispersions of amorphous selenium. Macromolecules 13, 1203 (1980).
- (15) D. R. Mees, W. Pysto and P. J. Tarcha, Formation of selenium colloids using sodium ascorbate as the reducing agent. J. Colloid Interface Sci. 170, 254 (1995).
- (16) J. A. Johnson, M.-L. Saboungi, P. Thiyagarajan, R. Csencsits and D. Meisel, Selenium nanoparticles: a small-angle neutron scattering study. J. Phys. Chem. B 103, 59 (1999).
- (17) H. Fan, Z. H. Wang, X. Z. Liu, W. W. Zheng, F. Guo and Y. T. Qian, Controlled synthesis of trigonal selenium crystals with different morphologies. Solid State Commun. 135, 319 (2005).
- (18) H. Peng, N. Kioussis and G. J. Snyder, Elemental tellurium as a chiral p-type thermoelectric material. Phys. Rev. B 89, 195206 (2014).
- (19) S. Q. Lin, W. Li, Z. W. Chen, J. W. Shen, B. H. Ge and Y. Z. Pei, Tellurium as a high-performance elemental thermoelectric. Nat. Commun. 7, 10287 (2016).
- (20) V. A. Shalygin, A. N. Sofronov, L. E. Vorob ev and I. I. Farbshtein, Current-induced spin polarization of holes in tellurium. Phys. Solid State 54, 2362 (2012).
- (21) L. A. Agapito, N. Kioussis, W. A. Goddard III and N. P. Ong, Novel family of chiral-based topological insulators: elemental tellurium under strain. Phys. Rev. Lett. 110, 176401 (2013).
- (22) V. A. Shalygin, M. D. Moldavskaya, S. N. Danilov, I. I. Farbshtein and L. E. Golub, Circular photon drag effect in bulk tellurium. Phys. Rev. B 93, 045207 (2016).
- (23) C. Şahin,; J. Rou, J. Ma and D. A. Pesin, Pancharatnam-Berry phase and kinetic magnetoelectric effect in trigonal tellurium. Phys. Rev. B 97, 205206 (2018).
- (24) S. S. Tsirkin, P. A. Puente and I. Souza, Gyrotropic effects in trigonal tellurium studied from first principles. Phys. Rev. B 97, 035158 (2018).
- (25) M. Hirayama, R. Okugawa, S. Ishibashi, S. Murakami and T. Miyake, Weyl node and spin texture in trigonal tellurium and selenium. Phys. Rev. Lett. 114, 206401 (2015).
- (26) K. Nakayama, M. Kuno, K. Yamauchi, S. Souma, K. Sugawara T. Oguchi, ; T. Sato and T. Takahashi, Band splitting and Weyl nodes in trigonal tellurium studied by angle-resolved photoemission spectroscopy and density functional theory. Phys. Rev. B 95, 125204 (2017).
- (27) C. Patel, Optical Harmonic Generation in the Infrared Using a C O2 Laser. Phys. Rev. Lett. 16, 613 (1966).
- (28) S. Tutihasi and I. Chen, Optical properties and band structure of trigonal selenium. Phys. Rev. 158, 623 (1967).
- (29) G. G. Roberts, S. Tutihasi and R. C. Keezer, Optical absorption edge of trigonal selenium. Phys. Rev. 166, 637 (1968).
- (30) G. W. Day, Linear and nonlinear optical properties of trigonal selenium. Appl. Phys. Lett. 18, 347 (1971).
- (31) J. McFee, G. Boyd, P. Schmidt, Redetermination of the Nonlinear Optical Coefficients of Te and GaAs by Comparison with Ag3SbS3. Appl. Phys. Lett. 17, 57 (1970).
- (32) W. D. Teuchert, R. Geick, G. Landwehr, H. Wendel and W. Weber, Lattice dynamics of trigonal selenium. I. Phonon spectra. J. Phys. C: Solid State Phys. 8, 3725 (1975).
- (33) R. Keller, W. B. Holzapfel and H. Schulz, Effect of pressure on the atom positions in Se and Te. Phys. Rev. B 16, 4404 (1997).
- (34) K. Seifert, J. Hafner, J. Furthmüller and G. Kresse, The influence of generalized gradient corrections to the LDA on predictions of structural phase stability: the Peierls distortion in As and Sb. J. Phys.: Condens. Matter 7, 3683 (1995).
- (35) J. P. Perdew, K. Burke and M. Ernzerhof, Generalized gradient approximation made simple. Phys. Rev. Lett. 77, 3865 (1996).
- (36) P. E. Blöchl, Projector augmented-wave method. Phys. Rev. B 50, 17953 (1994).
- (37) G. Kresse and J. Furthmüller, Efficient iterative schemes for ab initio total-energy calculations using a plane-wave basis set. Phys. Rev. B 54, 11169 (1996).
- (38) G. Kresse and J. Furthmüller, Efficiency of ab-initio total energy calculations for metals and semiconductors using a plane-wave basis set. Comput. Mater. Sci. 6, 15 (1996).
- (39) P. E. Blöchl, O. Jepsen and O. K. Andersen, Improved tetrahedron method for Brillouin-zone integrations. Phys. Rev. B 49, 16223 (1994).
- (40) G. Y. Guo and J. C. Lin, Systematic ab initio study of the optical properties of BN nanotubes. Phys. Rev. B 71, 165402 (2005).
- (41) B. Adolph, J. Furthmüller and F. Bechstedt, Optical properties of semiconductors using projector-augmented waves. Phys. Rev. B 63, 125108 (2005).
- (42) V. B. Anzin, M. I. Eremets, Y. V. Kosichkin, A. I. Nadezhdinskii, and A. M. Shirokov, Measurement of the energy gap in tellurium under pressure. Phys. Status Solidi (a) 42, 385 (1977).
- (43) J. Heyd, G. E. Scuseria, M. Ernzerhof, Hybrid functionals based on a screened Coulomb potential. J. Chem. Phys. 118, 8207 (2003).
- (44) Z. H. Levine and D. C. Allan, Quasiparticle calculation of the dielectric response of silicon and germanium. Phys. Rev. B 43, 4187 (1991).
- (45) E. D. Palik, Handbook of Optical Constants of Solids II (Academic, Orlando, 1985).
- (46) R. Sandrock, Interpretation of the ultraviolet spectrum of trigonal selenium. Phys. Status Solidi (b) 48, 199 (1971).
- (47) P. Bammes, R. Klucker, E. E. Koch and T. Tuomi, Anisotropy of the dielectric constants of trigonal selenium and tellurium between 3 and 30 eV. Phys. Status Solidi (b) 49, 561 (1972).
- (48) S. Tutihashi, G. G. Roberts, R. C. Keezer and R. E. Drews, Optical properties of tellurium in the fundamental absorption region. Phys. Rev. 177, 1143 (1969).
- (49) H. Isomäki, J. Von Boehm, P. Krusius and T. Stubb, Self-consistent electronic spectrum of trigonal Te. Pressure dependence of energy spectrum. Phys. Rev. B 22, 2945 (1980).
- (50) J. Treusch and R. Sandrock, Energy band structures of selenium and tellurium. Phys. Status Solidi (b) 16, 487 (1966).