CDM or self-interacting neutrinos? - how CMB data can tell the two models apart
Abstract
Of the many proposed extensions to the CDM paradigm, a model in which neutrinos self-interact until close to the epoch of matter-radiation equality has been shown to provide a good fit to current cosmic microwave background (CMB) data, while at the same time alleviating tensions with late-time measurements of the expansion rate and matter fluctuation amplitude. Interestingly, CMB fits to this model either pick out a specific large value of the neutrino interaction strength, or are consistent with the extremely weak neutrino interaction found in CDM, resulting in a bimodal posterior distribution for the neutrino self-interaction cross section. In this paper, we explore why current cosmological data select this particular large neutrino self-interaction strength, and by consequence, disfavor intermediate values of the self-interaction cross section. We show how it is the CMB temperature anisotropies, most recently measured by the Planck satellite, that produce this bimodality. We also establish that smaller scale temperature data, and improved polarization data measuring the temperature-polarization cross-correlation, will best constrain the neutrino self-interaction strength. We forecast that the upcoming Simons Observatory should be capable of distinguishing between the models.
I introduction
Within the Standard Model of particle physics, neutrinos remain elusive. While universally present, their weak interactions with other particles make them difficult to study directly. Neutrino oscillation experiments have shown that neutrinos have mass Ahmad et al. (2001); Fukuda et al. (1998), but the Standard Model does not account for the mechanism that generates this mass Weinberg (1979); Yanagida (1980); Mohapatra and Senjanovic (1980); Schechter and Valle (1980). This presents the neutrino sector as an intriguing source of new physics.
In the Standard Model we assume neutrinos interact only through the electroweak interaction and decouple from the cosmic plasma at a temperature of 1.5 MeV Cyburt et al. (2016). Once decoupled, the neutrinos freely streamed through the early universe, interacting only through gravity. The free-streaming of these gravitationally coupled neutrinos imposes a shear stress on the matter as it streams past, damping acoustic oscillations in the photon-baryon plasma and boosting CDM fluctuations at horizon entry Bashinsky and Seljak (2004). Recent observations of the Cosmic Microwave Background (CMB), most recently by the Planck satellite Aghanim et al. (2018), have put bounds on neutrino parameters, including the effective number of neutrino species () and the sum of the species’ masses ( at 95% confidence, or combined with baryon acoustic oscillation data). This is approaching the lower mass limit for the inverted neutrino hierarchy, eV, from neutrino oscillation experiments Ahmad et al. (2001); Fukuda et al. (1998). Cosmological data can now put competitive constraints on neutrino physics.
New neutrino interactions have become a topic of increasing interest due their impact on cosmological observables via altering neutrino free-streaming during the radiation dominated era (see e.g. Refs. Bialynicka-Birula (1964); Bardin et al. (1970); Gelmini and Roncadelli (1981); Chikashige et al. (1980); Barger et al. (1982); Raffelt and Silk (1987); Kolb and Turner (1987); Konoplich and Khlopov (1988); Berkov et al. (1988); Belotsky et al. (2001); Hannestad (2005); Chacko et al. (2005); Hannestad and Raffelt (2005); Sawyer (2006); Mangano et al. (2006); Friedland et al. (2007); Hooper (2007); Serra et al. (2010); van den Aarssen et al. (2012); Jeong and Takahashi (2013); Laha et al. (2014); Archidiacono et al. (2015); Ng and Beacom (2014); Cherry et al. (2014); Archidiacono et al. (2016a); Cherry et al. (2016); Archidiacono et al. (2016b); Dvali and Funcke (2016); Capozzi et al. (2017); Brust et al. (2017); Forastieri (2017); Balducci et al. (2018); Lorenz et al. (2019); Choi et al. (2018)). Past studies Cyr-Racine and Sigurdson (2014); Kreisch et al. (2019); Lancaster et al. (2017); Archidiacono and Hannestad (2014); Oldengott et al. (2017); Barenboim et al. (2019) have explored the viability of stronger neutrino self-scattering, using a Yukawa interaction model parameterized by an interaction strength, . Here the rate of scattering, , scales as where is the temperature of the cosmic neutrino background Cyr-Racine and Sigurdson (2014); Lancaster et al. (2017); Kreisch et al. (2019); Archidiacono and Hannestad (2014); Oldengott et al. (2017). Increasing strengthens the neutrino-neutrino coupling in the early Universe. Thus, increasing ultimately delays neutrino free-streaming to epochs of lower energies and lower redshifts.
A delay in the onset of neutrino free-streaming affects the amplitude and phases of the CMB power spectrum (see Kreisch et al. (2019); Baumann et al. (2016) for more details.). A model with non-zero value of has been shown to fit current cosmological data and produce a bimodal posterior probability for the interaction rate: a ‘weak’ mode with low self-scattering strength , essentially indistinguishable from no self-scattering (CDM), and a ‘strong’ self-interacting mode with of order MeV-2, where the neutrinos decouple at neutrino temperatures as low as 25 eV Cyr-Racine and Sigurdson (2014); Kreisch et al. (2019); Lancaster et al. (2017). The strong mode is particularly interesting as it has a larger predicted Hubble constant Riess et al. (2018) than the usual CDM model, and a lower predicted amplitude of structure Hikage et al. (2018), which are preferred by other astronomical datasets.
In this paper we further explore which aspects of current CMB data produce the degeneracy between the two models. We identify the part of the Planck data responsible for producing the bimodality, which was not present with the WMAP data, and show how the data exclude models with moderate self-interaction. We then assess how upcoming CMB data might distinguish between the two models. This extends similar investigations in Lancaster et al. (2017).
II Methods
We use MCMC methods to map out the posterior distribution for a 9-parameter cosmological model: 6 parameters are the usual CDM parameters (baryon density, cold dark matter density, angular peak position, spectral index and amplitude, and optical depth) and we also vary the effective number of neutrino species, , the sum of neutrino masses, , and the interaction strength . We impose linear priors on all parameters, except which takes a logarithmic prior. This prior choice is further discussed in Section III.1. We use the CosmoMC sampling code Lewis and Bridle (2002) with Multinest Feroz and Hobson (2008), which is well-suited to multimodal posteriors. We use the same modified Boltzmann code, CAMB, as in Kreisch et al. (2019), and implement the same modifications in the CLASS code as a cross-check.
The datasets used are Planck 2015 temperature and lensing likelihood using the Plik-lite code Planck Collaboration (2016); Lewis et al. (2016), combined with current BAO data Beutler et al. (2011); Anderson et al. (2014); Ross et al. (2015), and a gaussian prior on the optical depth of from Planck. We also examine the effect of replacing just the Planck TT data with the WMAP 9-year TT and TE data Bennett et al. (2013), using the same BAO data and optical depth prior. Additionally, we generate simulated TT, TE and EE spectra representative of the upcoming Simons Observatory (SO), with co-added white noise levels of 5K-amin over 40% of the sky, a 1.4′ beam and maximum multipoles of in temperature and in polarization Aguirre et al. (2019)111In this study we do not include the non-white noise and residual foregrounds considered in Aguirre et al. (2019).. We describe the input models for these simulations in Sec. III.3.
III Results
III.1 Parameter distributions with current data
In Figure 1 we show a set of the posterior distributions for the sampled and derived parameters for the Planck data compared to the WMAP data. Both data were accompanied by the same BAO data and prior. For Planck we find results consistent with Kreisch et al. (2019); Lancaster et al. (2017), with a bimodal distribution for . One mode is consistent with CDM, and the other ‘strong’ mode has non-zero interactions. We identify the preferred parameters for each mode by plotting them separately in Figure 1, in addition to the joint distribution. The weak mode has , eV, and at 95% CL whereas the strong mode prefers and has eV, at 95% CL. The strong mode also has a higher Hubble constant, a smaller comoving sound horizon at baryon drag epoch, , and a lower amplitude of the matter power spectrum, . These parameter differences compensate for the introduction of the non-zero . The strong mode gives a better consistency between Planck and WMAP in their best fitting and posteriors which is desirable.
It is important to consider how much the choice of prior impacts the parameters. The posterior for the strongly self-interacting neutrinos is enhanced if we impose a linear prior on , as the density of points probed is higher around the region where is non-zero. For our logarithmic prior, the parameter volume of an interacting scenario is relatively smaller. For our analysis, we chose a logarithmic prior as it does not make an explicit choice for the energy scale of the problem Cyr-Racine and Sigurdson (2014).
When using the WMAP data, which measures angular multipoles , we find in Figure 1 that the distribution is not bimodal. Instead, the neutrino self-interaction strength is consistent with zero and has an upper limit of at 95% confidence. It is only when using smaller-scale data, with , that the bimodality appears. Indeed, this bimodality was first found when combining WMAP data with data from the ACT and SPT small-scale CMB experiments (Cyr-Racine and Sigurdson, 2014). Figure 1 also shows that the WMAP data do not favor the strongly interacting mode, implying that the smaller scale data in the range enhance the preference for the strong mode.
III.2 CMB spectra as a function of increasing
To understand why the two models fit both datasets well, and why the central region with MeV2 is excluded by the Planck data, we identify best-fitting models in each of the two peaks of the distribution: one with no, or low, self-interaction (essentially CDM), and the other with high self-interaction strength. Sampling evenly spaced points along the straight line connecting the peaks in the nine-dimensional parameter space, as shown in Figure 2, we compute the likelihood of each of the datasets, and generate the CMB power spectra corresponding to each point.
Figure 3 shows the Planck ‘Plik-lite’ along this path. We find that the two modes are each similarly well fitted to the data, with but there exists a valley of bad fitting in between them. This is at , at which is about 100 lower than at the two peaks.
There is a curved path between the two peaks that has a more modest reduction in likelihood: the point at which the two modes have most overlap is displaced from the line that directly connects the peaks in 9-dimensional space. We also find that the low- CMB temperature, the CMB lensing and the BAO are roughly constant along the path shown in Figure 2. It is the high- CMB data that exclude the central region and create the bimodality.
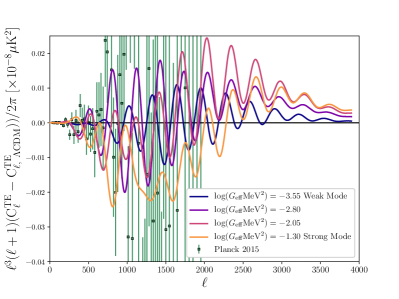
In Figure 4 we show the TT, and TE spectra for these four models with increasing , showing the fractional residual between the spectra and the best-fitting CDM model. Since Planck provides a good measurement up to , the two modes fit the data well and do not show significant residuals in TT or TE. In constrast, the power spectra corresponding to points in parameter space between the two modes that a reasonable fit to WMAP data as seen in Figure 1 do not fit the Planck TT data at , range similar to that of WMAP.
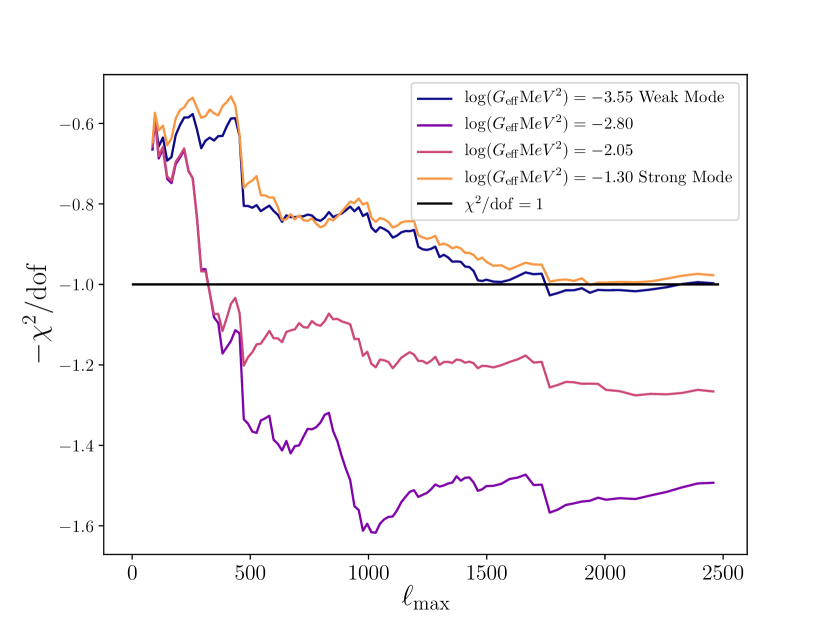
We examine this scale dependence in more detail by calculating how the , per degree of freedom (dof), depends on the smallest scale included, , as shown in Figure 5. There are significant drops for the two intermediary points around 500 and 1000. With these two drops, the of those two points are at respectively, excluding them from viability. Meanwhile, the two peaks steadily approach . This is an additional illustration that the data prefer the two modes but disfavor intermediate interaction strengths.

III.3 Impact of upcoming CMB data
We explore how upcoming data from the Simons Observatory (SO) will effect the bimodality. Since the posterior is bimodal, we generate two different simulated models 222Simulated data are produced using the makeperfectforecast.py code within CosmoMC.. One simulated power spectrum is generated with the best-fitting weak mode power spectra, the other with the best-fitting strong mode power spectra, shown in Figure 4.
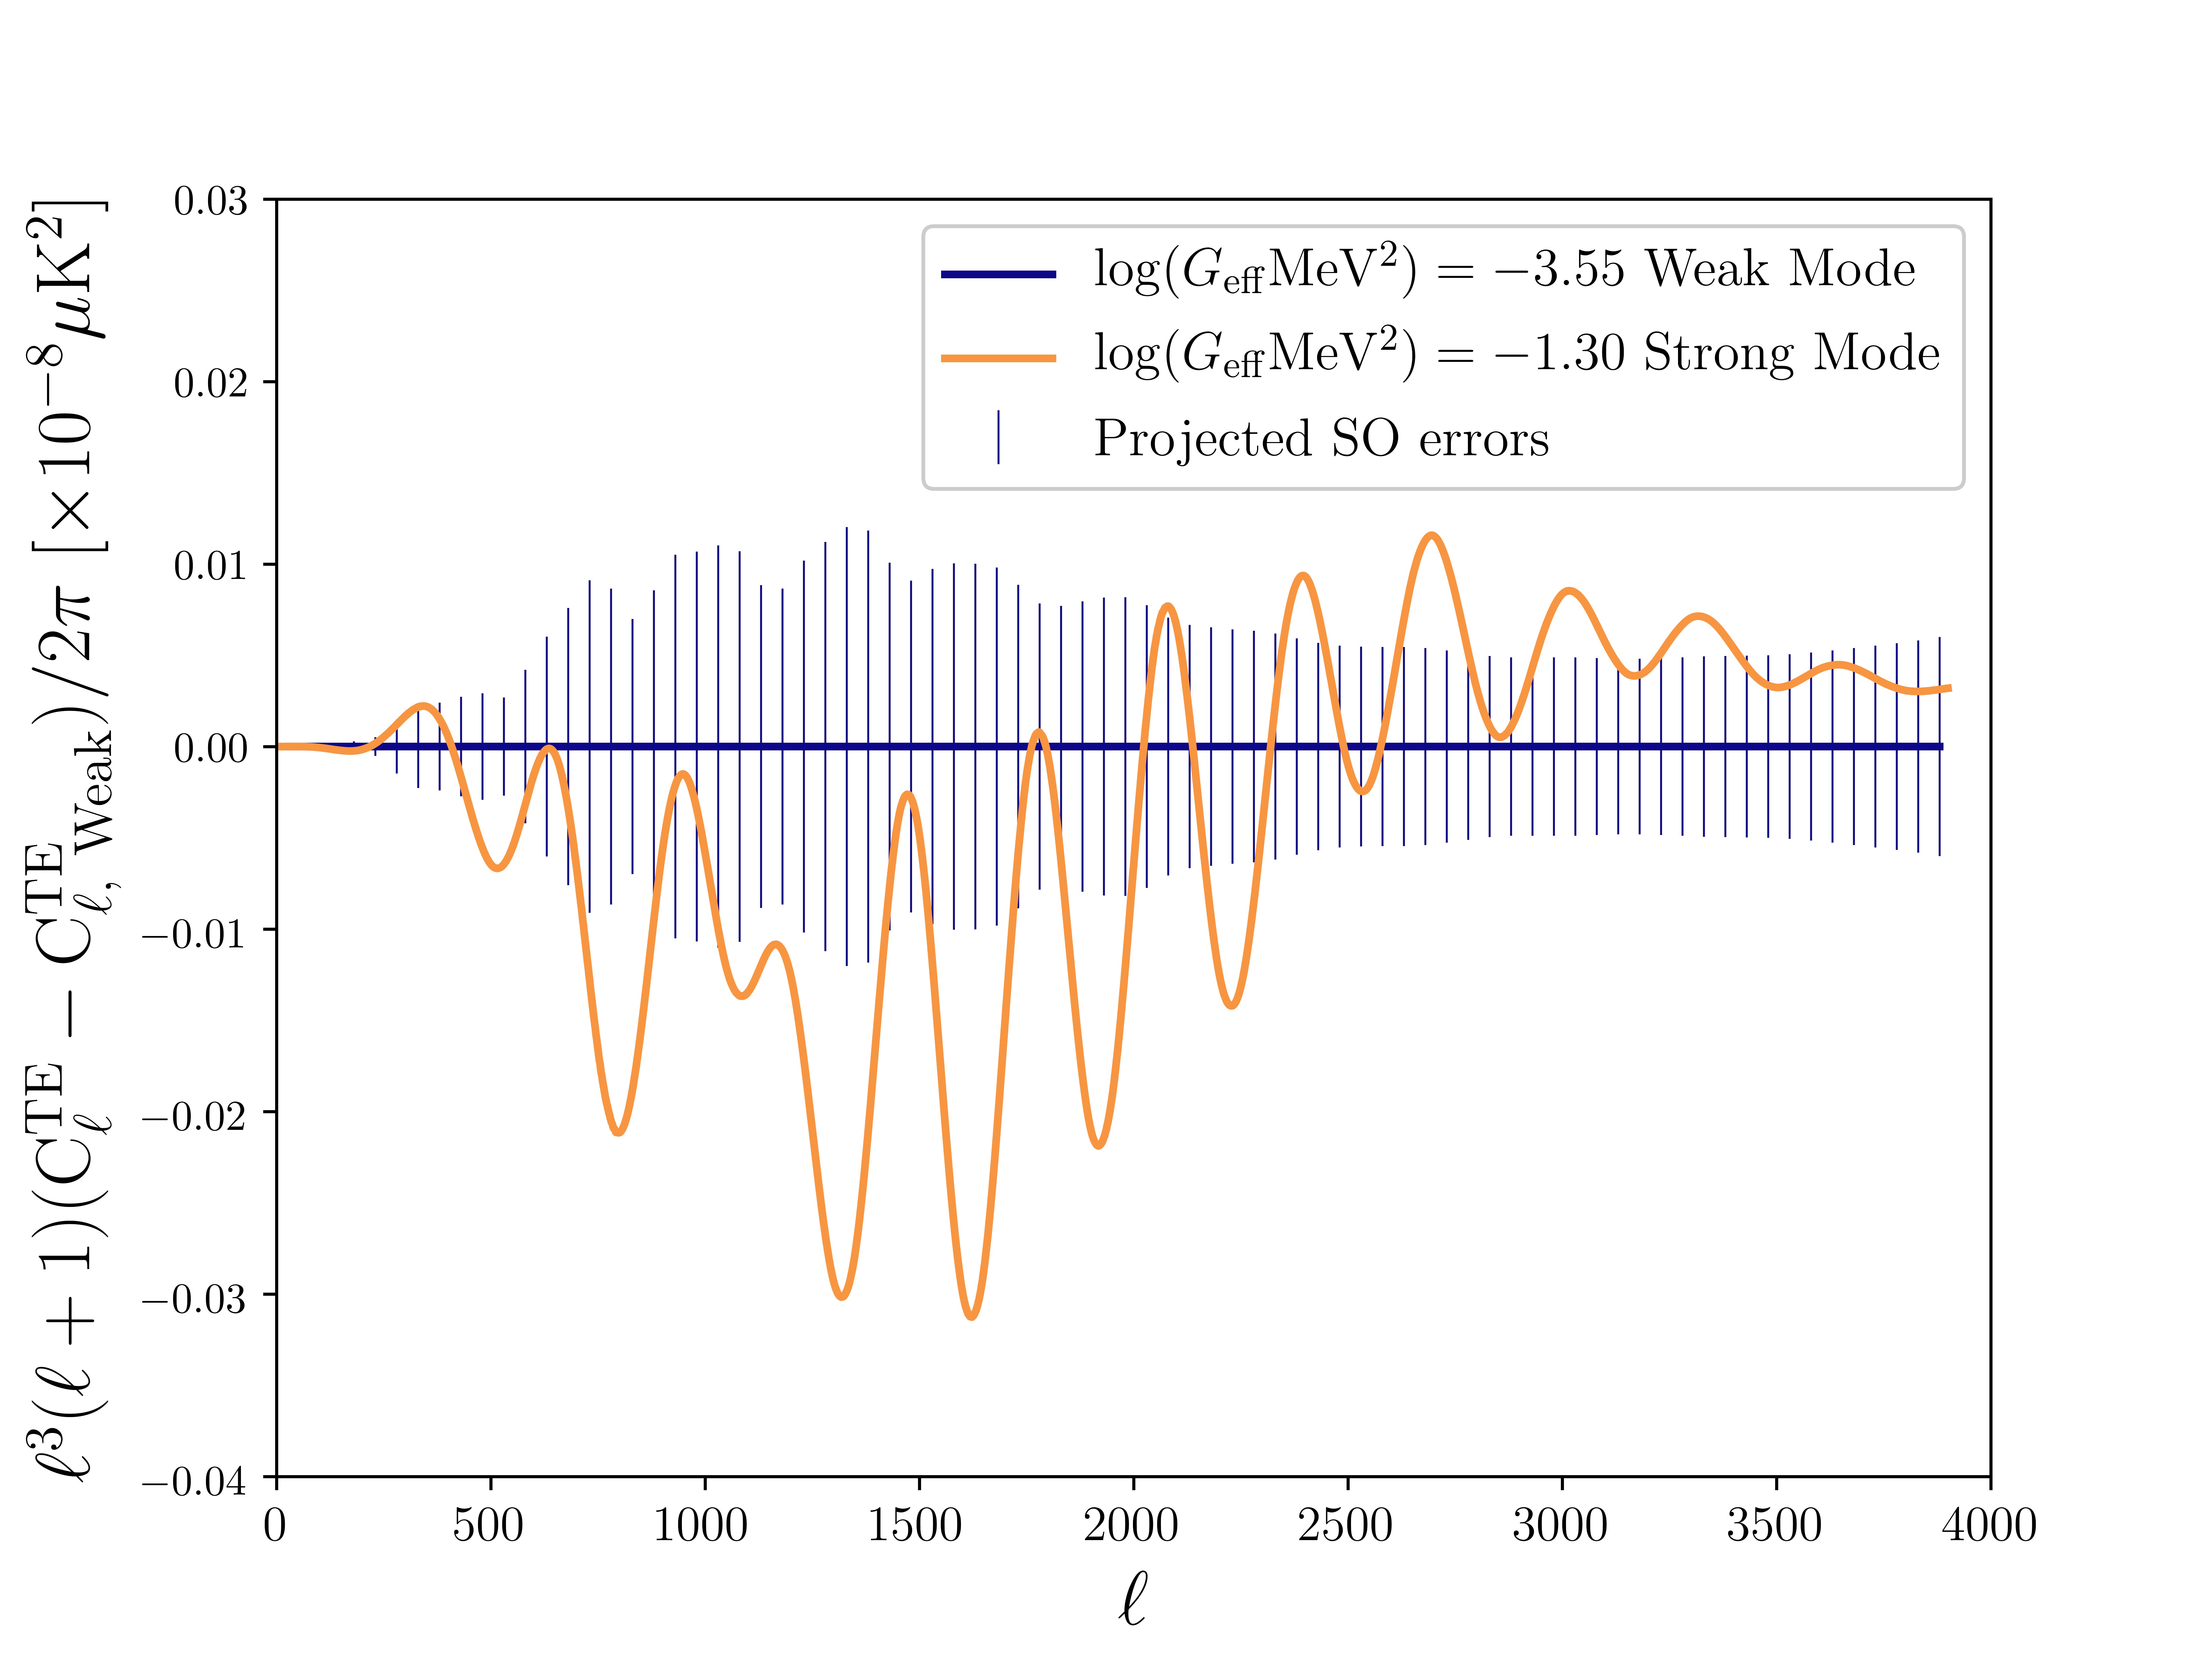
Figure 4 shows that at smaller scales than measured by Planck, the two modes diverge from each other. Including the forecasted SO uncertainties, we find that the strong mode differs from the weak mode by more than 1-sigma at . This suggests that with improved small-scale data, we could potentially rule out one of the modes. Furthermore, the two modes also have significantly different TE spectra. We show forecasted SO uncertainties on the weak mode in Figure 6, finding that the strong mode differs from the weak mode by more than 1 at most minima. This indicates that the improved TE spectrum’s sensitivity to the phase of the CMB power spectrum will help put further constraints on the bimodality.
The forecasted distributions for SO are shown in Figure 7. The distributions are narrowed significantly compared to those shown in Figure 1 for Planck, suggesting that SO data will be capable of further constraining the parameters for each mode. Indeed, the forecasted constraints on neutrino physics in the weak mode tighten compared to the distributions in Figure 1 such that the upper bound of decreases, the upper bound of decreases by , and the errors on decreases by about 70%. For the strong mode, the errors decrease by about 80% for , by about 60% for , and by 85% for .
In each case, for either the strong or weak mode as the input model, the Multinest MCMC routine does not find the other mode. In fact, the other mode is excluded by many standard deviations. So, if SO finds the data to be significantly closer to one mode than the other, the data would exclude the non-favored mode.
This is expected as SO will better measure the high TT data, and provide an improved measurement of the TE power spectrum data as shown in Figures 4 and 6, which are the areas of CMB power spectra data where the two models are non-degenerate. If the true model is CDM, the forecasted uncertainties are small enough to be able to rule out the strong mode. In contrast, if the true model is the best-fitting strongly interacting mode, SO could potentially rule out CDM.
IV Conclusion
By comparing the probability distributions in the parameter space using WMAP and Planck data we show that the Planck data in the angular range allow a model with strongly interacting neutrinos, and disfavor a model with more moderate interactions. We explore this in more detail by looking at the power spectra and at the likelihood of the data for increasing . We highlight that high TT, and improved TE data will be pivotal in constraining or ruling out the bimodality. The Simons Observatory will make these measurements and is forecasted to significantly improve constraints. If the data were to favor it, SO would be capable of ruling out the bimodality. The strong mode has cosmological parameters that are significantly different to CDM, including a higher Hubble constant, lower amplitude of structure, higher neutrino mass and higher effective neutrino species. While the particular model considered here is ad-hoc, further exploration of physical models for the neutrino sector seem warranted.
Acknowledgements.
We thank David Spergel and Lyman Page for useful comments and Olivier Doré for early comments. M. P. acknowledges the support of the Department of Astrophysical Sciences at Princeton University. C. D. K. acknowledges support from the National Science Foundation award number DGE1656466 at Princeton University. F.-Y. C.-R. acknowledges the support of the National Aeronautical and Space Administration (NASA) ATP grant NNX16AI12G at Harvard University. Part of this research was carried out during the Undergraduate Summer Research Program at the Department of Astrophysical Sciences, Princeton University. This is not an official SO Collaboration paper.References
- Ahmad et al. (2001) Q. R. Ahmad et al. (SNO), Phys. Rev. Lett. 87, 071301 (2001), arXiv:nucl-ex/0106015 [nucl-ex] .
- Fukuda et al. (1998) Y. Fukuda, T. Hayakawa, E. Ichihara, K. Inoue, K. Ishihara, H. Ishino, Y. Itow, T. Kajita, J. Kameda, S. Kasuga, et al., Physical Review Letters 81, 1562 (1998).
- Weinberg (1979) S. Weinberg, Phys. Rev. Lett. 43, 1566 (1979).
- Yanagida (1980) T. Yanagida, Progress of Theoretical Physics 64, 1103 (1980), oup.prod.sis.lan/ptp/article-pdf/64/3/1103/5394376/64-3-1103.pdf .
- Mohapatra and Senjanovic (1980) R. N. Mohapatra and G. Senjanovic, Phys. Rev. Lett. 44, 912 (1980), [,231(1979)].
- Schechter and Valle (1980) J. Schechter and J. W. F. Valle, Phys. Rev. D22, 2227 (1980).
- Cyburt et al. (2016) R. H. Cyburt, B. D. Fields, K. A. Olive, and T.-H. Yeh, Rev. Mod. Phys. 88, 015004 (2016), arXiv:1505.01076 [astro-ph.CO] .
- Bashinsky and Seljak (2004) S. Bashinsky and U. Seljak, Phys. Rev. D69, 083002 (2004), arXiv:astro-ph/0310198 [astro-ph] .
- Aghanim et al. (2018) N. Aghanim, Y. Akrami, M. Ashdown, J. Aumont, C. Baccigalupi, M. Ballardini, A. Banday, R. Barreiro, N. Bartolo, S. Basak, et al., arXiv preprint arXiv:1807.06209 (2018).
- Bialynicka-Birula (1964) Z. Bialynicka-Birula, Nuovo Cim. 33, 1484 (1964).
- Bardin et al. (1970) D. Y. Bardin, S. M. Bilenky, and B. Pontecorvo, Phys.Lett. B32, 121 (1970).
- Gelmini and Roncadelli (1981) G. Gelmini and M. Roncadelli, Phys.Lett. B99, 411 (1981).
- Chikashige et al. (1980) Y. Chikashige, R. N. Mohapatra, and R. Peccei, Phys.Rev.Lett. 45, 1926 (1980).
- Barger et al. (1982) V. D. Barger, W.-Y. Keung, and S. Pakvasa, Phys.Rev. D25, 907 (1982).
- Raffelt and Silk (1987) G. Raffelt and J. Silk, Phys.Lett. B192, 65 (1987).
- Kolb and Turner (1987) E. W. Kolb and M. S. Turner, Phys.Rev. D36, 2895 (1987).
- Konoplich and Khlopov (1988) R. V. Konoplich and M. Yu. Khlopov, Sov. J. Nucl. Phys. 47, 565 (1988), [Yad. Fiz.47,891(1988)].
- Berkov et al. (1988) A. V. Berkov, Yu. P. Nikitin, A. L. Sudarikov, and M. Yu. Khlopov, Sov. J. Nucl. Phys. 48, 497 (1988), [Yad. Fiz.48,779(1988)].
- Belotsky et al. (2001) K. M. Belotsky, A. L. Sudarikov, and M. Yu. Khlopov, Phys. Atom. Nucl. 64, 1637 (2001), [Yad. Fiz.64,1718(2001)].
- Hannestad (2005) S. Hannestad, Journal of Cosmology and Astroparticle Physics 0502, 011 (2005).
- Chacko et al. (2005) Z. Chacko, L. J. Hall, S. J. Oliver, and M. Perelstein, Phys. Rev. Lett. 94, 111801 (2005), arXiv:hep-ph/0405067 [hep-ph] .
- Hannestad and Raffelt (2005) S. Hannestad and G. Raffelt, Phys.Rev. D72, 103514 (2005), arXiv:hep-ph/0509278 [hep-ph] .
- Sawyer (2006) R. F. Sawyer, Phys.Rev. D74, 043527 (2006).
- Mangano et al. (2006) G. Mangano, A. Melchiorri, P. Serra, A. Cooray, and M. Kamionkowski, Phys. Rev. D 74, 043517 (2006).
- Friedland et al. (2007) A. Friedland, K. M. Zurek, and S. Bashinsky, (2007), arXiv:0704.3271 [astro-ph] .
- Hooper (2007) D. Hooper, Phys. Rev. D 75, 123001 (2007), arXiv:hep-ph/0701194 [hep-ph] .
- Serra et al. (2010) P. Serra, F. Zalamea, A. Cooray, G. Mangano, and A. Melchiorri, Phys.Rev. D81, 043507 (2010).
- van den Aarssen et al. (2012) L. G. van den Aarssen, T. Bringmann, and C. Pfrommer, Phys. Rev. Lett. 109, 231301 (2012), arXiv:1205.5809 [astro-ph.CO] .
- Jeong and Takahashi (2013) K. S. Jeong and F. Takahashi, Phys. Lett. B 725, 134 (2013), 10.1016/j.physletb.2013.07.001, arXiv:1305.6521 [hep-ph] .
- Laha et al. (2014) R. Laha, B. Dasgupta, and J. F. Beacom, Phys.Rev. D89, 093025 (2014), arXiv:1304.3460 [hep-ph] .
- Archidiacono et al. (2015) M. Archidiacono, S. Hannestad, R. S. Hansen, and T. Tram, Phys. Rev. D 91, 065021 (2015), arXiv:1404.5915 [astro-ph.CO] .
- Ng and Beacom (2014) K. C. Y. Ng and J. F. Beacom, Phys.Rev. D90, 065035 (2014), arXiv:1404.2288 [astro-ph.HE] .
- Cherry et al. (2014) J. F. Cherry, A. Friedland, and I. M. Shoemaker, (2014), arXiv:1411.1071 [hep-ph] .
- Archidiacono et al. (2016a) M. Archidiacono, S. Hannestad, R. S. Hansen, and T. Tram, Phys. Rev. D93, 045004 (2016a), arXiv:1508.02504 [astro-ph.CO] .
- Cherry et al. (2016) J. F. Cherry, A. Friedland, and I. M. Shoemaker, (2016), arXiv:1605.06506 [hep-ph] .
- Archidiacono et al. (2016b) M. Archidiacono, S. Gariazzo, C. Giunti, S. Hannestad, R. Hansen, M. Laveder, and T. Tram, Journal of Cosmology and Astroparticle Physics 1608, 067 (2016b), arXiv:1606.07673 [astro-ph.CO] .
- Dvali and Funcke (2016) G. Dvali and L. Funcke, Phys. Rev. D93, 113002 (2016), arXiv:1602.03191 [hep-ph] .
- Capozzi et al. (2017) F. Capozzi, I. M. Shoemaker, and L. Vecchi, Journal of Cosmology and Astroparticle Physics 1707, 021 (2017), arXiv:1702.08464 [hep-ph] .
- Brust et al. (2017) C. Brust, Y. Cui, and K. Sigurdson, Journal of Cosmology and Astroparticle Physics 1708, 020 (2017), arXiv:1703.10732 [astro-ph.CO] .
- Forastieri (2017) F. Forastieri, Proceedings, Neutrino Oscillation Workshop (NOW 2016): Otranto (Lecce), Italy, September 4-11, 2016, PoS NOW2016, 084 (2017).
- Balducci et al. (2018) O. Balducci, S. Hofmann, and A. Kassiteridis, Physical Review D 98, 023003 (2018), arXiv:1710.09846 [hep-ph] .
- Lorenz et al. (2019) C. S. Lorenz, L. Funcke, E. Calabrese, and S. Hannestad, Phys. Rev. D99, 023501 (2019), arXiv:1811.01991 [astro-ph.CO] .
- Choi et al. (2018) G. Choi, C.-T. Chiang, and M. LoVerde, Journal of Cosmology and Astroparticle Physics 1806, 044 (2018), arXiv:1804.10180 [astro-ph.CO] .
- Cyr-Racine and Sigurdson (2014) F.-Y. Cyr-Racine and K. Sigurdson, Physical Review D 90, 123533 (2014).
- Kreisch et al. (2019) C. D. Kreisch, F.-Y. Cyr-Racine, and O. Doré, arXiv preprint arXiv:1902.00534 (2019).
- Lancaster et al. (2017) L. Lancaster, F.-Y. Cyr-Racine, L. Knox, and Z. Pan, Journal of Cosmology and Astroparticle Physics 2017, 033 (2017).
- Archidiacono and Hannestad (2014) M. Archidiacono and S. Hannestad, Astropart. Phys 7, 1311 (2014).
- Oldengott et al. (2017) I. Oldengott, T. Tram, C. Rampf, and Y. Wong, Astropart. Phys 11, 1706 (2017).
- Barenboim et al. (2019) G. Barenboim, P. B. Denton, and I. M. Oldengott, arXiv e-prints , arXiv:1903.02036 (2019), arXiv:1903.02036 [astro-ph.CO] .
- Baumann et al. (2016) D. Baumann, D. Green, J. Meyers, and B. Wallisch, Journal of Cosmology and Astroparticle Physics 1601, 007 (2016), arXiv:1508.06342 [astro-ph.CO] .
- Riess et al. (2018) A. G. Riess, S. Casertano, W. Yuan, L. Macri, J. Anderson, J. W. MacKenty, J. B. Bowers, K. I. Clubb, A. V. Filippenko, D. O. Jones, et al., The Astrophysical Journal 855, 136 (2018).
- Hikage et al. (2018) C. Hikage et al. (HSC), (2018), 10.1093/pasj/psz010, arXiv:1809.09148 [astro-ph.CO] .
- Lewis and Bridle (2002) A. Lewis and S. Bridle, Phys. Rev. D 66, 103511 (2002).
- Feroz and Hobson (2008) F. Feroz and M. P. Hobson, Monthly Notices of the Royal Astronomical Society 384, 449 (2008).
- Planck Collaboration (2016) Planck Collaboration, Astronomy & Astrophysics 594, A11 (2016), arXiv:1507.02704 [astro-ph.CO] .
- Lewis et al. (2016) A. Lewis, D. Munshi, P. Ade, N. Aghanim, M. Arnaud, M. Ashdown, J. Aumont, C. Baccigalupi, A. Banday, P. Collaboration, et al., Astronomy and Astrophysics 594, A15 (2016).
- Beutler et al. (2011) F. Beutler, C. Blake, M. Colless, D. H. Jones, L. Staveley-Smith, L. Campbell, Q. Parker, W. Saunders, and F. Watson, Monthly Notices of the Royal Astronomical Society 416, 3017 (2011), arXiv:1106.3366 .
- Anderson et al. (2014) L. Anderson, É. Aubourg, S. Bailey, F. Beutler, V. Bhardwaj, M. Blanton, A. S. Bolton, J. Brinkmann, J. R. Brownstein, A. Burden, C.-H. Chuang, A. J. Cuesta, K. S. Dawson, D. J. Eisenstein, S. Escoffier, J. E. Gunn, H. Guo, S. Ho, K. Honscheid, C. Howlett, D. Kirkby, R. H. Lupton, M. Manera, C. Maraston, C. K. McBride, O. Mena, F. Montesano, R. C. Nichol, S. E. Nuza, M. D. Olmstead, N. Padmanabhan, N. Palanque-Delabrouille, J. Parejko, W. J. Percival, P. Petitjean, F. Prada, A. M. Price-Whelan, B. Reid, N. A. Roe, A. J. Ross, N. P. Ross, C. G. Sabiu, S. Saito, L. Samushia, A. G. Sánchez, D. J. Schlegel, D. P. Schneider, C. G. Scoccola, H.-J. Seo, R. A. Skibba, M. A. Strauss, M. E. C. Swanson, D. Thomas, J. L. Tinker, R. Tojeiro, M. V. Magaña, L. Verde, D. A. Wake, B. A. Weaver, D. H. Weinberg, M. White, X. Xu, C. Yèche, I. Zehavi, and G.-B. Zhao, Monthly Notices of the Royal Astronomical Society 441, 24 (2014), arXiv:1312.4877 .
- Ross et al. (2015) A. J. Ross, L. Samushia, C. Howlett, W. J. Percival, A. Burden, and M. Manera, Monthly Notices of the Royal Astronomical Society 449, 835 (2015), arXiv:1409.3242 .
- Bennett et al. (2013) C. L. Bennett et al. (WMAP), Astrophys. J. Suppl. 208, 20 (2013), arXiv:1212.5225 [astro-ph.CO] .
- Aguirre et al. (2019) J. Aguirre et al. (Simons Observatory), Journal of Cosmology and Astroparticle Physics 1902, 056 (2019), arXiv:1808.07445 [astro-ph.CO] .