SN 2017czd: A rapidly evolving supernova from a weak explosion of a type IIb supernova progenitor
Abstract
We present optical and near-infrared observations of the rapidly evolving supernova (SN) 2017czd that shows hydrogen features. The optical light curves exhibit a short plateau phase ( days in the -band) followed by a rapid decline by mag in after the plateau. The decline rate is larger than those of any standard SNe, and close to those of rapidly evolving transients. The peak absolute magnitude is mag in the -band, which is within the observed range for SNe IIP and rapidly evolving transients. The spectra of SN 2017czd clearly show the hydrogen features and resemble those of SNe IIP at first. The H line, however, does not evolve much with time and it becomes similar to those in SNe IIb at decline phase. We calculate the synthetic light curves using a SN IIb progenitor which has 16 at the zero-age main sequence and evolves in a binary system. The model with a low explosion energy ( erg) and a low 56Ni mass () can reproduce the short plateau phase as well as the sudden drop of the light curve as observed in SN 2017czd. We conclude that SN 2017czd might be the first identified weak explosion from a SN IIb progenitor. We suggest that some rapidly evolving transients can be explained by such a weak explosion of the progenitors with little hydrogen-rich envelope.
Subject headings:
supernovae: general – supernovae: individual (SN 2017czd)1. Introduction
Supernovae (SNe) are classified into some classes using the spectral features and light curve properties, which reflect the diversity in their progenitor stars and explosion mechanisms. SNe with hydrogen absorption features in their spectra and the plateau in their optical light curves are classified as Type II-plateau SNe (SNe IIP; Filippenko, 1997). Through the analysis of pre-explosion data (Smartt, 2009; Smartt et al., 2015), red supergiants are identified as progenitors of SNe IIP in full accord with standard theoretical predictions (e.g., Grassberg et al., 1971; Heger et al., 2003). SNe IIb exhibit both hydrogen and helium lines in their early spectra, and their optical light curves show one or two peaks (Bersten et al., 2018). Yellow supergiant stars have been detected in pre-explosion images for some SNe IIb (e.g., Aldering et al., 1994; Crockett et al., 2008; Van Dyk et al., 2014). SNe Ib/c do not show hydrogen features (Hunter et al., 2009; Benetti et al., 2011; Takaki et al., 2013). Although the progenitor detection is still limited for SNe Ib/c (Cao et al., 2013; Folatelli et al., 2016; Eldridge & Maund, 2016; Van Dyk et al., 2018), the progenitors should be massive stars in which hydrogen-rich envelopes are stripped either by stellar wind or binary interaction.
Through the analysis of light curves and spectra, combined with that of pre-explosion images, relationships between explosion and progenitor properties have been well studied for major classes of SNe (e.g., Hamuy, 2003; Pejcha & Prieto, 2015; Utrobin & Chugai, 2015; Lyman et al., 2016). However, the progenitor stars are still unclear for some peculiar SNe (e.g., Nakaoka et al., 2018; de Jaeger et al., 2018; Arcavi et al., 2017). One example is so-called rapidly evolving transients such as those discovered by Panoramic Survey Telescope and Rapid Response System (Pan-STARRS) (Drout et al., 2014). Their rise and decline rates are much faster than fast-evolving SNe Ib/c like SN 1994I (Richmond et al., 1996b). Recently, an increasing number of rapid transients have been found with wide-field and high-cadence survey, e.g., Subaru Hyper Suprime-Cam Transient Survey (Tanaka et al., 2016), Palomar Transient Factory (Whitesides et al., 2017), Dark Energy Survey Supernova Program (Pursiainen et al., 2018), and K2/Kepler (Rest et al., 2018). Most of them are discovered in star-forming galaxies, implying massive progenitors. However, the exact nature of the progenitors and explosions remain elusive.
The absolute peak magnitudes of rapidly evolving transients have a large variety, mag (Drout et al., 2014; Pursiainen et al., 2018). Spectral features also show a diversity: some of them show the blue featureless spectra with photospheric temperatures of 20000-30000 K (Drout et al., 2014; Pursiainen et al., 2018) while others show the absorption features including helium lines, e.g., for SNe 2002bj (Poznanski et al., 2010), 2005ek (Drout et al., 2013) and 2010X (Kasliwal et al., 2010). However, hydrogen features have never been clearly identified in rapidly evolving transients.
Many different kinds of scenarios have been proposed for the rapidly evolving transients. For example, rapidly evolving transients may be related to peculiar core-collapse SNe, e.g., ultra-stripped SNe (e.g., Tauris et al., 2013; Moriya et al., 2017a; De et al., 2018), electron-capture SNe (e.g., Moriya & Eldridge, 2016), magnetar-powered SNe (e.g., Whitesides et al., 2017), and failed core-collapse SN explosions (e.g., Moriya et al., 2010). The failed core-collapse SN explosions may also lead to the fallback accretion-powered rapidly evolving SNe (e.g., Dexter & Kasen, 2013). Some others may be powered by the interaction between the SN ejecta and the circumstellar material (CSM) (e.g., Kleiser et al., 2018b), which in fact nicely reproduces the light curves of well-observed KSN 2015K (Rest et al., 2018). Other proposed mechanisms include tidal disruption events (Drout et al., 2014) and peculiar thermonuclear explosions (Bildsten et al., 2007; Shen et al., 2010). In fact, the natures of the progenitor and explosion are not clear for many rapidly evolving transients partly due to the lack of good photometric and spectroscopic coverage. To understand the nature of rapid transients, extensive follow-up observations are necessary.
In this paper, we present our observations of rapidly evolving SN 2017czd. SN 2017czd was discovered by Koichi Itagaki on 2017 April 12.7 (UT) (Itagaki, 2017). About 1 day after the discovery, this SN was classified as a young SN II with the featureless and blue continuum through the spectroscopic observation (Hosseinzadeh et al., 2017). The host galaxy, UGC 9567, is an irregular galaxy with emission lines. The date of explosion is constrained by the last non-detection date (Apr 10.3) by Gaia Photometric Alerts. In this paper, the explosion date is assumed to be 2017 Apr 11.5 (defined as days, where is the time since the explosion in the rest frame), which is the middle of the last non detection and the first detection. The observational epochs are given with respect to the explosion date.
This paper is organized as follows. We introduce our observations and the data reduction in §2. We show the observed light curves and compare them with other SNe and other rapidly evolving transients in §3. We present our spectra and discuss similarities with SNe II in §4. In §5, we discuss the nature of SN 2017czd by constructing the bolometric light curve and by comparing it with the results of radiative transfer calculations based on a binary progenitor model. Finally, we give summary in §6. Throughout of the paper, the distance to the host galaxy is assumed to be 32.0 1.5 Mpc, adopting the distance from the recession velocity (; via NED111http://ned.ipac.caltech.edu/).
| ID | B | V | R | I |
|---|---|---|---|---|
| (mag) | (mag) | (mag) | (mag) | |
| C1 | 17.75(0.03) | 17.15(0.02) | 16.67(0.01) | 16.2(0.06) |
| C2 | 17.06(0.03) | 16.56(0.02) | 16.11(0.02) | 15.71(0.04) |
| C3 | 16.62(0.04) | 16.28(0.06) | 15.94(0.02) | 15.57(0.03) |
| C4 | 15.99(0.04) | 15.48(0.01) | 14.83(0.05) | 14.36(0.04) |
2. Observations and Data Reduction
Optical imaging data were obtained by using the Hiroshima One-shot Wide-field Polarimeter (HOWPol; Kawabata et al., 2008) and the Hiroshima Optical and Near-InfraRed Camera (HONIR; Sakimoto et al., 2012; Akitaya et al., 2014; Ui et al., 2014) installed to the 1.5-m Kanata telescope at the Higashi-Hiroshima Observatory, Hiroshima University. We obtained BVRI-band data with HOWPol in 30 nights from 2017 April 14.6 ( days) to 2018 April 18.5 ( days), and HONIR in 18 nights from 2017 April 13.6 ( days) to 2018 April 18.7 ( days). The last images obtained by HOWPol and HONIR are used for subtraction from the host galaxy. All magnitudes are given in the Vega magnitudes throughout the paper.
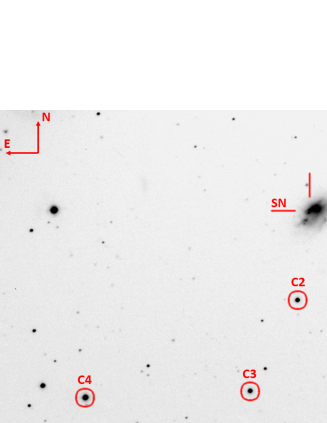
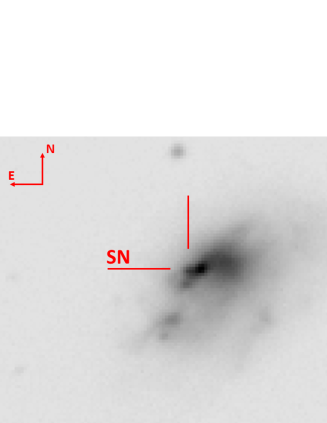
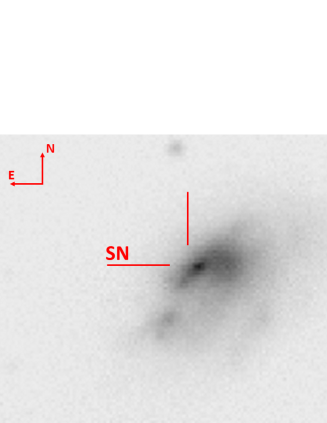
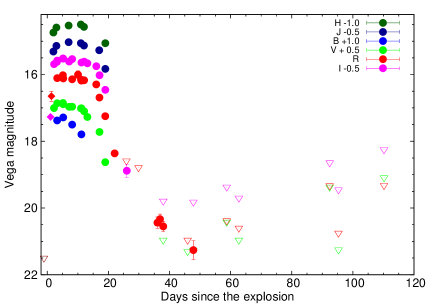
Contamination from the underlying emission from the host galaxy cannot be ignored in the optical data (see Figure 1). For optical photometry, we first performed image subtraction using the HOWPol and HONIR data taken at 2018 Apr 18 ( days). Then, we measured the brightness in the subtracted images using aperture photometry in the IRAF/DAOPHOT package (Stetson, 1987). Local comparison star magnitudes were calibrated using the photometric standard stars (Landolt, 1992) (see Figure 1 and Table 1). The color terms were also corrected. The obtained magnitudes are summarized in Table 2. Figure 2 shows the light curves of SN 2017czd.
We also performed the point-spread function (PSF) photometry of the SN in the discovery image obtained by Itagaki. We regard the non-filter magnitude as -band from the literature (Zheng et al., 2014). This photometric information is also included in the band light curves presented in this paper.
For the part of the -band images obtained using HOWPol and HONIR after days, the SN was not detected. We derived 5 sigma upper-limit magnitudes by measuring dispersion of the background sky brightness using the same apertures. The light curves show these upper limits (Figure 2).
We also obtained the optical images of SN 2017czd using the Gemini Multi-Object Spectrograph (GMOS, Hook et al., 2004) attached to the Gemini telescope on 2018 Jul 15 ( days). We confirmed that there was no object brighter than the underlying component of the host galaxy at the position of the SN in the -band images. We also confirmed that the brightness of the underlying component of the host galaxy is consistent with pre-explosion images obtained by Sloan Digital Sky Survey (SDSS) and Pan-STARRS.
The near infrared (NIR) imaging data were obtained using HONIR for 16 nights from 2017 Apr 13.6 ( days) to May 27.6 ( days). We took images with dithering to accurately subtract the bright foreground sky. We did not subtract the underlying component of the host galaxy for the NIR imaging data since its contamination was less than ( days). After the standard data reduction, we carried out the PSF photometry. Photometric calibrations were performed using the magnitudes of reference stars given in the 2MASS catalog (Persson et al., 1998). The derived JHKs-band magnitudes and the light curves are shown in Table 3 and Figure 2, respectively.
In the light curves, the Galactic extinction of (Schlafly & Finkbeiner, 2011) has been corrected. Since the absorption lines of Na i D at the wavelength corresponding to the host galaxy are not detected (equivalent width Å), we assume that the extinction within the host galaxy is negligible.
| MJD | Epoch | B | V | R | I | Instrument |
|---|---|---|---|---|---|---|
| (day) | (mag) | (mag) | (mag) | (mag) | ||
| 57856.6 | 2.1 | — | 16.5(0.07) | — | 16.19(0.05) | HONIR |
| 57857.6 | 3.1 | 16.38(0.03) | 16.36(0.02) | 16.11(0.02) | 16.08(0.02) | HONIR |
| 57859.6 | 5.0 | 16.28(0.02) | 16.39(0.03) | 16.12(0.04) | 16.02(0.03) | HOWPol |
| 57861.6 | 7.0 | — | 16.47(0.06) | — | 16.11(0.05) | HONIR |
| 57862.6 | 8.0 | 16.5(0.05) | 16.46(0.02) | 16.14(0.05) | 16.04(0.02) | HOWPol |
| 57864.5 | 9.9 | — | — | 16.02(0.11) | — | HOWPol |
| 57865.7 | 11.1 | 16.79(0.02) | 16.51(0.02) | 16.18(0.06) | 16.14(0.02) | HOWPol |
| 57866.6 | 12.0 | — | 16.6(0.04) | 16.19(0.04) | 16.11(0.04) | HONIR |
| 57867.6 | 13.0 | — | 16.77(0.05) | — | 16.16(0.04) | HOWPol |
| 57870.6 | 15.9 | — | — | 16.32(0.05) | 16.25(0.05) | HOWPol |
| 57871.6 | 16.9 | — | 17.22(0.07) | 16.71(0.05) | 16.52(0.04) | HONIR |
| 57873.5 | 18.8 | — | 18.13(0.07) | 17.27(0.05) | 16.96(0.05) | HONIR |
| 57876.6 | 21.9 | — | — | 18.38(0.06) | — | HOWPol |
| 57880.5 | 25.7 | — | — | >18.59 | 19.38(0.19) | HONIR |
| 57884.5 | 29.7 | — | — | >18.79 | — | HONIR |
| 57890.8 | 36.0 | — | — | 20.44(0.17) | — | HOWPol |
| 57891.6 | 36.7 | — | — | 20.34(0.15) | — | HOWPol |
| 57892.7 | 37.8 | — | — | 20.55(0.15) | >20.29 | HOWPol |
| 57900.7 | 45.8 | — | >20.8 | >20.96 | — | HOWPol |
| 57902.6 | 47.7 | — | >20.76 | 21.26(0.28) | >20.32 | HOWPol |
| 57913.6 | 58.6 | — | >19.92 | >20.38 | >19.87 | HOWPol |
| 57917.6 | 62.5 | — | >20.46 | >20.6 | >20.2 | HOWPol |
| 57947.6 | 92.2 | — | >18.87 | >19.33 | >19.14 | HOWPol |
| 57950.6 | 95.2 | — | >20.75 | >20.75 | >19.95 | HOWPol |
| MJD | Epoch | J | H |
|---|---|---|---|
| (day) | (mag) | (mag) | |
| 57856.6 | 2.1 | 15.81(0.03) | 15.75(0.03) |
| 57857.6 | 3.1 | 15.64(0.03) | 15.59(0.03) |
| 57861.6 | 7.0 | 15.54(0.03) | 15.53(0.03) |
| 57865.7 | 11.1 | 15.56(0.02) | 15.51(0.03) |
| 57866.6 | 12.0 | 15.64(0.03) | 15.58(0.04) |
| 57871.6 | 16.9 | 15.77(0.03) | — |
| 57873.5 | 18.8 | 16.33(0.09) | 16.06(0.05) |
We also performed optical spectroscopic observations using HOWPol for 9 nights from 2017 Apr 13.6 ( days) to 30.7 ( days). We used a grism with a spectral resolution of and a spectral coverage of 4500–9000 Å. We observed spectroscopic standard stars in the same nights for the flux calibration. For the wavelength calibration, we used the sky emission lines in object frames. The strong atmospheric absorption bands around 6900 and 7600 Å have been removed using smooth spectra of the hot standard stars. Additionally, the continuum of the spectra is modified to match the SED from the photometry at the same epoch if necessary. The log of our spectroscopic observations is given in Table 4, and the obtained spectra are shown in Figure 3.
| MJD | Epoch | Exposure |
|---|---|---|
| (day) | (sec) | |
| 57856.6 | 2.1 | 2400 |
| 57857.6 | 3.1 | 2700 |
| 57859.6 | 5.0 | 2700 |
| 57861.8 | 7.2 | 2700 |
| 57865.6 | 11.0 | 2700 |
| 57866.6 | 12.0 | 2700 |
| 57867.7 | 13.1 | 3600 |
| 57870.7 | 16.0 | 2700 |
| 57873.7 | 19.0 | 2700 |

3. Light Curves
3.1. Light Curve Properties
The light curves of SN 2017czd can be divided into four stages based on the slopes of the -band light curve: (i) the rising phase (up to days), (ii) the plateau phase (between and 16 days), (iii) the declining phase (between and 30 days), and (iv) the tail phase (after days). Below we discuss the light-curve properties in each stage.
A rapid rise is found at the early phases. The rising rate is mag day-1in the band between 1.4 and 3.1 days. Using the band magnitude of 17.8 mag obtained by the Pan-STARRS at 1.1 days222https://wis-tns.weizmann.ac.il/object/2017czd, we obtain the rising rate of mag day-1in the band between 1.1 and 2.1 days. Combined with the fact that the pre-discovery upper-limit magnitude of 21.5 mag at -1.2 days, it is evident that this SN experiences a rapid rise just after the explosion.
Between and 16 days, the light curves show a short plateau except for the band. The flat shape of the light curves are most evident in the and bands. We define as the duration in which magnitude is constant within 0.2 mag. We find days in and bands. In the band, the plateau is also seen, but the duration is shorter than that in the and bands, i.e., the -band light curve starts to decline around 13 days. In the band, the light curve reaches the peak at days and then starts to decline. These characteristics of the plateau is similar to the normal SNe IIP except for the plateau length (see also Figure 6). Given the sparse NIR data, the plateau shapes in the and band light curves are not as clear as in the and bands, but they also show relatively flat light curves between and 16 days.
After the plateau, optical light curves show the rapid declines. In particular, the and band light curves suddenly drop after their plateau phases. The light curves in shorter wavelengths exhibit more rapid evolution: the decline rates between days and 21.9 days are estimated to be 0.5, 0.3, and 0.2 mag day-1in the , , and bands, respectively. We see a slowdown in the decline rate of the band light curve after days (0.1 mag day-1) although the photometric error at days is rather large.
3.2. Comparison with Other Transients
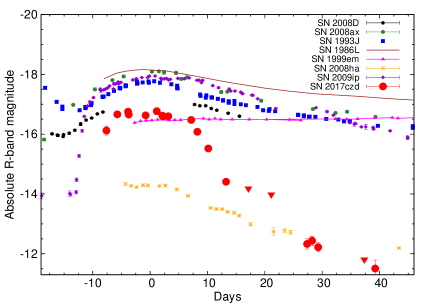
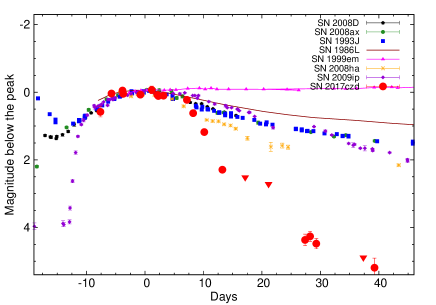
Compared with normal SNe, the light curves of SN 2017czd show more rapid evolution, but its absolute magnitudes are within the range of normal SNe. Figure 4 compares the -band magnitude of SN 2017czd with those of normal SNe; SNe Ib 2008D (Modjaz et al., 2009), IIL 1986L (Anderson et al., 2014), IIb 1993J (Richmond et al., 1996a), IIP 1999em (Leonard et al., 2002), IIb 2008ax (Pastorello et al., 2008), and IIn 2009ip (Fraser et al., 2013). In order to compare their rise times quantitatively, we define the time it takes from the half maximum luminosity to reach the maximum luminosity as . For SN 2017czd, it is estimated to be 2.6 days, which is much shorter than those of SNe 1993J (7.64 days) and 2008ax (9.05 days).
The -band magnitude around the peak is mag for SN 2017czd, which is comparable to those of SNe 1999em and 2008D. After the light-curve drop, the absolute magnitude of SN 2017czd becomes much fainter than those of SNe 1986L, 1993J, 1999em, 2008D, 2008ax, and 2009ip. The luminosity at the tail phase becomes comparable to faint SN Iax 2008ha (Foley et al., 2009; Valenti et al., 2009).
To compare the decline rates after the plateau, the bottom panel of Figure 4 shows the magnitude evolution relative to the peak. The decline rate of SN 2017czd (0.3 mag day-1in band) is the highest among other SNe compared in Figure 4. For example, the magnitude decline by mag in after the plateau for SN 2017czd, while it is 1.5 mag for SN 2008ha.
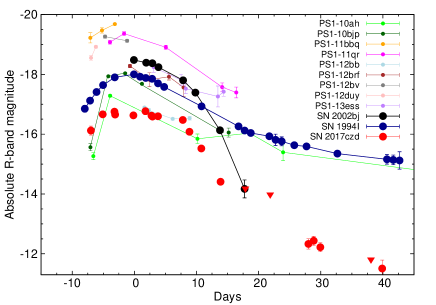
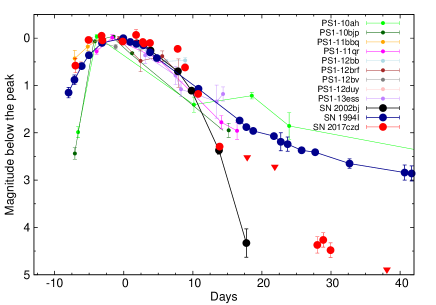
The fast decline of SN 2017czd is in fact similar to those of rapidly evolving transients. Figure 5 shows the -band light curve of SN 2017czd compared with -band light curve of the rapidly evolving transients by Drout et al. (2014), and -band light curve of the fast declining SN Ic 1994I (Richmond et al., 1996b) and SN 2002bj (Poznanski et al., 2010). A large diversity of mag is seen in the peak absolute magnitudes in the rapidly evolving transients of Drout et al. (2014), and SN 2017czd is located at the faint end. Among rapidly evolving transients presented by Drout et al. (2014), the observations after days after the maximum are available only for PS1-10ah, and SN 2017czd shows a faster decline than PS1-10ah.
The bottom panel of Figure 5 compares the light curves relative to the peak. Compared with other rapidly evolving transients in the figure, only SN 2017czd exhibits the plateau in the light curve. Because the data are sparse for the rapidly evolving transients, we define the decline time () as the time it takes from the light-curve maximum to the half maximum for the comparison. The timescale of SN 2017czd ( days in the -band) is similar to those of SN 2002bj (8.3 days in the -band, Poznanski et al. 2010) and the Pan-STARRS rapidly evolving transients (3–17 days in the -band, Drout et al. 2014).
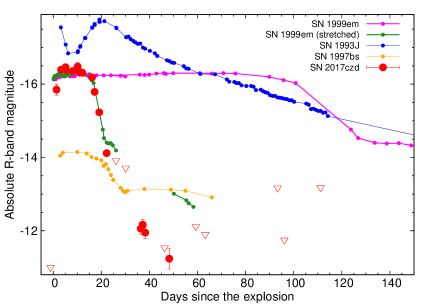
Motivated by the presence of the short plateau in the light curves, we also compare the light curves of SN 2017czd with SNe II. Figure 6 shows the -band light curve of SN 2017czd compared with SNe 1993J, 1999em, and SN impostor 1997bs (Van Dyk et al., 2000). As in other Type IIP SNe, SN 1999em shows a plateau for 100 days in the -band. We stretch the -band light curve of SN IIP 1999em to match that of SN 2017czd by assuming a stretch factor of 0.17 in time (green in Figure 6). The stretched light curve is in fact quite similar to that of SN 2017czd until days. The sharp drop after the plateau is also similar, although the light curve of SN 2017czd keeps declining rapidly.
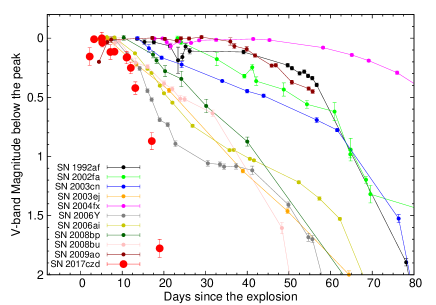
Some SNe II are known to show a fast evolving light curves (so called SNe IIL, e.g., Faran et al., 2014; Bose et al., 2013, 2016). Figure 7 shows the -band light curve of SN 2017czd and those of such SNe II presented in Anderson et al. (2014). The -band light curve of SN 2017czd until 15 days has a similar evolution to that of SN 2006Y, which shows the fastest decline among their samples, while SN 2017czd declines more rapidly after 15 days. As shown in Figure 7, the duration of the plateau of SN 2017czd is among the shortest in the samples of SNe II collected by Anderson et al. (2014).
It is interesting to note that SN (or SN impostor) 1997bs also shows a short plateau in the -band light curve (Figure 6), whose timescale is comparable to that in SN 2017czd. However, several characteristics are different from those of SN 2017czd: the plateau luminosity of SN 1997bs is lower than that of SN 2017czd, and the light curve after the short plateau becomes flat again. Furthermore, spectra of SN 1997bs show narrow emission lines, which are not seen in SN 2017czd (see Section 4).
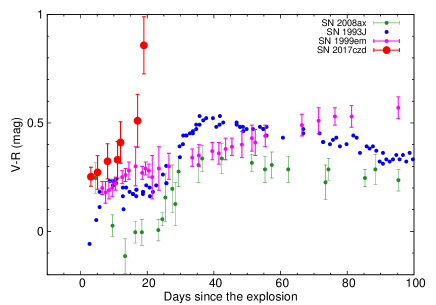
Figure 8 is compared with the color evolution of SN 2017czd and some Type II SNe; SNe IIb 1993J (Richmond et al., 1996a), IIP 1999em (Leonard et al., 2002), and IIb 2008ax (Pastorello et al., 2008). Until days, the color of SN 2017czd is similar to or slightly redder than those of SNe 1993J and 1999em. However, after days, the color in SN 2017czd rapidly becomes redder. Such a rapid change is not seen in other SNe IIb and IIP, confirming that SN 2017czd is a rapidly evolving object also in color.
4. Spectra
Figure 3 shows the time evolution of the optical spectra from the rising phase ( days) to the declining phase ( days). Note that narrow emission lines of H , H , [O iii ] 4959, 5007, [N ii ] 6583, and [S ii ] 6716, 6731 come from the H II region in the host galaxy. Initially, the spectra are dominated by the blue continuum as in SNe IIP in their early phases (e.g., Huang et al., 2018). The broad absorption component of H around 6000 Å is present from days. This broad H feature led us to classify SN 2017czd as an SN II as discussed below. In addition to H , the broad feature of Ca ii IR triplet are seen in the spectra at and 19.0 days.
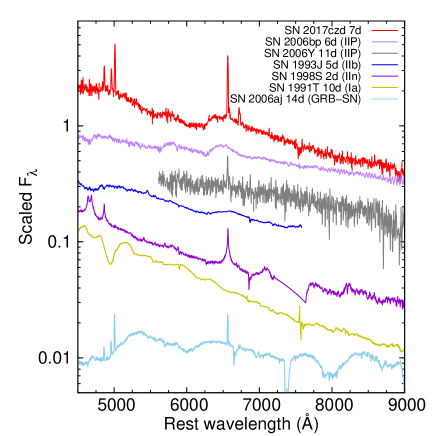
The spectra of SN 2017czd are similar to those of SNe IIP in early phases. Figure 9 shows the spectral comparison with various types of SNe; SN 2017czd at days, SN IIP 2006bp at days (Quimby et al., 2007), SN II 2006Y at days (Gutiérrez et al., 2017), SN IIb 1993J at days (Barbon et al., 1995), SN IIn 1998S at days (Fassia et al., 2001), luminous SN Ia 1991T at days (Mazzali et al., 1995), and broad-lined SN Ic 2006aj at days (Pian et al., 2006). The blue continuum and the broad H line in the spectrum of SN 2017czd match those of SN 2006bp at days. This supports our classification of SN 2017czd as a SN II. SNe 1993J and 2006aj show more prominent absorption lines than SN 2017czd. SNe 1998S, 2006Y and 1991T also show a blue continuum. However, SN 1998S shows characteristic strong narrow emission lines observed in SNe IIn, SN 2006Y has no features except for the H emission from the host galaxy and SN 1991T shows a strong absorption feature of Fe iii around 5000 Å. Thus, they are clearly different from SN 2017czd.
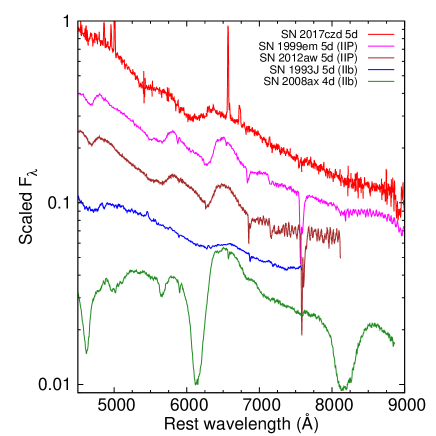
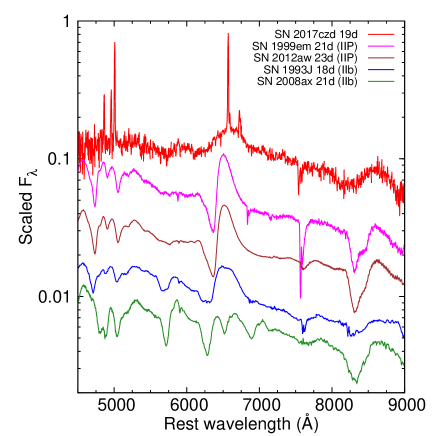
In Figure 10, we compare SN 2017czd with type II SNe, SNe IIP 1999em (Leonard et al., 2002), 2012aw (Bose et al., 2013), and SNe IIb 1993J (Barbon et al., 1995), 2008ax (Pastorello et al., 2008) at around days. The H absorption line of SN 2017czd is shallow and blueshifted compared with those of SNe IIP. Figure 11 shows the comparison with the same SNe but at the later epochs. The spectrum of SN 2017czd shows weak absorption lines of H , Ca ii IR triplet, and He i 5876 at days. The spectral features of SN 2017czd are broadly similar to SNe IIP at early phase ( days) and similar to SNe IIb SN 1993J at decline phase ( days).
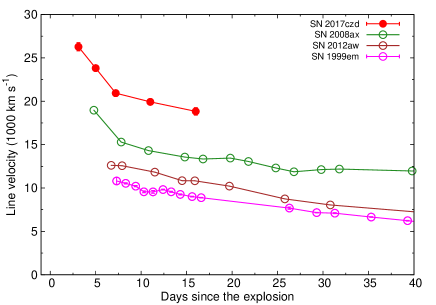
Figure 12 shows the evolution of the H line velocity in SN 2017czd. We fit the Gaussian function to the H absorption line profile. We consider the difference between the rest wavelength and the wavelength at the minimum of the fitted Gaussian as the line velocity. The H velocity of SN 2017czd is about 26,000 km s-1 at days and declines to 20,000 km s-1 at 15 days. These velocities are significantly higher than those of other SNe II at similar epochs, which are around 10,000–20,000 km s-1 .
5. Discussion
We have shown that SN 2017czd has different light curve characteristics from those of other rapidly evolving transients currently known and it shows a plateau phase as in SNe IIP although it is very short (Section 3). We have also presented that SN 2017czd clearly shows the broad hydrogen feature in the spectra (Section 4). Based on these facts, we discuss the nature of SN 2017czd in this section.
5.1. Power source
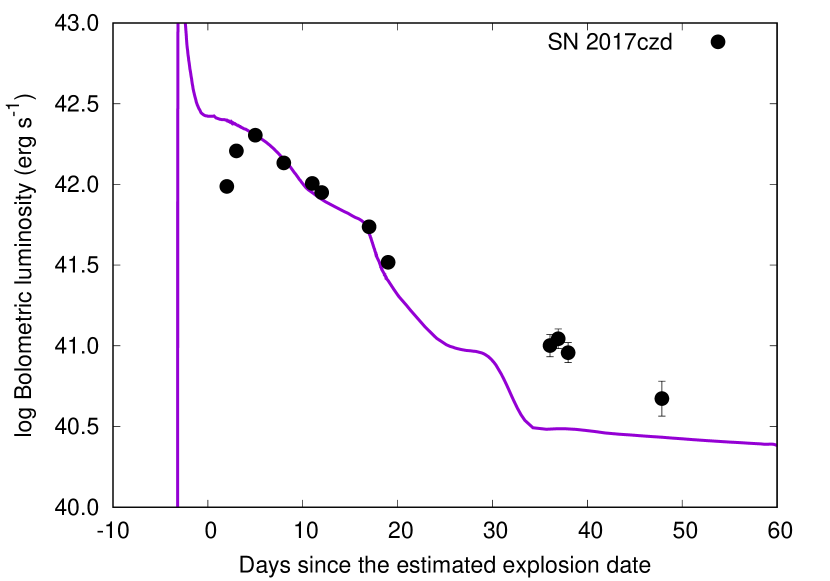
First, to clarify the power source of SN 2017czd, we construct the bolometric light curve based on our optical and infrared photometry. We find that the spectral energy distribution (SED) in the -band can be well explained by a single black-body function until the end of the plateau phase when the multi-band photometry is available. Therefore, we estimate the bolometric luminosity of SN 2017czd from the rising phase to the declining phase by integrating the single black-body function matching the photometry.
Because we only have the -band photometry during the tail phase after the plateau, we estimate the bolometric luminosity in the tail phase based only on the -band photometry. Lyman et al. (2014) investigate the bolometric correction of SNe IIP and SNe IIb and find that the -band should covers 20–25% of the total fluxes in the tail phases. Assuming this fraction (20%), we obtain the quasi-bolometric luminosity of SN 2017czd at the tail phase. The bolometric light curve of SN 2017czd is presented in Figure 13.
One possible power source of SN 2017czd is the radioactive decay of 56Ni, which is a standard power source of SNe. The total radioactive luminosity from the decay of 56Ni is (Nadyozhin, 1994)
| (1) |
where is the initial mass of radioactive 56Ni .
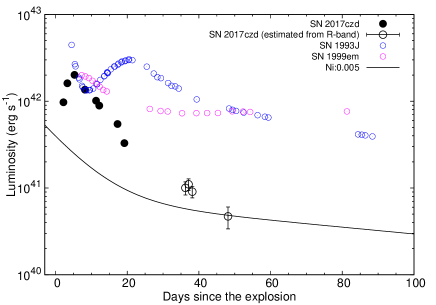
Assuming that the major power source at the tail phase is the 56Ni decay, we compare the estimated bolometric light curve with the total available decay energy (Eq. 1) in Fig. 13. The total luminosity is consistent with the total decay energy from 0.005 of 56Ni. However, the peak luminosity of SN 2017czd is much brighter than the expected luminosity from this 56Ni mass assuming the full trapping of gamma-rays from the 56Ni decay. Therefore, radioactive decay of 56Ni is unlikely as a power source for SN 2017czd.
Another possibility is that the light curve is powered by the interaction between SN ejecta and CSM. In fact, some SNe IIn are known to show a plateau phase in the light curves (e.g., Chugai et al., 2004; Kankare et al., 2012; Mauerhan et al., 2013). But their plateau phase lasts more than 100 days, they are more luminous than SN 2017czd and they have strong hydrogen emission. In addition, interacting the SNe with the CSM are usually observed as SNe IIn with strong hydrogen emission lines, which are not observed in SN 2017czd. Therefore, although the possible contribution from the interaction between SN ejecta and CSM to the plateau part is not clear, we believe that the interaction is unlikely to be a main power source.
5.2. SN 2017czd as a weak explosion of a SN IIb progenitor
In this section, we argue that the luminosity source of the early phase of SN 2017czd is the thermal energy provided by the SN shock as in the case of SNe IIP during the plateau phase.
Assuming that SN 2017czd is powered by the thermal energy from the SN shock as in SNe IIP, we first estimate the SN properties to account for the observed properties of SN 2017czd by using the scaling relation formulated by Popov (1993). We adopt mag as the absolute -band magnitude during the plateau and the plateau length days. Fe ii line velocity is typically used to estimate the photospheric velocity in SNe IIP but Fe ii absorption lines are not found in the spectra of SN 2017czd. We only obtain the H line velocity ( km s-1 at days). Fe ii line velocities for SNe IIP are roughly a half of the H (e.g., Bose et al., 2013). Assuming this relation, we set the photospheric velocity of km s-1 . With these parameters, the explosion energy is estimated to be . The hydrogen-rich envelope mass and radius of the progenitor of SN 2017czd are estimated to be 0.04 and 860 , respectively.
Such an extended progenitor with a small amount of the hydrogen-rich envelope is similar to the progenitors of SNe IIb which result from the evolution of the massive binary stars (e.g., Bersten et al., 2012; Ouchi & Maeda, 2017; Yoon et al., 2017). To confirm if such a progenitor can explain the observational properties of SN 2017czd, we perform numerical light curve calculations using a progenitor model obtained from stellar evolution modeling.
We take a progenitor model with a small hydrogen-rich envelope calculated by Ouchi & Maeda (2017) using MESA (Paxton et al., 2011, 2013, 2015, 2016, 2018). The progenitor we adopt has and solar metallicity at the zero-age main sequence (ZAMS). It is in a binary system in which the initial secondary star is (the mass ratio of 0.95) and the initial period is 1000 days. The mass transfer in the binary system is treated in the non-conservative way with the mass accretion efficiency of 0.5. We refer to Ouchi & Maeda (2017) for further details of the progenitor evolution. The progenitor evolution is followed until the end of the central carbon burning. The envelope structure is not much affected by the rest of the evolution and we take this model for the light curve modeling. The final progenitor mass is with the hydrogen-rich envelope mass of and the helium core mass of . The hydrogen fraction in the envelope is 0.46. The progenitor radius is . The progenitor properties match to those of extended SN IIb progenitors (e.g., Chevalier & Soderberg, 2010).
The synthetic light curves are calculated by using STELLA, which is a one-dimensional multi-group radiation hydrodynamics code developed by Blinnikov et al. (1998, 2000, 2006). We set the mass cut of the progenitor at and put the thermal energy just above the mass cut to initiate the SN explosions. We also put the radioactive 56Ni just above the mass cut.
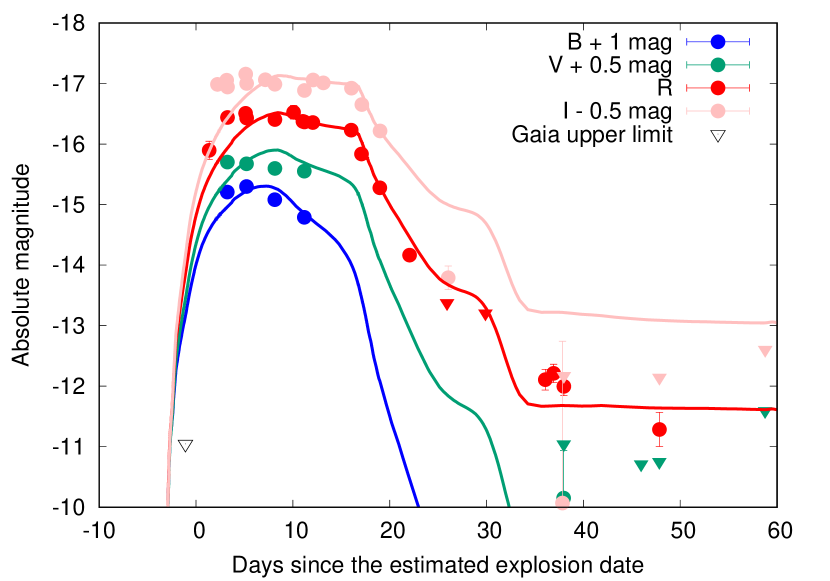
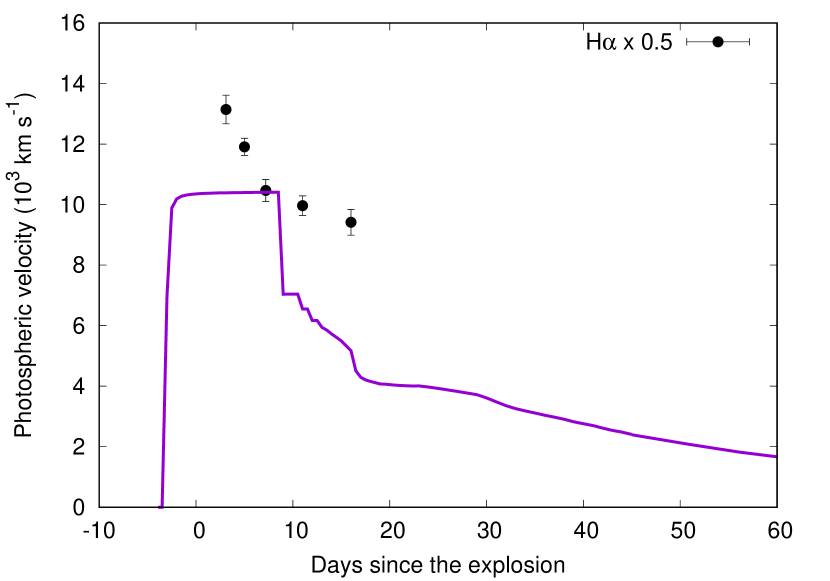
Figure 14 presents the synthetic multi-color light curves. The explosion energy and 56Ni mass of the model is and , respectively. The synthetic light curves after 35 days follow the decline rate of the light curve expected from the 56Co decay. Both the multi-color and bolometric light curves are well reproduced by this model. Given the constraint from the Gaia upper limit, SN 2017czd is found to rise more quickly than our model but the early rise may be caused by the confined dense CSM around the progenitor (e.g., Moriya et al., 2017b, 2018; Förster et al., 2018; Morozova et al., 2018). The early discrepancy in the bolometric light curves is due to the fact that the bolometric luminosity constructed from the observations does not include contributions from the ultraviolet wavelengths which are included in the model. While the model shows some discrepancy in the tail phase in the bolometric light curve, we note that the bolometric luminosities in the tail has a large uncertainty, since it is constructed solely by the band. The photospheric velocity of the model presented in Figure 14 is consistent with that estimated from the observation (), although our model shows slightly different time evolution. This difference might be due to our use of the Rosseland-mean opacity in estimating the photospheric velocity. The estimated explosion energy and hydrogen-rich envelope mass by our numerical modeling are about a factor of 10 more than those estimated by the Popov formula. We presume that this is partly because of the large helium fraction in our envelope (Kasen & Woosley, 2009), as well as the limitation of the simple semi-analytic formula.
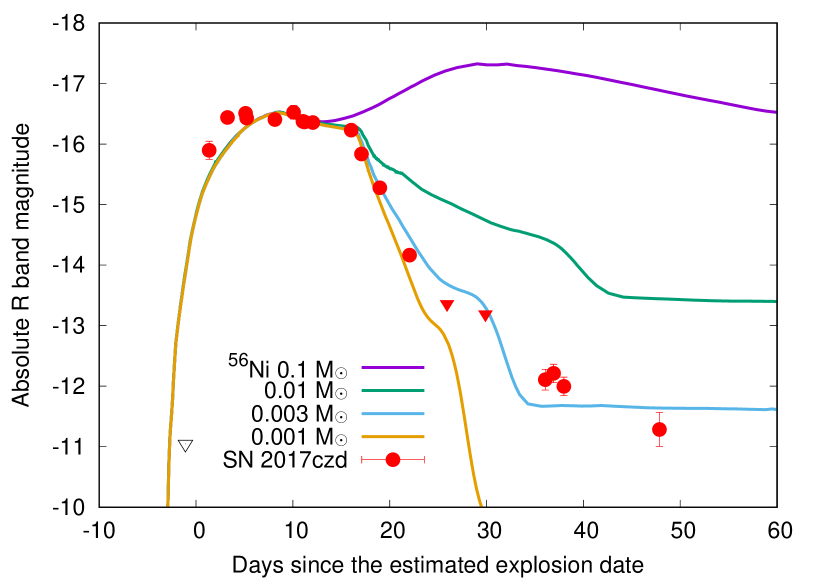
Figure 15 shows the synthetic light curves with the same progenitor models and explosion energy but with different 56Ni masses. The synthetic light curve with the large amount of 56Ni () shows the secondary peak due to the 56Ni heating as in ordinary SNe IIb.
Overall, the observations of SN 2017czd are well explained by the explosion of the SN IIb progenitor. The 56Ni mass of SN 2017czd () is much smaller than those of SNe IIb (, e.g., Lyman et al. 2016). Thus, we suggest that SN 2017czd is a weak explosion from the SN IIb progenitor. This explosion would not eject much 56Ni and the secondary luminosity peak due to the nuclear energy input would not be observed (see also Milisavljevic et al., 2013). It is worth noting that such a weak explosion with a small amount of 56Ni may be consistent with the explosions obtained by the current state-of-the-art neutrino-driven core-collapse SN simulations. It is well-known that the current core-collapse SN simulations fail to reproduce the standard SN explosions with the explosion energy of (e.g., Takiwaki et al., 2016). In addition, Suwa et al. (2017) recently point out that the amount of 56Ni produced in the explosions obtained by the current numerical simulations would be very small because they take too much time for the shock recovery. Although the current simulations are yet far from reproducing the ordinary core-collapse SN explosions, their results match the explosion properties of SN 2017czd. Alternatively, the low 56Ni mass may also be a result of fallback (Tominaga et al., 2007; Moriya et al., 2010). A weak explosion can result in the unsuccessful explosion of the inner layers of the progenitor where 56Ni exists. Then, little 56Ni remains in the ejecta with a small explosion energy.
Our result indicates that some rapidly evolving transients may be related to the weak explosions of SNe IIb progenitors with little 56Ni ejection. The 56Ni-free core-collapse SN explosions to account for rapidly evolving transients have been previously suggested for hydrogen-free extended progenitors (e.g., Kleiser & Kasen, 2014; Kleiser et al., 2018a). However, we propose that there is a little hydrogen left in the progenitor in the case of SN 2017czd. This makes the extremely short plateau in the light curve, and the hydrogen features are also expected to be observed in this case.
6. Summary
We present our optical and NIR observations of rapidly evolving SN 2017czd with hydrogen features. The light curves of SN 2017czd show a short plateau (13 days in band) followed by a rapid decline. The decline rate of SN 2017czd (0.3 mag day-1in band) is faster than the standard SNe IIP and IIb (Fig. 4), while it is similar to those of the rapidly evolving transients (e.g., Drout et al., 2014, Figure 5). The peak absolute magnitude ( mag in -band) is consistent with those of SNe IIP and IIb. The peak luminosity is also consistent with those of rapidly evolving transients. The spectra exhibit the hydrogen features, and overall spectra are similar to those of SNe IIP in the early phases and SNe IIb in the late phases. However, the hydrogen features are broader than those of SNe IIb and IIP, and line velocities are larger.
We calculate synthetic light curves based on a binary progenitor model ( at ZAMS and at the explosion) with a small hydrogen-rich envelope () at the pre-explosion stage. The observed properties of SN 2017czd, including the short plateau duration and rapid decline, are explained by the model with the relatively low explosion energy ( erg) and the low 56Ni mass (). We conclude that SN 2017czd is a weak explosion of the SN IIb progenitor, which does not eject much 56Ni. Our results suggest that some rapidly evolving transients are also caused by such a weak explosion of SN IIb progenitors.
References
- Akitaya et al. (2014) Akitaya, H., et al. 2014, in Proc. SPIE, Vol. 9147, Ground-based and Airborne Instrumentation for Astronomy V, 91474O
- Aldering et al. (1994) Aldering, G., Humphreys, R. M., & Richmond, M. 1994, AJ, 107, 662
- Anderson et al. (2014) Anderson, J. P., et al. 2014, ApJ, 786, 67
- Arcavi et al. (2017) Arcavi, I., et al. 2017, Nature, 551, 210
- Barbon et al. (1995) Barbon, R., Benetti, S., Cappellaro, E., Patat, F., Turatto, M., & Iijima, T. 1995, A&AS, 110, 513
- Benetti et al. (2011) Benetti, S., et al. 2011, MNRAS, 411, 2726
- Bersten et al. (2012) Bersten, M. C., et al. 2012, ApJ, 757, 31
- Bersten et al. (2018) —. 2018, Nature, 554, 497
- Bildsten et al. (2007) Bildsten, L., Shen, K. J., Weinberg, N. N., & Nelemans, G. 2007, ApJ, 662, L95
- Blinnikov et al. (2000) Blinnikov, S., Lundqvist, P., Bartunov, O., Nomoto, K., & Iwamoto, K. 2000, ApJ, 532, 1132
- Blinnikov et al. (1998) Blinnikov, S. I., Eastman, R., Bartunov, O. S., Popolitov, V. A., & Woosley, S. E. 1998, ApJ, 496, 454
- Blinnikov et al. (2006) Blinnikov, S. I., Röpke, F. K., Sorokina, E. I., Gieseler, M., Reinecke, M., Travaglio, C., Hillebrandt, W., & Stritzinger, M. 2006, A&A, 453, 229
- Bose et al. (2016) Bose, S., Kumar, B., Misra, K., Matsumoto, K., Kumar, B., Singh, M., Fukushima, D., & Kawabata, M. 2016, MNRAS, 455, 2712
- Bose et al. (2013) Bose, S., et al. 2013, MNRAS, 433, 1871
- Cao et al. (2013) Cao, Y., et al. 2013, ApJ, 775, L7
- Chevalier & Soderberg (2010) Chevalier, R. A., & Soderberg, A. M. 2010, ApJ, 711, L40
- Chugai et al. (2004) Chugai, N. N., et al. 2004, MNRAS, 352, 1213
- Crockett et al. (2008) Crockett, R. M., et al. 2008, MNRAS, 391, L5
- De et al. (2018) De, K., et al. 2018, Science, 362, 201
- de Jaeger et al. (2018) de Jaeger, T., et al. 2018, MNRAS, 478, 3776
- Dexter & Kasen (2013) Dexter, J., & Kasen, D. 2013, ApJ, 772, 30
- Drout et al. (2014) Drout, M. R., et al. 2014, ApJ, 794, 23
- Drout et al. (2013) —. 2013, ApJ, 774, 58
- Eldridge & Maund (2016) Eldridge, J. J., & Maund, J. R. 2016, MNRAS, 461, L117
- Faran et al. (2014) Faran, T., et al. 2014, MNRAS, 445, 554
- Fassia et al. (2001) Fassia, A., et al. 2001, MNRAS, 325, 907
- Filippenko (1997) Filippenko, A. V. 1997, ARA&A, 35, 309
- Folatelli et al. (2016) Folatelli, G., et al. 2016, ApJ, 825, L22
- Foley et al. (2009) Foley, R. J., et al. 2009, AJ, 138, 376
- Förster et al. (2018) Förster, F., et al. 2018, Nature Astronomy
- Fraser et al. (2013) Fraser, M., et al. 2013, MNRAS, 433, 1312
- Grassberg et al. (1971) Grassberg, E. K., Imshennik, V. S., & Nadyozhin, D. K. 1971, Ap&SS, 10, 28
- Gutiérrez et al. (2017) Gutiérrez, C. P., et al. 2017, ApJ, 850, 89
- Hamuy (2003) Hamuy, M. 2003, ApJ, 582, 905
- Heger et al. (2003) Heger, A., Fryer, C. L., Woosley, S. E., Langer, N., & Hartmann, D. H. 2003, ApJ, 591, 288
- Hook et al. (2004) Hook, I. M., Jørgensen, I., Allington-Smith, J. R., Davies, R. L., Metcalfe, N., Murowinski, R. G., & Crampton, D. 2004, PASP, 116, 425
- Hosseinzadeh et al. (2017) Hosseinzadeh, G., Arcavi, I., Howell, D. A., Mccully, C., & Valenti, S. 2017, Transient Name Server Classification Report, 429
- Huang et al. (2018) Huang, F., et al. 2018, MNRAS, 475, 3959
- Hunter et al. (2009) Hunter, D. J., et al. 2009, A&A, 508, 371
- Itagaki (2017) Itagaki, K. 2017, Transient Name Server Discovery Report, 420
- Kankare et al. (2012) Kankare, E., et al. 2012, MNRAS, 424, 855
- Kasen & Woosley (2009) Kasen, D., & Woosley, S. E. 2009, ApJ, 703, 2205
- Kasliwal et al. (2010) Kasliwal, M. M., et al. 2010, ApJ, 723, L98
- Kawabata et al. (2008) Kawabata, K. S., et al. 2008, in Proc. SPIE, Vol. 7014, Ground-based and Airborne Instrumentation for Astronomy II, 70144L
- Kleiser et al. (2018a) Kleiser, I., Fuller, J., & Kasen, D. 2018a, MNRAS
- Kleiser & Kasen (2014) Kleiser, I. K. W., & Kasen, D. 2014, MNRAS, 438, 318
- Kleiser et al. (2018b) Kleiser, I. K. W., Kasen, D., & Duffell, P. C. 2018b, MNRAS, 475, 3152
- Landolt (1992) Landolt, A. U. 1992, AJ, 104, 340
- Leonard et al. (2002) Leonard, D. C., et al. 2002, PASP, 114, 35
- Lewis et al. (1994) Lewis, J. R., et al. 1994, MNRAS, 266, L27
- Lyman et al. (2014) Lyman, J. D., Bersier, D., & James, P. A. 2014, MNRAS, 437, 3848
- Lyman et al. (2016) Lyman, J. D., Bersier, D., James, P. A., Mazzali, P. A., Eldridge, J. J., Fraser, M., & Pian, E. 2016, MNRAS, 457, 328
- Mauerhan et al. (2013) Mauerhan, J. C., et al. 2013, MNRAS, 431, 2599
- Mazzali et al. (1995) Mazzali, P. A., Danziger, I. J., & Turatto, M. 1995, A&A, 297, 509
- Milisavljevic et al. (2013) Milisavljevic, D., et al. 2013, ApJ, 767, 71
- Modjaz et al. (2009) Modjaz, M., et al. 2009, ApJ, 702, 226
- Moriya et al. (2010) Moriya, T., Tominaga, N., Tanaka, M., Nomoto, K., Sauer, D. N., Mazzali, P. A., Maeda, K., & Suzuki, T. 2010, ApJ, 719, 1445
- Moriya & Eldridge (2016) Moriya, T. J., & Eldridge, J. J. 2016, MNRAS, 461, 2155
- Moriya et al. (2018) Moriya, T. J., Förster, F., Yoon, S.-C., Gräfener, G., & Blinnikov, S. I. 2018, MNRAS, 476, 2840
- Moriya et al. (2017a) Moriya, T. J., et al. 2017a, MNRAS, 466, 2085
- Moriya et al. (2017b) Moriya, T. J., Yoon, S.-C., Gräfener, G., & Blinnikov, S. I. 2017b, MNRAS, 469, L108
- Morozova et al. (2018) Morozova, V., Piro, A. L., & Valenti, S. 2018, ApJ, 858, 15
- Nadyozhin (1994) Nadyozhin, D. K. 1994, ApJS, 92, 527
- Nakaoka et al. (2018) Nakaoka, T., et al. 2018, ApJ, 859, 78
- Ouchi & Maeda (2017) Ouchi, R., & Maeda, K. 2017, ApJ, 840, 90
- Pastorello et al. (2008) Pastorello, A., et al. 2008, MNRAS, 389, 955
- Paxton et al. (2011) Paxton, B., Bildsten, L., Dotter, A., Herwig, F., Lesaffre, P., & Timmes, F. 2011, ApJS, 192, 3
- Paxton et al. (2013) Paxton, B., et al. 2013, ApJS, 208, 4
- Paxton et al. (2015) —. 2015, ApJS, 220, 15
- Paxton et al. (2016) —. 2016, ApJS, 223, 18
- Paxton et al. (2018) —. 2018, ApJS, 234, 34
- Pejcha & Prieto (2015) Pejcha, O., & Prieto, J. L. 2015, ApJ, 806, 225
- Persson et al. (1998) Persson, S. E., Murphy, D. C., Krzeminski, W., Roth, M., & Rieke, M. J. 1998, AJ, 116, 2475
- Pian et al. (2006) Pian, E., et al. 2006, Nature, 442, 1011
- Popov (1993) Popov, D. V. 1993, ApJ, 414, 712
- Poznanski et al. (2010) Poznanski, D., et al. 2010, Science, 327, 58
- Pursiainen et al. (2018) Pursiainen, M., et al. 2018, ArXiv e-prints
- Quimby et al. (2007) Quimby, R. M., Wheeler, J. C., Höflich, P., Akerlof, C. W., Brown, P. J., & Rykoff, E. S. 2007, ApJ, 666, 1093
- Rest et al. (2018) Rest, A., et al. 2018, Nature Astronomy, 2, 307
- Richmond et al. (1996a) Richmond, M. W., Treffers, R. R., Filippenko, A. V., & Paik, Y. 1996a, AJ, 112, 732
- Richmond et al. (1996b) Richmond, M. W., et al. 1996b, AJ, 111, 327
- Sakimoto et al. (2012) Sakimoto, K., et al. 2012, in Proc. SPIE, Vol. 8446, Ground-based and Airborne Instrumentation for Astronomy IV, 844673
- Schlafly & Finkbeiner (2011) Schlafly, E. F., & Finkbeiner, D. P. 2011, ApJ, 737, 103
- Shen et al. (2010) Shen, K. J., Kasen, D., Weinberg, N. N., Bildsten, L., & Scannapieco, E. 2010, ApJ, 715, 767
- Smartt (2009) Smartt, S. J. 2009, ARA&A, 47, 63
- Smartt et al. (2015) Smartt, S. J., et al. 2015, A&A, 579, A40
- Stetson (1987) Stetson, P. B. 1987, PASP, 99, 191
- Suwa et al. (2017) Suwa, Y., Tominaga, N., & Maeda, K. 2017, ArXiv e-prints
- Takaki et al. (2013) Takaki, K., et al. 2013, ApJ, 772, L17
- Takiwaki et al. (2016) Takiwaki, T., Kotake, K., & Suwa, Y. 2016, MNRAS, 461, L112
- Tanaka et al. (2016) Tanaka, M., et al. 2016, ApJ, 819, 5
- Tauris et al. (2013) Tauris, T. M., Langer, N., Moriya, T. J., Podsiadlowski, P., Yoon, S.-C., & Blinnikov, S. I. 2013, ApJ, 778, L23
- Tominaga et al. (2007) Tominaga, N., Umeda, H., & Nomoto, K. 2007, ApJ, 660, 516
- Ui et al. (2014) Ui, T., et al. 2014, in Proc. SPIE, Vol. 9147, Ground-based and Airborne Instrumentation for Astronomy V, 91476C
- Utrobin & Chugai (2015) Utrobin, V. P., & Chugai, N. N. 2015, A&A, 575, A100
- Valenti et al. (2009) Valenti, S., et al. 2009, Nature, 459, 674
- Van Dyk et al. (2000) Van Dyk, S. D., Peng, C. Y., King, J. Y., Filippenko, A. V., Treffers, R. R., Li, W., & Richmond, M. W. 2000, PASP, 112, 1532
- Van Dyk et al. (2018) Van Dyk, S. D., et al. 2018, ApJ, 860, 90
- Van Dyk et al. (2014) —. 2014, AJ, 147, 37
- Whitesides et al. (2017) Whitesides, L., et al. 2017, ApJ, 851, 107
- Yoon et al. (2017) Yoon, S.-C., Dessart, L., & Clocchiatti, A. 2017, ApJ, 840, 10
- Zheng et al. (2014) Zheng, W., et al. 2014, ApJ, 783, L24