Unsupervised Time Series Extraction from Controller Area Network Payloads
††thanks: The views expressed in this document are those of the authors and do not reflect the official policy or position of the United States Air Force, the United States Army, the United States Department of Defense or the United States Government. Approved for public release (Case Number 88ABW-2018-1916).
Abstract
This paper introduces a method for unsupervised tokenization of Controller Area Network (CAN) data payloads using bit level transition analysis and a greedy grouping strategy. The primary goal of this proposal is to extract individual time series which have been concatenated together before transmission onto a vehicle’s CAN bus. This process is necessary because the documentation for how to properly extract data from a network may not always be available; passenger vehicle CAN configurations are protected as trade secrets. At least one major manufacturer has also been found to deliberately misconfigure their documented extraction methods. Thus, this proposal serves as a critical enabler for robust third-party security auditing and intrusion detection systems which do not rely on manufacturers sharing confidential information.
Index Terms:
Controller Area Network, CAN, embedded systems, Cyber Physical, Lexical Analysis, Reverse Engineering, Passenger VehiclesI Introduction
Current production vehicles are becoming as much software as they are hardware. Their networks now feature optional persistent Internet connections and are complex enough to support emerging technologies such as autonomous driving and Vehicle-to-Everything (V2X) applications [1]. Mass production of vehicles with Internet accessible computers capable of controlling all aspects of the vehicle makes incorporating and validating defense in depth cyber security techniques a practical necessity.
Bug bounty programs, Cyber Emergency Response Teams (CERT), and widely attended ’hacker’ conferences are all strong evidence that independent research is an essential part of developing and validating robust cyber security practices. We assume that the computing systems and networks used in the automotive industry are no exception to needing third party security auditing to establish and improve robust defense in depth security measures. Third party research also ensures that accidental or deliberate network flaws such as the 2015 Volkswagen emission scandal are identified and corrected more quickly [2]. To that end, we intend the methods presented in this paper to address the absence of a CAN payload tokenization technique. Without an effective payload tokenization technique, third party research is limited to manual reverse engineering a small set of vehicles and hoping those are representative of the broader market, using methods which ignore the useful information present in CAN payloads, or somehow gain access to confidential manufacturer specifications.
II Background
II-A Automated Network Traffic Reverse Engineering
The concept of automated protocol reverse engineering using observed network traffic is an active area of research. However, practically all published research is focused on analyzing a heterogeneous mix of text-based application layer protocols with the goal of facilitating deep packet inspection [3, 4, 5, 6, 7]. The approach presented in this paper is based on analyzing payloads of a single known protocol-Controller Area Network (CAN)-which is not text-based. The key difference is the difficulty of lexical analysis.
We propose the difference between translating sentences written using Japanese Katakana and English is a reasonable analogy to the difference between existing research and the problem addressed by this paper. Automated translation of either language certainly shares similarities once the words in a sentence and their ordering have been identified. However, with text-based network protocols and English there is a finite set of delimiters that are almost always present between ‘words’. Thus, the lexical analysis phase proposed in [3, 4, 5, 6, 7] and related work is almost always a trivial process using a set of delimiter characters known a priori. Sentences written with Japanese Katakana and CAN payloads do not use explicit delimiters. This makes ‘word’ discovery non-trivial in these contexts.
The approach proposed by Markovitz and Wool is the only published method found to address the problem of automated reverse engineering of CAN protocol payloads [10]. Markovitz and Wool proposed a brute force search followed by heuristic selection using the number of unique values present in each time series considered. The authors reported that this lexical analysis method had poor accuracy using self generated network data. Thus, the reverse engineering pipeline presented in this paper is assumed to be the first proposal for robust automated reverse engineering of non-text network protocol payloads.
II-B Tokenization
The term tokenization is taken from compiler design in computer science. Compilers are the software which converts a program into a series of operations that can run on computer hardware [8]. Lexical analysis is the first step of a compiler which uses human readable programming code as an input. The tokenization process identifies the individual logical units, or tokens, that code consists of. For example, the following program code results in the nine tokens ‘for’, ‘x’, ‘in’, ‘range’, ‘(’, ‘0’, ‘,’, ‘10’, ‘)’:
If the f and o in the token ‘for’ are incorrectly separated during tokenization, then the following steps in the compiler will fail. The compilation should also fail if the tokens ‘for’ and ‘x’ are not separated during tokenization.
We define the tokenization of CAN data as the process of identifying the logically distinct time series present within message payloads using the same arbitration ID. The term time series is taken from the National Institute of Science and Technology (NIST) definition of a univariate sequence of values ordered by the time observed [9]. Examples of time series in a vehicle might be measurements by an Electronic Control Unit (ECU) monitoring the front right wheel’s rotations per minute (RPM), steering wheel angle, or engine RPM. We will refer to individual time series extracted through tokenization simply as signals for the remainder of this paper.
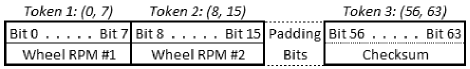
As an example, imagine the RPM signal for two of a vehicle’s wheels and a checksum are all contained in the set of 64-bit payloads using a CAN arbitration ID of 0xA15. The two RPM measurements and checksum are 8-bit signals. A possible tokenization would be the set of start and stop indices: (0, 7), (8, 15), (56, 63). The bit positions 16 through 55 are padding bits which are consistently 1 or 0 in every observed payload using ID 0xA15. Figure 1 depicts this hypothetical tokenization scenario.
We empirically found that tokenization is necessary to correctly interpret CAN message payloads. This is because a series of payloads using a shared arbitration ID often contains multiple sensor readings concatenated together. This observation is echoed by other third party CAN research findings [10, 11]. Thus, we define the input of CAN tokenization as a series of chronologically-ordered CAN message payloads present in a sample of CAN network traffic which share the same arbitration ID. We assume payloads for each ID always use the same bit-width (e.g., the payload is always 64-bits) and logical formatting. This assumption is based on our empirical analysis of eight vehicles produced for the United Sates market and the findings of Miller and Valasek [11]. The output of CAN tokenization is the set of bit positions within the payload that bound each logically-distinct signal.
Correct payload tokenization and classification of CAN signals enables a broad range of findings. For example, extracting the brake pedal position signal from a CAN bus is sufficient to identify who is driving the vehicle out of a population of known drivers [12]. Using the signal type, transmission frequency, and other features may be sufficient to fingerprint specific Electronic Control Unit (ECU) hardware in a similar fashion. Automating the process of fingerprinting particular ECUs could lead to rapidly, passively, and cheaply identifying vehicles affected by published ECU firmware vulnerabilities. Again, the first step to achieving such results is the tokenization of CAN payloads.
III Research Method
III-A Transition Analysis
The goal of this initial CAN payload tokenization proposal is to correctly extract continuous numerical signals transmitted over a vehicle’s CAN bus. We assume the preponderance of payloads produced in production CAN networks are mostly comprised of continuous and categorical data. This assumption is again based on empirical research of eight production vehicles and the work done by Miller and Valasek [11]. Extracting continuous numerical signals from a heterogeneous population of continuous and categorical signals achieves three important objectives. First, it provides the continuous numerical signals as a ready-to-analyze output. Second, removing these signals reduces the bit width of the remaining payload segments which need to be tokenized. Third, removing continuous data from observed CAN payloads allows methods targeted for the tokenization of categorical data to operate with the assumption that the data set is a homogeneous population of categorical data.
The reason continuous numerical signals can and should be targeted first is because there’s a predictable relationship between bit positions used to convey continuous numerical data. Numerical data can be represented with a binary protocol like CAN using a range of encoding schemes such as unsigned values or signed values using two’s compliment, one’s compliment, signed magnitude, and more. The common feature of these various encoding schemes is the notion that bits are ordered from a least significant bit (LSB) to a most significant bit (MSB). The LSB represents the ’s place and the MSB represents the ’s place where n is the bit width being used.
We empirically found that vehicle sensors sampling continuous real world processes such as velocity, pedal position, and steering angle many times a second using numerical data will produce approximately continuous numerical time series. To say this another way, vehicle sensors measuring locomotion will report numbers that have small differences between sequential samples. RPM will not jump between 1,200, 7,000, back down to 2,000, and then 5,000 within one second unless the engine might be exploding. Rather, a generally smooth increase from one value to another will be observed such as 2,000 to 2,032 and then 2,053 RPM.
The use of bit ordering from LSB to MSB and the approximately continuous numerical nature of signals produced by locomotion related ECUs causes predictable relationships to form between neighboring bit positions within CAN payloads. Transition analysis can quantify this predictability for unsupervised payload tokenization.
A bit position transitions when it flips between 1 and 0 in chronologically-sequenced CAN payloads using the same arbitration ID and bit width. Bit level transition analysis can be efficiently calculated by storing observed payloads into an boolean matrix. is the number of row vectors with one row per observed CAN message payload. is the bit width of the payloads with column vectors representing the relative bit positions within the payloads. See Table I for an example of a 10 x 8 boolean matrix representing 10 samples of an 8-bit payload.
By performing an exclusive or (XOR) of each sequential pair of row vectors in such a boolean matrix, a transition matrix is the created with rows and 1s anywhere a bit transition occurred. Table II is the transition matrix produced from Table I. In this example the 0th row vector is XORed with the 1st row vector.
| Observation | Bit Position | |||||||
|---|---|---|---|---|---|---|---|---|
| 0 | 0 | 0 | 0 | 0 | 0 | 0 | 0 | 0 |
| 1 | 0 | 0 | 0 | 0 | 0 | 0 | 0 | 1 |
| 2 | 0 | 0 | 0 | 0 | 0 | 0 | 1 | 0 |
| 3 | 0 | 0 | 0 | 0 | 0 | 0 | 1 | 1 |
| 4 | 0 | 0 | 0 | 0 | 0 | 1 | 0 | 0 |
| 5 | 0 | 0 | 0 | 0 | 0 | 1 | 0 | 1 |
| 6 | 0 | 0 | 0 | 0 | 0 | 1 | 1 | 0 |
| 7 | 0 | 0 | 0 | 0 | 0 | 1 | 1 | 1 |
| 8 | 0 | 0 | 0 | 0 | 1 | 0 | 0 | 0 |
| 9 | 0 | 0 | 0 | 0 | 1 | 0 | 0 | 1 |
| 0 | 0 | 0 | 0 | 0 | 0 | 0 | 0 | |
| 0 | 0 | 0 | 0 | 0 | 0 | 0 | 1 | |
| 0 | 0 | 0 | 0 | 0 | 0 | 0 | 1 |
The 1st row vector is XORed with the 2nd row vector and so on for all sequential row vectors in the boolean matrix. Summing the 1s in each column vector (bit position) of the transition matrix produces a row vector. For the remainder of this proposal this summary row vector will be referred to as a Transition Aggregation N-Gram (TANG).
| XOR Result | Bit Position | |||||||
|---|---|---|---|---|---|---|---|---|
| Obs. | 0 | 0 | 0 | 0 | 0 | 0 | 0 | 1 |
| Obs. | 0 | 0 | 0 | 0 | 0 | 0 | 1 | 1 |
| Obs. | 0 | 0 | 0 | 0 | 0 | 0 | 0 | 1 |
| Obs. | 0 | 0 | 0 | 0 | 0 | 1 | 1 | 1 |
| Obs. | 0 | 0 | 0 | 0 | 0 | 0 | 0 | 1 |
| Obs. | 0 | 0 | 0 | 0 | 0 | 0 | 1 | 1 |
| Obs. | 0 | 0 | 0 | 0 | 0 | 0 | 0 | 1 |
| Obs. | 0 | 0 | 0 | 0 | 1 | 1 | 1 | 1 |
| Obs. | 0 | 0 | 0 | 0 | 0 | 0 | 0 | 1 |
| TANG | 0 | 0 | 0 | 0 | 1 | 2 | 4 | 9 |
III-B Greedy Bit-Position Grouping
Bit positions with the largest transition count in a TANG might be the LSB of a numerical signal within the CAN payloads. If a LSB and its neighboring bit positions represent a monotonically-decreasing gradient of transition counts in a TANG, this is evidence that they belong to the same continuous numerical signal. This behavior is demonstrated in the TANG produced from Table I. Bit position was the LSB of the bit positions representing the unsigned integer sequence counting from 0 in row 0 to 9 in row 9.
Algorithm 1 presents a greedy strategy for clustering bit positions suspected of being a continuous numerical signal using TANGs. The benefits of this greedy approach are the ability to work with the univariate format of TANGs, no requirement to specify the number of signals in a payload, and no reliance on heuristics or a priori knowledge of the CAN payload. It is possible to implement Algorithm 1 without sorting a copy of the TANG or using nested loops; however, this slightly more inefficient version is presented to allow for a conceptually straightforward written explanation.
Algorithm 1 begins by sorting a TANG by observed transition count on line 6. This sorted list of bit positions is placed in a stack (a last in-first out data structure) with bit positions that transitioned the most frequently at the top of the stack. The stack is iteratively popped on lines 9 and 10 until all bit positions have been considered. When a bit position is popped from the top of the stack, the conditional statement on line 11 uses the ‘complete’ list to check if it is already clustered. If not, the assumption is made that this bit position is the least significant bit (LSB) of a signal. Lines 12 through 15 create a new cluster with this bit position.
The nested loop on lines 16 through 21 then consider all bit positions on the left-hand or right-hand side (endian dependent) of the new LSB. These neighbor bit positions are added to the new cluster of bit positions while they represent a monotonically-decreasing gradient of transition values in the TANG. The ‘less than or equal’ transition count comparison on line 16 could be replaced with an adjustable maximum difference threshold. Once all bit positions have been considered, the clusters are returned as output. Each cluster of bit positions represent an educated guess about where continuous numerical signals exist in the arbitration ID’s payloads. The maximum difference threshold method was used when producing findings and examples for this paper.
IV Findings
IV-A Anecdotal Results of Greedy CAN Payload Tokenization
In this section several anecdotal examples of TANGs and the results of Algorithm 1 are presented based upon approximately 10 minutes of CAN network traffic collected from a 2012 model year minivan being operated in city driving conditions. This vehicle is one of eight model year 2008 or later passenger vehicles studied. This sample population of vehicles includes sedans, sport utility vehicles, pickup trucks, and minivans. These vehicles used traditional gasoline internal combustion or hybrid powertrains; no diesel vehicles were studied. Two vehicles were equipped with a manual transmission. While the CAN network in each vehicle studied is at least superficially unique, we found Algorithm 1 achieved similar success across all of the vehicles. Due to space limitations, only anecdotal results from one vehicle will be presented.
These findings are deliberately presented as anecdotal results as opposed to a qualitative evaluation using synthesized data. Providing specific qualitative performance statistics for Algorithm 1 using synthetic (but known) CAN traffic is unhelpful at best and misleading at worst. The fundamental problem being addressed by this paper is a lack of a priori knowledge of the CAN network beyond the CAN protocol specification. Creating a testbed CAN network and explicitly or implicitly claiming it is representative of all production vehicle CAN networks for the purposes of validating Algorithm 1 is a non-trivial claim. Unfortunately, further exploring the interesting problem of creating a sufficiently ‘representative’ CAN network is also beyond the scope and length limits of this paper.
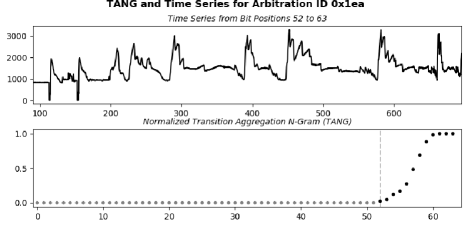
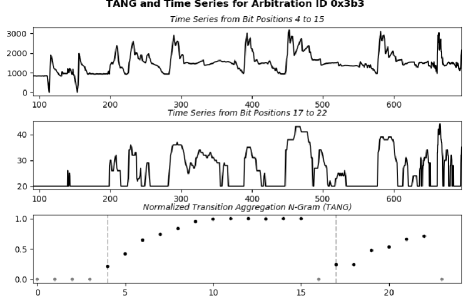
Figures 2 and 3 are examples of CAN payloads with continuous numerical signals targeted by Algorithm 1. With the exception of the bottom plot in each figure, these plots represent each logically distinct time series present in the payloads of the listed arbitration IDs. These time series plots represent a non-overlapping subset of bit positions present in the total payload size shown in the TANG plot at the bottom of each figure. The vertical axis of these time series plots is the unsigned integer interpretation for the indicated cluster of bit positions within each payload. The horizontal axis is the chronological index of the payloads observed in the sample. Thus, these time series plots can be read from left to right as the unsigned integer value that cluster of bit positions took on as time progressed in the driving sample.
The TANG plot at the bottom of each figure is a graphical representation of the TANG for the listed arbitration ID. The vertical axis of this TANG plot is the min-max normalized transition count (transitions divided by total observations) for each bit position in the eight byte payloads. Higher values on this vertical axis indicate the bit position marked by the horizontal axis transitioned more frequently. The horizontal axis indicates the total bit positions in the series of observed payloads.
Vertical dashed lines indicate the most significant bit (MSB) of a signal identified by Algorithm 1. The LSB of each signal is not explicitly identified to avoid clutter. However, both the LSB and MSB are explicitly listed in the sub-title of each time series plot. Grey points in the TANG plot indicate possible padding bits observed in the CAN data sample; these bit positions never transitioned in the driving sample.
V Future Work
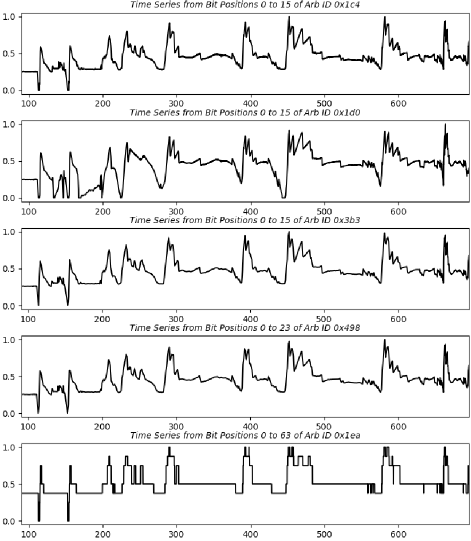
In the future we will present an unsupervised pipeline for identifying and clustering continuous numerical signals expected to be correctly tokenized by the proposed tokenization strategy. This pipeline was used to generate the signal cluster in Figure 4. The pipeline will be used to rapidly produce a large data set of accurately tokenized time series present in production CAN networks. That empirical data set will be used to formulate a ‘gold standard’ labeled data set as part of a proposal for robust validation of tokenization or intrusion detection algorithms for cyber-physical systems using CAN.
VI Conclusion
This paper introduced the idea of CAN payload tokenization and motivated the need for such a pipeline. Section III proposed an efficient method of quantifying predictable bit level relationships in CAN payloads using Transition Aggregation N-Grams (TANGs). A greedy strategy was proposed as a proof of concept for how TANGs can be used to automate CAN payload tokenization. Section IV presents three examples of Algorithm 1’s performance with real world CAN data.
Payload tokenization techniques are sorely needed for third-party research in domains using CAN and similar protocols. This proposal partially addresses that shortfall.
References
- [1] Uhlemann, E. (2018, March). The Battle of Technologies or the Battle of Business Models? [Connected Vehicles]. IEEE Vehicular Technology Magazine, 13(1), 14–18. http://doi.org/10.1109/MVT.2017.2781539
- [2] Hotten, R. (2015, December 10). Volkswagen: The scandal explained. BBC News, p. 1. Retrieved from http://www.bbc.com/news/business-34324772
- [3] Choi, K., Son, Y., Noh, J., Shin, H., Choi, J., & Kim, Y. (2016). Dissecting Customized Protocols: Automatic Analysis for Customized Protocols Based on IEEE 802.15.4. In Proceedings of the 9th ACM Conference on Security &38; Privacy in Wireless and Mobile Networks (pp. 183–193). New York, NY, USA: ACM. http://doi.org/10.1145/2939918.2939921
- [4] Glennan, T., Leckie, C., & Erfani, S. M. (2016). Improved Classification of Known and Unknown Network Traffic Flows Using Semi-supervised Machine Learning. In J. K. Liu & R. Steinfeld (Eds.), Information Security and Privacy: 21st Australasian Conference (Vol. 2, pp. 493–501). Melbourne: Springer International Publishing. http://doi.org/10.1007/978-3-319-40367-0_33
- [5] Puuperä, R. L. S. (2010). Domain Model Based Black Box Fuzzing Using Regular Languages. University of Oulu. Retrieved from https://www.ee.oulu.fi/roles/ouspg/genome?action=AttachFile& do=get&target=masters_thesis_puupera.pdf
- [6] Röning, J. (2010). PROTOS Protocol Genome Project. Retrieved January 1, 2017, from https://www.ee.oulu.fi/roles/ouspg/genome
- [7] Wang, Y., Yun, X., Shafiq, M. Z., Wang, L., Liu, A. X., Zhang, Z., … Guo, L. (2012). A semantics aware approach to automated reverse engineering unknown protocols. In 20th IEEE International Conference on Network Protocols (ICNP) (pp. 1–10). IEEE. http://doi.org/10.1109/ICNP.2012.6459963
- [8] Aho, A. V., & Ullman, J. D. (2013). The Theory of Parsing, Translation, and Compiling. Prentice-Hall Series in Automatic Computation, 53(9), 1689–1699. http://doi.org/10.1017/CBO9781107415324.004
- [9] Chapter 6.4: Introduction to Time Series Analysis, NIST/SEMATECH e-Handbook of Statistical Methods, http://www.itl.nist.gov/div898/handbook/pmc/section4/pmc4.htm, 2013.
- [10] Markovitz, M., & Wool, A. (2017). Field classification, modeling and anomaly detection in unknown CAN bus networks. Vehicular Communications, 9, 43–52. http://doi.org/10.1016/j.vehcom.2017.02.005
- [11] Miller, C., & Valasek, C. (2013). Adventures in Automotive Networks and Control Units. Technical White Paper, 99. Retrieved from http://www.ioactive.com/pdfs/IOActive_Adventures_in_Automotive_ Networks_and_Control_Units.pdf
- [12] Enev, M., Takakuwa, A., Koscher, K., & Kohno, T. (2016). Automobile Driver Fingerprinting. Proceedings on Privacy Enhancing Technologies, 2016(1), 34–51. https://doi.org/10.1515/popets-2015-0029