11email: simondiazgar@gmail.com 22institutetext: Departamento de Astrofísica, Universidad de La Laguna, E-38205, La Laguna, Tenerife, Spain 33institutetext: Astrophysics Research Institute, Liverpool John Moores University, IC2, Liverpool Science Park, 146 Brownlow Hill, Liverpool, L3 5RF, UK 44institutetext: Astronomy Research Unit, University of Oulu, FI-90014 Finland
Inner and outer rings are not strongly coupled with stellar bars
Rings are distinctive features of many disc galaxies and their location and properties are closely related to the disc dynamics. In particular, rings are often associated to stellar bars, but the details of this connection are far from clear. We have studied the frequency and dimensions of inner and outer rings in the local Universe as a function of disc parameters and the amplitude of non-axisymmetries. We used the 1320 not highly inclined disc galaxies () from the S4G survey. The ring fraction increases with bar Fourier density amplitude: this can be interpreted as evidence for the role of bars in ring formation. The sizes of inner rings are positively correlated with bar strength: this can be linked to the radial displacement of the 1/4 ultraharmonic resonance while the bar grows and the pattern speed decreases. The ring’s intrinsic ellipticity is weakly controlled by the non-axisymmetric perturbation strength: this relation is not as strong as expected from simulations, especially when we include the dark matter halo in the force calculation. The ratio of outer-to-inner ring semi-major axes is uncorrelated with bar strength: this questions the manifold origin of rings. In addition, we confirm that i) () of the galaxies hosting inner (outer) rings are not barred; ii) on average, the sizes and shapes of rings are roughly the same for barred and non-barred galaxies; and iii) the fraction of inner (outer) rings is a factor of () larger in barred galaxies than in their non-barred counterparts. Finally, we apply unsupervised machine learning (self-organising maps, SOMs) to show that, among early-type galaxies, ringed or barred galaxies cannot be univocally distinguished based on 20 internal and external fundamental parameters. We confirm, with the aid of SOMs, that rings are mainly hosted by red, massive, gas-deficient, dark-matter poor, and centrally concentrated galaxies. We conclude that the present-day coupling between rings and bars is not as robust as predicted by numerical models, and diverse physical mechanisms and timescales determine ring formation and evolution.
Key Words.:
galaxies: structure - galaxies: evolution - galaxies: statistics - galaxies: spiral - galaxies: fundamental parameters - galaxies: photometry1 Introduction
Rings are elliptical or circular closed stellar and gaseous structures in disc galaxies. They are intimately connected with the evolution of spiral structure, which may explain why many of them are pseudo-rings made of tightly wrapped spiral arms. Three main types of rings (nuclear, inner, and outer rings) are found in galaxies, named based on their position in the disc and relative to the bar (e.g. Buta et al., 2015, and references therein).
A lens is a feature with a shallow brightness gradient interior to a sharp edge (e.g. Kormendy, 1979). There are lens analogues of each type of ring (Laurikainen et al., 2011). A ringlens is the same kind of feature but with the appearance of a subtle enhancement at the rim, resembling a low contrast ring.
The frequency of inner and outer rings in disc galaxies reported by Buta & Combes (1996) is and , respectively, based on classifications of galaxies from the RC3 catalogue (de Vaucouleurs et al., 1991) with recessional velocities lower than km s-1. Comerón et al. (2014) found a global fraction of and for inner and outer features (rings+ringlenses), respectively, based on the morphological classifications made by Buta et al. (2015) to the Spitzer Survey of Stellar Structure in Galaxies (S4G; Sheth et al., 2010), comprised of galaxies within 40 Mpc. The distribution of inner and outer rings spans a wide range of morphological types and peaks for Sa galaxies, whereas ringlenses peak for earlier types (S00) (e.g. Laurikainen et al., 2011; Comerón et al., 2014).
Approximately two thirds of galaxies in the local Universe host bars (e.g. de Vaucouleurs et al., 1991; Knapen et al., 2000; Whyte et al., 2002; Laurikainen et al., 2004; Díaz-García et al., 2016b), and the bar fraction in the nearby Universe has a minimum for Sb/c systems (40-45 ; Buta et al., 2015; Díaz-García et al., 2016b). The standard view is that most rings in disc galaxies form from interstellar gas collected near resonances, under the continuous action of gravity torques from a bar pattern. The bar resonances occur where the radial (epicyclic) frequency , where is the circular angular velocity, is the pattern speed of the bar, and is an integer. The main ring-forming resonances have a low order: = +2 and 2 (inner and outer Lindblad resonances, or ILR and OLR, respectively) and =+4 and 4 (inner and outer 4:1 ultraharmonic resonances, or I4R and O4R, respectively). In numerical simulations, nuclear rings have been linked to double ILRs, inner (pseudo-)rings to the I4R, and outer (pseudo-)rings to the OLR and the O4R. For further details, the reader is referred, for example, to Marochnik et al. (1972), Lynden-Bell & Kalnajs (1972), Duus & Freeman (1975), Schommer & Sullivan (1976), Schwarz (1981), Athanassoula et al. (1982), Sellwood & Wilkinson (1993), Rautiainen & Salo (2000), and Buta (2017b).
Because of their resonant origin, many inner rings in barred galaxies appear aligned with bars (e.g. de Vaucouleurs et al., 1964; Schommer & Sullivan, 1976). However, Comerón et al. (2014) showed that nearly 50 of inner rings have random orientations with respect to the bar (mainly in late-type galaxies), suggesting that other physical mechanisms might be responsible for their creation (e.g. they might be caused by spiral modes that are decoupled from the bar).
Rings are expected to be more elongated in strongly barred galaxies than in their non-barred and weakly barred counterparts (e.g. Schwarz, 1984). Possible evidence for this was provided by Grouchy et al. (2010) based on estimates of the tangential-to-radial force ratio (e.g. Combes & Sanders, 1981; Laurikainen & Salo, 2002), but their sample was fairly small (44 galaxies). Comerón et al. (2014) also reported that inner and outer rings tend to become more elliptical when the galaxy family changes from SA (non-barred) to SB (strongly barred).
The manifold theory (see e.g. Romero-Gómez et al., 2006; Patsis, 2006; Voglis et al., 2006; Romero-Gómez et al., 2007; Tsoutsis et al., 2008; Athanassoula et al., 2009b) also predicts a dependence of the de-projected ellipticity of inner and outer rings (and of the ratio between their semi-major axes) on the bar perturbation strength (Athanassoula et al., 2009a). This theory proposes that stars get confined in families of orbits organised in tubes (invariant manifolds) that arise from the unstable and Lagrangian points close to the bar end.
The resonance and manifold views of galactic rings are reasonable interpretations and each can be tested observationally to some extent. However, the existence of rings in non-barred galaxies (e.g. Buta, 1995) poses a challenge to these ideas, and this motivates us to try to identify what fundamental galaxy parameters lie at the heart of the formation of bars and rings.
The main goals of this paper are, firstly, to examine how inner and outer ring properties111 We do not analyse nuclear rings because many of them are missing in the S4G survey ( of those identified by Comerón et al., 2010) due to its relatively low angular resolution. – such as linear dimensions, de-projected minor to major axis ratios, and relative frequency – correlate with galactic parameters such as mass, measures of bar strength, and galaxy morphological -type in the S4G survey; and, secondly, to use unsupervised machine learning techniques (self-organising map, SOM; Kohonen, 2001) to go beyond these kinds of parameters to multiple parameters having more global significance, trying different visualisation techniques to check if ringed and barred galaxies can be distinguished using clustering algorithms.
The paper is organised as follows: in Sect. 2 we present the sample and main data used in this work, we briefly describe the measurements of the dimensions of ring and bars (from Herrera-Endoqui et al., 2015), and we provide a summary of the way in which bar strengths and gravitational forces were calculated (from Díaz-García et al., 2016b). In Sect. 3 (and Appendix A) we analyse the fraction of rings as a function of stellar mass, considering barred and non-barred galaxies. In Sect. 4 we study the sizes of inner and outer rings in the Hubble sequence (and versus galaxy mass in Appendix B). Section 5 probes the dependence of ring sizes and axis ratio on the amplitude of non-axisymmetries. In Sect. 6 we test the predictions from the manifold theory on the effect of bar strength controlling the ratio of outer-to-inner ring semi-major axes. In Sect. 7 (and Appendices C-D) we analyse the outcome of training a SOM with internal (e.g. total stellar mass, gas fraction, star formation rate, bulge prominence, colour, or dark matter content) and external (e.g. torques and density of nearby galaxies) global parameters of S4G galaxies. In Sect. 8 we discuss the formation of inner and outer rings and the coupling between bars and rings. Finally, in Sect. 9 we summarise the main results of this paper.
2 Sample and data
2.1 Spitzer Survey of Stellar Structure in Galaxies (S4G)
The S4G (Sheth et al., 2010) is a magnitude- and diameter-limited survey that comprises 2352 galaxies with distances Mpc. These galaxies were observed in the 3.6 m and 4.5 m bands with the Infrared Array Camera (IRAC; Fazio et al., 2004) installed on-board the Spitzer Space Telescope (Werner et al., 2004).
A wide range of masses ( orders of magnitude) and all Hubble types () are included in the S4G sample. However, there is a bias towards late-type gas-rich systems because of the distance restriction based on 21 cm H i recessional velocities. To correct this bias, observations were extended to gas-poor early-type galaxies (ETG) with (Sheth, 2013), using optical velocities for the volume cut. Nevertheless, the survey remains incomplete: the S4G and the early-type galaxies extension missed more than 400 late-type galaxies without 21 cm systemic velocity measurements listed in HyperLEDA that fulfil the original selection criteria. We are currently obtaining -band photometry with ground-based telescopes for the of those galaxies that lack near-IR and optical archival imaging of resolution and depth comparable to IRAC or the Sloan Digital Sky Survey (Gunn et al., 2006). The current study is based on the original S4G.
Total stellar masses of S4G galaxies were calculated by Muñoz-Mateos et al. (2015) and will be extensively used in this work. The isophotal radii at the surface brightness 25.5 mag arcsec-2 () obtained from the m images is also taken from Muñoz-Mateos et al. (2015) and used as a proxy of the intrinsic disc size.
2.2 Morphological classification
By visual inspection of the 3.6 m images, Buta et al. (2015) carried out the morphological classification of the galaxies in the S4G, following a revised version of the de Vaucouleurs Hubble-Sandage system (de Vaucouleurs, 1959). This morphological classification is a suitable training data set for computer-based classification of galaxies using machine learning techniques.
The taxonomy by Buta et al. (2015) includes stellar bars as well as rings and ringlenses. The large depth of the S4G ( 1 pc2) allows the detection of nearly all outer features (see further discussion in Sect. 2.2 in Comerón et al., 2014). Buta et al. (2015) also determined the family – (non-barred), (weakest bars), , , and (strongest bars) – and the revised Hubble stage () of the galaxies that are used in this work. Hereafter, rings, pseudo-rings, and ringlenses are studied together, and referred to as rings, unless stated otherwise.
2.3 Sample of not highly inclined disc galaxies
In this work we use the 1320 disc galaxies (according to Buta et al., 2015)222 We have excluded 18 dwarf S0s () and seven peculiar galaxies with uncertain morphological types (, mostly interacting). in the original S4G sample with inclinations lower than 65∘ (according to Salo et al., 2015). Of these, 825 galaxies are barred, 465 host inner rings, and 264 host outer rings.
2.4 Measurements of dimensions of rings and bars
Measurements of the de-projected sizes and ellipticities of inner and outer stellar rings and bars are taken from Herrera-Endoqui et al. (2015). Only measurements with ”ok” flags () are used. They visually marked the outline of the ridge of the rings with points over unsharp mask images333Unsharp mask images are created by dividing by smoothed versions of the original image, in which subtle galactic structures that appear against a bright and diffuse background are easier to identify. that were then fitted with an ellipse, and de-projected to the plane of the disc. Hereafter, we will refer to the rings’ de-projected semi-major axis (SMA) as (or as and when differentiating inner and outer rings, respectively). Likewise, refers to the de-projected semi-minor axis, and to the intrinsic axis ratio.
We also use de-projected visual measurements of bar sizes () from Herrera-Endoqui et al. (2015), which were performed after optimising the brightness scale of the images to make the bars stand out. For the bar shape, they adjusted ellipses to the 2-D light intensity distribution of the 3.6 m images, and the maximum ellipticity at the bar region was calculated ().
2.5 Gravitational potential and bar forcing
Díaz-García et al. (2016b) used the NIR-QB code (Salo et al., 1999; Laurikainen & Salo, 2002) to perform the Fourier decomposition of the de-projected 3.6 m S4G images, and derived the normalised Fourier amplitudes , where indicates the surface density component. The maximum of at the bar region, named , is used here as a measurement of the bar strength (e.g. Laurikainen et al., 2004).
From the tabulated Fourier amplitudes, Díaz-García et al. (2016b) also calculated the gravitational potential at the equatorial plane, and derived tangential () and radial () forces. They calculated the radial profiles of tangential forces normalised to the mean radial force field (Combes & Sanders, 1981):
| (1) |
The maximum of at the bar region, named , is used as an estimate of the strength of the bar (e.g. Buta & Block, 2001; Laurikainen et al., 2002). In this work we also evaluate at and at .
Díaz-García et al. (2016b) calculated the stellar contribution (disc+bulge) to the circular velocity () from the mean radial force field (assuming the mass-to-light ratio at 3.6 m of 0.53 obtained by Eskew et al., 2012). They also obtained a first-order model of the halo rotation curve () and estimated the radial forces exerted by the halo444The halo velocity amplitude was obtained by fitting and to the inclination-corrected H i maximum velocity at the optical radius. The core radius of the halo (modelled as an isothermal sphere) was estimated from the total band luminosity, based on the universal rotation curve model (e.g. Persic et al., 1996; Hendry et al., 1997). Forces were calculated assuming a spherically symmetric model: . For further details on the method the reader is referred to Díaz-García et al. (2016b). . Then, a first-order halo correction on the tangential-to-radial force profiles () was implemented following Buta et al. (2004):
| (2) |
| Inner ring fraction: | All | Barred | Non-barred |
|---|---|---|---|
| 12.6 2.1 (247) | 14.3 2.6 (175) | 8.3 3.3 ( 72) | |
| 28.6 2.6 (304) | 30.7 3.1 (218) | 23.3 4.6 ( 86) | |
| 56.6 2.7 (332) | 63.4 3.3 (216) | 44.0 4.6 (116) | |
| 68.1 3.4 (188) | 73.1 4.3 (104) | 61.9 5.3 ( 84) | |
| 80.0 8.0 ( 25) | 72.2 10.6 ( 18) | 100.0 0.0 ( 7) |
| Outer ring fraction: | All | Barred | Non-barred |
|---|---|---|---|
| 10.5 2.0 (247) | 12.6 2.5 (175) | 5.6 2.7 ( 72) | |
| 16.4 2.1 (304) | 17.9 2.6 (218) | 12.8 3.6 ( 86) | |
| 27.7 2.5 (332) | 31.0 3.1 (216) | 21.6 3.8 (116) | |
| 43.6 3.6 (188) | 58.7 4.8 (104) | 25.0 4.7 ( 84) | |
| 28.0 9.0 ( 25) | 33.3 11.1 ( 18) | 14.3 13.2 ( 7) |
3 Ring fraction as a function of stellar mass
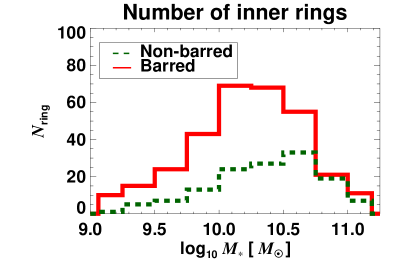
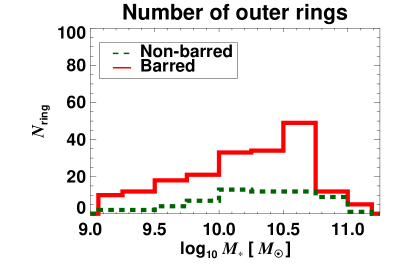
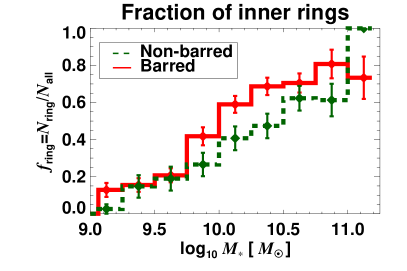
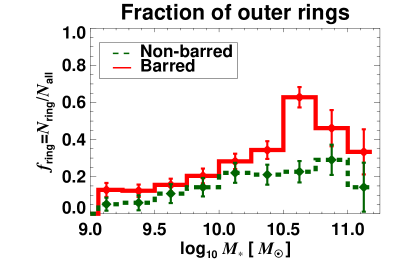
The fraction of inner and outer rings () is strongly dependent on stellar mass (Fig. 1). It increases with increasing for both barred and non-barred galaxies. It peaks at .
For inner rings, ranges from amongst faint galaxies () to for the more massive ones (), regardless of the presence of bars. We note that all of the (few) most massive non-barred galaxies host inner rings, but the statistics in this -bin are not very robust, given the sub-sample size (see the histogram in the upper left panel of Fig. 1). For outer rings, ranges from when to when .
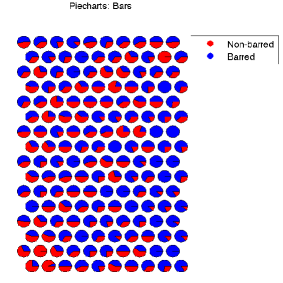
On average, barred galaxies tend to host rings more frequently than their non-barred counterparts. In particular, 555We calculate binomial counting errors: , where refers to the ring fraction and to the total number of galaxies. of the non-barred galaxies in our sample host outer rings, in contrast to of barred ones. Barred galaxies host inner rings in of the cases, which is larger than the of non-barred galaxies hosting them. In Table. 1 and Table. 2 we provide the fraction of inner and outer rings, respectively, in bins of 666 Nine galaxies in our sample do not have measurements of and are not included in this analysis. . The differences in between barred and non-barred galaxies tend to be larger for larger , and more clearly so for outer rings. In summary, the fraction of inner (outer) rings in barred galaxies is larger than in their non-barred counterparts by a factor of ().
 |
 |
 |
 |
4 Ring properties in the Hubble sequence
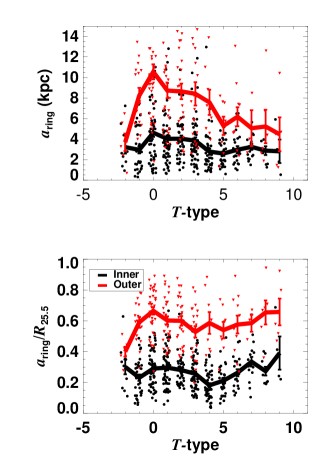
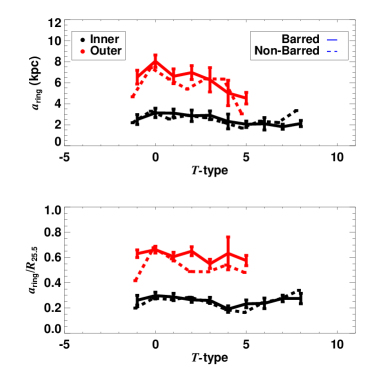
Ring sizes in physical units in galaxies with are larger than in late-type galaxies with (Fig. 2, upper panel), but this is mainly a consequence of the former galaxies being more massive and bigger in general (see also the upper left panel in Fig. 14). Ring sizes in physical units decrease with increasing for the spirals, and more clearly for the outer features.
When ring dimensions are normalised to the disc size (Fig. 2, middle panel), a new picture arises. The distribution of inner ring sizes has a minimum at . Their disc-relative sizes increase (decrease) with increasing when (), less clearly for outer features. Outer ring sizes (in kiloparsecs and normalised to the disc size) seem to decrease amongst S0s777 We note that the sampling of lenticulars in the S4G is relatively poor. .
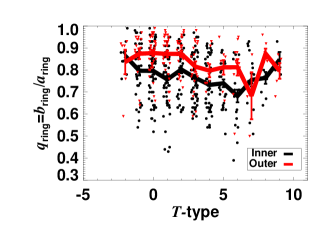
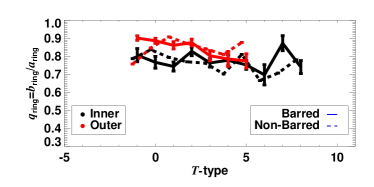
Considering their intrinsic ellipticity (Fig. 2, lower panel), inner rings are found to be typically more elongated than outer rings, regardless of type, in agreement with Comerón et al. (2014). On average, S0s and early-type spirals host somewhat more circular inner and outer rings than their late-type counterparts (see also Comerón et al., 2014), but the trend is very mild (at the end of the Hubble sequence, inner rings seem to be more circular for larger ). Interestingly, when we separate barred and non-barred galaxies and the ring sizes and axis ratios are compared, we find roughly the same running means (Fig. 3).
5 Ring properties as a function of bar strength
5.1 Ring fraction versus bar strength
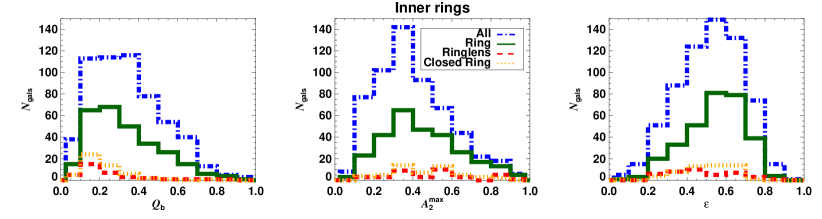
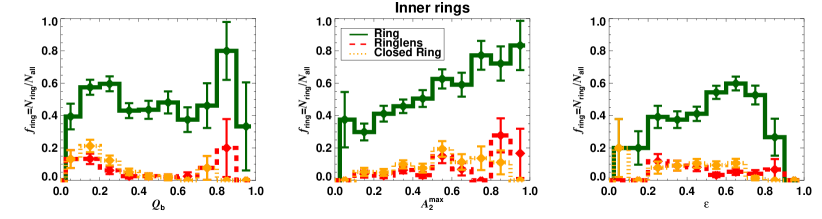
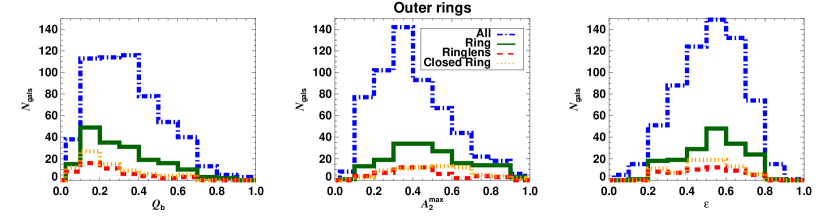
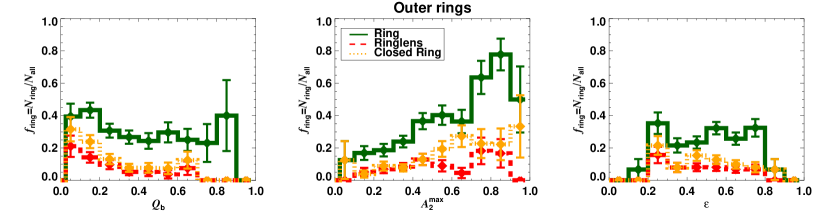
In order to investigate the role played by bars in ring formation, in Figs. 4 and 5 we show the distribution of the bar strength measurements for the galaxies with and without inner and outer rings, respectively. Ringlenses and closed rings (i.e. excluding pseudo-rings) are shown separately, and all bar strength proxies are taken into account. We also display the fraction of rings in bins of bar strength (lower panels).
The fraction of inner and outer rings increases with increasing . Bars with the largest values () host inner rings in nearly of the cases, which is a factor of two larger than the frequency for the weakly barred galaxies. This trend is also seen in , but it becomes rather flat for (with two local maxima for low and high values). In addition, galaxies with the largest bar Fourier amplitudes host outer rings in more than of the studied cases, which is about three times larger than in their weakly barred counterparts. This tendency is less clear when the ring fraction is studied as a function of or .
5.2 Ring sizes versus bar strength
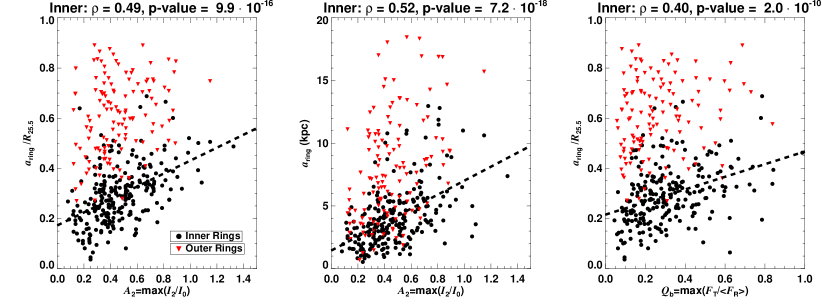
In Fig. 6 we compare the sizes of rings to the strength of the stellar bars, measured from and . This test aims to shed more light on the bar-rings coupling.
There is a clear correlation between the inner ring SMA, normalised to the disc size (), and the bar strength, as confirmed by the Spearman’s correlation coefficient () and value888The Spearman’s rank correlation assesses the existence of a monotonic relation between two variables: implies perfect (anti)correlation, and small values () indicate significant correlation. , shown above the plots. Nevertheless, the outer ring SMA is not (or very weakly) dependent on or . Likewise, correlates with the inner ring size in physical units, but we checked that this correlation is weaker for .
5.3 Ring ellipticity versus bar strength
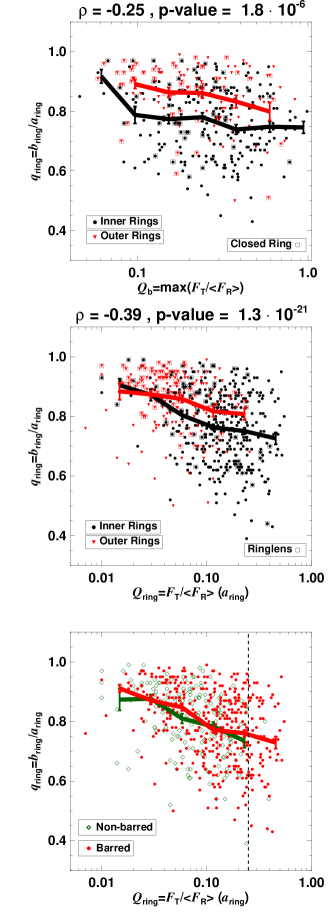
The next step is to analyse the link between the shape of the rings and the bar-induced perturbation strength. In Fig. 7 we test the dependence of the intrinsic shape of inner and outer rings on (i) the bar torque parameter (upper panel), and (ii) the tangential-to-radial forces evaluated at the de-projected SMA of the ring: (central and lower panels).
We find that, on average, the ring axis ratio decreases with increasing (more circular rings in weakly barred galaxies). The Spearman’s correlation coefficient and significance are and , respectively, and thus the relation is fairly weak. When the correlation is studied separately, it gets weaker for both outer (, ) and inner (, ) rings. The trend is the same when pseudo-rings are excluded, that is, when we only consider closed rings.
A stronger relation is shown between the intrinsic axis ratio of (inner and outer) rings and the tangential-to-radial forces evaluated at the ring semi-major axis ( and ). The scatter increases with increasing . The same trend is found for ringlenses, which tend to be rounder than normal rings. Also, the tendency of versus is exactly the same for barred and non-barred galaxies when . However, we note that only two of the 64 inner ringed galaxies with are non-barred.
5.4 Ring ellipticity versus halo-corrected forcing
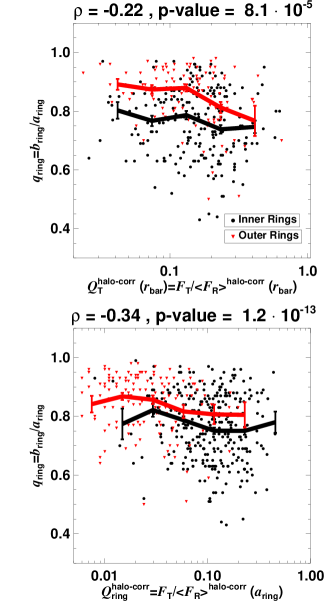
At the ring radii the contribution of the dark matter halo to the overall radial force field might be significant, especially in the case of outer features. Thus, it is important to correct the ratio for halo dilution (Eq. 2) when we assess the relationship between the intrinsic ellipticity of rings () and the amplitude of non-axisymmetries. This is done in Fig. 8, using a smaller sample of 439 galaxies (barred and unbarred) with estimates of the rotation curve decomposition model.
Halo-corrected tangential-to-radial forces evaluated at the bar end – – and at the ring SMA – – correlate weakly with . The trend is less clear when outer (, ) and inner (, ) rings are studied separately. The scatter in this relation is not noticeably reduced after the halo correction is performed.
Also, we note that the effect of halo dilution at the inner ring SMA is strongly dependent on the inner profile of dark matter density that we adopt (Sect. 2.5). Due to the uncertainty in (e.g. core versus cusp, see de Blok et al., 2008, and references therein) we also stress the uncertainty in the halo-corrected force profiles at . On the contrary, the halo correction at is likely to be more reliable.
6 Ratio of outer-to-inner ring sizes
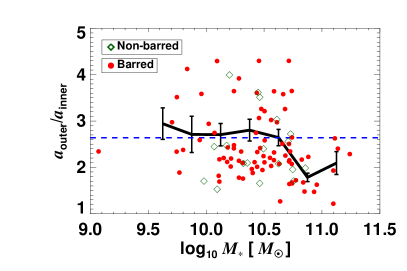
The ratio of the de-projected sizes of outer and inner rings () is an important constraint for numerical models (see discussion in Sect. 8.5.3) that we probe observationally here. We use a sub-sample of 103 galaxies simultaneously hosting inner and outer rings, of which 82 are barred. The distribution of as a function of the total stellar mass of the host galaxy is fairly flat (Fig. 9).
Under the assumption of a flat rotation curve, the linear treatment of resonances implies that and (e.g. Binney & Tremaine, 1987), where , , and refer to the location of the outer Lindblad resonance, the inner ultraharmonic resonance, and the corotation radii, respectively. This implies that , which is consistent with the mean values that we obtain for (Fig. 9). We note that tends to be slightly lower than 2.64 for all the data points with (13 galaxies). This, and the fairly large scatter in the plot, could be due to differences in the mass distribution and shape of the rotation curves of each of the galaxies (e.g. declining rotation curves amongst the most massive galaxies). Alternatively, these could be partly explained by the fact that some outer rings might not form exactly at the OLR, but at the outer 1:4 resonance (Buta, 2017b).
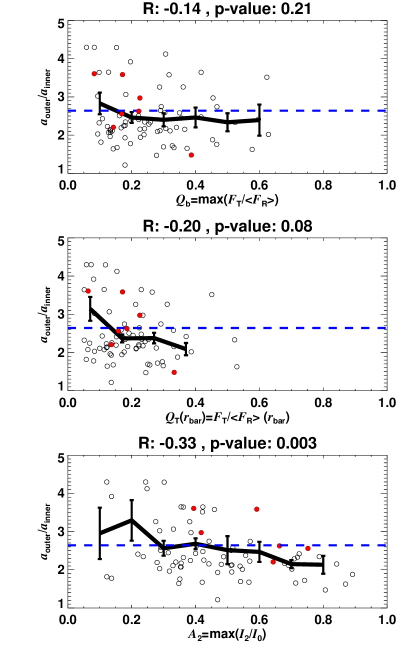
In order to shed more light on the connection between ring and bar properties, in Fig. 10 we study as a function of , and . This allows us to test the expected correlation from the manifold theory (e.g. Athanassoula et al., 2009a, and references therein) between and the bar-induced perturbation strength. A weak anti-correlation is found with or evaluated at the bar end. Bars with the largest do not present large outer-to-inner ring ratios. Amongst weaker bars () the bar prominence does not seem to control the ratio of the ring semi-major axes. When we only consider the seven inner ringed galaxies in our sample hosting or outer rings (we do not sample galaxies hosting rings of type exclusively), the trends are roughly the same. Overall, there is not a strong link between and bar strength.
7 Insights from unsupervised machine learning
In this section, we apply unsupervised machine learning (ML) techniques to the S4G. ML is well suited for our purposes for various reasons: i) Several factors govern the nature of rings and bars, which is hard to understand in terms of traditional scaling relations between pairs or trios of quantities (e.g. Tully & Fisher, 1977) or classical approaches for statistical analysis; ii) rather than using numerical Hubble stages, it is preferable to take into account large sets of physical properties of galaxies to shed light on the formation and evolution of stellar substructures999 In fact, there is a substantial scatter in the relation between morphology and colour, stellar mass, and other global parameters of disc galaxies (see e.g. Fig. 16).; and iii) we can check whether visual classifications reflect different families of galaxies (e.g. ringed) based on global parameters of S4G galaxies.
7.1 Self-organising maps (SOMs)
We use self-organising maps (SOMs; Kohonen, 2001), which are well suited to analyse ”small” data sets (on the order of records). In particular, we use the SOM Toolbox 2.0 for Matlab (Vesanto et al., 2000) and apply it to the S4G data. SOMs resemble vector quantisation algorithms (e.g. means) by which one can identify representative prototypes that capture fundamental properties of the data.
SOMs are groups of neurons that are connected with their neighbours and organised on a low-dimensional grid. Each of these neurons is a dimensional prototype (or weight vector), where refers to the dimension of the input vectors. A pre-defined grid of neurons is trained iteratively to stretch towards the training sample, and thus represents the density of data. This is done by finding the so-called best matching units (BMUs). The BMU of a data vector corresponds to the map unit whose model vector best fits it. BMUs are determined from the minimum Euclidean distance. More specifically, a SOM self-organises by learning the position of the data cloud through cooperative learning: not only the most similar prototype vector is updated (competitive learning), but also its neighbours on the map are moved towards the data vector.
We trained the SOMs using the default configuration (toolbox ”SOM_MAKE” routine) that applies the batch algorithm (see Vesanto et al., 2000). We used an hexagonal lattice with a Gaussian relation between neighbours, and 16x10 neurons. We tested the consistency of our method and results against changes in the number of neurons, neighbour relations between neurons and radius, dimensions of the SOMs, training time, and using the sequencial algorithm.
7.2 Measurements of fundamental parameters used for training self-organising maps
We trained the SOM using the following 20 measurements for the 1320 galaxies in our sample (in parentheses we indicate the percentage of the sample with available measurements)101010We note that SOM allows the data matrix to contain unknown values that are excluded from the distance calculations. :
-
1.
(). Total stellar masses from Muñoz-Mateos et al. (2015).
-
2.
(). Disc exponential scale length from Salo et al. (2015) (”ok” flags).
-
3.
(). 25.5 mag arcsec-2 isophotal radius at m from Muñoz-Mateos et al. (2015).
-
4.
(). First-order estimate of the halo-to-stellar mass ratio within the optical radius () from Díaz-García et al. (2016b, c)111111Díaz-García et al. (2016b, c) showed that the versus relation is in good agreement with the best-fit model at z0 in CDM cosmological simulations, assuming that the dark matter halo within the optical radius comprises a constant fraction () of its total mass.:
(3) where refers to the inclination-corrected H i velocity amplitude.
-
5.
(). Dynamical mass within the optical radius, calculated under the assumption of a spherical mass distribution:
(4) where is the Newtonian constant of gravitation.
-
6.
(). Inner gradient of stellar component of the rotation curve (from Díaz-García et al., 2016b), used as a proxy of the central stellar mass concentration (e.g. Erroz-Ferrer et al., 2016; Salo & Laurikainen, 2017). It was calculated from a polynomial fit to the inner part of , following Lelli et al. (2013), and taking the linear term as an estimate of the inner slope: .
- 7.
-
8.
(). Cold gas fraction.
-
9.
(). H i gas surface mass density, estimated as
(6) -
10.
(). Mass of the supermassive black hole estimated from central velocity dispersion () taken from HyperLEDA, using the calibration from Gültekin et al. (2009) (from Díaz-García et al. 2019, in prep).
-
11.
(). Colour calculated from the GALEX near-UV () and far-UV () magnitudes from the GALEX/S4G UV-IR catalogue (Bouquin et al., 2018). It traces variations in recent star formation (¡1 Gyr).
-
12.
colour () that traces the specific star formation (as does the next parameter).
-
13.
colour ().
- 14.
-
15.
sSFR (). Specific star formation rate: , where was derived from IRAS far-IR photometry.
-
16.
(). H i gas depletion times, calculated as (e.g. Knapen & James, 2009)
(7) - 17.
-
18.
(). Projected surface density to the third nearest neighbour galaxy from Laine et al. (2014).
-
19.
Mean pitch angle of the spiral pattern (). Calculated as the mean of the absolute value of the pitch angle of the different spiral segments (from Díaz-García et al. 2019, in prep, and Herrera-Endoqui et al., 2015).
-
20.
Weighted mean pitch angle of the spiral pattern (). Average of the absolute value of the pitch angle measurements, weighted by the relative length of the spiral segments (from Díaz-García et al. 2019, in prep).
We need to normalise these variables to avoid any of them having an overwhelming influence on the training. We use a continuous histogram equalisation (”histC”, see Sect 4.2.4 in Vesanto et al., 2000), which linearly scales the pre-ordered values (ranking) in bins of almost equal size, so that they eventually lie within 121212The components defined in log scale (11-12-13-17-18) were linearised (e.g. ratio of FUV and NUV fluxes instead of colours derived from magnitudes) before normalisation and initialisation of the SOM. . Other normalisation methods were also tested, yielding similar results. We confirmed that reducing the number of measurements used as an input for SOM hardly changes the results, especially when such measurements are similar or redundant (e.g. parameters 2-3, or 12-13, or 19-20) and could potentially induce an over-weighting of certain properties (but we note that using several proxies of the same property increases accuracy).
7.3 Analysis of self-organising maps
|

|
|
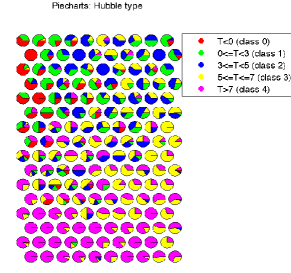
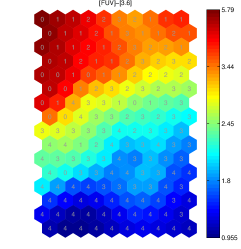
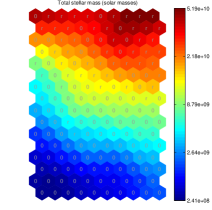
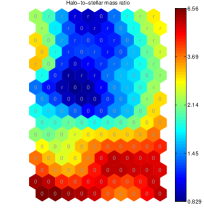
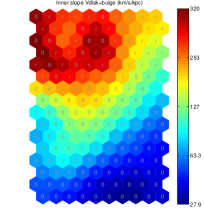
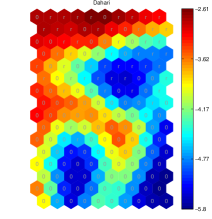
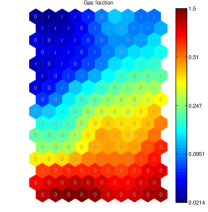
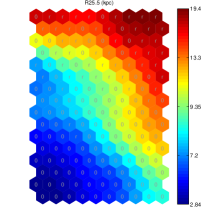
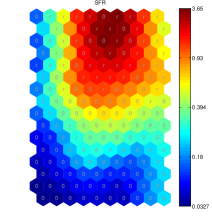
In Fig. 11 we show eight of the plane components used as input for SOM, which appear ordered after the training. The SOM has ordered in a way that the most massive, centrally concentrated, reddest, and gas-poor prototypes appear in the upper part. We easily detect various correlations between the different components: for instance, between total stellar mass and halo-to-stellar-mass ratio (e.g. Díaz-García et al., 2016b, c), gas fraction, [FUV]-[3.6] colour, or even weakly with the Dahari parameter.
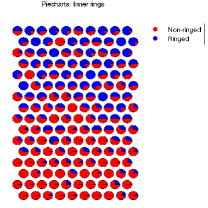
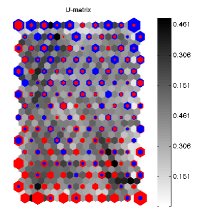
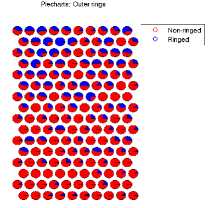
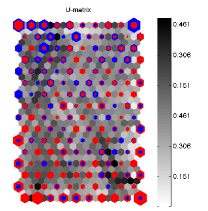
Overlaid in Fig. 11 are the winning classes per neuron: inner ringed (”r”) or non-inner ringed (”0”) galaxies. In Fig. 15 in Appendix C we show the same trends for the outer rings. In this phase, called post-labelling, we assign to each prototype the majority class of the data that it wins. These are determined from the hit histograms, which are created by increasing the counter of a map unit every time it acts as a BMU of a given data sample. In Fig. 12 we visualise hits with the aid of pie charts for each of the SOMs (first and third panels). They indicate the percentage of classes that win in terms of hits in each map unit. We also show the unified distance matrix or matrix (grey scale in second and fourth panels). It displays distances between neighbouring map units (prototypes), and therefore it has more elements than the component planes. The matrix helps to detect the cluster structures of the map, which should appear when an area of low uniform values is surrounded by high values (borders).
There are quite a few neurons with winning class ”r” in the SOM (), but they tend to be in the top-half, which mainly traces early-type galaxies. Ringed and non-ringed galaxies are randomly distributed within the SOM beyond a certain mass or colour, although the dominant class in the uppermost lines of neurons (most massive/reddest galaxies) is ”r”.
In the lower-half of the SOM, which corresponds to the prototypes associated to the faintest, more dark matter dominated, gas-rich, bluest, bulgeless galaxies (see Fig. 11), there are no neurons probing inner ringed galaxies. The same conclusion applies to outer rings, which are less frequent and appear only in the uppermost neurons of the SOM (see Fig. 15), corresponding to the most massive galaxies (e.g. S0s). No correlation is found between the presence of rings and the parameters probing the environment.
We checked that the results are practically the same when the post-labelling is done for barred and non-barred galaxies (Fig. 16 in Appendix D): neurons hitting barred galaxies as BMUs are not clustered within the SOM. We conclude that ringed or barred galaxies cannot be univocally distinguished using global S4G parameters and a SOM clustering algorithm.
8 Discussion: Interplay between bars and rings
We now discuss the formation and evolution of inner and outer rings and their hypothetical coupling with stellar bars – complementing previous studies by Comerón et al. (2014) and Herrera-Endoqui et al. (2015) – based on the analysis of the 3.6 m images from the S4G survey (Sheth et al., 2010), as presented in previous sections.
8.1 Bars and the resonant origin of rings
Bars, which are believed to be the dominant element in ring formation (e.g. Sellwood & Wilkinson, 1993), form spontaneously in body simulations from massive and cold galactic discs (e.g. Miller et al., 1970; Hohl, 1971; Toomre, 1977; Efstathiou et al., 1982; Sellwood, 1980; Toomre, 1981; Athanassoula, 1984). The so-called bar instability is believed to be the mechanism for the formation of the bar of the Milky Way at (e.g. Shen & Li, 2016) (but see Sellwood, 2000).
Inner and outer rings most likely formed through secular evolution via the rearrangement of cold gas by non-axisymmetric structures (e.g. Buta & Combes, 1996), more specifically, from the gas piled up near the 1/4 ultraharmonic resonance (e.g. Schwarz, 1984), and near the outer Lindblad resonance131313Recently, Buta (2017b) identified dark gaps in barred and oval ringed galaxies and linked them to the loci of corotation. He concluded that and outer rings and pseudo-rings are likely associated with the 4:1 resonance, not the outer Lindblad resonance, while the gap method links outer pseudo-rings to the OLR. (e.g. Athanassoula et al., 1982), followed by episodes of star formation.
The distribution of the sizes of inner and outer rings shown by Herrera-Endoqui et al. (2015, and references therein) is consistent with their resonant origin: they tend to lie in the expected loci of disc resonances. We also show (Sect. 6) that the ratio of outer-to-inner ring SMA is close to the expected value in galaxies with flat rotation curves, when , under a linear treatment of their resonances. Nonetheless, Herrera-Endoqui et al. (2015) also found in their distribution larger rings (relative to the bar extent) than expected from a resonant origin, and we show that the distribution of is very scattered and drops in the high- end. Thus, other mechanisms might also be responsible for ring formation. In fact, a few outer features might be polar rings (e.g. Lynds & Toomre, 1976; Schweizer et al., 1983) or accretion features that have not been recognised as such: Buta et al. (2015) mentioned the case of NGC 4772 in the S4G database.
8.2 Higher ring frequency in barred galaxies than in non-barred ones
In Sect. 3 we showed that the fraction of ringed galaxies increases with increasing and peaks for total stellar masses of order . This is the mass range with the lowest values of , that is, galaxies that are not dark-matter dominated, and the characteristic stellar masses at which the bar fraction has its maximum in the S4G (Díaz-García et al., 2016b).
We also showed that the fraction of outer (inner) rings in barred galaxies is larger than in non-barred ones by a factor of (). These numbers drop by if a more complete and smaller volume-limited sample (distances Mpc) is used (Appendix. A; see also Section 2.2 in Erwin, 2018). Our results are consistent (within the uncertainties) with the analysis in Comerón et al. (2014), who used a slightly more conservative inclination cut-off ( instead of the limit used in this work). In addition, we find that the differences increase with increasing stellar masses, especially in the case of outer features, which is an interesting observational constraint for numerical models. Overall, the larger fraction of rings amongst barred galaxies supports the role of bars in ring formation.
8.3 Rings in non-barred galaxies
Approximately () of the disc galaxies in the S4G hosting inner (outer) rings are not barred (Sect. 3). In addition, in Sect. 4 we showed that the distributions in the Hubble sequence of ring intrinsic ellipticities and sizes for non-barred galaxies are nearly the same as for barred ones. Herrera-Endoqui et al. (2015) came to the same conclusions after analysing ring sizes as a function of and using the disc scale length for the normalisation.
The existence of ringed galaxies lacking bars, and the similar distribution of ring sizes and ellipticities for barred and non-barred galaxies, points towards an unknown mechanism that leads some bars to dissolve into axisymmetric substructures (e.g. Kormendy, 1979; Raha et al., 1991; Bournaud et al., 2005). Nevertheless, bars in simulation models are very difficult to destroy (e.g. Athanassoula, 2003; Shen & Sellwood, 2004; Villa-Vargas et al., 2010; Athanassoula et al., 2013), unless the disc is extremely gas rich (e.g. Bournaud & Combes, 2002). In addition, the existence of non-barred galaxies is in itself not well understood (but see Saha & Elmegreen, 2018). On the other hand, ovals might be sometimes overlooked in galaxy classifications, but a massive oval could be just as important as a conventional bar on galactic dynamics and ring formation.
Alternatively, rings in non-barred galaxies could be created by long-lived spiral modes (see e.g. Rautiainen & Salo, 2000) or by non-axisymmetries set up by present (or past) interactions. As discussed in Comerón et al. (2014), the lack of outer rings in non-barred galaxies could be due to the effect of galaxy interactions destroying them (e.g. Elmegreen et al., 1992; Berentzen et al., 2003). Otherwise, it could be due to the fact that the gas and stars pushed outwards by weak ovals takes longer to form outer features.
8.4 Possible dependence of ring fraction on bar strength
We have found that the fractions of inner and outer rings increase with increasing relative bar surface density amplitude () (Sect. 5). This could be a hint of the role of bars driving the formation of rings: stronger bars are more efficient at collecting matter into the 1/4 ultraharmonic and outer Lindblad resonances.
Alternatively, it could arise from the simultaneous dependence on of (Sect. 3) and (Díaz-García et al., 2016a, b), and thus the correlation would not necessarily imply causation141414It is possible that the - relationship is more fundamental than any correlation between and bar strength. The latter should be addressed with even larger galaxy samples at different that allow for taking -bins and probing secondary dependences without compromising the statistical significance. . On the other hand, the histograms of inner ringed galaxies peak for slightly lower values as compared to the control sample. This is probably a consequence of being sensitive to the central concentration (bulge dilution, e.g. Block et al., 2001; Laurikainen & Salo, 2002) and to the total stellar mass of the galaxy (e.g. Díaz-García et al., 2016a, b)151515 The slightly different trends of versus and are likely to be due to the bimodality reported by Díaz-García et al. (2016b, see their Fig. 17) when these bar strength measurements were compared. .
Interestingly, Herrera-Endoqui et al. (2015) showed that inner rings are preferentially found in and non-barred galaxies, whereas outer rings occur independently of the family of the galaxy (see also Buta & Combes, 1996; Laurikainen et al., 2011; Comerón et al., 2014). Likewise, outer resonant rings are mainly seen in SAB galaxies in the analysis by Buta (2017a), who made the classifications of 3962 ringed galaxies from the Galaxy Zoo 2 (Willett et al., 2013). These trends would imply that weak bars are more efficient at resonance ring formation, which is rather counter-intuitive, or that bars tend to dissolve after the rings are assembled (Kormendy, 1979), which is challenging numerical models. These trends are not confirmed when the bar strength is used instead of the galaxy family (Sect. 5), even though we find a local maximum of for the lowest values (clearer for closed rings and ringlenses). We conclude that does not peak for weakly barred galaxies when quantitative measurements of the bar strength are used.
8.5 How non-axisymmetries control the dimensions of rings
8.5.1 Dependence of ring size on bar strength
It is known that the strength and the length of the bars in disc galaxies are correlated (e.g. Gadotti, 2011; Díaz-García et al., 2016b), more tightly amongst early- and intermediate-type spirals (S0/a-Sc). The relation is very clear for (e.g. Elmegreen et al., 2007; Durbala et al., 2009; Díaz-García et al., 2016b), which is the most common proxy for bar strength used in -body numerical models. This correlation agrees with the evolutionary track followed by bars in these simulations (e.g. Athanassoula, 2003; Martinez-Valpuesta et al., 2006), in which stellar bars become longer, narrower, and stronger in time as they trap particles from the disc and lose angular momentum. In Sect. 5 we found that the absolute and relative sizes of inner rings are correlated with bar strength. Given the coupling of the sizes of bars and inner rings (e.g. Comerón et al., 2014), this correlation could be explained by their concurrent growth as the galaxy evolves secularly. While the bar traps particles, it loses angular momentum and the pattern speed decreases, causing the 1/4 ultraharmonic resonance radius to move outwards in the disc. However, we note that the decrease of the bar pattern speed has not been confirmed with observations (e.g. Rautiainen et al., 2005, 2008; Pérez et al., 2012; Aguerri et al., 2015), but see Font et al. (2017).
Díaz-García et al. (2016b) and Erroz-Ferrer et al. (2016) confirmed that the bars with the largest sizes and values are typically hosted by galaxies with larger inner velocity gradients. These are indeed systems that evolve more quickly, given their larger central densities (e.g. Elmegreen et al., 2007). This might explain why early-type spirals have larger rings (Sect. 4 in this work) and bars (e.g. Erwin et al., 2005; Laurikainen et al., 2007; Díaz-García et al., 2016b; Font et al., 2017) than intermediate type spirals, which are the candidates to evolve secularly (Kormendy, 2013).
On the contrary, outer ring sizes are not dependent on bar strength. This could be due to the fact that outer resonance features might have decoupled after they formed and the bar potential changed. It could also simply mean that their formation is unrelated to the mixing caused by bars.
8.5.2 Dependence of ring ellipticity on bar strength
Inner rings are expected to be more elongated in strongly barred galaxies than in their non-barred and weakly barred counterparts (e.g. Schwarz, 1984; Salo et al., 1999). Recently, Comerón et al. (2014) found that indeed inner and outer rings are, on average, more elliptical in SB than in SA galaxies.
Grouchy et al. (2010) used a sample of 44 galaxies (26 non-barred or weakly barred, and 18 strongly barred) to show that the de-projected axis ratios of inner rings correlate with the tangential-to-radial forcing (), locally estimated at the ring SMA, regardless of whether the host galaxy is barred or not. This would indicate that non-axisymmetries – including bars, ovals, and also spiral arms – are responsible for the shaping of the rings. Previously, Buta (2002) and Buta et al. (2007) had reported that galaxies presenting similar values of can show different values of . Highly elliptical rings were mainly found for strong bars.
In this work we have taken a step forward by using a factor of approximately ten bigger sample and by adding ringlenses to the analysis. In Sect. 5 we confirmed the result by Grouchy et al. (2010): we found a stronger correlation between the intrinsic axis ratio of rings and evaluated at the ring’s SMA than between and . However, the trends present a large scatter, which can be understood as a consequence of a decoupled evolution of the bar potential since ring formation.
Interestingly, we found that the distribution of as a function of is the same for barred and non-barred galaxies: this reinforces the idea that the ring shapes are, to a certain extent, controlled by non-asymmetries that dominate the Fourier amplitude spectrum at the ring radius, rather than by exclusively the bar-induced perturbation strength. However, we also report that inner ringed galaxies with the largest values are systematically barred (only are non-barred): this indicates that large gravitational torques at can only be induced by stellar bars. In these galaxies in particular, rings of different ellipticities are detected regardless of the large gravitational torques.
Curiously enough, we showed that for a given bin, ringlenses tend to be rounder than normal rings. This may be linked to the dissolution of rings into ringlenses (e.g. Comerón, 2013)161616 Under the assumption of a resonant origin, Comerón (2013) estimated 200 Myr to be the lower bound for the dissolution of rings. . Ringlenses are an intermediate type between rings and lenses (e.g. Laurikainen et al., 2011).
When the estimated radial forces exerted by the dark matter halo are included in the calculations (Sect. 5.4), the trend between the ring shape and the non-axisymmetric torques () becomes somewhat weaker. Before strong final conclusions can be drawn, this needs to be further tested with proper estimates of the dark matter halo profiles from decompositions of observed rotation curves for a large sample of galaxies171717 For a sub-sample of galaxies, Díaz-García et al. (2016b) showed that the resulting rotation curve decomposition models more or less match observed rotation curves in the literature (from Daigle et al., 2006; Dicaire et al., 2008; de Blok et al., 2008). Our models indicate that only of the discs in our sample are maximal according to the criterion by Sackett (1997), and the effect of the halo dilution on the bar forcing is larger for fainter systems (). , which is beyond the scope of this paper.
On the other hand, if dark matter does not exist, the correction of radial forces for the halo dilution is unjustified. In general, secular evolution is poorly understood in the framework of the modified Newtonian dynamics (MOND; Milgrom, 1983). It is interesting that simulation models of disc galaxies in a MONDian framework by Tiret & Combes (2008)181818MONDian bars form very early (it takes Gyr to form a bar with ), and then weaken in the late stages of the run (Combes, 2016). Unlike when dark matter halos are present, the pattern speed of these bars is not found to decline, in agreement with observational work in the literature (e.g. Rautiainen et al., 2005; Aguerri et al., 2015). show that gas is more efficiently redistributed by bars as compared to CDM (see also Combes, 2016): this could favour ring formation.
We conclude that the amplitude of non-axisymmetries might indeed have an effect controlling the ring shape. However, this effect is not as strong as expected from simulations.
8.5.3 Predictions from the manifold theory
The manifold theory (e.g. Romero-Gómez et al., 2006; Patsis, 2006; Voglis et al., 2006; Romero-Gómez et al., 2007; Athanassoula et al., 2009b) makes specific predictions for the intrinsic shape of rings (, , , and also pseudo-rings) and spirals, and their dependence on bar structural properties. Athanassoula et al. (2009a) showed a relation in their models between the bar-induced perturbation strength in the corotation region, measured by evaluating the tangential-to-radial forces at the point, and the axial ratio of the outer and rings (see their Fig. 7). The same trend is expected for inner rings (see their Fig. 9). They also found that the outer ring axial ratio correlates with .
Qualitatively, the expectations from the manifold theory are in agreement with the trends discussed in the previous Sect. 8.5.2, but the scatter is larger for the observations. Also, we note that the conclusions on outer rings by Athanassoula et al. (2009a) are based on the type, while we use all types of rings and pseudo-rings in our analysis.
Athanassoula et al. (2009a) also reported a positive trend between the ratio of outer-to-inner ring SMAs and the non-axisymmetric perturbation strength (see their Fig. 10). In Sect. 6 we also assessed this relation (Fig. 10), but could not confirm this prediction. In fact, we found a weak trend of decreasing outer-to-inner ring SMA ratio with increasing bar strength, which is mainly driven by the lower values found for the most massive galaxies. We confirmed that the same trend was maintained when using , or when evaluating at the bar end (which is closer to the point).
The fraction of or rings in our sample is not large enough to perform a statistically significant analysis (the likely reason for the low number of such features is the bias towards extreme late-type galaxies in the S4G sample). However, for direct comparison with the models discussed in this section, we checked that the tendencies are the same when only these types of rings are used.
We conclude that the manifold origin of most extragalactic rings in the S4G cannot be confirmed based on the ratio outer-to-inner ring SMAs. To further test the manifold theory, we will probe the expected dependence between spiral pitch angles and bar strength (Athanassoula et al., 2009a) in future papers. Recent observational work by Font et al. (2019) does not confirm this expectation.
8.6 Large inner rings in late-type galaxies
In Sect. 4 we showed that inner ring size normalised by increases with increasing T-type for (Sbc) on average191919 We checked that this trend holds true when the ring sizes are normalised by the disc scale length () measured by Salo et al. (2015) (see also Fig. 10 in Herrera-Endoqui et al., 2015). Thus, this is not an artificial effect caused by the lower central extrapolated surface brightness of discs in late-type galaxies (see e.g. Fig. 5 in Díaz-García et al., 2016a). . Also, bars in late-type faint galaxies ( or ) have been found to be unexpectedly long relative to their underlying discs (Díaz-García et al., 2016b; Erwin, 2018; Font et al., 2019).
In addition, fainter galaxies have been found to host larger inner rings and ringlenses relative to the bar, as shown by Herrera-Endoqui et al. (2015). They pointed out that this result is consistent with the 2-D sticky particle simulations of the weakly barred galaxy IC 4214 by Salo et al. (1999), who showed that inner rings increased in size by when the dark matter halo component was enhanced.
In fact, Díaz-García et al. (2016b, c) showed a remarkably higher dark halo-to-stellar mass ratio for the faint galaxies with , which probably causes them to have distinct disc stability properties. However, we checked and confirmed that the disc-relative sizes of inner and outer rings are not controlled by (or ) (see Appendix. B). Further investigation is therefore needed to understand the physics governing the observational trends for rings in late-type faint galaxies.
8.7 No striking differences in disc global properties for ringed and/or barred galaxies
We have applied self-organising maps in its most natural form, that is, for data analysis and visualisation (Sect. 7; we are not doing modelling or automated classification of galaxies). This is motivated by the difficulty of unravelling the driving mechanisms for the secular evolution of disc galaxies when multiple parameters come into play. We have trained a SOM with as many internal and external fundamental parameters as possible from the S4G, and looked for clusters associated to known galaxy classes. Post-labelling of winning classes was done based on the presence of rings.
SOM confirms that ringless galaxies are the dominant class for the neurons representing faint, blue, gas-rich, star-forming, and dark-matter-dominated objects. This is not surprising, since these units are mainly probing late-type spirals, irregular, and Magellanic galaxies that are known to lack rings and ringlenses (e.g. Comerón et al., 2014; Herrera-Endoqui et al., 2015).
However, for the redder or more massive systems (early-type galaxies), none of the used measurements unequivocally determines whether a galaxy should host an inner or an outer ring, including the gas fraction, [UV]-[near-IR] colour, or star formation rate. Regarding the latter parameter, many rings present recent star formation and host young stars (e.g. Buta & Crocker, 1993; Knapen et al., 1995; Knapen, 2005), but rings lacking star formation activity have also been found (e.g. Buta, 1991; Comerón, 2013).
Likewise, the parameters used for the SOM training, including the environment, do not seem to be the main driver for the formation of stellar bars. We checked the post-labelling of the SOM for barred and non-barred galaxies, finding no clear clustering. This is in agreement with recent work in the literature reporting no strong dependence of the frequency of bars on the properties of the discs that harbour them (e.g. Díaz-García et al., 2016b; Erwin, 2018).
It is intriguing that the galaxies hosting rings or bars do not present remarkable differences (with respect to non-ringed or non-barred galaxies) in their global internal or external properties for 202020Discs in barred galaxies have been found to have, on average, larger scale lengths and fainter extrapolated surface brightness than their non-barred counterparts (Sánchez-Janssen & Gadotti, 2013; Díaz-García et al., 2016a). This provides possible observational evidence for the role played by bars in the radial spread of the disc (e.g. Athanassoula & Misiriotis, 2002; Minchev et al., 2011; Athanassoula, 2012), rather than constraints on the kind of galaxies that are prone for developing a bar.. This is in conflict with the clear predictions made with the aid of body simulations (even in a cosmological framework), whose outputs resemble S0-Sc galaxies. According to numerical models, secular evolution (and hence resonance ring formation) is essentially determined by the prominence and properties212121For instance, bar-induced formation of rings requires an efficient transfer of angular momentum, which can be impeded in dynamically hot discs and haloes (e.g. Sheth et al., 2012, and references therein). of bulges, discs, dark matter haloes, or the fraction of gas, as well as by the dynamical interaction between these components (e.g. Athanassoula, 2013, and references therein) or by the environment (e.g. Peschken & Łokas, 2019).
Naturally, the tension between observations and simulations can be a problem arising from data contamination and lack of precision on our measurements. On the other hand, our analysis does not include other important parameters for bar and/or ring formation such as the triaxiality and inner profile of the dark matter halo, the availability and flow rate of extragalactic gas, the radius of the corotation resonance relative to the disc radius, or the age of the pattern, which are hard to measure reliably for large samples. Last but not least, SOM is not necessarily the only or the optimal ML algorithm for our purposes: we encourage a similar analysis to be done elsewhere by applying supervised machine learning algorithms (e.g. random forest) to S4G data.
We have shown that SOMs are a powerful tool for the analysis of the S4G survey and the visualisation of the typical disc properties that characterise ringed galaxies. In general, we do not find well-defined clusters that indicate the presence of different families of galaxies based on the 20 parameters used for the training. We conclude that there is a lack of definite observational constraints on the types of discs that are prone to ring and bar formation.
9 Summary
We used a sample of the 1320 not highly inclined disc galaxies () in the Spitzer Survey of Stellar Structure in Galaxies (S4G; Sheth et al., 2010) to analyse the frequency of rings as a function of total stellar mass in barred and non-barred galaxies in the local Universe. We used the morphological classifications of galactic stellar substructures by Buta et al. (2015).
We characterised the dimensions of rings (sizes and axial ratios) for galaxies using measurements from Herrera-Endoqui et al. (2015), complementing previous analyses in the literature (e.g. Laurikainen et al., 2011; Comerón et al., 2014). We studied the dependence of the properties and fraction of rings on the bar-induced perturbation strength. For the latter, we used measurements of gravitational tangential-to-radial torques, bar ellipticities, and Fourier density amplitudes from Díaz-García et al. (2016b).
Part of the statistical analysis is done with the aid of unsupervised machine learning techniques: we trained self-organising maps (SOMs; Kohonen, 2001) by using the Matlab SOM Toolbox (Vesanto et al., 2000). Prototypes are fitted on measurements of 20 global galaxy parameters in the S4G. This includes the total stellar mass, gas fraction, SFR, bulge prominence, [UV]-[near-IR] colours, dark matter content, or torques and density of nearby galaxies. We checked the post-labelling of the trained neural network to see if different families of galaxies are clustered.
The main results of this paper are the following:
-
•
The fraction of rings increases with increasing total stellar mass (Fig. 1 and Tables 1 and 2). It peaks for . The fraction of inner (outer) rings in barred galaxies is () times larger than in their non-barred counterparts. The differences are bigger for larger , especially for outer features. These numbers go down by if a more complete (but smaller) volume-limited (distances Mpc, instead of Mpc) sample is used (Fig. 13 and Tables 3 and 4).
-
•
We confirm previous results showing that ring sizes, relative to the disc, are larger amongst early-type spirals, compared to intermediate type spirals (Fig. 2). Inner ring sizes increase with increasing Hubble stage for .
-
•
The mean distributions of inner and outer ring sizes, and their de-projected axial ratios, are the same for barred and non-barred galaxies (Fig. 3). In addition, () of the disc galaxies in the S4G hosting inner (outer) rings are not barred. These facts either rule out a strong interplay between rings and bars, or support a scenario in which bars dissolve (e.g. Kormendy, 1979) after ring formation. The latter is, however, not supported by the majority of recent simulations (e.g. Athanassoula et al., 2013, and references therein).
-
•
The sizes of inner rings are correlated with bar strength (Fig. 6). We interpret this as a consequence of the concurrent growth of bars (whose strength and length increase in time) and inner rings, as the 1/4 ultraharmonic resonance moves outwards in the disc while the pattern speed decreases.
-
•
Outer ring sizes do not correlate with bar strength (Fig. 6), which could be due to the larger timescales required for their formation from the gas redistributed by bars, whose potential might have changed in time.
-
•
Amongst barred galaxies, the fraction of inner and outer rings increases with the bar density amplitudes, possibly supporting the role of bars in ring formation (Figs. 4 and 5). However, this might not imply bar-ring causality, but rather arises from a more fundamental dependence of both ring frequency and bar strength on the stellar mass of the host galaxy. In addition, this relation is not so clear with other proxies of bar strength.
-
•
The fraction of inner rings does not peak for weakly barred galaxies when quantitative measurements of the bar strength are used (Fig. 4), questioning previous results in the literature that were based on the galaxy family (Laurikainen et al., 2011; Comerón et al., 2014; Herrera-Endoqui et al., 2015; Buta, 2017a).
-
•
The presence of inner and outer rings and/or stellar bars amongst early-type galaxies is not unambiguously determined by any of the parameters used to train the SOM (Figs. 11, 12, 15, and 16). We confirm, using SOM, that rings are rare in blue, faint, gas-rich, star-forming, dark-matter-dominated, and bulgeless galaxies.
-
•
On average, the intrinsic ellipticity of rings increases with increasing bar strength () (Fig. 7). However, the trend is weaker than expected from numerical models (see e.g. Sellwood & Wilkinson, 1993): this could be due to the different timescales that characterise the dynamical evolution of rings and bars.
-
•
A stronger correlation is found between the ring axis ratio and the tangential-to-radial forces evaluated at the ring SMA, for both barred and non-barred galaxies, in agreement with Grouchy et al. (2010) (our sample is approximately ten times bigger). The latter becomes somewhat weaker when the non-axisymmetric torques are corrected for the halo contribution to the radial force field (Fig. 8).
-
•
We do not find a positive correlation between the ratio of outer-to-inner ring semi-major axes and the strength of non-axisymmetries (Fig. 10), as expected from a manifold origin of rings (Athanassoula et al., 2009a). The distribution of peaks at the expected value for a resonant origin of rings in galaxies with flat rotation curves (Fig. 9).
Acknowledgements.
We acknowledge financial support from the European Union’s Horizon 2020 research and innovation programme under Marie Skodowska-Curie grant agreement No 721463 to the SUNDIAL ITN network, and from the Spanish Ministry of Economy and Competitiveness (MINECO) under grant number AYA2016-76219-P. S.D.G. acknowledges the financial support from the visitor and mobility program of the Finnish Centre for Astronomy with ESO (FINCA), funded by the Academy of Finland grant nr 306531. J.H.K. acknowledges support from the Fundación BBVA under its 2017 programme of assistance to scientific research groups, for the project ”Using machine-learning techniques to drag galaxies from the noise in deep imaging”, and from the Leverhulme Trust through the award of a Visiting Professorship at LJMU. H.S. acknowledges financial support from the Academy of Finland (grant no: 297738). We thank the S4G team for their work on the different pipelines and the data release. We thank Sébastien Comerón and Martín Herrera-Endoqui for valuable comments on the manuscript, and Aleke Nolte for useful discussions. We thank Alexandre Bouquin for providing us with the tabulated total integrated GALEX FUV and NUV magnitudes used in this work. We thank the organisers of the SUNDIAL Training School ”Applications of Computer Science Techniques in Galaxy Science” (February 2018, Groningen) for encouraging, and illustrating with examples, the application of SOM to S4G data. We thank the anonymous referee for excellent comments that improved this paper. Facilities: Spitzer (IRAC).References
- Aguerri et al. (2015) Aguerri, J. A. L., Méndez-Abreu, J., Falcón-Barroso, J., et al. 2015, A&A, 576, A102
- Athanassoula (1984) Athanassoula, E. 1984, Physics Reports, 114, 321
- Athanassoula (2003) Athanassoula, E. 2003, MNRAS, 341, 1179
- Athanassoula (2012) Athanassoula, E. 2012, MNRAS, 426, L46
- Athanassoula (2013) Athanassoula, E. 2013, Bars and secular evolution in disk galaxies: Theoretical input, ed. J. Falcón-Barroso & J. H. Knapen, 305
- Athanassoula et al. (1982) Athanassoula, E., Bosma, A., Creze, M., & Schwarz, M. P. 1982, A&A, 107, 101
- Athanassoula et al. (2013) Athanassoula, E., Machado, R. E. G., & Rodionov, S. A. 2013, MNRAS, 429, 1949
- Athanassoula & Misiriotis (2002) Athanassoula, E. & Misiriotis, A. 2002, MNRAS, 330, 35
- Athanassoula et al. (2009a) Athanassoula, E., Romero-Gómez, M., Bosma, A., & Masdemont, J. J. 2009a, MNRAS, 400, 1706
- Athanassoula et al. (2009b) Athanassoula, E., Romero-Gómez, M., & Masdemont, J. J. 2009b, MNRAS, 394, 67
- Berentzen et al. (2003) Berentzen, I., Athanassoula, E., Heller, C. H., & Fricke, K. J. 2003, MNRAS, 341, 343
- Binney & Tremaine (1987) Binney, J. & Tremaine, S. 1987, Galactic dynamics
- Block et al. (2001) Block, D. L., Puerari, I., Knapen, J. H., et al. 2001, A&A, 375, 761
- Bouquin et al. (2018) Bouquin, A. Y. K., Gil de Paz, A., Muñoz-Mateos, J. C., et al. 2018, ApJS, 234, 18
- Bournaud & Combes (2002) Bournaud, F. & Combes, F. 2002, A&A, 392, 83
- Bournaud et al. (2005) Bournaud, F., Combes, F., & Semelin, B. 2005, MNRAS, 364, L18
- Buta (1991) Buta, R. 1991, ApJ, 370, 130
- Buta (1995) Buta, R. 1995, ApJS, 96, 39
- Buta (2002) Buta, R. 2002, in Astronomical Society of the Pacific Conference Series, Vol. 275, Disks of Galaxies: Kinematics, Dynamics and Peturbations, ed. E. Athanassoula, A. Bosma, & R. Mujica, 185–192
- Buta & Block (2001) Buta, R. & Block, D. L. 2001, ApJ, 550, 243
- Buta & Combes (1996) Buta, R. & Combes, F. 1996, Fundamentals of Cosmic Physics, 17, 95
- Buta & Crocker (1993) Buta, R. & Crocker, D. A. 1993, AJ, 105, 1344
- Buta et al. (2004) Buta, R., Laurikainen, E., & Salo, H. 2004, AJ, 127, 279
- Buta (2017a) Buta, R. J. 2017a, MNRAS, 471, 4027
- Buta (2017b) Buta, R. J. 2017b, MNRAS, 470, 3819
- Buta et al. (2007) Buta, R. J., Corwin, H. G., & Odewahn, S. C. 2007, The de Vaucouleurs Atlas of Galaxies (Cambridge University Press)
- Buta et al. (2015) Buta, R. J., Sheth, K., Athanassoula, E., et al. 2015, ApJS, 217, 32
- Combes (2016) Combes, F. 2016, in Astrophysics and Space Science Library, Vol. 418, Galactic Bulges, ed. E. Laurikainen, R. Peletier, and D. Gadotti (Springer International Publishing), 413
- Combes & Sanders (1981) Combes, F. & Sanders, R. H. 1981, A&A, 96, 164
- Comerón (2013) Comerón, S. 2013, A&A, 555, L4
- Comerón et al. (2010) Comerón, S., Knapen, J. H., Beckman, J. E., et al. 2010, MNRAS, 402, 2462
- Comerón et al. (2014) Comerón, S., Salo, H., Laurikainen, E., et al. 2014, A&A, 562, A121
- Dahari (1984) Dahari, O. 1984, AJ, 89, 966
- Daigle et al. (2006) Daigle, O., Carignan, C., Amram, P., et al. 2006, MNRAS, 367, 469
- de Blok et al. (2008) de Blok, W. J. G., Walter, F., Brinks, E., et al. 2008, AJ, 136, 2648
- de Vaucouleurs (1959) de Vaucouleurs, G. 1959, Handbuch der Physik, 53, 275
- de Vaucouleurs et al. (1991) de Vaucouleurs, G., de Vaucouleurs, A., Corwin, Jr., H. G., et al. 1991, Third Reference Catalogue of Bright Galaxies. Volume I.
- de Vaucouleurs et al. (1964) de Vaucouleurs, G. H., de Vaucouleurs, A., & Shapley, H. 1964, Reference catalogue of bright galaxies
- Díaz-García et al. (2016a) Díaz-García, S., Salo, H., & Laurikainen, E. 2016a, A&A, 596, A84
- Díaz-García et al. (2016b) Díaz-García, S., Salo, H., Laurikainen, E., & Herrera-Endoqui, M. 2016b, A&A, 587, A160
- Díaz-García et al. (2016c) Díaz-García, S., Salo, H., Laurikainen, E., & Leaman, R. 2016c, ArXiv e-prints [arXiv:1611.01844]
- Dicaire et al. (2008) Dicaire, I., Carignan, C., Amram, P., et al. 2008, MNRAS, 385, 553
- Durbala et al. (2009) Durbala, A., Buta, R., Sulentic, J. W., & Verdes-Montenegro, L. 2009, MNRAS, 397, 1756
- Duus & Freeman (1975) Duus, A. & Freeman, K. C. 1975, in La Dynamique des galaxies spirales, ed. L. Weliachew, Vol. 241, 419
- Efstathiou et al. (1982) Efstathiou, G., Lake, G., & Negroponte, J. 1982, MNRAS, 199, 1069
- Elmegreen et al. (2007) Elmegreen, B. G., Elmegreen, D. M., Knapen, J. H., et al. 2007, ApJ, 670, L97
- Elmegreen et al. (1992) Elmegreen, D. M., Elmegreen, B. G., Combes, F., & Bellin, A. D. 1992, A&A, 257, 17
- Erroz-Ferrer et al. (2016) Erroz-Ferrer, S., Knapen, J. H., Leaman, R., et al. 2016, MNRAS, 458, 1199
- Erwin (2018) Erwin, P. 2018, MNRAS, 474, 5372
- Erwin et al. (2005) Erwin, P., Beckman, J. E., & Pohlen, M. 2005, ApJ, 626, L81
- Eskew et al. (2012) Eskew, M., Zaritsky, D., & Meidt, S. 2012, AJ, 143, 139
- Fazio et al. (2004) Fazio, G. G., Hora, J. L., Allen, L. E., et al. 2004, ApJS, 154, 10
- Font et al. (2019) Font, J., Beckman, J. E., James, P. A., & Patsis, P. A. 2019, MNRAS, 482, 5362
- Font et al. (2017) Font, J., Beckman, J. E., Martínez-Valpuesta, I., et al. 2017, ApJ, 835, 279
- Gadotti (2011) Gadotti, D. A. 2011, MNRAS, 415, 3308
- Grouchy et al. (2010) Grouchy, R. D., Buta, R. J., Salo, H., & Laurikainen, E. 2010, AJ, 139, 2465
- Gültekin et al. (2009) Gültekin, K., Richstone, D. O., Gebhardt, K., et al. 2009, ApJ, 698, 198
- Gunn et al. (2006) Gunn, J. E., Siegmund, W. A., Mannery, E. J., et al. 2006, AJ, 131, 2332
- Hendry et al. (1997) Hendry, M. A., Persic, M., & Salucci, P. 1997, in Astronomical Society of the Pacific Conference Series, Vol. 117, Dark and Visible Matter in Galaxies and Cosmological Implications, ed. M. Persic & P. Salucci, 198
- Herrera-Endoqui et al. (2015) Herrera-Endoqui, M., Díaz-García, S., Laurikainen, E., & Salo, H. 2015, A&A, 582, A86
- Hohl (1971) Hohl, F. 1971, ApJ, 168, 343
- Knapen (2005) Knapen, J. H. 2005, A&A, 429, 141
- Knapen et al. (1995) Knapen, J. H., Beckman, J. E., Heller, C. H., Shlosman, I., & de Jong, R. S. 1995, ApJ, 454, 623
- Knapen & James (2009) Knapen, J. H. & James, P. A. 2009, ApJ, 698, 1437
- Knapen et al. (2000) Knapen, J. H., Shlosman, I., & Peletier, R. F. 2000, ApJ, 529, 93
- Kohonen (2001) Kohonen, T. 2001, Springer Series in Information Sciences, Springer, 3rd edition, Vol. 30, Self-Organizing Maps
- Kormendy (1979) Kormendy, J. 1979, ApJ, 227, 714
- Kormendy (2013) Kormendy, J. 2013, Secular Evolution in Disk Galaxies, ed. J. Falcón-Barroso & J. H. Knapen, 1
- Laine et al. (2014) Laine, J., Laurikainen, E., Salo, H., et al. 2014, MNRAS, 441, 1992
- Larsen & Richtler (2000) Larsen, S. S. & Richtler, T. 2000, A&A, 354, 836
- Laurikainen & Salo (2002) Laurikainen, E. & Salo, H. 2002, MNRAS, 337, 1118
- Laurikainen et al. (2004) Laurikainen, E., Salo, H., & Buta, R. 2004, ApJ, 607, 103
- Laurikainen et al. (2007) Laurikainen, E., Salo, H., Buta, R., & Knapen, J. H. 2007, MNRAS, 381, 401
- Laurikainen et al. (2011) Laurikainen, E., Salo, H., Buta, R., & Knapen, J. H. 2011, MNRAS, 418, 1452
- Laurikainen et al. (2002) Laurikainen, E., Salo, H., & Rautiainen, P. 2002, MNRAS, 331, 880
- Lelli et al. (2013) Lelli, F., Fraternali, F., & Verheijen, M. 2013, MNRAS, 433, L30
- Lynden-Bell & Kalnajs (1972) Lynden-Bell, D. & Kalnajs, A. J. 1972, MNRAS, 157, 1
- Lynds & Toomre (1976) Lynds, R. & Toomre, A. 1976, ApJ, 209, 382
- Marochnik et al. (1972) Marochnik, L. S., Mishurov, Y. N., & Suchkov, A. A. 1972, Ap&SS, 19, 285
- Martinez-Valpuesta et al. (2006) Martinez-Valpuesta, I., Shlosman, I., & Heller, C. 2006, ApJ, 637, 214
- Milgrom (1983) Milgrom, M. 1983, ApJ, 270, 365
- Miller et al. (1970) Miller, R. H., Prendergast, K. H., & Quirk, W. J. 1970, ApJ, 161, 903
- Minchev et al. (2011) Minchev, I., Famaey, B., Combes, F., et al. 2011, A&A, 527, A147
- Muñoz-Mateos et al. (2015) Muñoz-Mateos, J. C., Sheth, K., Regan, M., et al. 2015, ApJS, 219, 3
- Patsis (2006) Patsis, P. A. 2006, MNRAS, 369, L56
- Pérez et al. (2012) Pérez, I., Aguerri, J. A. L., & Méndez-Abreu, J. 2012, A&A, 540, A103
- Persic et al. (1996) Persic, M., Salucci, P., & Stel, F. 1996, MNRAS, 281, 27
- Peschken & Łokas (2019) Peschken, N. & Łokas, E. L. 2019, MNRAS, 483, 2721
- Querejeta et al. (2015) Querejeta, M., Meidt, S. E., Schinnerer, E., et al. 2015, ApJS, 219, 5
- Raha et al. (1991) Raha, N., Sellwood, J. A., James, R. A., & Kahn, F. D. 1991, Nature, 352, 411
- Rautiainen & Salo (2000) Rautiainen, P. & Salo, H. 2000, A&A, 362, 465
- Rautiainen et al. (2005) Rautiainen, P., Salo, H., & Laurikainen, E. 2005, ApJ, 631, L129
- Rautiainen et al. (2008) Rautiainen, P., Salo, H., & Laurikainen, E. 2008, MNRAS, 388, 1803
- Romero-Gómez et al. (2007) Romero-Gómez, M., Athanassoula, E., Masdemont, J. J., & García-Gómez, C. 2007, A&A, 472, 63
- Romero-Gómez et al. (2006) Romero-Gómez, M., Masdemont, J. J., Athanassoula, E., & García-Gómez, C. 2006, A&A, 453, 39
- Sackett (1997) Sackett, P. D. 1997, ApJ, 483, 103
- Saha & Elmegreen (2018) Saha, K. & Elmegreen, B. 2018, ApJ, 858, 24
- Salo & Laurikainen (2017) Salo, H. & Laurikainen, E. 2017, ApJ, 835, 252
- Salo et al. (2015) Salo, H., Laurikainen, E., Laine, J., et al. 2015, ApJS, 219, 4
- Salo et al. (1999) Salo, H., Rautiainen, P., Buta, R., et al. 1999, AJ, 117, 792
- Sánchez-Janssen & Gadotti (2013) Sánchez-Janssen, R. & Gadotti, D. A. 2013, MNRAS, 432, L56
- Schommer & Sullivan (1976) Schommer, R. A. & Sullivan, III, W. T. 1976, Astrophysical Letters, 17, 191
- Schwarz (1981) Schwarz, M. P. 1981, ApJ, 247, 77
- Schwarz (1984) Schwarz, M. P. 1984, MNRAS, 209, 93
- Schweizer et al. (1983) Schweizer, F., Whitmore, B. C., & Rubin, V. C. 1983, AJ, 88, 909
- Sellwood (1980) Sellwood, J. A. 1980, A&A, 89, 296
- Sellwood (2000) Sellwood, J. A. 2000, in Astronomical Society of the Pacific Conference Series, Vol. 197, Dynamics of Galaxies: from the Early Universe to the Present, ed. F. Combes, G. A. Mamon, & V. Charmandaris, 3
- Sellwood & Wilkinson (1993) Sellwood, J. A. & Wilkinson, A. 1993, Reports on Progress in Physics, 56, 173
- Shen & Li (2016) Shen, J. & Li, Z.-Y. 2016, in Astrophysics and Space Science Library, Vol. 418, Galactic Bulges, ed. E. Laurikainen, R. Peletier, and D. Gadotti (Springer International Publishing), 233
- Shen & Sellwood (2004) Shen, J. & Sellwood, J. A. 2004, ApJ, 604, 614
- Sheth (2013) Sheth, K. 2013, in American Astronomical Society Meeting Abstracts, Vol. 221, American Astronomical Society Meeting Abstracts 221, 230.01
- Sheth et al. (2012) Sheth, K., Melbourne, J., Elmegreen, D. M., et al. 2012, ApJ, 758, 136
- Sheth et al. (2010) Sheth, K., Regan, M., Hinz, J. L., et al. 2010, PASP, 122, 1397
- Tiret & Combes (2008) Tiret, O. & Combes, F. 2008, A&A, 483, 719
- Toomre (1977) Toomre, A. 1977, ARA&A, 15, 437
- Toomre (1981) Toomre, A. 1981, in Structure and Evolution of Normal Galaxies, ed. S. M. Fall & D. Lynden-Bell, 111–136
- Tsoutsis et al. (2008) Tsoutsis, P., Efthymiopoulos, C., & Voglis, N. 2008, MNRAS, 387, 1264
- Tully & Fisher (1977) Tully, R. B. & Fisher, J. R. 1977, A&A, 54, 661
- Verley et al. (2007) Verley, S., Leon, S., Verdes-Montenegro, L., et al. 2007, A&A, 472, 121
- Vesanto et al. (2000) Vesanto, J., Himberg, J., Alhoniemi, E., & Parhankangas, J. 2000, SOM Toolbox for Matlab 5, in Report A57, SOM Toolbox team, Helsinki University of Technology, Finland, 1-60
- Villa-Vargas et al. (2010) Villa-Vargas, J., Shlosman, I., & Heller, C. 2010, ApJ, 719, 1470
- Voglis et al. (2006) Voglis, N., Tsoutsis, P., & Efthymiopoulos, C. 2006, MNRAS, 373, 280
- Watkins et al. (2019) Watkins, A. E., Laine, J., Comerón, S., Janz, J., & Salo, H. 2019, arXiv e-prints [arXiv:1903.09384]
- Werner et al. (2004) Werner, M. W., Roellig, T. L., Low, F. J., et al. 2004, ApJS, 154, 1
- Whyte et al. (2002) Whyte, L. F., Abraham, R. G., Merrifield, M. R., et al. 2002, MNRAS, 336, 1281
- Willett et al. (2013) Willett, K. W., Lintott, C. J., Bamford, S. P., et al. 2013, MNRAS, 435, 2835
Appendix A Ring fraction for a volume-limited sub-sample improved in completeness
In this paper we have used an inclination-, magnitude-, and diameter-limited sample of 1320 galaxies (Sect. 2.3), which is not strictly complete in any quantitative sense. Here, we analyse again the fraction of inner and outer rings (as done in Sect. 3) in a volume-limited sub-sample of 720 not highly inclined galaxies (i.e. smaller size), which is improved in completeness. This is done by imposing the more restrictive distance (d Mpc) and stellar-mass ( ) limits advocated by Erwin (2018) (see his Fig. 1). By means of this volume cut, we also make sure that we do not miss any inner rings due to their smaller angular sizes amongst the most distant galaxies.
The trends for are practically the same as reported in Sect. 3 when a more complete volume-limited sub-sample is used (Fig. 13). Ring fractions are listed in Tables 3 and 4. Specifically, of the non-barred galaxies in this new sub-sample host outer rings, in contrast to the of barred ones. Barred galaxies host inner rings in of the cases, which is larger than the of non-barred galaxies hosting them. Thus, the fraction of inner (outer) rings in barred galaxies is () larger than in their non-barred counterparts.
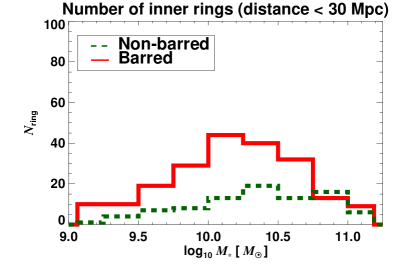
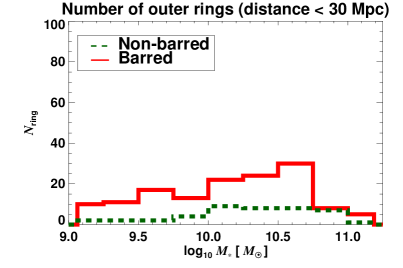
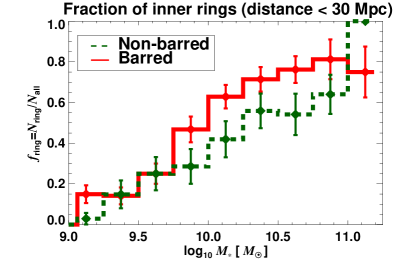
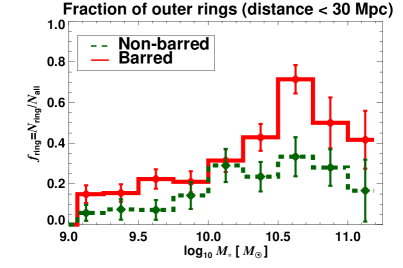
| Inner ring fraction (d ¡ 30 Mpc): | All | Barred | Non-barred |
|---|---|---|---|
| 12.5 2.3 (200) | 14.5 3.0 (138) | 8.1 3.5 ( 62) | |
| 32.6 3.4 (193) | 35.0 4.1 (137) | 26.8 5.9 ( 56) | |
| 60.7 3.5 (191) | 66.7 4.2 (126) | 49.2 6.2 ( 65) | |
| 69.2 4.5 (107) | 77.6 5.5 ( 58) | 59.2 7.0 ( 49) | |
| 78.9 9.4 ( 19) | 69.2 12.8 ( 13) | 100.0 0.0 ( 6) |
| Outer ring fraction (d ¡ 30 Mpc): | All | Barred | Non-barred |
|---|---|---|---|
| 12.5 2.3 (200) | 15.2 3.1 (138) | 6.5 3.1 ( 62) | |
| 18.7 2.8 (193) | 21.9 3.5 (137) | 10.7 4.1 ( 56) | |
| 33.0 3.4 (191) | 36.5 4.3 (126) | 26.2 5.5 ( 65) | |
| 49.5 4.8 (107) | 65.5 6.2 ( 58) | 30.6 6.6 ( 49) | |
| 36.8 11.1 ( 19) | 46.2 13.8 ( 13) | 16.7 15.2 ( 6) |
Appendix B Ring dimensions as a function of galaxy mass
For a comparison of ring dimensions as a function of total stellar mass, the reader is referred to Fig. 12 in Herrera-Endoqui et al. (2015) and Fig. 14 in this section. We also analyse ring dimensions versus (right panels). As expected, ring sizes in physical size increase with increasing (upper left panel). Ring sizes normalised to disc size and axis ratios are not strongly controlled by the total stellar mass or the relative content of dark matter of the host galaxy. We encourage such results to be tested in simulations222222For the normalisation of bar lengths by disc sizes in simulations, we note that roughly corresponds to the isophote tracing the stellar density pc-2 (Muñoz-Mateos et al. 2015)..
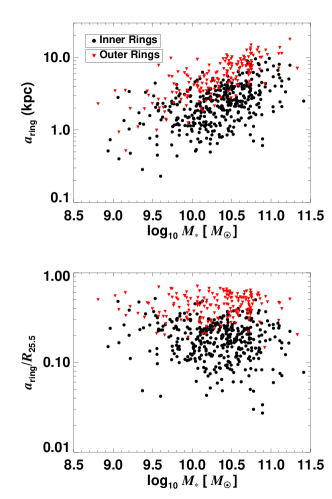
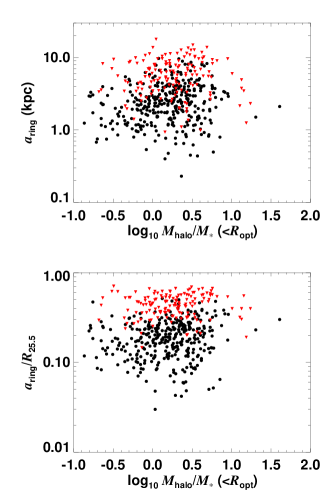
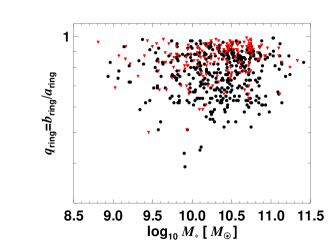
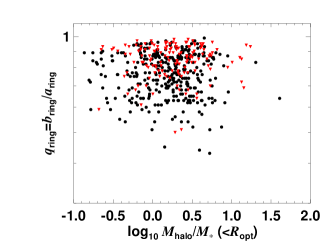
Appendix C Frequency of outer rings as seen with SOM
In Fig. 15 we show the output of the SOM training on S4G parameters, with the post-labelling done based on the presence (”R”) or absence (”0”) of outer rings (we show the remainder of the components that did not appear in Fig. 11; see Sect. 7.3 for further details). Only the uppermost neurons of the SOM, tracing the most massive or reddest galaxies, are typically best matching units for data of outer ringed galaxies.
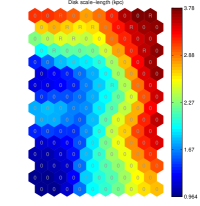
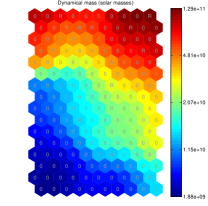
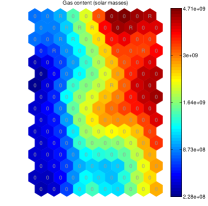
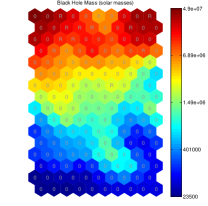
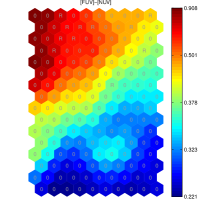
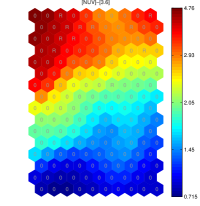
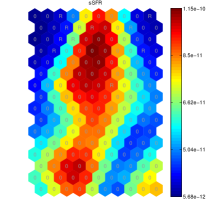
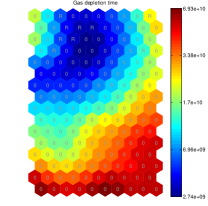
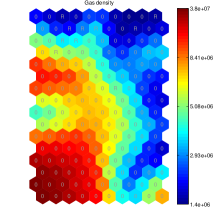
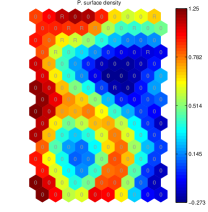
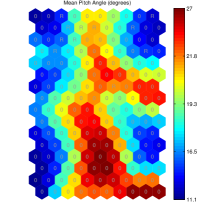
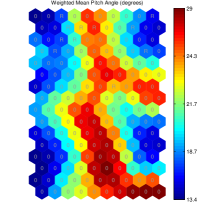
Appendix D Post-labelling of SOM based on morphological types and on the presence of a bar
In the left panel of Fig. 16 we show the output of the SOM training (same setup as in Fig. 11) with the post-labelling done based on the Hubble stages () determined by Buta et al. (2015) (we note that was not used in the training). For a quick visualisation we also show the [FUV]-[3.6] component plane (middle panel). We consider the following families:
-
1.
Class ”0”: Lenticular galaxies (S0s). .
-
2.
Class ”1”: Early-type spirals. .
-
3.
Class ”2”: Intermediate-type spirals. .
-
4.
Class ”3”: Late-type spirals. .
-
5.
Class ”4”: Magellanic and irregulars galaxies. .
Late-type spirals, Magellanic, and irregular galaxies (classes ”3” and ”4”) dominate the lower part of the SOM (hitting blue colours and faint galaxies). Early-types galaxies () appear in the upper part, and S0s are labelled in the units with reddest colours (clustering in the upper left corner of the SOM). When the post-labelling is done based on the presence of bars (right panel in Fig. 16), we find that barred and non-barred galaxies appear evenly distributed across the SOM.