Present address: College of Physics and Optoelectronic Engineering, Shenzhen University, Shenzhen 518060, China
Limits to crystallization pressure
Abstract
![[Uncaptioned image]](/html/1904.04491/assets/TOC_Langmuir.png)
Crystallization pressure drives deformation and damage in monuments, buildings and the Earth’s crust. Even though the phenomenon has been known for 170 years there is no agreement between theoretical calculations of the maximum attainable pressure and that found experimentally. We have therefore developed a novel experimental technique to image the nano-confined crystallization process while controlling the pressure and applied it to calcite. The results show that displacement by crystallization pressure is arrested at pressures well below the thermodynamic limit. We use existing molecular dynamics simulations and atomic force microscopy data to construct a robust model of the disjoining pressure in this system and thereby calculate the absolute distance between the surfaces. Based on the high resolution experiments and modelling we formulate a novel mechanism for the transition between damage and adhesion by crystallization that may find application in Earth and materials sciences and in conservation of cultural heritage.
1 Introduction
Crystallization pressure is well known to induce fracture and deformation in solids confining crystals, damaging buildings and monuments 1, 2, lifting layers of the Earth’s surface 3 and it is thought to drive vein formation 4, 5, spheroidal weathering 6 and cracking during metamorphism and frictional failure of the Earth’s crust 7.
The question of what limits the crystallization pressure is important to mitigation, repair and conservation of buildings and monuments damaged by “salt crystallization”. Different treatments in stone conservation aim at altering the surface energy of pore surfaces in order to limit water transport, controlling the regions where crystallization occurs and by limiting the crystallization pressure itself 8, 1, 9, 10. In Earth sciences it is fundamentally important to know if a weathering reaction or a metamorphic reaction may generate a crystallization pressure sufficient to fracture the surrounding rock, opening new fluid pathways for further reaction and frictional failure. Recent estimates for olivine hydration and carbonation suggest pressures of the order of 1 GPa can be reached 7, whereas recent experiments show that the fracture process driven by crystallization pressure closes down long before such a pressure limit is reached 11.
The crystallization pressure is generated by a crystal growing in a ”load bearing” grain boundary/contact area. A load bearing grain boundary/contact area is an area where the solid grains transmit stress to each other 1) either through direct interatomic interactions between the solids – a solid-solid contact 2) or transmitted through a thin ( nm) layer of fluid, where the pressure supported by the fluid is called the disjoining pressure. In the first case, the solid nature of the grain boundary inhibits mass transport except at high temperature. In the second case, mass may be transported in the fluid layer to the growing crystal. The driving force of the mass transport, crystal growth and crystallization pressure is the supersaturation of the fluid present. The existence of a crystallization pressure has been observed and demonstrated many times during the last 170 years 12, 13, 4, 14, 15, 16, 17, 9, 18, 19 and the thermodynamic limit to this pressure, has been known since the work of Correns and Steinborn 14: , where is chemical potential of the solution relative to the equilibrium state and is the molar volume of the crystal. Apart from the somewhat dubious results of Correns 14, no-one has ever reported crystallization pressures approaching the thermodynamic limit 14, 15, 16, 9. There are three main candidates to explain the discrepancy: 1) As already observed in 1915, the load bearing contact area is much smaller than the apparent contact area 13, 20, 16, 18, 19, meaning that the pressure in the load bearing contact area may possibly be approaching the thermodynamic limit. 2) Due to mass transport by diffusion, the supersaturation in the contact is smaller than in the bulk solution 15, 17, 18. 3) The fluid film in the contact “collapses”, a stable, ”close contact” is created and diffusion mass transport and crystal growth stops before the thermodynamic limit of crystallisation pressure is reached.
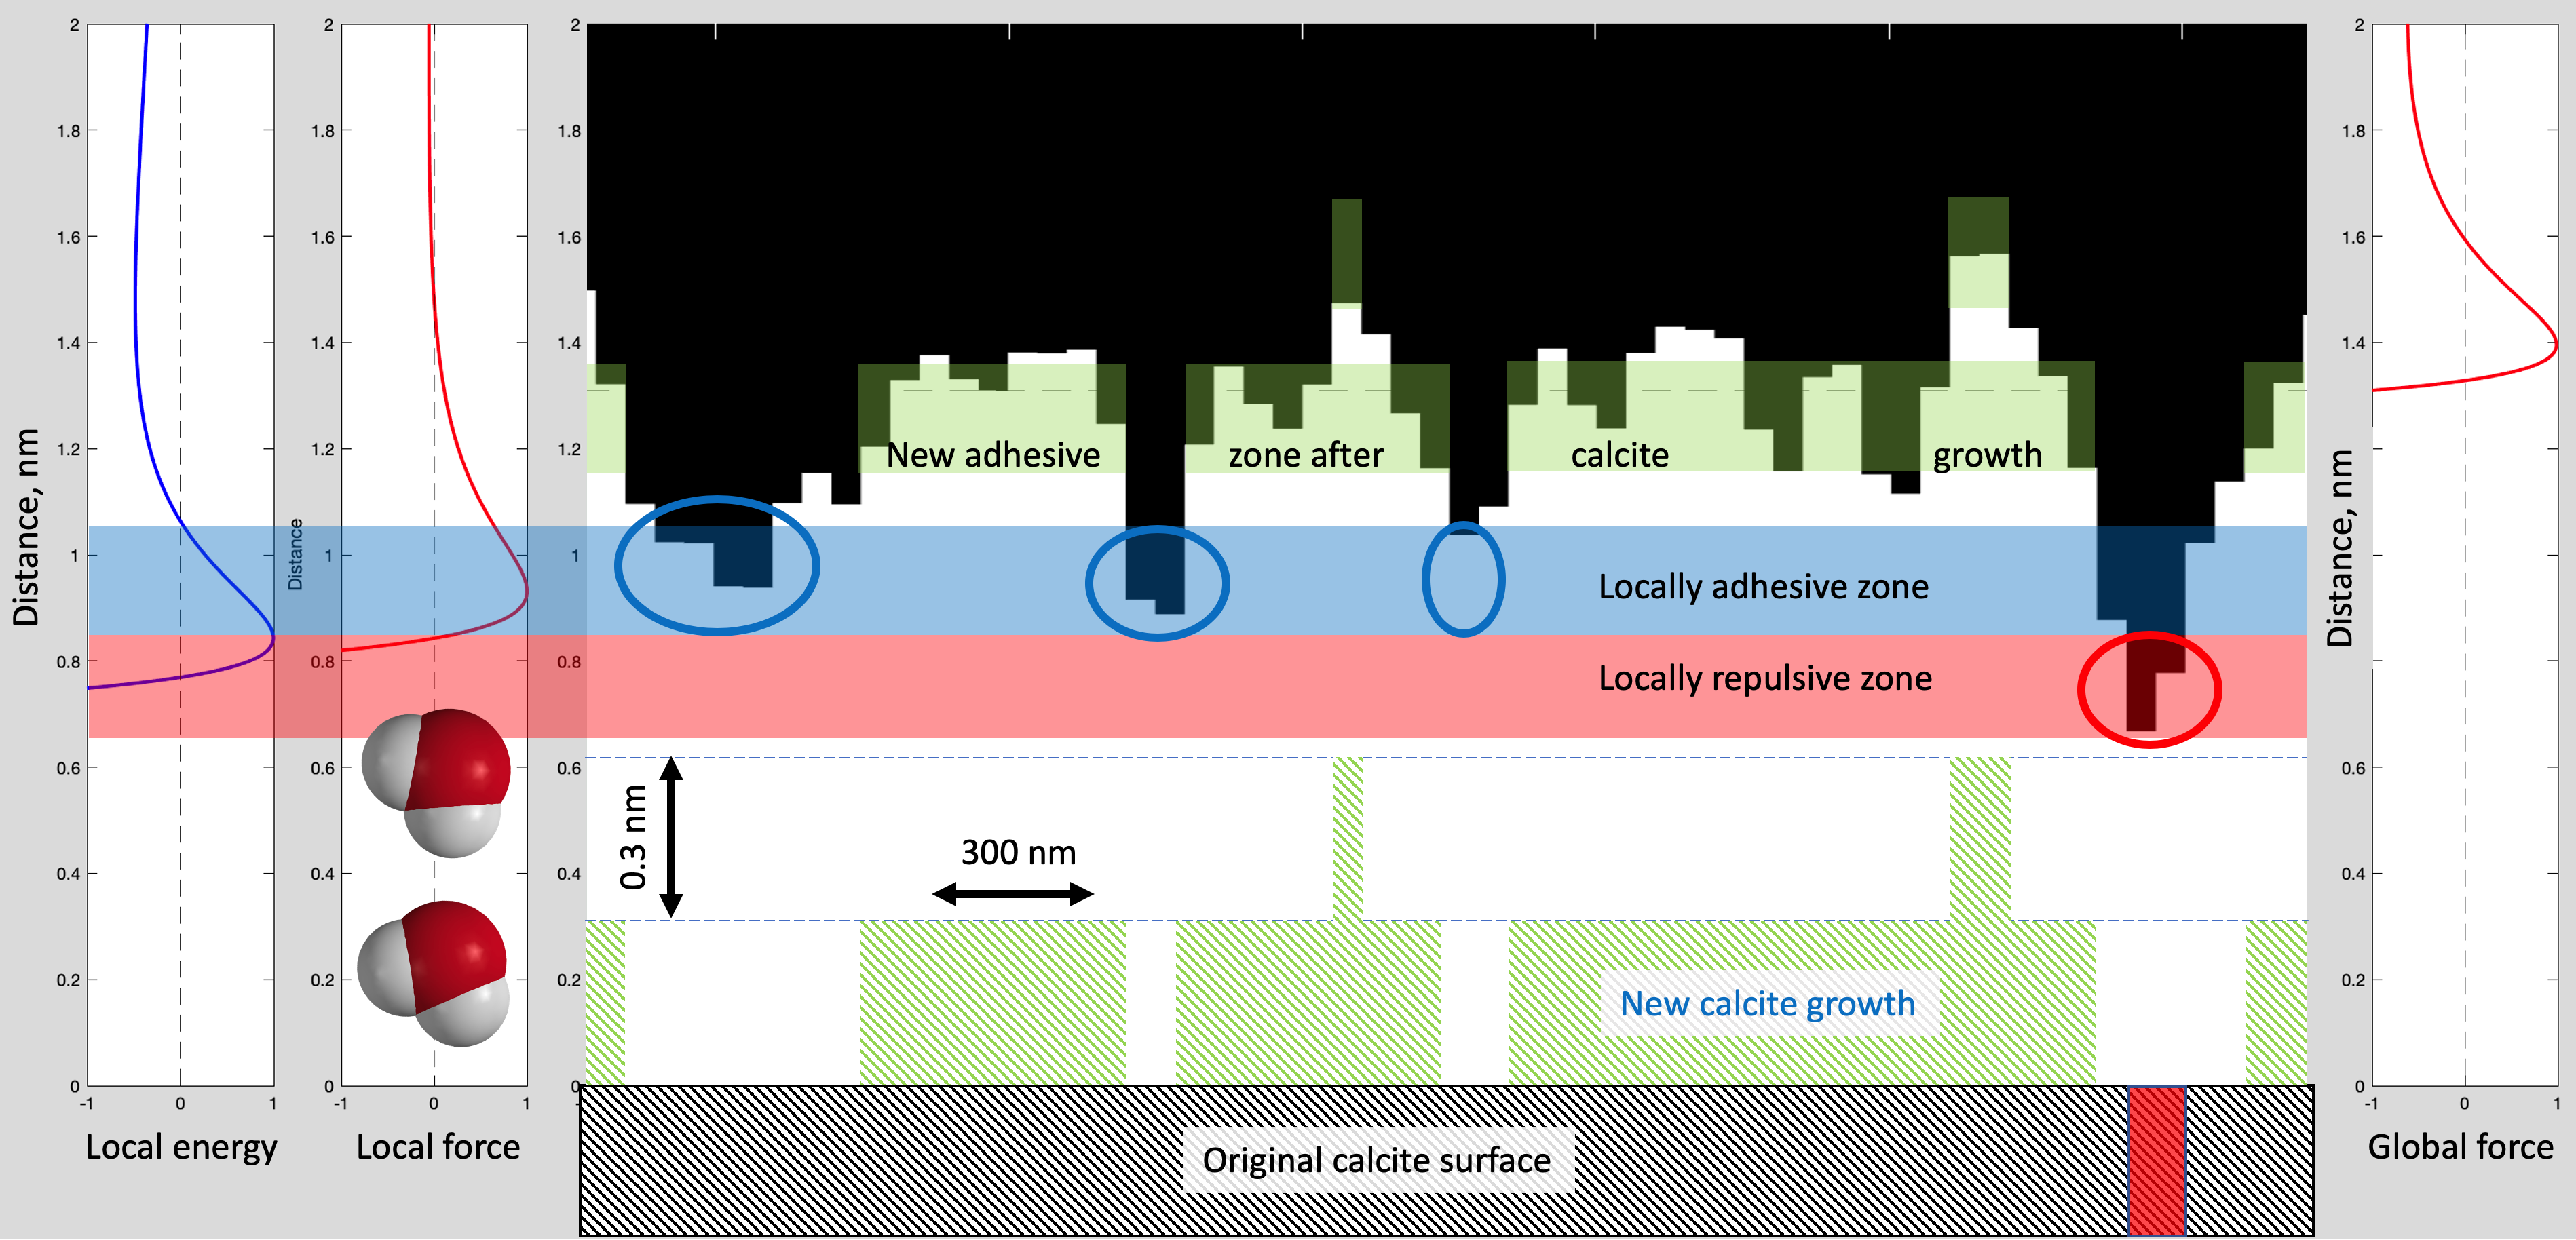
In order to understand what limits the disjoining pressure, we develop a new experimental setup where we control and measure the exact supersaturation, the real load bearing contact area, the crystal growth rate and we use existing simulation results and AFM data to construct a model of the disjoining pressure and diffusion of the system that we study experimentally. We conclude that the equilibrium concepts of crystallization pressure and disjoining pressure are not sufficient to explain the experimental results. Hence, we propose a new mechanism: The reactive surface grows locally to increase the adhesive surface area and the adhesive energy between the solid surfaces separated by 2-3 water layers becomes larger than the energy associated to the supersaturation driving the crystallization (see Figure 6).
2 Experimental
Microfluidic device with pressure control channel
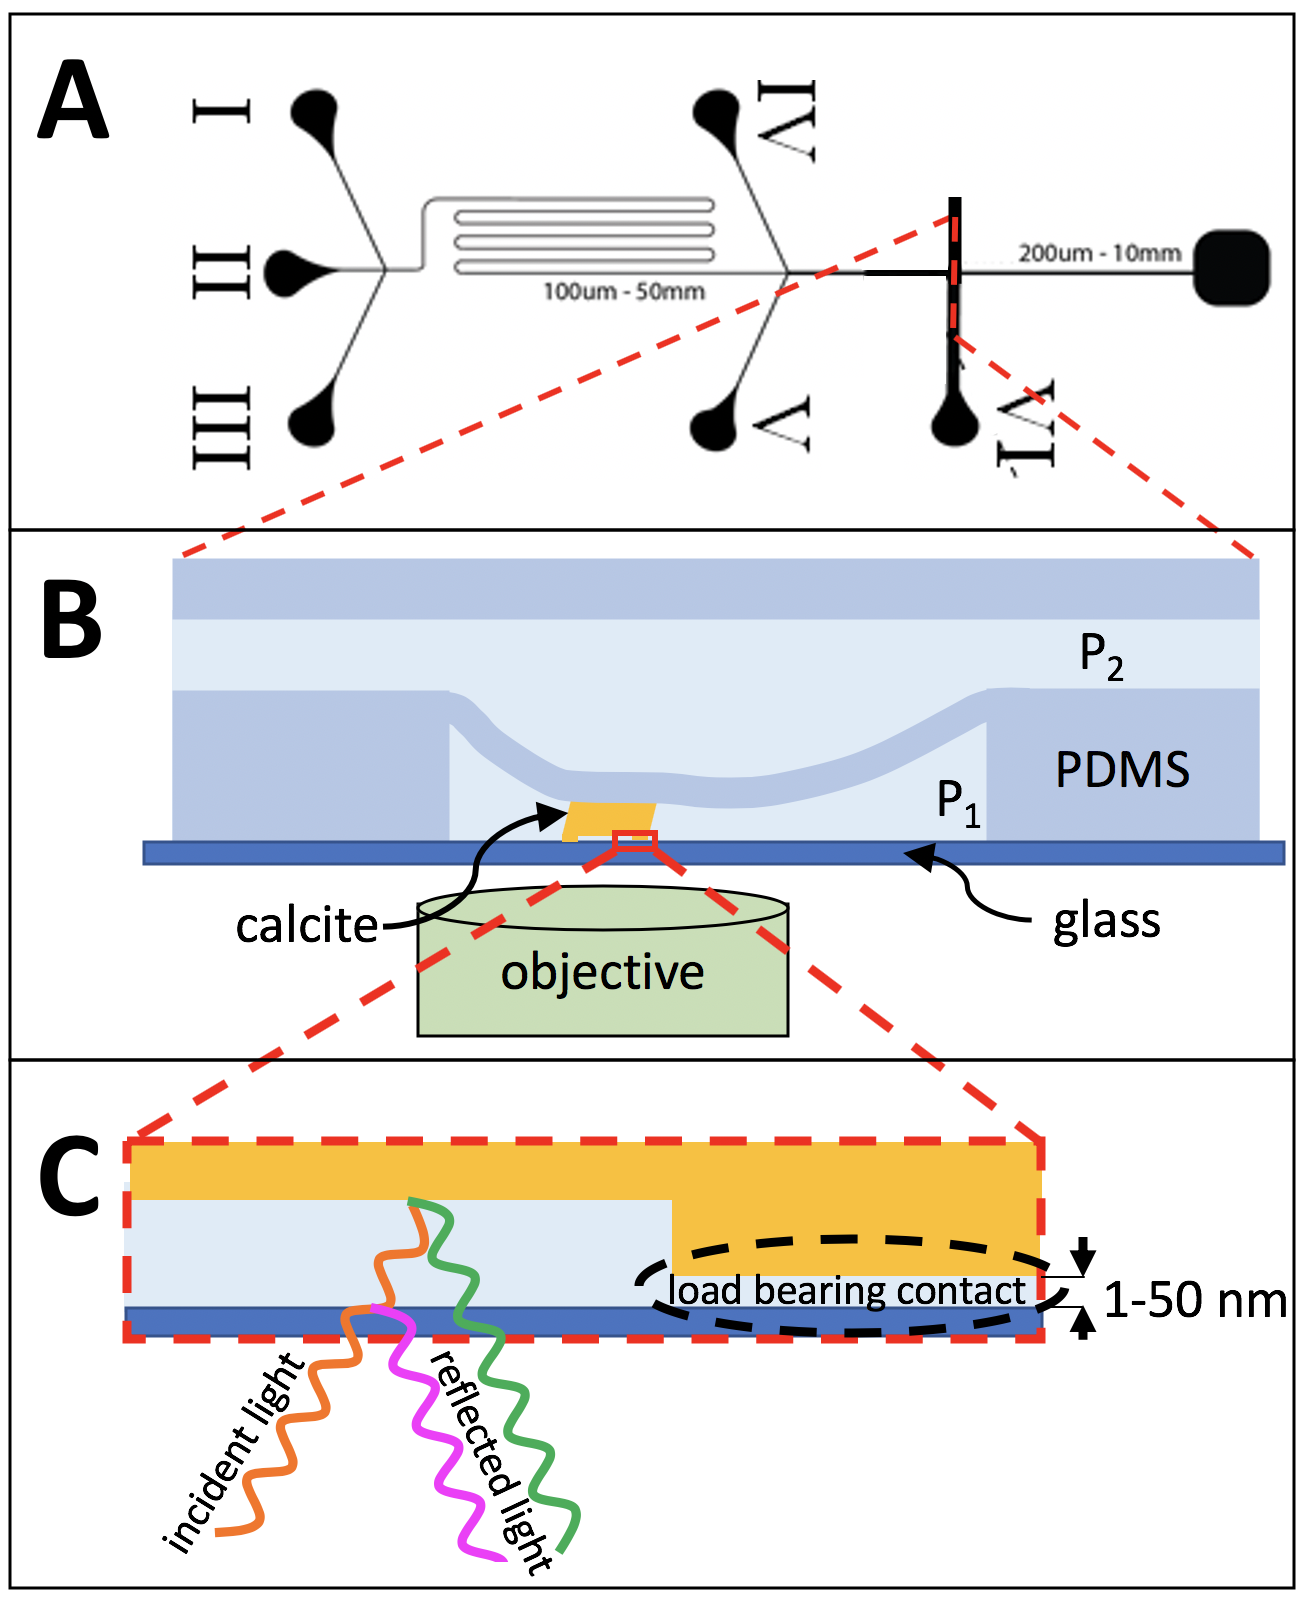
The microfluidic device, which is shown in Figure 1, consists of a cover glass with two PDMS layers on top. The PDMS is attached to the glass and defines two layers of fluid channels. The lower layer is used to control nucleation and growth of calcite. Calcite nucleation and dissolution of nuclei is repeated until a nucleus is attached on the PDMS membrane in the desired region. The fluid pressure in the upper fluid layer can be increased in order to bend the 6 m thick PDMS membrane between the two fluid layers and push the calcite crystal towards the glass. In this manner the force between the calcite crystal and the glass can be controlled. The microscope objective underneath the cover glass images the crystal and allows full 2D measurement of the absolute vertical distance between the crystal surface and the glass surface. The cover glass has an RMS roughness of 0.2 nm as determined by AFM measurements. The force divided by load bearing contact area yields the contact pressures and the vertical displacements yields the crystal growth rates in the load bearing contacts.
The layout of the lower layer corresponds to the one described previously 21. However, it is only 29 0.3 m deep. It has 5 inlets (I-V), which are used to control the nucleation and growth of calcite in the fluid flow. The CaCl2, H2O and Na2CO3 solutions, which are pumped into the microfluidic cell from inlets I,II and III, mix in the main channel by diffusion. To induce nucleation, we use solutions with higher concentrations of CaCl2 and Na2CO3 from inlets IV and V. The highly concentrated CaCO3 solution produces nuclei that are attached to the walls of the channel. Multiple nucleations or nuclei at undesired locations are dissolved by lowering the concentration of the solution. After nucleation, a CaCO3 concentration of 0.8010.002 mM has been used, which corresponds to a saturation index of 21.
Before the calcite crystal comes into contact with the glass bottom of the microfluidic channel the pressure deforms the membrane. Once a load bearing contact is achieved the crystal moves negligibly and the force on the crystal from the membrane is proportional to the change in pressure times the area, , of the membrane closest to the crystal, (see section 6).
Reflection interference measurement of fluid film thickness
The images of the confined crystal interface have a local intensity that depends on the fluid film thickness or local distance between the glass surface and the crystal: , where is the refractive index of water, nm is the wavelength of our light source, is the background intensity and is the contrast and is a factor that accounts for the effective angle of the light with respect to the optical axis. Because varies across the image due to refractions and non-uniform reflections at other surfaces of the crystal, there is an uncertainty of about nm in the determination of contact (). The accuracy of the determination of upwards growth (where is the vertical position of the crystal) equals the precision of nm. The details of reflection interference contrast microscopy (RICM) have been explained in detail elsewhere 19, 18. From the RICM images we identify the load bearing contacts as regions where the distance between the crystal and the glass is less than 50 nm.
Thermodynamics and kinetics of calcite growth
The saturation index is related to the chemical potential of the solution:
| (1) |
where and are the ion activities. Teng et al. 22 have proposed that the solubility product corresponds to the experimental conditions when spirals on the 104 surface stopped growing. We have used PHREEQC 23 to calculate .
A normal stress, or (load bearing contact) pressure, on a solid surface contributes with a factor to the chemical potential of the solid, where is the molecular volume of the solid 24. Thus the chemical potential difference between the solid and the solution that drives either growth () or dissolution () is:
| (2) |
One may then immediately calculate that a solution with saturation index of 0.44 is in equilibrium with a calcite surface subject to a pressure of MPa. This is the thermodynamic limit of the crystallization pressure at saturation index 0.44. We may also calculate that the disjoining pressure of 0.5-5 MPa in the contacts amounts to reducing the driving force for growth, by 1.4-14% from 0.44 to 0.43 and 0.38, respectively. We have shown that in this range of saturation indices the purely kinetic growth rate constant (no diffusion limitation) is independent of saturation index 19 and the kinetic contribution to the growth rate will therefore only be reduced by 1.4-14%.
3 Results
Experimental results
The novel experiments presented here have been designed for in situ observations of nano-confined calcite growth under highly controlled conditions. The microfluidic setup provides a very accurate and stable supersaturation and has a high degree of control of the pressure at the confined surface. The topography of the nano-confined calcite surface and thereby the load bearing contacts (glass-calcite distance nm) are recorded with nanometer vertical resolution during the whole growth process by high resolution reflection interference contrast microscopy (RICM).
We have succeed to nucleate and grow calcite crystals attached to the deformable membrane in several experiments. We have proceeded by increasing the control pressure to form a load bearing calcite-glass contact. All experiments have given qualitatively the same results but we focus here on the experiment where the contact stresses could be determined quantitatively and thereby be analysed properly.
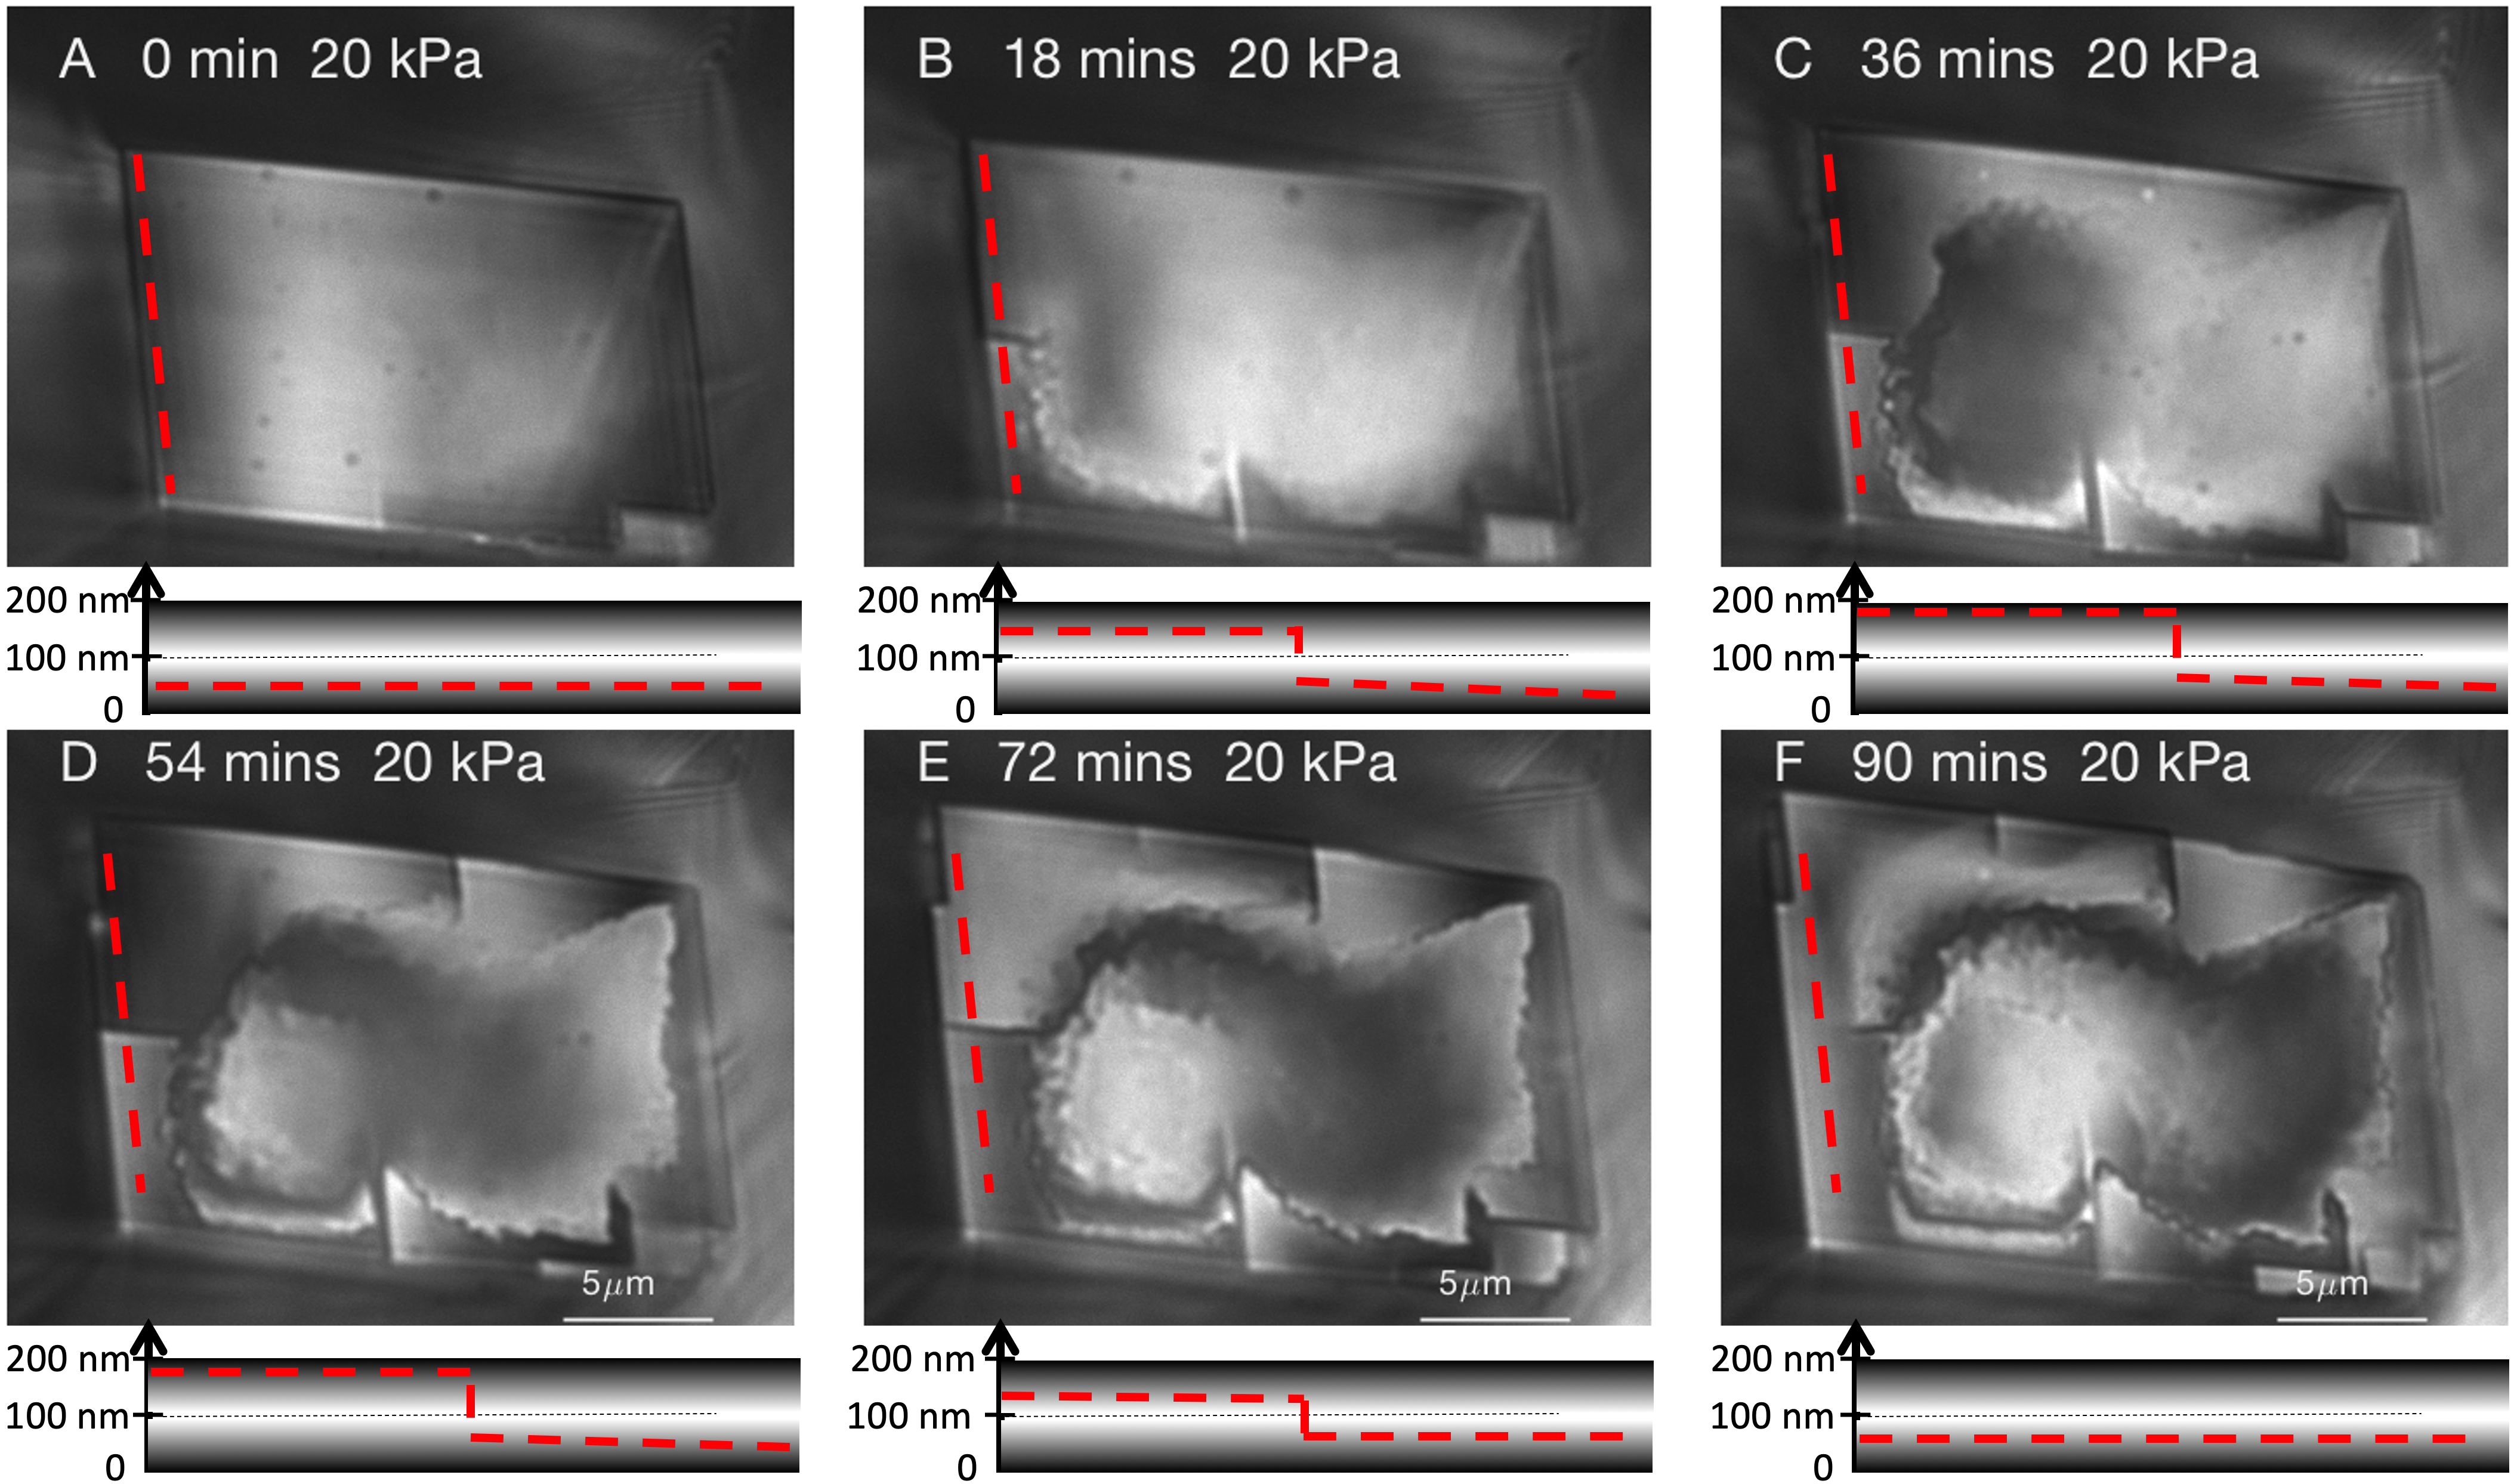
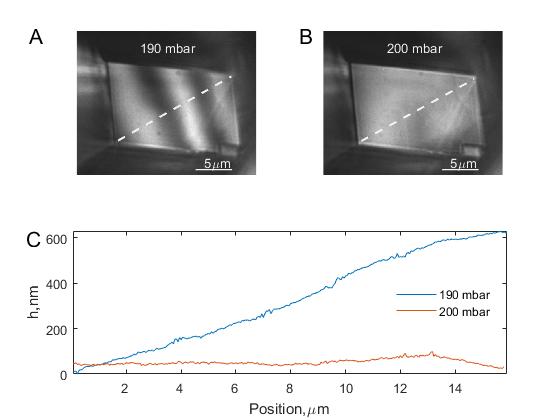
While bringing the crystal into contact with the glass, the flowing calcium carbonate concentration is kept at =0.05 mM and the saturation index =0. The crystal is brought into contact with the glass surface with a fluid control pressure =20 kPa and the force transmitted to the upper calcite surface is nN (see section 6). The flowing fluid composition is changed to =0.8 mM, =0.44 at time . Figure 2 shows the evolution of the confined crystal surface after it has been brought in contact with the glass surface. The crystal grows outwards, changing the area of the crystal parallel to the glass. The crystal also grows downwards in the load bearing contacts (perpendicular to the glass surface and image plane) pushing the crystal upwards against gravity and the applied force of the membrane.
At time the calcite surface was flat ( nm, Figure 2 A, top) and glass-calcite contact pressure Pa. The calcite surface was confined and the Ca2+ and CO diffusion is limited in the confined solution film causing the first contact growth rim to form (see Figure 2 B, top). As the calcite grows at the confined surface, a cavity appears on the calcite surface, a confined growth transition that we have already explained in detail 21, 18. Along the rim of the crystal the crystal grows and the dark part of the growth rim signifies a small distance nm and that this area, , of the crystal is load bearing. One observes in images C-F that less than 5% of the crystal area is load bearing. The growth rim is divided into different domains separated by large steps. It changes with time which domains of the rim that are load bearing. This causes the crystal to ”wobble upwards” in a manner already reported for crystals only supporting their own weight 21.
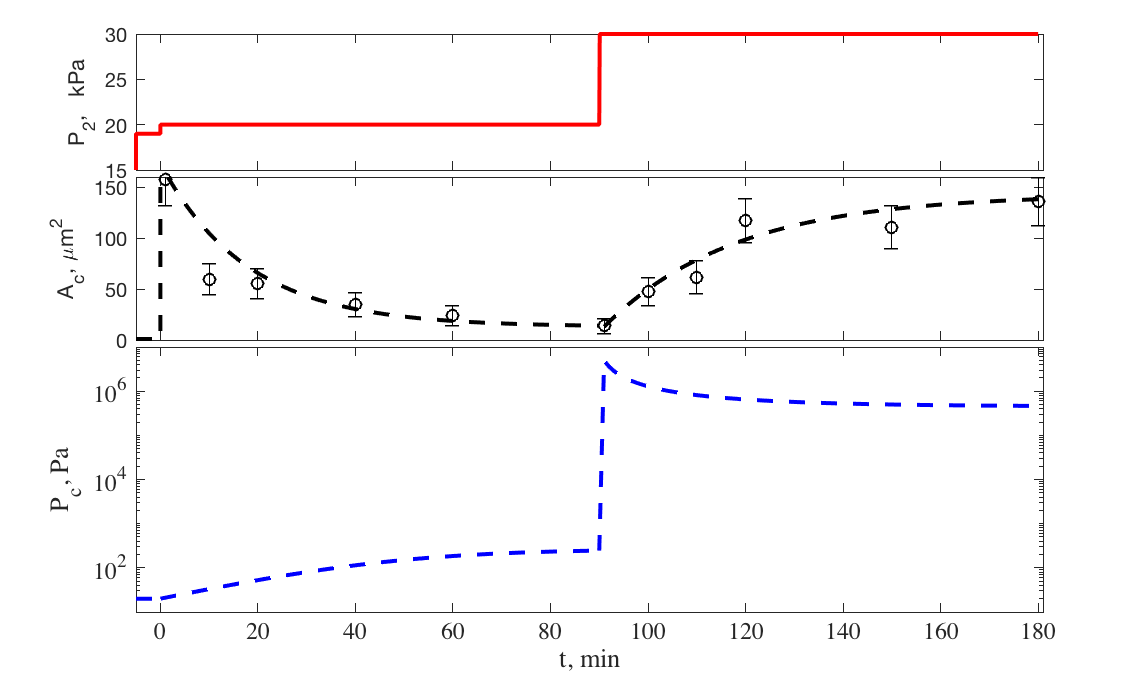
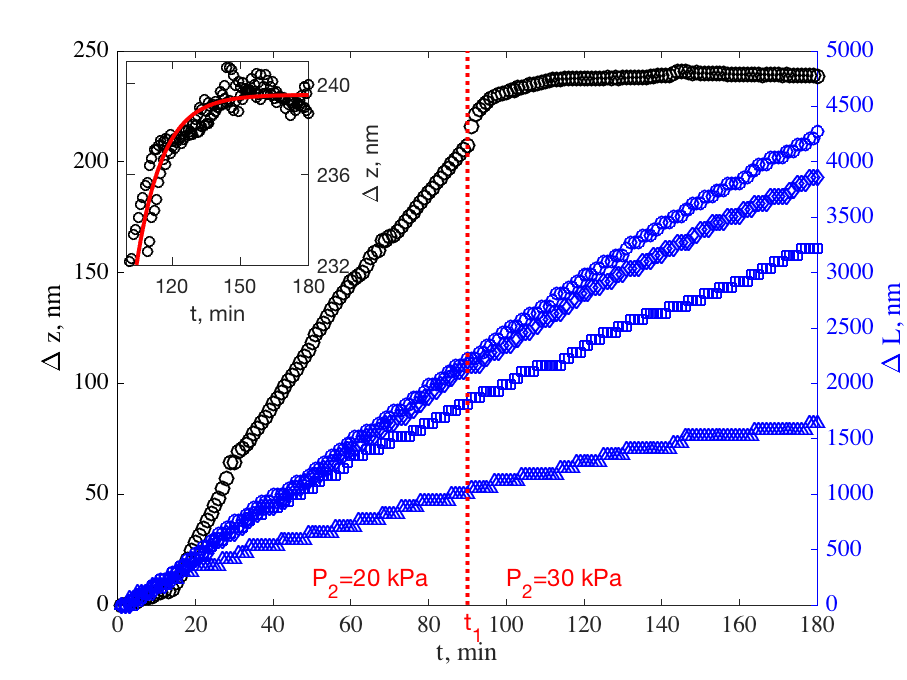
We have used the RICM images in Figures 2 to estimate the contact areas, between the calcite and the glass support (see Figure 3). The contact pressure is then calculated as , where kPa is the pressure used to stretch the membrane until full contact between calcite and glass was reached and is the area of the membrane transferring pressure from the control fluid to the crystal (see section 6). In the first 90 minutes the contact pressure increased from 20 to 250 Pa, at min the contact pressure changed from 250 Pa to 5 MPa and then the contact pressure reduced towards 0.5 MPa as the contact area grew.
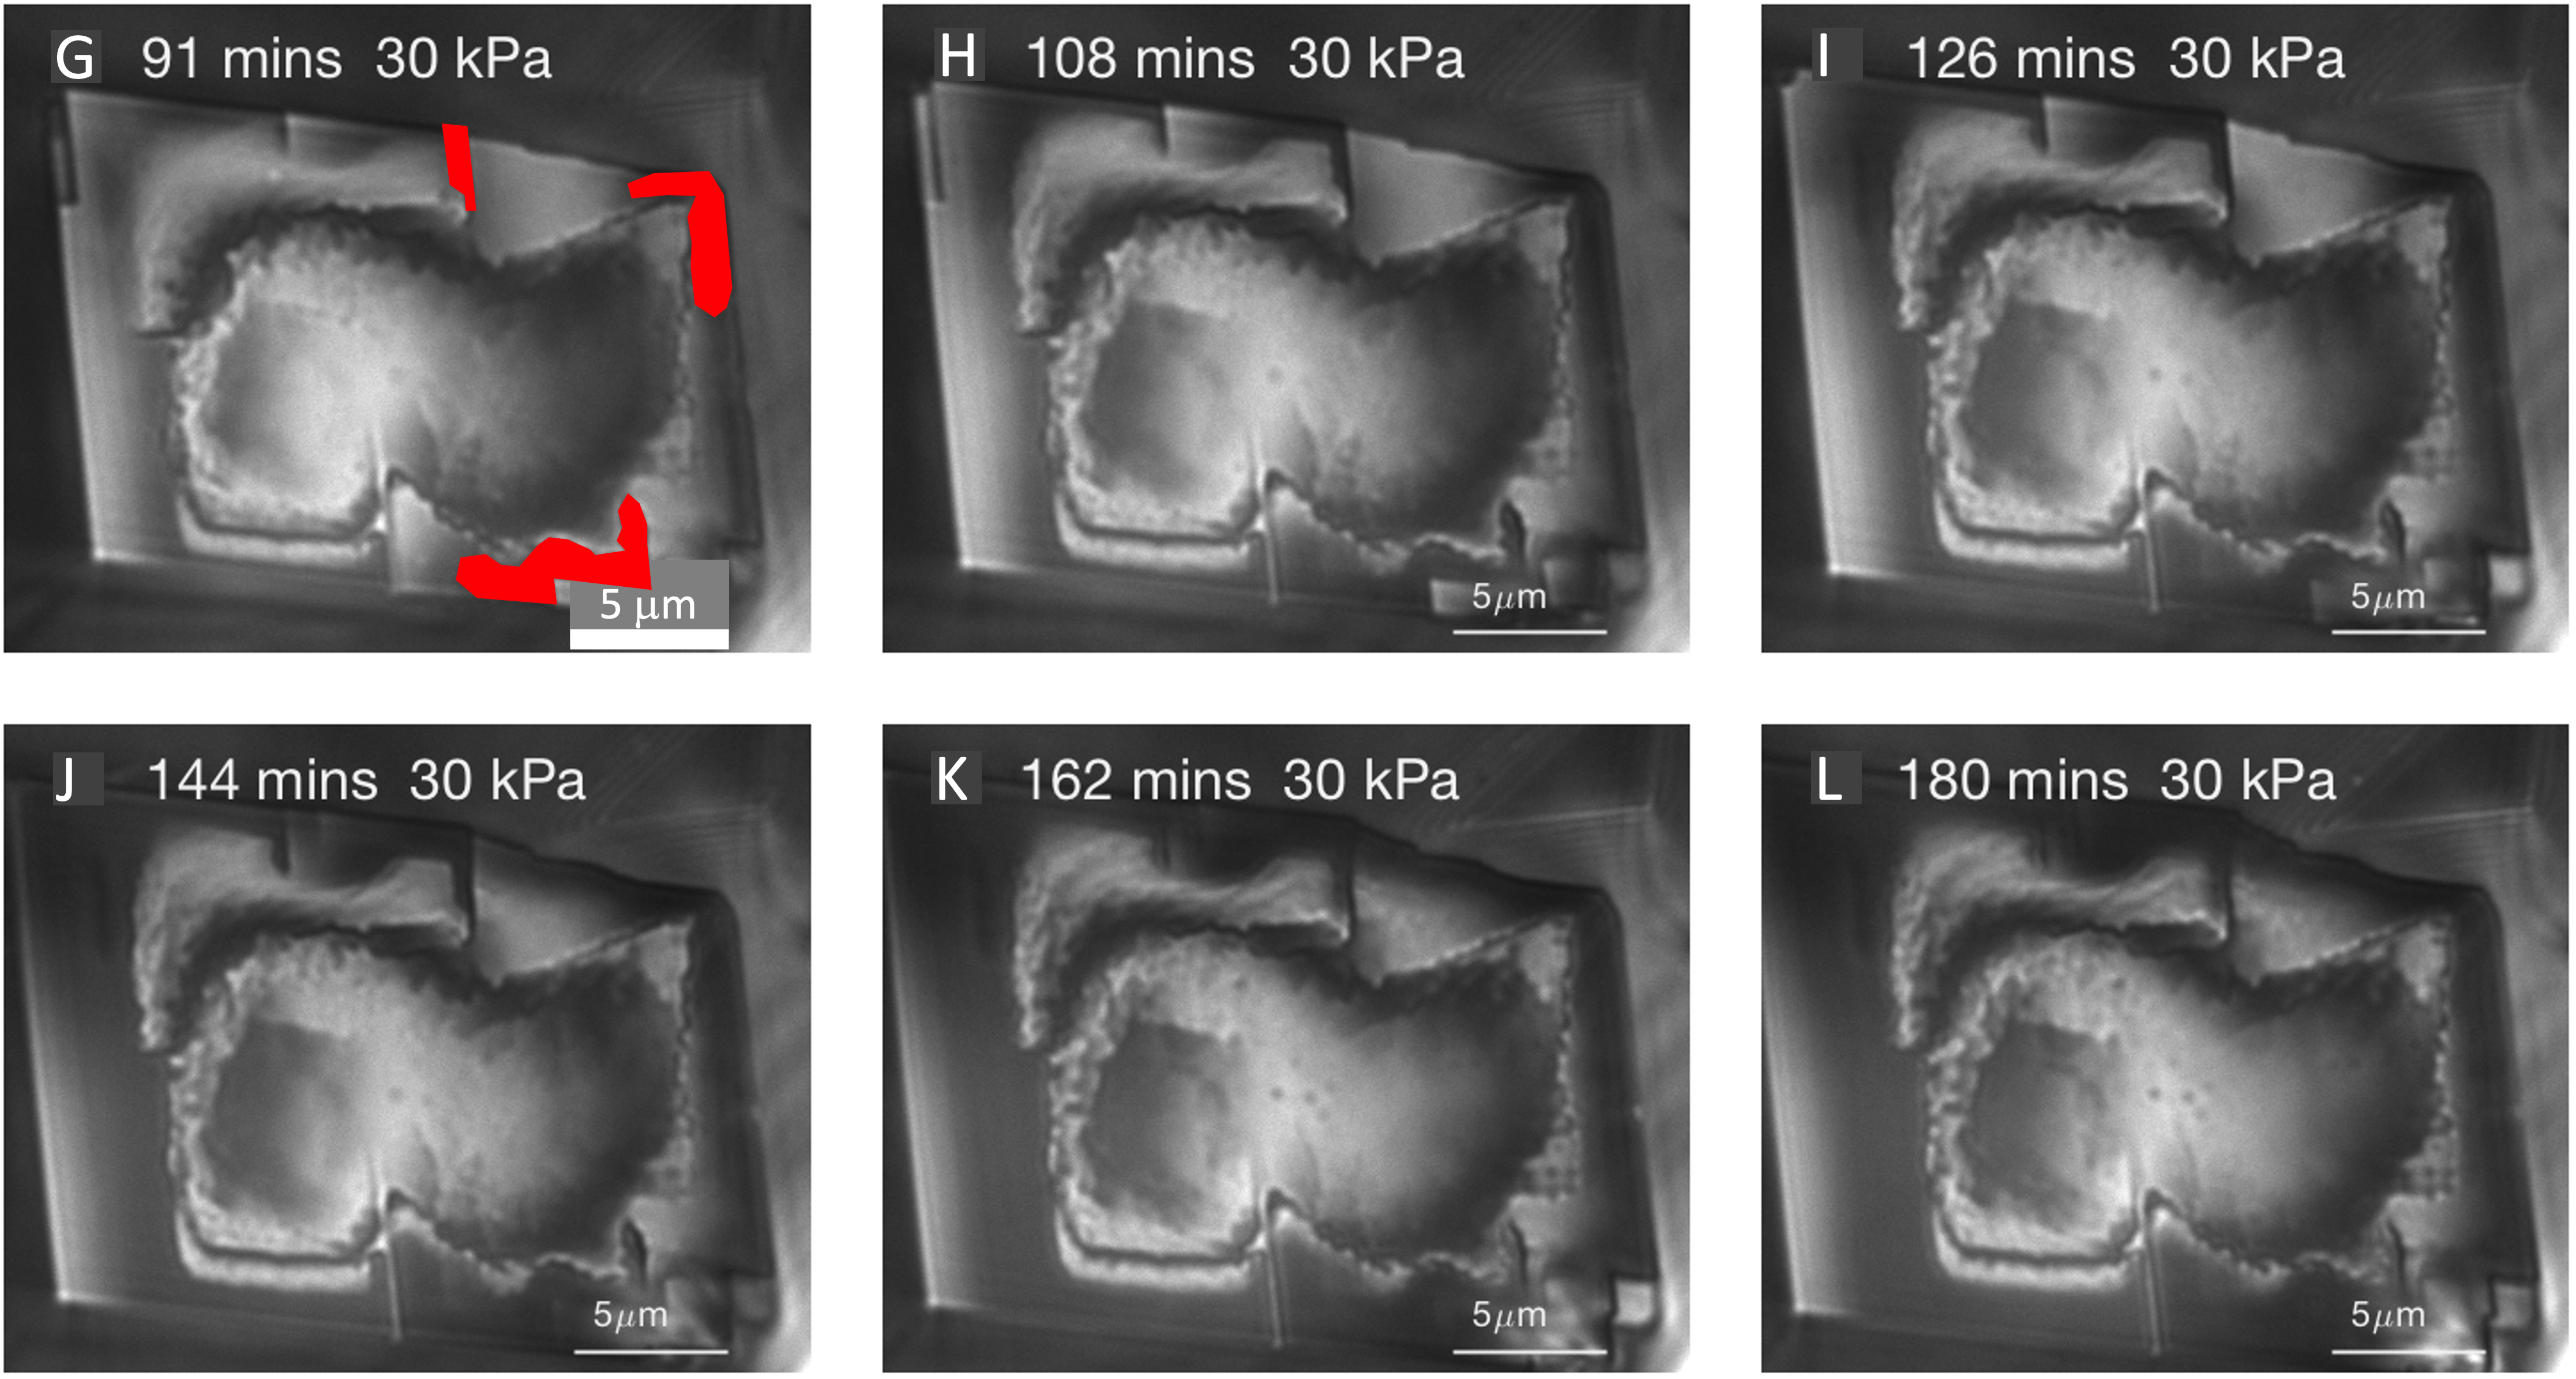
After 1.5 hours growth with saturation index 0.44, the pressure in the upper channel is increased from kPa to 30 kPa and the saturation index is kept constant. The images of the crystal in Figure 2 G-L show that the growth rim that was split up in domains with steps between, grows to form a smooth calcite rim in contact with the glass surface all around the crystal rim. During the first 30 minutes of this reformation of the rim the crystal growth is still pushing the crystal up against the applied load (see Figure 4). After that, the upwards growth stops and the contacting rim widens as the outer edges of the crystal continue to grow.
During the three hours (180 minutes) with high saturation index, =0.44, the outer rims of the calcite crystal grew at a constant rate as can be seen in Figure 4. The upwards growth shown in the same figure however, goes through three distinct phases: The first 13 minutes the confined surface grows to accommodate the contact and tilting the crystal slightly, then during the period 13-90 minutes there is a steady upwards growth of 2.6 nm/min. At =90 min the pressure increase pushes the crystal 8 nm downwards and then the vertical growth slows down exponentially and comes to a complete halt. We continued to let the crystal grow under this load for 12 hours more, but there was no further growth upwards within the accuracy (1 standard deviation during the last 40 minutes, see inset in Figure 4) of nm. We can therefore conclude that the growth rate is smaller than 0.04 nm/h which equals 0.35 m/yrs or 35 cm/Ma. Relative to the height of the crystal this growth rate corresponds to a strain rate of s-1. Thus even though we are below the detection limit of a very accurate technique the growth rate and strain rate is still considerable on a geological time scale. This result requires us to pose the question: does the change in growth rate of more than a factor 4000 signify a dramatic slowing down of the crystal growth (working against a force) or does it signify a complete stop?
Model results
In this section we combine experimental data and simulation data, with a theoretical model that accounts for the forces between rough surfaces, to build a new model to describe the disjoining pressure between calcite and a rough glass surface. Interaction energies between surfaces are represented with DLVO forces at distances of a few nanometers and beyond, and with repulsive and oscillatory forces at smaller distances 29.
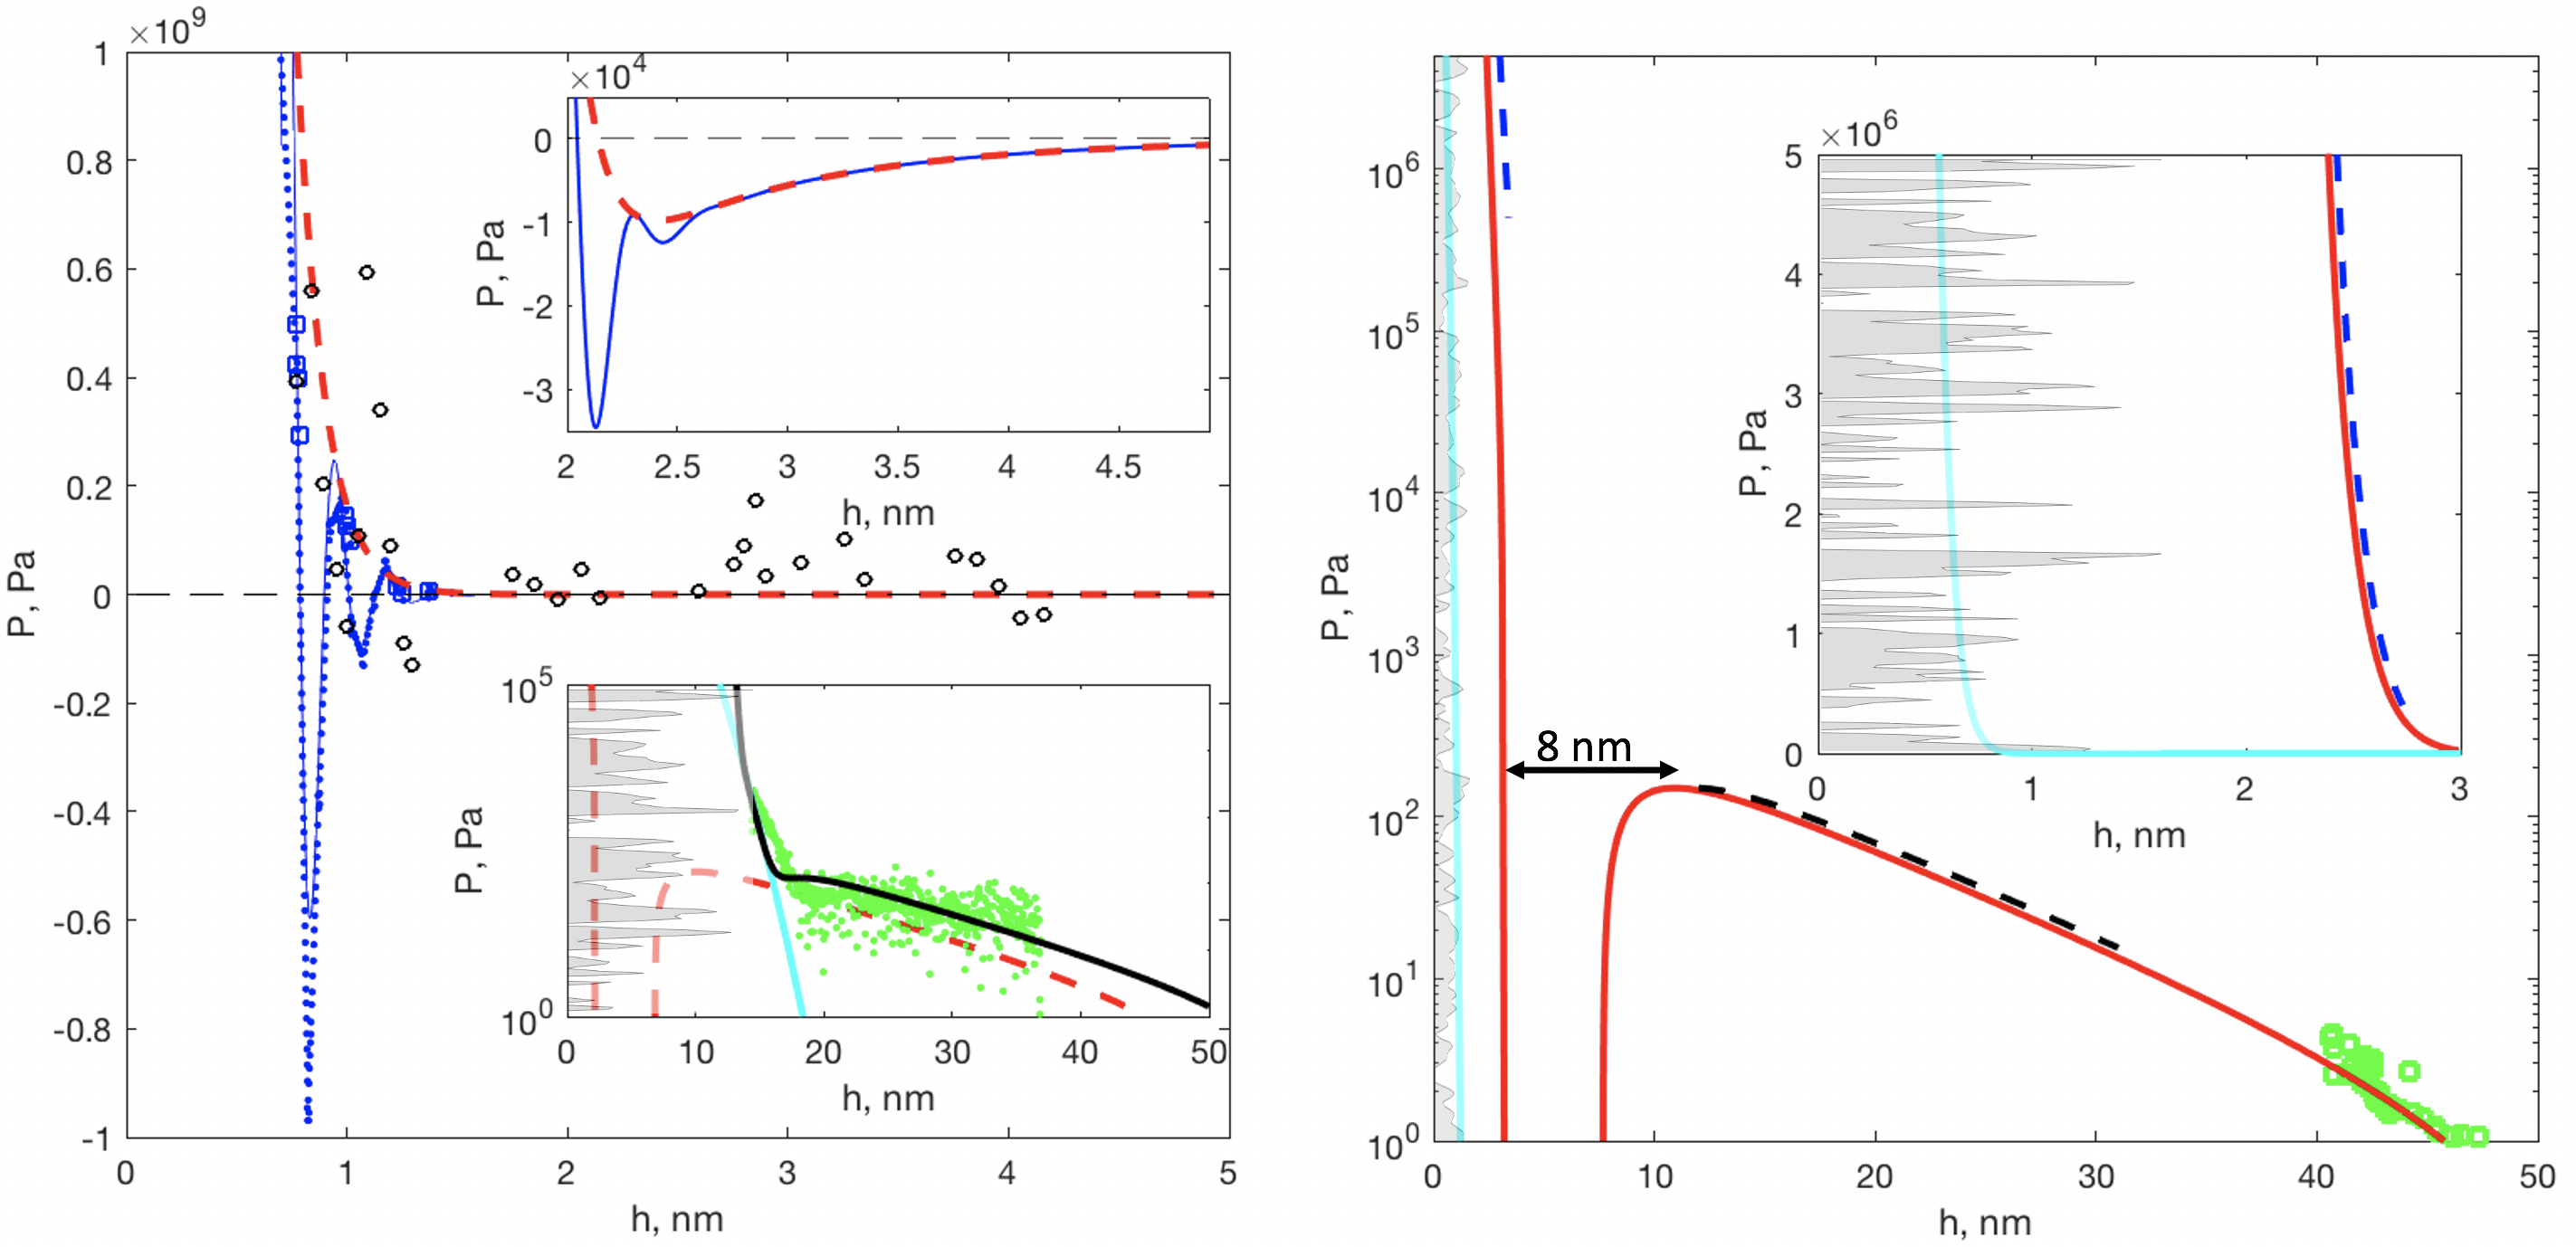
We have fitted a simple repulsive model, and oscillatory amplitude, to the Molecular Dynamic (MD) simulation data for calcite-calcite slit pores in pure water 26 (see left hand side of Figure 5). Given the lack of data for calcite-glass surfaces, we will use this as the best starting point to model interactions between atomically flat calcite-glass surfaces. The period of the oscillatory force is due to the water layer structure and it does not depend much on the surface type. To take into account the charges of the calcite and silica surfaces we use the calcite-silica parameters for the DLVO model from Diao and Espinosa-Marzal28. The inset on the left side of Figure 5 shows the AFM data for rough silica spheres on calcite 28, featuring a steep repulsive part Pa and a long range tail of =10-100 Pa. The long range part is outside the range of the MD data and the repulsive model. To account for the steep repulsive part of the data we use the rough surface model of Parsons et al 30 with an RMS roughness of 3 nm. The resulting disjoining pressure model can be expressed as , where represents the convolution with the Gaussian height distribution with the RMS roughness. The only adjustable parameter required to obtain the black curve that passes through the AFM data, was the RMS roughness, , of the silica sphere. We used here =3 nm, close to the value reported by the authors, =2 nm, in reference 28. One observes that the reason why no attractive interaction was observed between the silica sphere and the calcite is that the direct contact contribution to the pressure between the two surfaces (cyan line in Figure 5) extends further out than the negative DVLO contribution (dashed red line in Figure 5).
The same model is then used to predict the disjoining pressure curve for our experiments with glass roughness nm (see right hand side of Figure 5). The model fits very well with our previously published data (green squares). The model predicts the range of distances between the two surfaces in the first 90 minutes (10-250 Pa 10-30 nm) and in the last 90 minutes (5-5 Pa 2.4-2.6 nm). This corresponds well with the observed jump of nm when the pressure was increased. In Figure 5 one also observes that there are no solid-solid contacts between the two surfaces (see gray lines in Figure 6, which represent a 0.2 nm RMS rough surface, while the cyan line is the contact contribution of the Parson model).
The change in the gap, nm, between the two surfaces influences the mass flow rate towards the growing surface in two ways: i) the cross sectional area for the flow is reduced by a factor 5 (from 10 to 2 nm), ii) the diffusion coefficient is reduced a factor of 2.5 (see section 8). In addition the diffusion flux is reduced inversely with the width of the growth rim, . Figure 2 shows that during the experiment the rim width only changes by a factor of 2-4. Altogether, this amounts to at most a factor 50 reduction in the vertical growth rate. The observed growth rate is reduced by at least a factor 4000 but the reduction of the diffusion due to confinement can only account for only a factor 50. The increased pressure in the load bearing contacts affects the growth rate of calcite (through the chemical potential, see section Experimental) by 14% at the most. This means that some other mechanism is needed to explain a growth rate reduction of a factor 80 or more.
4 Discussion
We have shown that when the pressure at the confined interface is increased enough to establish close proximity ( nm), the confined vertical motion of the crystal is reduced by at least a factor 4000 and apparently stops completely. We have observed the same arrest of vertical motion in many other experiments 21, 18. The reduced diffusion transport of ions to the confined surface and the change in thermodynamic driving force or growth rate kinetics may all together account for a reduction by a factor of 60 only.
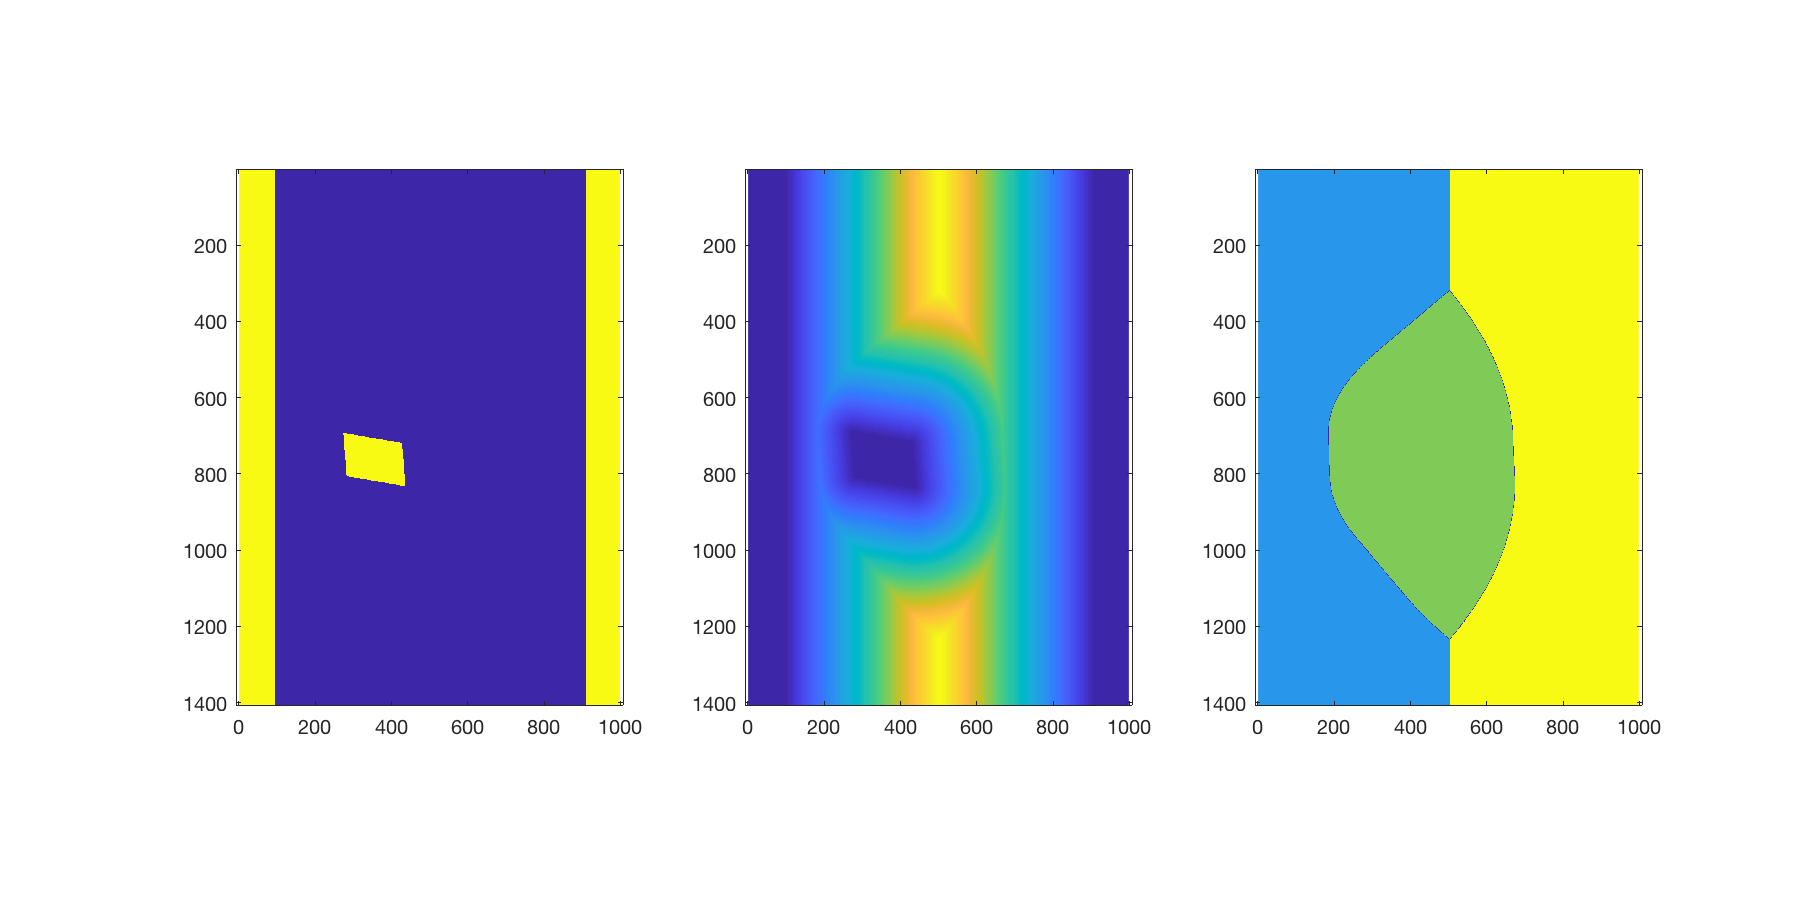
To explain the arrest of the vertical motion we propose a new mechanism. Figure 6) sketches a molecular interpretation of the processes at play between the rough inert glass surface and the reactive calcite surface that we have modelled in Figure 5. When the surfaces are pressed together by more than 1 MPa the mean distance between a rough (=0.2 nm) and a flat surface is 1-3 nm depending on the nature of the fluid and charges on the surfaces. However, local regions of the calcite surface are closer or more distant to the glass surface. Due to the ordering of the confined water different regions of the surfaces will experience either local adhesion or repulsion. In addition to the chemical potential of supersaturation there is a local free energy difference driving crystal growth in the regions where the growth results in increased adhesive energy. Local pressures exceeding , will drive local dissolution. Consequently, once the surfaces are brought into sufficiently close contact, local dissolution and growth will reshape the calcite surface to fit the glass surface, leading to a maximisation of the local regions experiencing an attractive interaction, at typical separations of 2-3 water layers. The diffusion in this water film decreases significantly, approaching zero. Consequently, crystal growth ceases and the surfaces adhere instead of being pushed apart. If the surfaces do not have appreciable adhesive regions, the calcite surface may still locally dissolve and grow approaching the other surface. This may stop diffusion and crystal growth without the surfaces adhering. The proposed mechanism will depend on the surface roughness, the hydrophilic/phobic nature of the surfaces and the fluid composition. These are interactions that can be modelled 29 to predict the maximum crystallization pressure.
It has been demonstrated that liquid ordering is important during crystal growth 31 and that crystallisation can take place in local regions. The crystallization is correlated with the observation of negative and positive disjoining pressures, which may change on very short lengthscales (nano and sub-nanometer distances) 32. A recent study of contact formation using Kinetic Monte Carlo (KMC) 33 shows that growth of local contacts is enhanced by an attractive interaction energy of the same order as that created by the ordering of 2-3 confined water layers (see section 9).
SFA and AFM experiments demonstrate that roughness is important for short time adhesiveness and dissolution - precipitation processes in the confined region 34, 28, 35, 36, 37. Systematic variation of contact time should allow a better understanding of the adhesion forming mechanism that we propose here. Indeed, we evidenced an analogous calcite growth mechanism in the SFA experiments with reactive calcite surfaces growing against a mica substrate (see Figure 11 and details in the Supporting Information: SFA experiments). These SFA results indicate that the growing calcite asperities become locally smoother, leading to the stronger adhesion between calcite and mica with time.
The proposed mechanism is closely related to adhesion between reactive solids and resembles the molecular scale processes proposed for crystal agglomeration 38, 39. Experiments on the interactions between reactive surfaces in the surface forces apparatus (SFA) 35, 37, with AFM 34, 28, 36 and slide-hold-slide friction 40 all show that the adhesion between two surfaces depends on the fluid present, the force applied and time spent holding the surfaces together before pulling them apart or sliding.
The proposed mechanism is also consistent with recent experimental observations that showed that the limit to crystallization pressure is related to the disjoining pressure and not to the thermodynamic limit pressure 9, 11. Our proposed “microfracture healing” without forming covalent bonds, only weak water-film-mediated “bonds” can also explain several experimental observations of reactive interfaces developing strength with time: fracture healing 41, cement setting 42 and fault gouge strengthening 40, 43.
Recently, it has been demonstrated that the crystallization pressure of NaCl on glass is reduced exponentially with supersaturation even though the thermodynamic limit increases with supersaturation 9. The authors argued that the crystallization process was arrested once the fluid film reached a thickness of about 1.5 nm. Our experimental and modelling study on the nanoscale explains the mechanism how crystallization pressure is arrested at fluid film thicknesses of 2-3 water layers. We also demonstrate that modelling of the surface forces including roughness may predict the limit of crystallization pressure.
A systematic evaluation of the proposed mechanism can be performed both by Kinetic Monte Carlo (KMC) 44, 33, 45 and experimentally combining optical imaging of the contacts with AFM experiments 34, 28. The existence and effectiveness of the proposed mechanism depends crucially on the roughness and surface forces. These are parameters that can easily be varied experimentally and in KMC. Molecular simulations of hydrated crystals like mirabilite and alum may reveal if their large crystallization pressures and damaging properties14, 1, 2 are due to qualitative differences in water structure, adhesion and diffusion as compared to non-hydrated crystals like CaCO3, NaCl 15, 9, 17 NaClO3 18.
5 Conclusions
A new experimental technique to control and image crystal growth in nano-confinement has been developed and applied to calcite and shown that displacement by crystallization pressure is arrested at pressures well below those corresponding to the thermodynamic limit. Existing simulation and AFM experimental data have allowed us to build a robust model to rationalize the disjoining pressure in our system and thereby calculating the absolute distance between the surfaces. Our findings are consistent with recent experimental observations that suggested that the limit to crystallization pressure is related to the disjoining pressure and not to the thermodynamic limit pressure 9, 11. Our detailed experiments and modelling indicate that the mechanism responsible for the arrest of crystal growth, is connected to contact healing processes, which create strong but non-covalent adhesion between surfaces confining nanoscale films containing 2-3 layers of water molecules. The new mechanism is strongly dependent on the nature of the surfaces, the roughness and the fluid composition. Understanding this mechanism will allow prediction of the limit between damage and adhesion by crystallization in many systems in Earth and materials sciences.
This project has received funding from the European Union’s Horizon 2020 research and innovation program under the Marie Sklodowska-Curie Grant Agreement No. 642976 (ITN NanoHeal) and from the Norwegian Research Council Grant No. 222386. RMEM acknowledges support of National Science Foundation under the grant Nos. CMMI-1435920 and EAR 18-56525.
6 Force applied to crystal
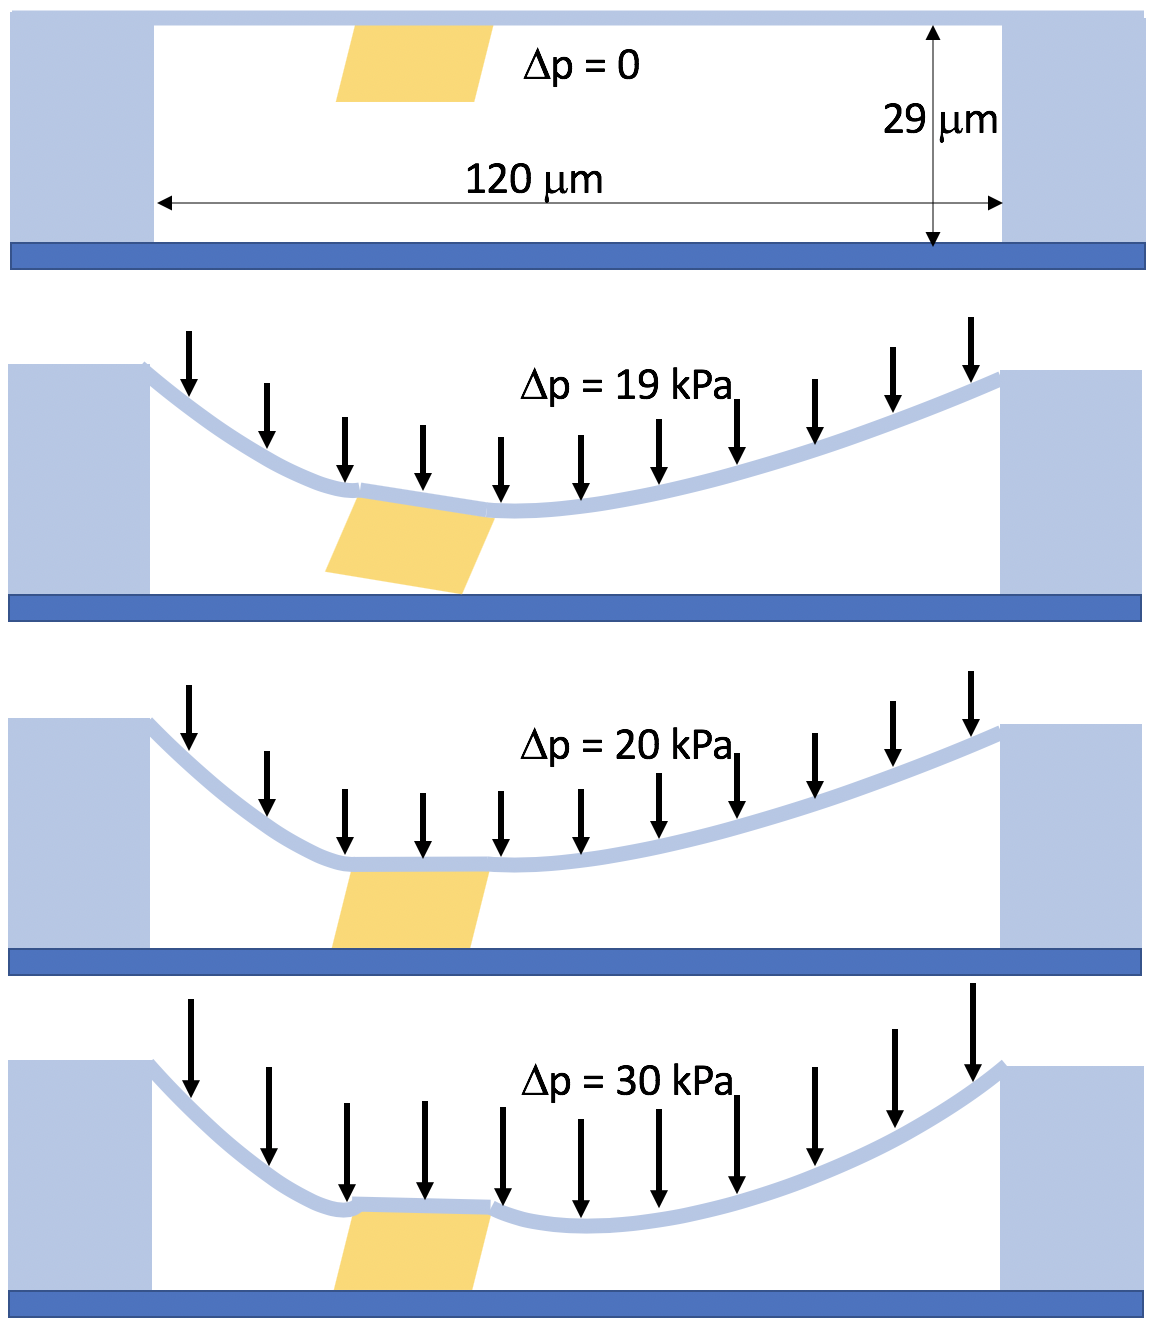
When the calcite is located and growing on the PDMS membrane in the lower channel, we start to increase the control pressure slowly until a corner of the calcite reaches the cover glass at kPa as shown in Figure 7. The calcite is at this pressure tilted along the white line with a maximum distance of 560nm. In order to bring the calcite surface parallel to the cover glass surface, P2 is increased to 20 kPa as shown in Figure 7. The average distance along the white line is then 57 nm and the average distance of the whole surface is 30 nm. As documented previously 21 the disjoining pressure between calcite and a glass surface at distance nm is Pa. The force transmitted from the membrane to the crystal is thus the pressure times the area of the crystal: 20 Pa370 m 7 nN.
This indicates that almost all of the applied fluid pressure is used to deform the PDMS membrane enough to achieve full contact between the calcite and the glass. The pressure change kPa caused an average displacement of the crystal of 280 nm, thus the differential pressure loss in deforming the membrane is Pa/nm. Further fluid pressure increase can displace the crystal at most 30 nm over which the pressure loss in deforming the membrane will be no more than about 90 Pa.
Since the PDMS membrane did not move the crystal upon the pressure change at =90 min, the transmitted pressure increased by kPa and the force transmitted from the membrane to the crystal is increased by 64 N. Since the contact area between the calcite and the glass at this time is only 14 m2 the contact pressure increases to about 5 MPa.
Almost the entire pressure change from 20 to 30 kPa will thus be transferred to the crystal. Multiplying the pressure change by area of the membrane that is closer to the crystal than to the channel walls, =10 kPa6400 m2=64 N.
7 Calcite - silica interactions
We combine recent experimental and molecular dynamics data for pressures and diffusion in confined calcite-calcite and calcite-silicate interfaces. We demonstrate how to combine data from experiment and simulation to calculate effective disjoining pressure and diffusion and thereby obtain predictions for deformation rate versus confining pressure.
Recently we have succeeded in measuring surface forces between calcite surfaces and between silica surfaces and calcite surfaces. The last 20 years has also allowed molecular simulation of calcite and silica surfaces with increased refinement and detail. It is not straight forward, however to compare molecular dynamics (MD) simulations, atomic force microscopy (AFM) and surface forces apparatus (SFA) measurements. The individual experiments and simulations are also not easily applied to real problems like colloidal aggregation, material strength, reactivity in confinement, etc.
The aim of this section is to combine experimental data, molecular simulation and theory and use interaction data from MD and AFM to construct calcite-calcite and calcite-silicate interaction potentials, forces or pressures for flat rough surfaces. In addition we estimate the effect of confinement on diffusion as function of stress and surface roughness.
7.1 Interaction energies, forces, pressure, roughness and geometry
The oscillatory and hydration-steric forces of atomically flat calcite and silica surfaces are as of yet only available from molecular simulation. We can use insights from and models based on measurement of mica-mica forces to extrapolate and add to the DLVO forces. In order to compare this to force measurements on calcite and silica surfaces we need to take the roughness of the surfaces into account.
The free energy of interaction, , between two solid surfaces separated by an electrolyte of thickness have many contributions. From a theoretical viewpoint one normally assumes that the interaction energy contributions from different parts of the solid surfaces and from different effects in the fluid are all additive. Then one can integrate over the shapes of the surfaces to obtain the force between the two solids, where is the free energy integrated over the surfaces. The force between two spheres of radius and is thus calculated to be 29
This is called the Derjaguin approximation and is practical to compute forces between two spheres (for example colloidal particles), a sphere and a flat (atomic force microscope (AFM) with a spherical tip on a flat surface) or two cylinders (as in the surface forces apparatus (SFA)). The same assumption of additivity may be used for any surface shape as long as the radii of curvature of the surfaces are much larger than the range of .
Treating rough surfaces statistically Parsons et al 30 recently proposed performing the corresponding integral over interaction energies using the height probability distributions of the two surfaces:
This integration is sufficient when the surface roughness, , is much smaller than the range of . When roughness is larger some points of the surfaces will contact and deform elastically or plastically. Parsons et al 30 proposed to treat the contacting asperities as Hertzian contacts with an effective asperity radius . Assuming to be Gaussian they can be combined into a single distribution with variance and the Hertzian contact contribution, , to the interaction between the surfaces is 30:
| (3) |
where is an effective Youngs modulus and is a geometrical function 30. Both the height probability distributions and the typical asperity radius may be estimated from AFM imaging of the surfaces. The total interaction energy, , is the sum of the contact and non-contact contributions.
The thermodynamically most useful measure of the surface interactions is the pressure , where is the macroscopic contact area of the surfaces.
7.2 Molecular simulation and theory
We have used the MD data of Brekke-Svaland and Bresme 26 that shows oscillatory steric/hydration forces between to flat calcite surfaces in water. We have fit their pressure to where is a periodic, exponentially decaying function similar to the suggestion by Israelachvili 29 chapter 15.5:
with the fitting parameters that are the pressure at contact, Pa, the smallest thickness of a molecular layer of water, nm, a coefficient of the variation of molecular layer thickness, and the ratio between the smallest molecular layer thickness and the decay length, . The pressure contribution from the DLVO theory for flat surfaces, was calculated using the parameters published by Diao and Espinosa-Marzal 28.
7.3 Disjoining pressure model for rough silica on flat calcite
In order to combine molecular dynamics, theory and experiment we have combined the model fit in the previous section with experimental parameters and data from Diao and Espinoza-Marzal 28. They reported that the roughness of the silica spheres was approximately 2 nm. To model this roughness we used a truncated normal distribution
where the normalizes as a probability distribution. The pressures for the rough system are then
The elastic contact contribution to the pressure is found by differentiating equation (3):
The experimental data of Diao and Espinosa-Marzal 28 for 0.51 mM CaCO3 solution that has been translated along the x-axis to coincide with the pressure model. The shift is justified because the AFM data has no intrinsic reference point of . In order to obtain a region of the model with a moderate slope corresponding to the data, the roughness and asperity radius were adjusted to nm and nm.
We have also included data from Li et al 21 of a crystal lying on a glass surface with roughness of about 0.2 nm. This data agrees perfectly with the roughness corrected pressure model presented here.
8 Diffusion
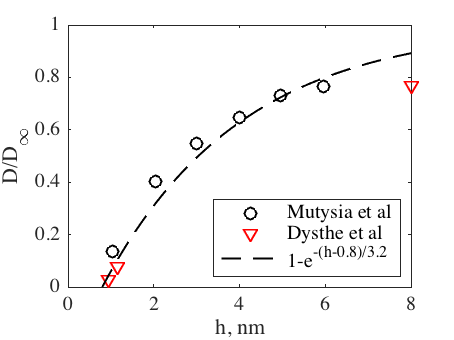
Self diffusion of water in a calcite slit pore has been calculated by Dysthe et al 27 and Mutysia et al 46. The interaction potential model used by Mutysia et al 46 is more evolved and adapted to a range of properties of calcite-water interfaces. A rough empirical fit to their data for water, , yields with =0.8 nm and =3.2 nm and is the bulk diffusion coefficient. Figure 9 shows that the diffusion reduced coefficients calculated by Dysthe et al 27 with the simplified interaction potential at strongly varying temperatures agree well with the data of Mutysia et al 46.
We are interested in the reactivity of a nanoconfined calcite interface and how it is limited by mass transport. The quantities of interest is then the interdiffusion coefficient of CaCO3 that depends on the self diffusion coefficients of the Ca2+ and CO ions. If we assume that the Stokes-Einstein relation , where is the viscosity and is the particle radius, is valid for both water and ions. That is, the water self diffusion measurements reflect the change in viscosity of the fluid layer and that the mobility of all ions are inversely proportional to this viscosity. Then the calcium carbonate diffusion coefficient, should also be .
Diffusion in silica slit pores has been studied by Collin et al 47 and they found that similarly to calcite water diffusion is reduced by an order of magnitude for slit pores of 1 nm corresponding to 3 water layers.
One important aspect of a rough surface meeting a flat surface is that it leaves room for diffusion. At a high pressure like 1 GPa diffusion is very slow between two smooth, flat surfaces. For the rough silica - flat calcite contact at similar pressures only a small part of the surface has a distance nm where diffusion is zero. Unless the reactive surface changes shape to conform with the rough surface, diffusion will continue and so will crystal growth.
9 Local contact formation modelled by Kinetic Monte Carlo
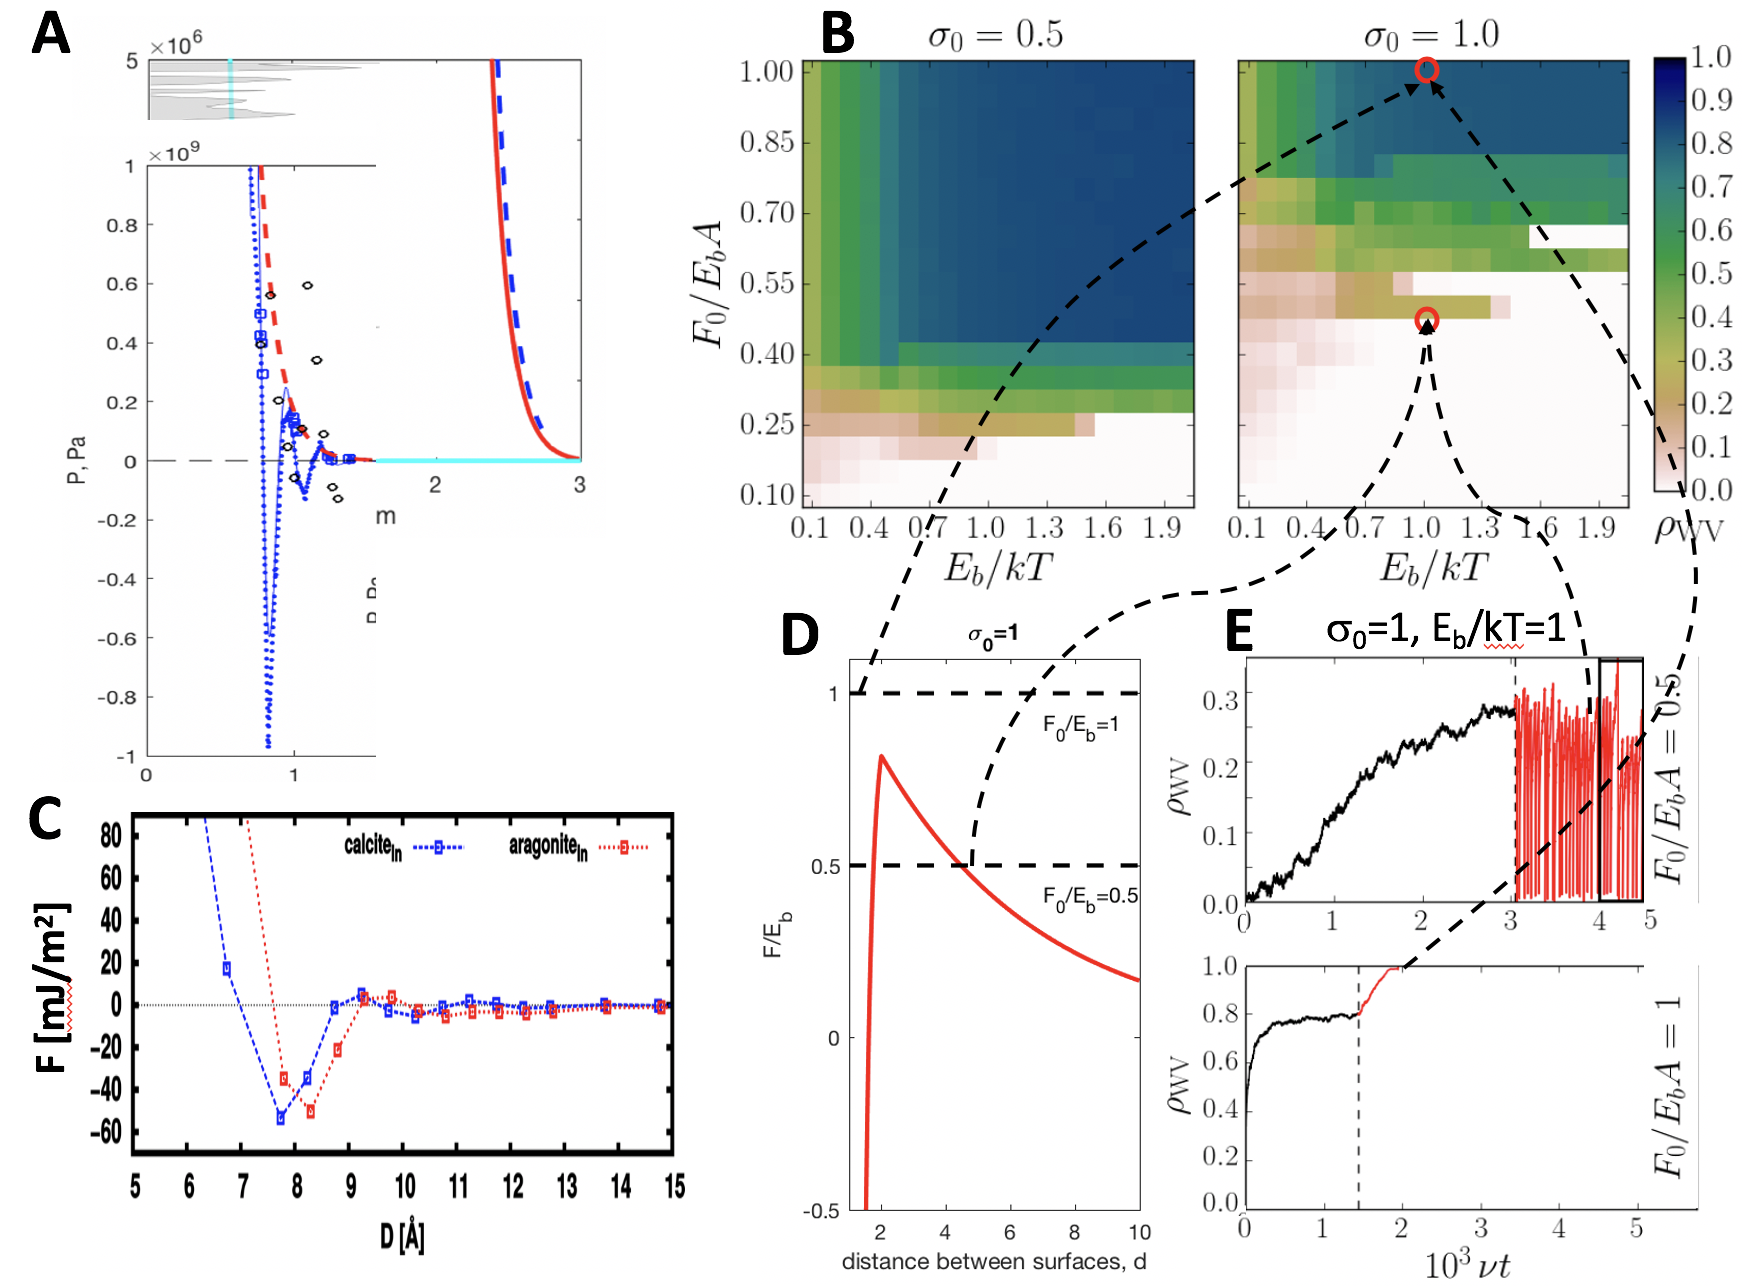
A recent study of contact formation using Kinetic Monte Carlo (KMC)33 gives some insight into how local dissolution and growth form adhesive contacts between a reactive and a non-reactive surface. The model uses an exponential surface-surface repulsive energy , where is the depth of the energy minimum binding the two solids, is the strength of the repulsive interaction, is the Debye length and is the position of minimum of the attractive potential . The KMC simulation of an atomically flat non-reactive confining surface and a reactive surface with a loading pressure can be compared to the experimental system in the following way:
There is a global loading force and a global disjoining force that balance as shown in the main text and in Figure 10A. In the experiments there are local asperities of the glass surface where fluctuations in the local height of the calcite may bring the two as close as 2 or 3 layers of water where there is attractive energy between the two surfaces (see Figure 10C). The depth of this energy minimum is mainly controlled by the ordering of the water layers between the surfaces. This is sensitive to the molecular structure of the surfaces and the relative positioning of the crystal lattices and for calcite-calcite =-20 to -60kJ/m2=-3.2 to -8.1J per lattice site, thus . If the crystals are ordered such that the water layer ordering is completely broken the main minimum will be direct solid-solid contact (no water left in the contact).
This global repulsion, and local attraction resembles the KMC model as shown in Figure 10D. At lower loads the system can end up in an oscillating regime where contacts are formed and broken like we observe in the initial low load part of the experiments. As the load is increased there is a transition to full contact developing between the two surfaces. In our system this contact state may correspond to a local surface-surface distance of either 2-3 molecular water layers or to zero distance, that is solid-solid contact.
10 SFA experiments
We observed an analogous process, in which the reactive calcite surface grows locally in confinement to increase the adhesive surface area with the opposing solid surface, in the Surface Forces Apparatus (SFA). We used one rough and reactive calcite surface against a smooth and inert muscovite mica surface (see Figure 11). The forces measured in the SFA allowed monitoring of the changing contact roughness and surface adhesion during the reactive surface growth.
The preparation of surfaces and details of the SFA experiments have been previously described in Dziadkowiec et al 35. We used polycrystalline calcite surfaces grown by atomic layer deposition (ALD). Despite using calcite-saturated solutions at all times, we observed recrystallization of calcite in contact with aqueous solutions, which was driven by the disequilibrium morphology of the ALD-deposited calcite crystals 37. The SFA measurements were performed in micron-scale confinement: the distance between the surfaces was at all times 1 m in the most confined region (surfaces were placed in a crossed-cylindrical geometry, yielding a spherical confined contact area with a diameter of 150 m).
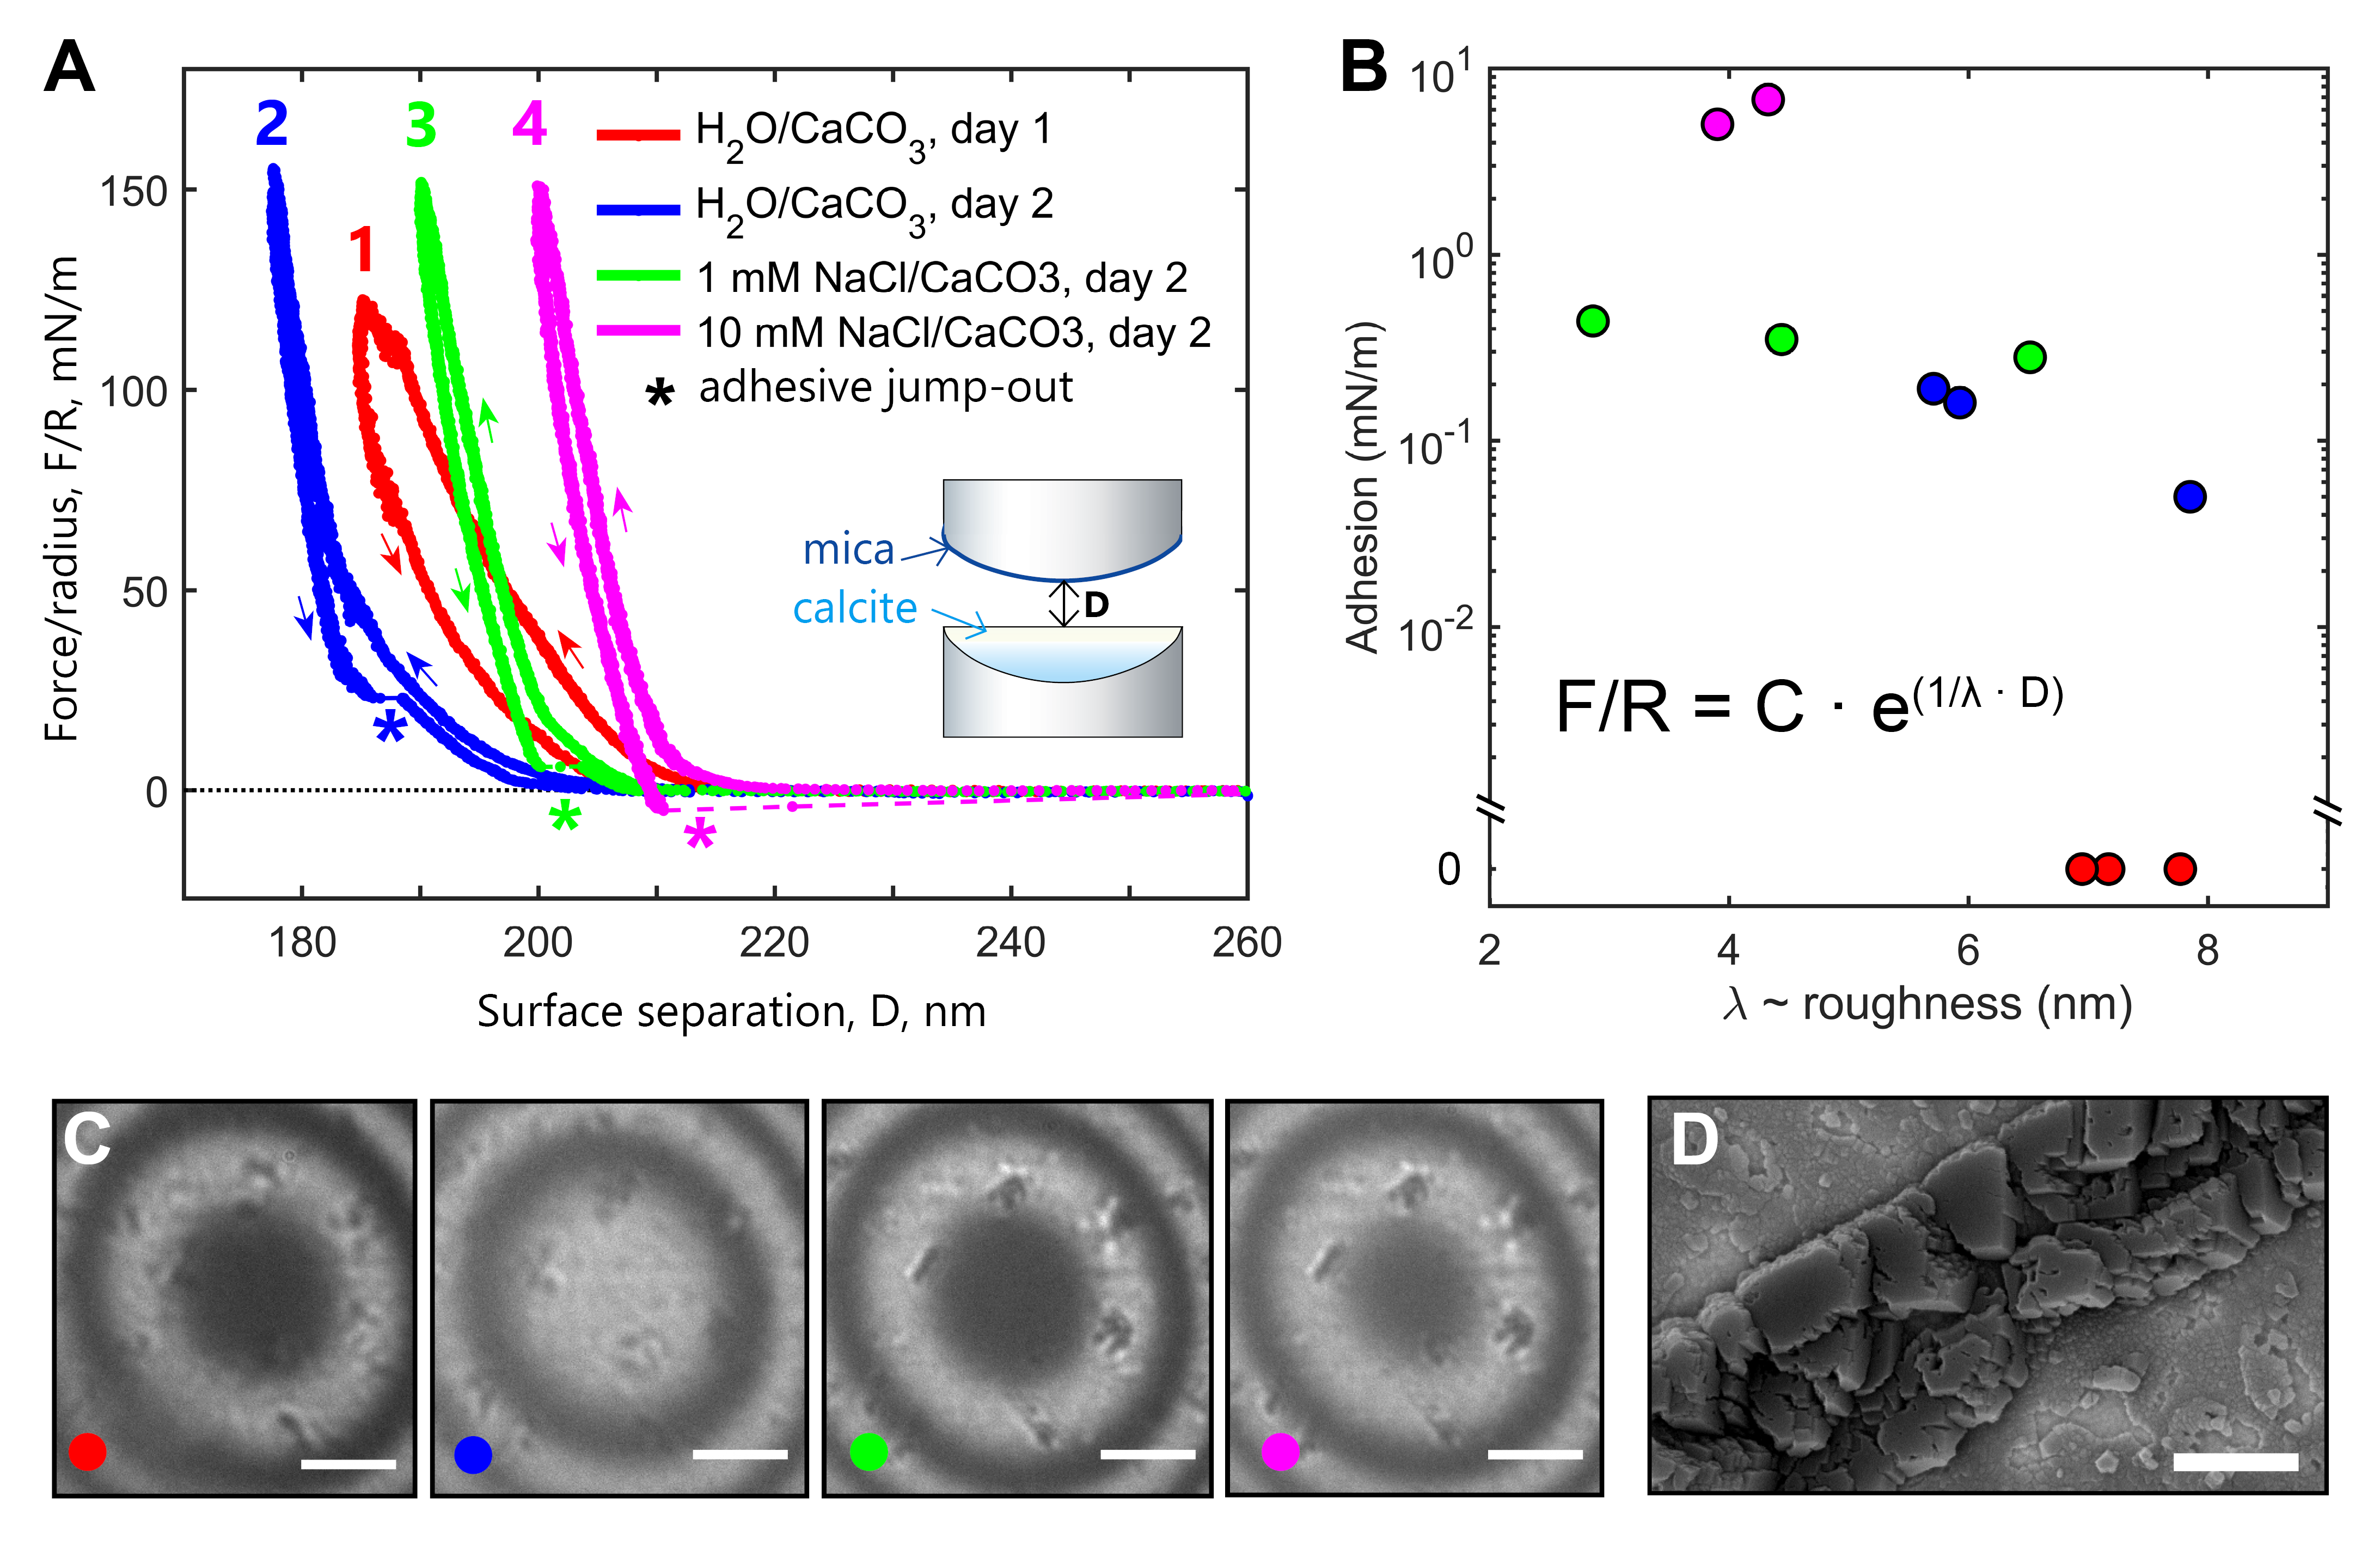
Figure 11A shows a sequence of force-distance curves measured between mica and calcite surfaces in the same contact region. After initial dissolution (solutions 1 to 2), we observed a progressive growth of calcite surfaces (reflected by the increasing minimum surface separation) associated with the decrease in the repulsive force components (indicated by the decreasing exponential decay length of the force curves; Figure 11B) and the increasing adhesion.
The forces measured in the SFA were dominated by the repulsive roughness contribution 30. Thus, the major changes in the repulsive decay length () of the force curves can be almost entirely attributed to the changing ’local’ roughness of the calcite surface asperities 37 and not to the slight variations in solution chemistry. According to Benz et al 48, the local contact roughness () is proportional to the exponential decay length () of the force (F)-distance (D) curves measured on approach according to: , where , and C is a fitting constant. Although, based on the optical in-situ images of the contact region (Figure 11C), we can directly observe that the overall roughness of the calcite surfaces was increasing (see dark large calcite asperities appearing with time), the local roughness of the calcite asperities in contact with mica decreased. This smoothing of the contacts led to the increase in an adhesive contact area, as evidenced by the decreasing and the increasing adhesion. The smooth faces on the recrystallized calcite asperities could be evidenced ex-situ with Scanning Electron Microscopy (SEM; Figure 11D). As such, calcite growing in the confined SFA geometry did not exert pressure on the opposing mica surface (which would be evidenced by the increase in repulsive force contribution during the force measurements). Instead, the calcite crystals grew locally to maximize the adhesive contact area with mica.
References
- Espinosa-Marzal and Scherer 2010 Espinosa-Marzal, R. M.; Scherer, G. W. Advances in understanding damage by salt crystallization. Accounts of chemical research 2010, 43, 897–905
- Flatt et al. 2014 Flatt, R. J.; Caruso, F.; Sanchez, A. M. A.; Scherer, G. W. Chemo-mechanics of salt damage in stone. Nature communications 2014, 5, 4823
- Gratier et al. 2012 Gratier, J. P.; Frery, E.; Deschamps, P.; Røyne, A.; Renard, F.; Dysthe, D.; Ellouz-Zimmerman, N.; Hamelin, B. How travertine veins grow from top to bottom and lift the rocks above them: The effect of crystallization force. Geology 2012, 40, 1015–1018
- Taber 1928 Taber, S. The growth of crystals under external pressure. American Journal of Science 1928, 41, 532
- Wiltschko and Morse 2001 Wiltschko, D. V.; Morse, J. W. Crystallization pressure versus ”crack seal” as the mechanism for banded veins. Geology 2001, 29, 79–82
- Røyne et al. 2008 Røyne, A.; Jamtveit, B.; Mathiesen, J.; Malthe-Sørenssen, A. Controls on rock weathering rates by reaction-induced hierarchical fracturing. Earth and Planetary Science Letters 2008, 275, 364–369
- Kelemen and Hirth 2012 Kelemen, P. B.; Hirth, G. Reaction-driven cracking during retrograde metamorphism: Olivine hydration and carbonation. Earth and Planetary Science Letters 2012, 345-348, 81–89
- Rodriguez-Navarro et al. 2000 Rodriguez-Navarro, C.; Doehne, E.; Sebastian, E. Influencing crystallization damage in porous materials through the use of surfactants: experimental results using sodium dodecyl sulfate and cetyldimethylbenzylammonium chloride. Langmuir 2000, 16, 947–954
- Desarnaud et al. 2016 Desarnaud, J.; Bonn, D.; Shahidzadeh, N. The Pressure induced by salt crystallization in confinement. Nature Publishing Group 2016, 6, 23–26
- Jia et al. 2019 Jia, M.; Liang, J.; He, L.; Zhao, X.; Simon, S. Hydrophobic and hydrophilic SiO2-based hybrids in the protection of sandstone for anti-salt damage. Journal of Cultural Heritage 2019, 40, 80–91
- Zheng et al. 2018 Zheng, X.; Cordonnier, B.; Zhu, W.; Renard, F.; Jamtveit, B. Effects of Confinement on Reaction-Induced Fracturing During Hydration of Periclase. Geochemistry, Geophysics, Geosystems 2018, 19, 2661–2672
- Becker and Day 1905 Becker, G. F.; Day, A. L. The linerar force of growing crystals. Proc. Washingt. Acad. Sci. 1905, 7, 283–288
- Becker and Day 1916 Becker, G. F.; Day, A. L. Note on the Linear Force of Growing Crystals. Source: The Journal of Geology 1916, 313–333
- Flatt et al. 2007 Flatt, R. J.; Steiger, M.; Scherer, G. W. A commented translation of the paper by C.W. Correns and W. Steinborn on crystallization pressure. Environmental Geology 2007, 52, 221–237
- Sekine et al. 2011 Sekine, K.; Okamoto, a.; Hayashi, K. In situ observation of the crystallization pressure induced by halite crystal growth in a microfluidic channel. American Mineralogist 2011, 96, 1012–1019
- Røyne and Dysthe 2012 Røyne, A.; Dysthe, D. K. Rim formation on crystal faces growing in confinement. Journal of Crystal Growth 2012, 346, 89–100
- Naillon et al. 2018 Naillon, A.; Joseph, P.; Prat, M. Ion Transport and Precipitation Kinetics as Key Aspects of Stress Generation on Pore Walls Induced by Salt Crystallization. Physical Review Letters 2018, 120, 034502
- Kohler et al. 2018 Kohler, F.; Gagliardi, L.; Pierre-Louis, O.; Dysthe, D. K. Cavity Formation in Confined Growing Crystals. Physical Review Letters 2018, 121, 96101
- Li et al. 2018 Li, L.; Sanchez, J. R.; Kohler, F.; Røyne, A.; Dysthe, D. K. Microfluidic Control of Nucleation and Growth of CaCO3. Crystal Growth and Design 2018, 18, 4528–4535
- Weyl 1959 Weyl, P. K. Pressure solution and the force of crystallization: a phenomenological theory. Journal of Geophysical Research 1959, 64, 2001–2025
- Li et al. 2017 Li, L.; Kohler, F.; Røyne, A.; Dysthe, D. Growth of Calcite in Confinement. Crystals 2017, 7, 361
- Teng et al. 2000 Teng, H. H.; Dove, P. M.; De Yoreo, J. J. Kinetics of calcite growth: Surface processes and relationships to macroscopic rate laws. Geochimica et Cosmochimica Acta 2000, 64, 2255–2266
- Charlton and Parkhurst 2011 Charlton, S. R.; Parkhurst, D. L. Modules based on the geochemical model PHREEQC for use in scripting and programming languages. Computers and Geosciences 2011, 37, 1653–1663
- Dysthe 2014 Dysthe, D. K. In Transport and Reactivity of Solutions in Confined Hydrosystems; Mercury, L., Tas, N., Zilberbrand, M., Eds.; Springer Science + Business Media: Dordrecht, 2014; Chapter 17, p 199
- 25 Supplemetary-Information, See the Supplementary Information. 2020
- Brekke-Svaland and Bresme 2018 Brekke-Svaland, G.; Bresme, F. Interactions between Hydrated Calcium Carbonate Surfaces at Nanoconfinement Conditions. Journal of Physical Chemistry C 2018, 122, 7321–7330
- Dysthe et al. 2002 Dysthe, D. K.; Renard, F.; Porcheron, F.; Rousseau, B. Fluid in mineral interfaces—molecular simulations of structure and diffusion. Geophysical Research Letters 2002, 29, 13–14
- Diao and Espinosa-Marzal 2016 Diao, Y.; Espinosa-Marzal, R. M. Molecular insight into the nanoconfined calcite–solution interface. Proceedings of the National Academy of Sciences 2016, 113, 12047–12052
- Israelachvili 2011 Israelachvili, J. N. Intermolecular and surface forces; Academic Press, 2011; p 674
- Parsons et al. 2014 Parsons, D. F.; Walsh, R. B.; Craig, V. S. Surface forces: Surface roughness in theory and experiment. Journal of Chemical Physics 2014, 140
- Freitas and Reed 2020 Freitas, R.; Reed, E. J. Uncovering the effects of interface-induced ordering of liquid on crystal growth using machine learning. Nature Communications 2020, 11, 1–10
- Cámara and Bresme 2004 Cámara, L. G.; Bresme, F. Liquids confined in wedge shaped pores: Nonuniform pressure induced by pore geometry. Journal of Chemical Physics 2004, 120, 11355–11358
- Høgberget et al. 2020 Høgberget, J.; Røyne, A.; Dysthe, D. K.; Jettestuen, E. Microscopic modeling of contact formation between confined surfaces in solution. arXiv:cond-mat 2020, 2006.02129, 1–16
- Røyne et al. 2015 Røyne, A.; Dalby, K. N.; Hassenkam, T. Repulsive hydration forces between calcite surfaces and their effect on the brittle strength of calcite-bearing rocks. Geophysical Research Letters 2015, 42, 4786–4794
- Dziadkowiec et al. 2018 Dziadkowiec, J.; Javadi, S.; Bratvold, J.; Nilsen, O.; Røyne, A. Surface Forces Apparatus Measurements of Interactions between Rough and Reactive Calcite Surfaces. Langmuir 2018, 34
- Javadi and Røyne 2018 Javadi, S.; Røyne, A. Adhesive forces between two cleaved calcite surfaces in NaCl solutions: The importance of ionic strength and normal loading. Journal of Colloid and Interface Science 2018, 532, 605–613
- Dziadkowiec et al. 2019 Dziadkowiec, J.; Zareeipolgardani, B.; Dysthe, D. K.; Røyne, A. Nucleation in confinement generates long-range repulsion between rough calcite surfaces. Scientific Reports 2019, 9, 1–15
- Brunsteiner and Price 2004 Brunsteiner, M.; Price, S. L. Surface structure of a complex inorganic crystal in aqueous solution from classical molecular simulation. Journal of Physical Chemistry B 2004, 108, 12537–12546
- Brunsteiner et al. 2005 Brunsteiner, M.; Jones, A. G.; Pratola, F.; Price, S. L.; Simons, S. J. Toward a molecular understanding of crystal agglomeration. 2005; https://pubs.acs.org/sharingguidelines
- Renard et al. 2012 Renard, F.; Beauprĉtre, S.; Voisin, C.; Zigone, D.; Candela, T.; Dysthe, D. K.; Gratier, J. P. Strength evolution of a reactive frictional interface is controlled by the dynamics of contacts and chemical effects. Earth and Planetary Science Letters 2012, 341-344, 20–34
- Anders et al. 2014 Anders, M. H.; Laubach, S. E.; Scholz, C. H. Microfractures: A review. Journal of Structural Geology 2014, 69, 377–394
- Rodríguez-Sánchez et al. 2020 Rodríguez-Sánchez, J.; Liberto, T.; Barentin, C.; Dysthe, D. Mechanisms of phase transformation and creating mechanical strength in a sustainable calcium carbonate cement. Preprints 2020,
- Niemeijer et al. 2008 Niemeijer, A.; Marone, C.; Elsworth, D. Healing of simulated fault gouges aided by pressure solution: Results from rock analogue experiments. Journal of Geophysical Research: Solid Earth 2008, 113, 1–15
- Høgberget et al. 2016 Høgberget, J.; Røyne, A.; Dysthe, D.; Jettestuen, E. Microscopic modeling of confined crystal growth and dissolution. Physical Review E 2016, 94
- Høgberget et al. 2020 Høgberget, J.; Dysthe, D. K.; Jettestuen, E. Direct Coupling of Free Diffusion Models to Microscopic Models of Confined Crystal Growth and Dissolution. arXiv:cond-mat 2020, 2006.01433, 1–13
- Mutisya et al. 2017 Mutisya, S. M.; Kirch, A.; De Almeida, J. M.; Sánchez, V. M.; Miranda, C. R. Molecular Dynamics Simulations of Water Confined in Calcite Slit Pores: An NMR Spin Relaxation and Hydrogen Bond Analysis. Journal of Physical Chemistry C 2017, 121, 6674–6684
- Collin et al. 2018 Collin, M.; Gin, S.; Dazas, B.; Mahadevan, T.; Du, J.; Bourg, I. C. Molecular Dynamics Simulations of Water Structure and Diffusion in a 1 nm Diameter Silica Nanopore as a Function of Surface Charge and Alkali Metal Counterion Identity. Journal of Physical Chemistry C 2018, 122, 17764–17776
- Benz et al. 2006 Benz, M.; Rosenberg, K. J.; Kramer, E. J.; Israelachvili, J. N. The deformation and adhesion of randomly rough and patterned surfaces. The Journal of Physical Chemistry B 2006, 110, 11884–11893